The Giant Flares of the Microquasar Cygnus X-3: X-Rays States and Jets


1
The Special Astrophysical Observatory of the Russian Academy of Sciences, Niznij Arkhyz 369167, Russia
2
Institute of Physics, Kazan Federal University, Kazan 420008, Russia
3
Harvard-Smithsonian Center for Astrophysics, 60 Garden Street, Cambridge, MA 02138, USA
*
Author to whom correspondence should be addressed.
†
These authors contributed equally to this work.
Galaxies 2017, 5(4), 86; https://doi.org/10.3390/galaxies5040086
Submission received: 18 September 2017
/
Revised: 20 November 2017
/
Accepted: 21 November 2017
/
Published: 27 November 2017
(This article belongs to the Special Issue Polarised Emission from Astrophysical Jets)
Abstract
:We report on two giant radio flares of the X-ray binary microquasar Cyg X-3, consisting of a Wolf–Rayet star and probably a black hole. The first flare occurred on 13 September 2016, 2000 days after a previous giant flare in February 2011, as the RATAN-600 radio telescope daily monitoring showed. After 200 days on 1 April 2017, we detected a second giant flare. Both flares are characterized by the increase of the fluxes by almost 2000-times (from 5–10 to 17,000 mJy at 4–11 GHz) during 2–7 days, indicating relativistic bulk motions from the central region of the accretion disk around a black hole. The flaring light curves and spectral evolution of the synchrotron radiation indicate the formation of two relativistic collimated jets from the binaries. Both flares occurred when the source went from hypersoft X-ray states to soft ones, i.e. hard fluxes (Swift/BAT 15–50 keV data) dropped to zero, the soft X-ray fluxes (MAXI 2–10 keV data) staying high, and then later, the binary came back to a hard state. Both similar giant flares indicated the unchanged mechanism of the jets’ formation in Cyg X-3, probably in conditions of strong stellar wind and powerful accretion onto a black hole.
1. Monitoring Program of Microquasars with the RATAN-600 Telescope
We have carried out the long-term monitoring by almost daily observations of bright microquasars with RATAN-600 radio telescope at 2.3, 4.7, 8.2, 11.2 and 21.7 GHz (and at 1.3 and 30 GHz for flares) during the last seven years (or more than 2000 days) [1,2,3]. The flux densities were measured simultaneously (exactly within 1–2 min) at all frequencies; thus, the daily radio spectra are available for the analysis of spectral indices. Usually, the errors of flux measurements are less than five percent for fluxes higher than 100 mJy and near 10% for the fainter fluxes.
The X-ray binary Cygnus X-3 is a well-known microquasar composed of a mass-donating Wolf–Rayet WN4-6 star [4] and probably a black hole that is orbited with a period of 4.8 h. The recent estimate of the kinematic distance is kpc [5]. The giant flares have been detected in the GBI two-frequency monitoring program, and [6] have detected that flares occur after the ‘quenched state’, when radio fluxes decrease to 10–30 mJy at 2–8 GHz. McCollough et al. [7] found that radio fluxes were anti-correlated with the hard (BATSE) X-ray fluxes during the hard state and switched to correlation in the flaring state.
During 2006-2009 Cyg X-3 showed similar dependencies between soft (RXTE ASM), hard (Swift/BAT) X-rays and radio emission ([1,6,8,9,10]). Gamma-ray emission was detected during the flaring states ([11,12]).
The giant flare ( Jy) in the end of March 2011 was detected at 2.3-30 GHz with RATAN-600. Then during almost 2000 days of the ’quiescent state’ of the Cyg X-3 we have found that the hard X-ray flux (Swift/BAT, 15-50 keV) and radio flux at 4-11 GHz were strongly anti-correlated (Spearman’s correlation coefficient , [13]). The nature of such a clear linear regression could be related to the formation of the compact radio jets, the brightness of which strongly depends on the accretion rate on to a black hole.
2. Results
On 13 September 2016 and 1 April 2017, we detected similar giant flares just after the return from the hypersoft X-ray state to the soft and then to the hard state. The first hypersoft state continued for nearly 20 days and the second one nearly 40 days [13]. The mini-flare and flare in 2016 were studied with European VLBI [14], while only the former was mapped. The flare in 2017 was mapped with EHT [15].
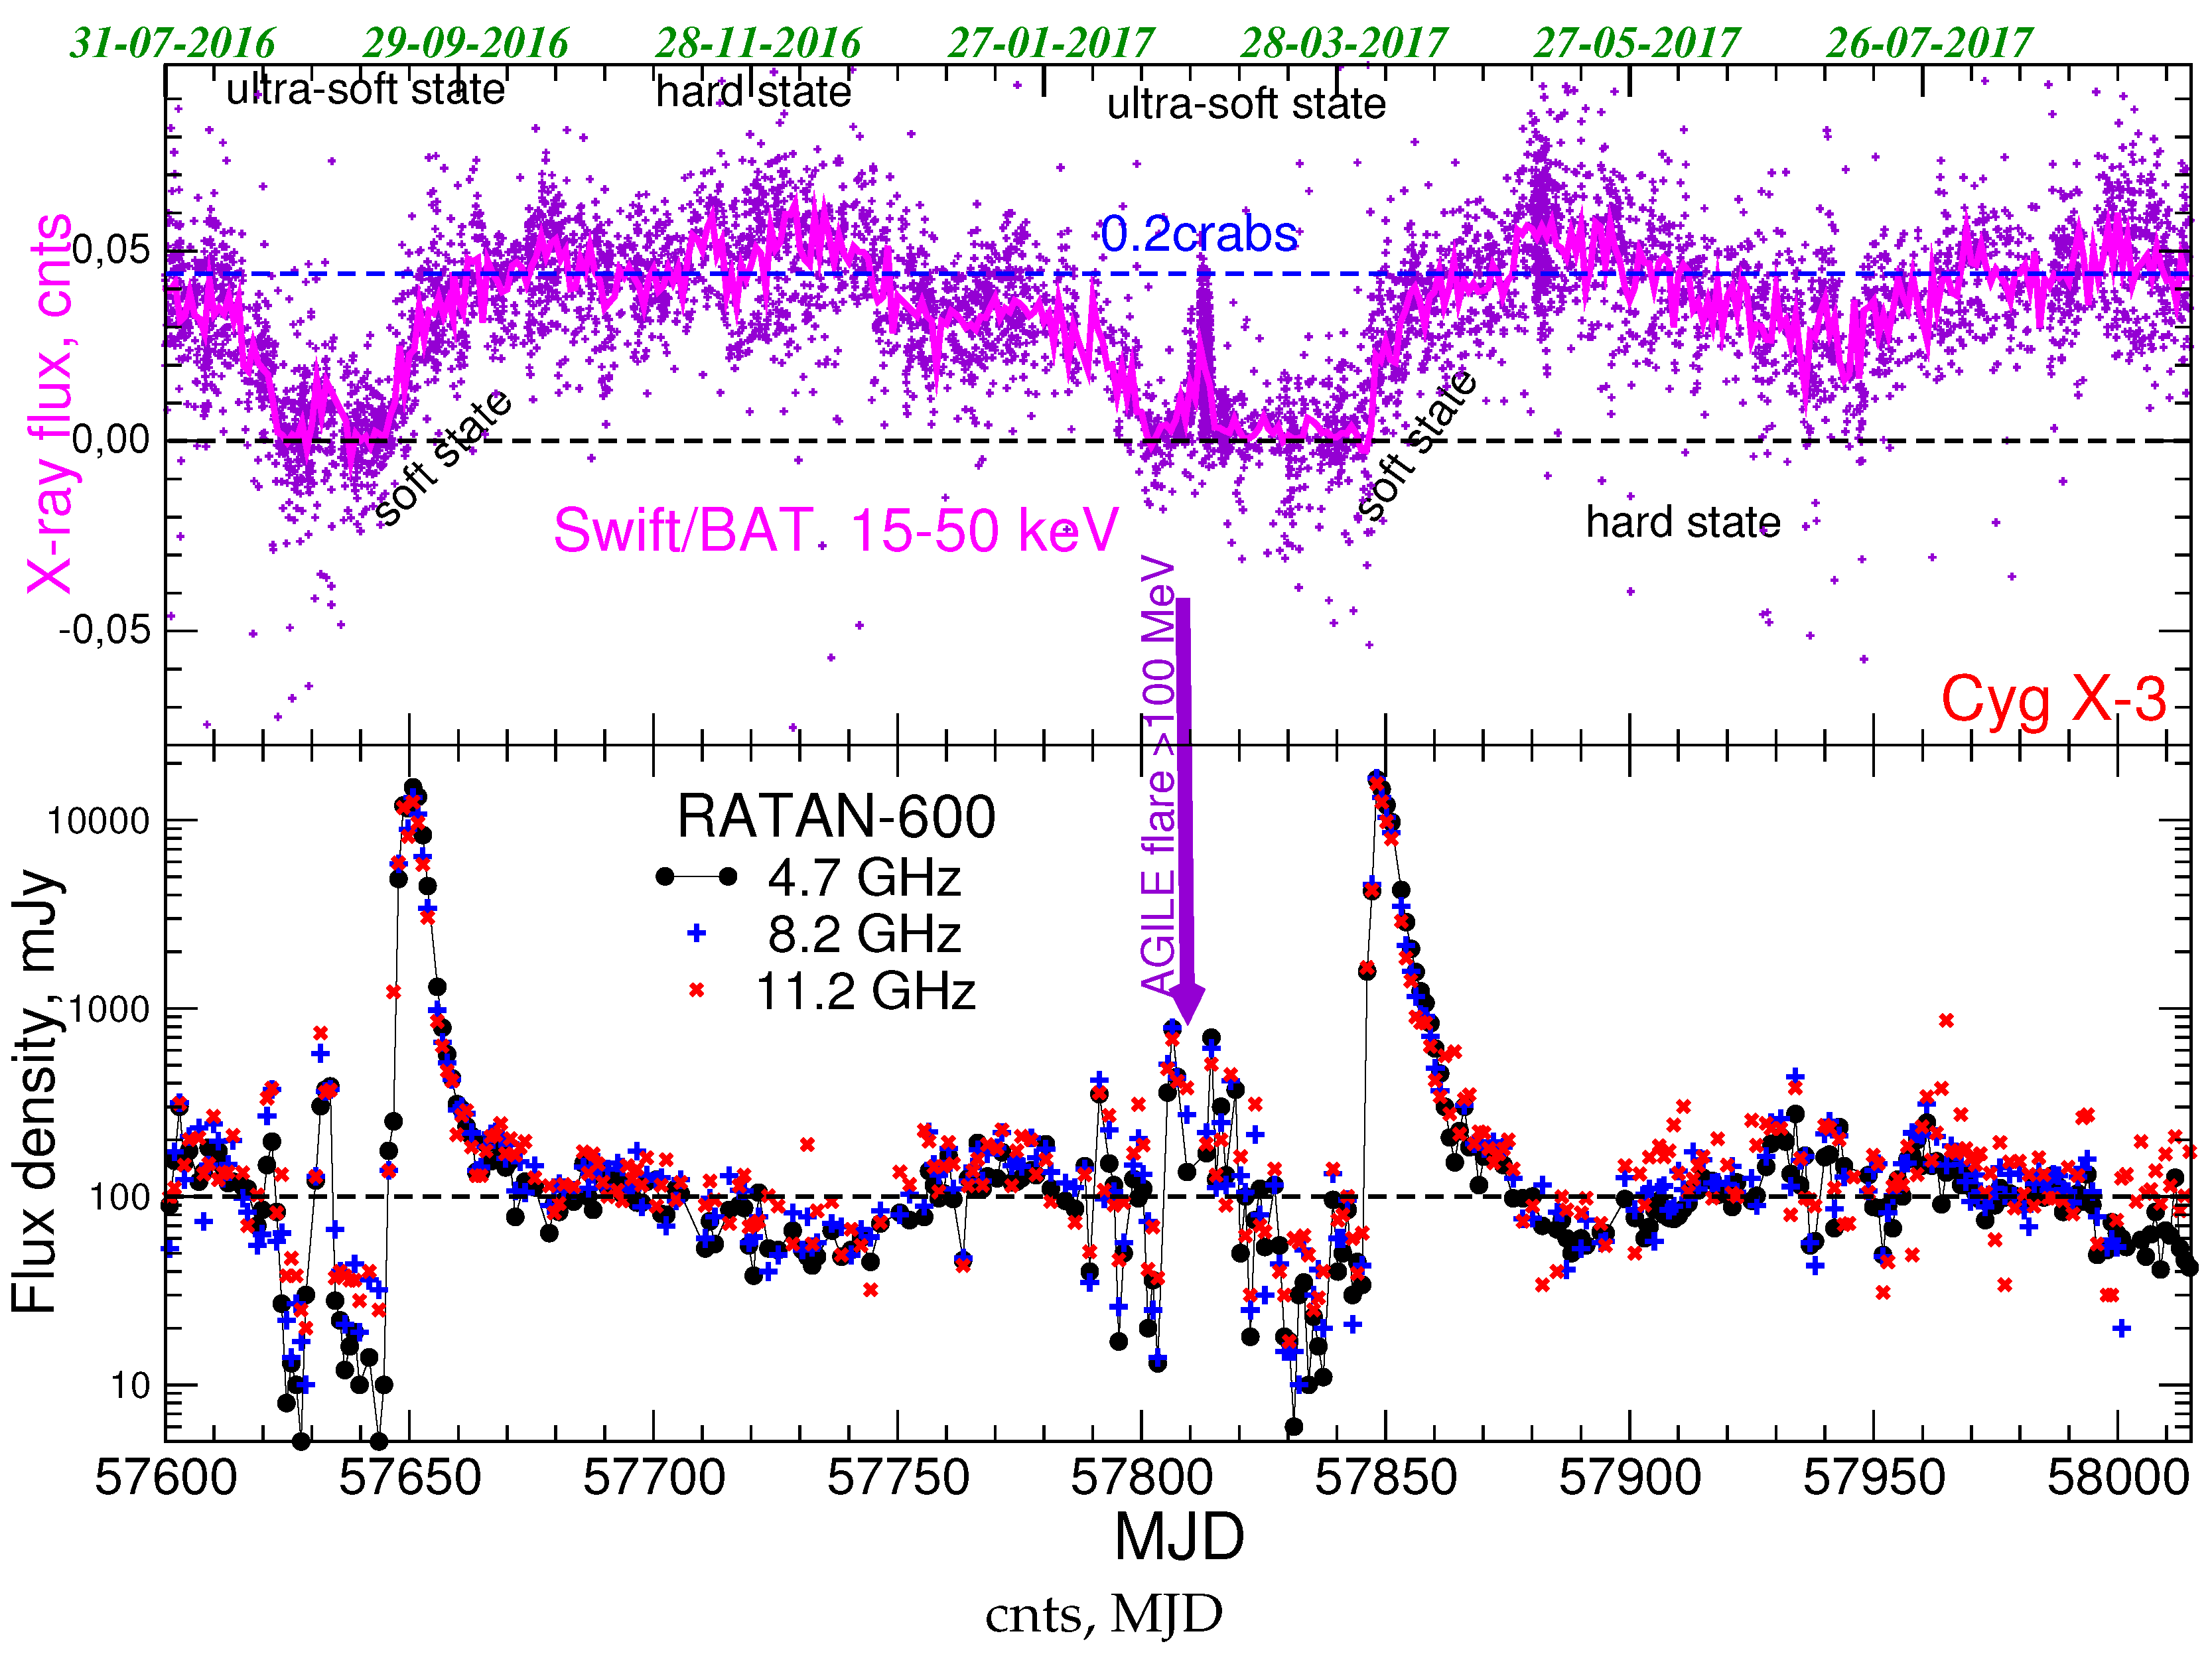
The analysis of the light curves of Cyg X-3, shown in Figure 1, indicated the following points:
- In both hard states before a flare, the radio spectra were slightly inverted with almost null spectral indices at 4–11 GHz ().
- During the hypersoft states, the radio spectral indices became strongly positive () at 4–11 GHz [15].
- During both ultra-soft states in 2016 and 2017, two mini-flares occurred before 10 and 20 days, respectively. () at 4–11 GHz. The AGILE gamma-ray flare event occurred only in the mini-flare of 2017 [16].
- The fast rise of both giant flares fit a power-law of time well with almost the same indices: at 4–22 GHz. During 1–3 days, the fluxes rose from ∼10–∼17,000 mJy.
- The decays of both giant flares fit an exponential law. However, for first giant flare, the rate of decay were almost the same at all frequencies, for the second flare, the characteristic times decreased with frequency (see below).
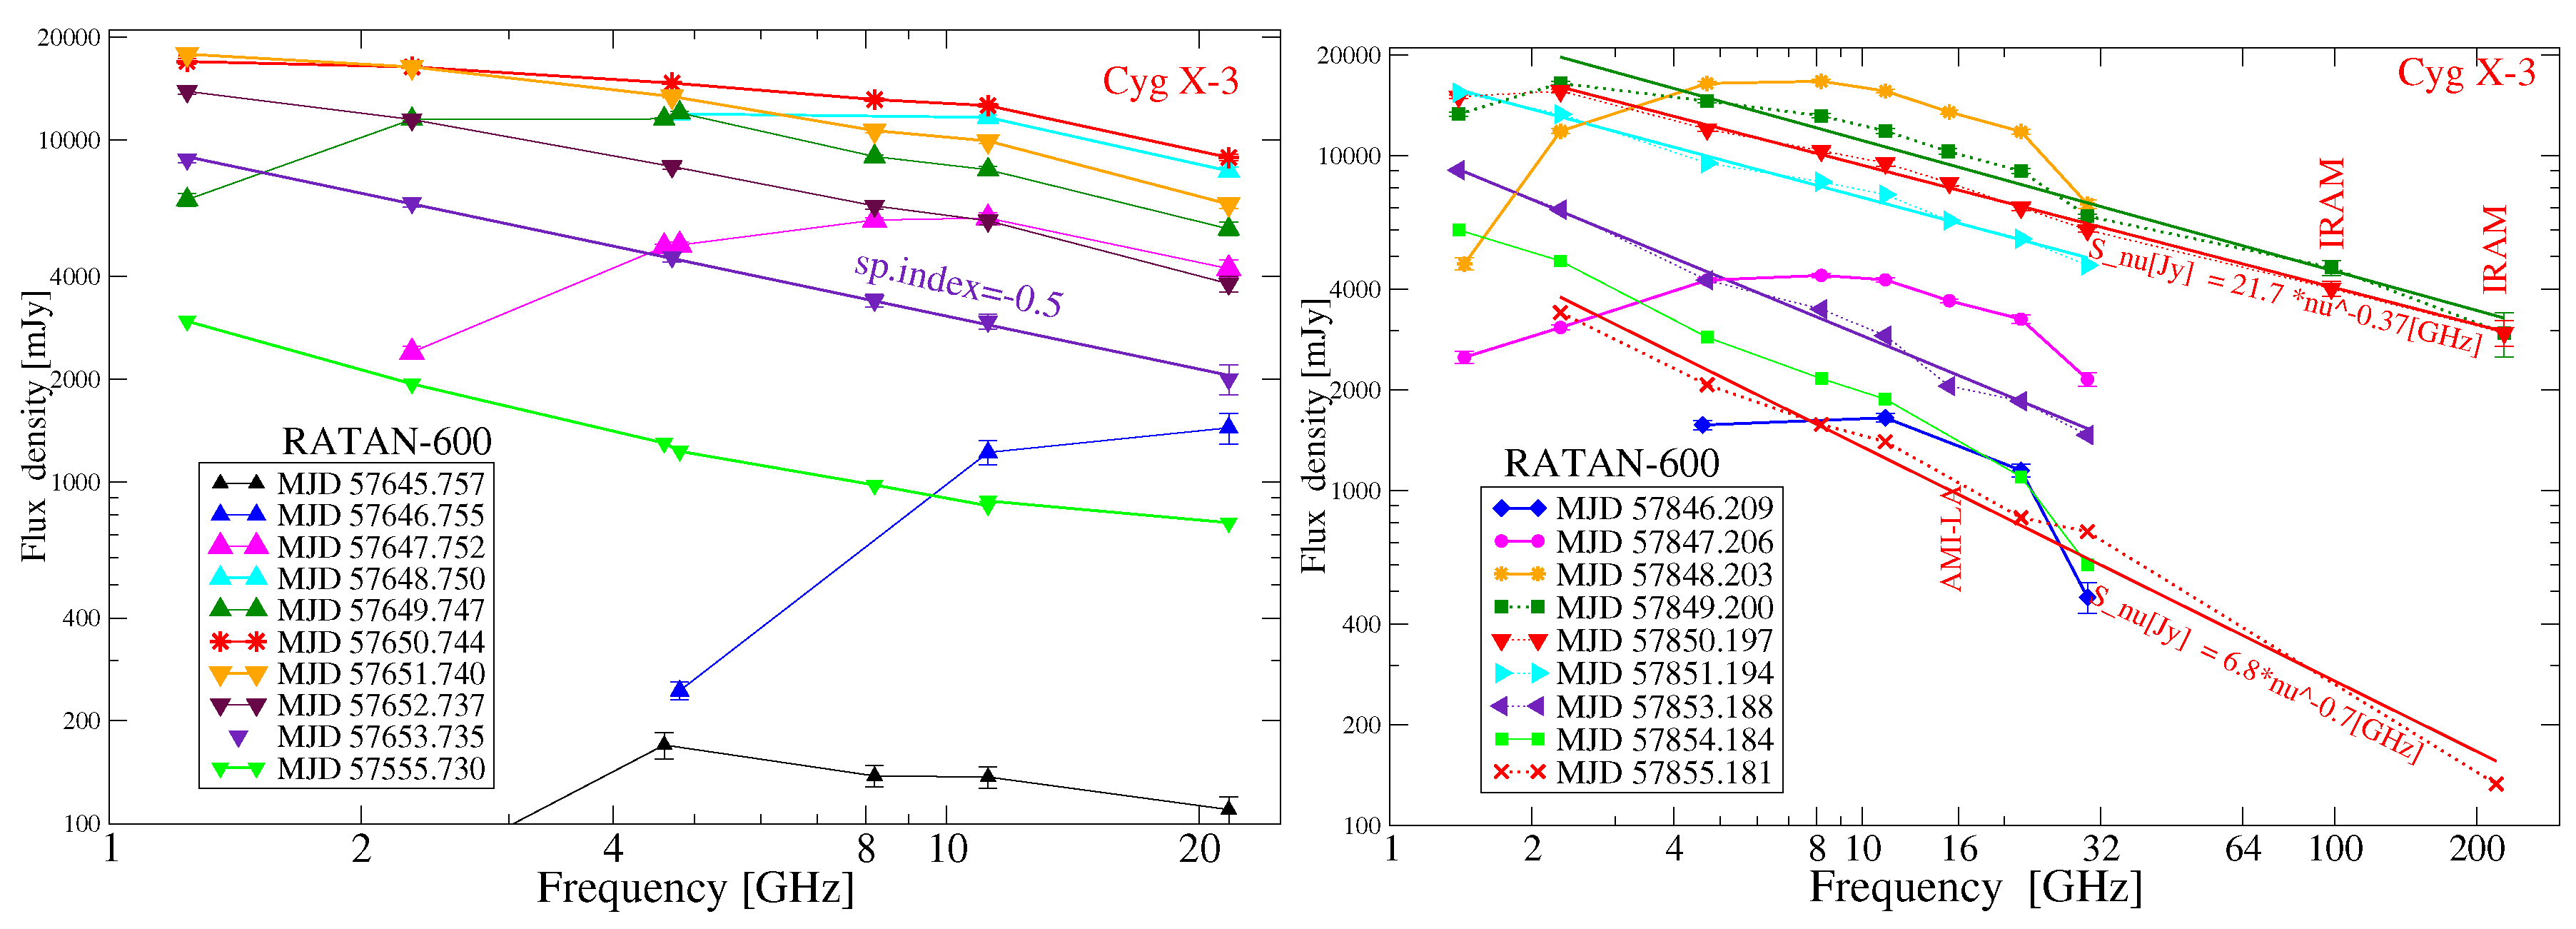
- During the first two days of increase of the fluxes, the spectra of both flares were characterized by an optically-thin power-law synchrotron emission at the higher frequencies and an optically-thick self-absorption synchrotron emission at the lower frequencies.
- The flaring spectra became steeper: for the flare of 2016, the spectral index changed from zero to in the first stage of evolution and then gradually came back to zero.
- The remarkable multi-frequency spectra created from our RATAN points and IRAM data at 98.5 and 228.7 GHz ([17]) on 6 and 7 April 2017 were well fit with a power law with the same spectral indices (Figure 2). Furthermore, we used the SMA measured flux point at 220 GHz ([18]) and found that the single power law spectrum on 13 April 2017 had a spectral index .
Thus, such behavior could be explained as a single blob in the jet, far enough from the core of the X-ray binary such that absorption was not important.
3. Discussion
The accretion disk-jet coupling in X-ray binaries has been discussed during the last 10–15 years, especially in the frame of the Hardness-Intensity Diagram (HID) studies [19]. Based on the first developed HID of the microquasar Cyg X-3, [20] have detected the ‘jet-line’ of the powerful ejections only after a so-called ‘hypersoft’ state, when hard X-ray fluxes fell down to the detection level; meanwhile, the soft X-ray emissions remained at a high level. The work in [2] successfully applied a computer routine to model the radio flaring activity (in July 2006) of Cyg X-3, based on the model created by [21], and found the following main parameters: magnetic field (∼0.05 Gs), thermal electron densities () cm and the bulk speed of jets (∼0.5 c). The spectral evolution of the giant flare is described by a single (during 3–4 days) ejection of the relativistic electrons, which moved with high velocity (∼0.5 c) away from the binary and expanded as a conical structure. During the first days, the ejection jets are probably optically thick due to synchrotron self-absorption or thermal electrons mixed with relativistic ones. It is interesting that just at the beginning of the new flare in September 2016, the MAXI soft X-ray (2–20 keV) fluxes decreased from 0.35 Crabs down to 0.1 Crabs returning Cyg X-3 to a hard state.
During these two periods of activity, we undertook multi-wavelength observation campaigns with observations in the radio (RATAN-600, AMI-LA , Metsahovi), sub-millimeter (SMA, EHT), X-ray (Swift/XRT, MAXI), hard X-ray (Swift/BAT, NuSTAR) and gamma-ray (AGILE, Fermi, VERITAS) spectra. At the peak of the major radio flare in April 2017, observations were made with VERITAS (TeV), NuSTAR (hard X-ray) and the Event Horizon Telescope (sub-millimeter). These measurements of the flares with different telescopes will be presented in [15]).
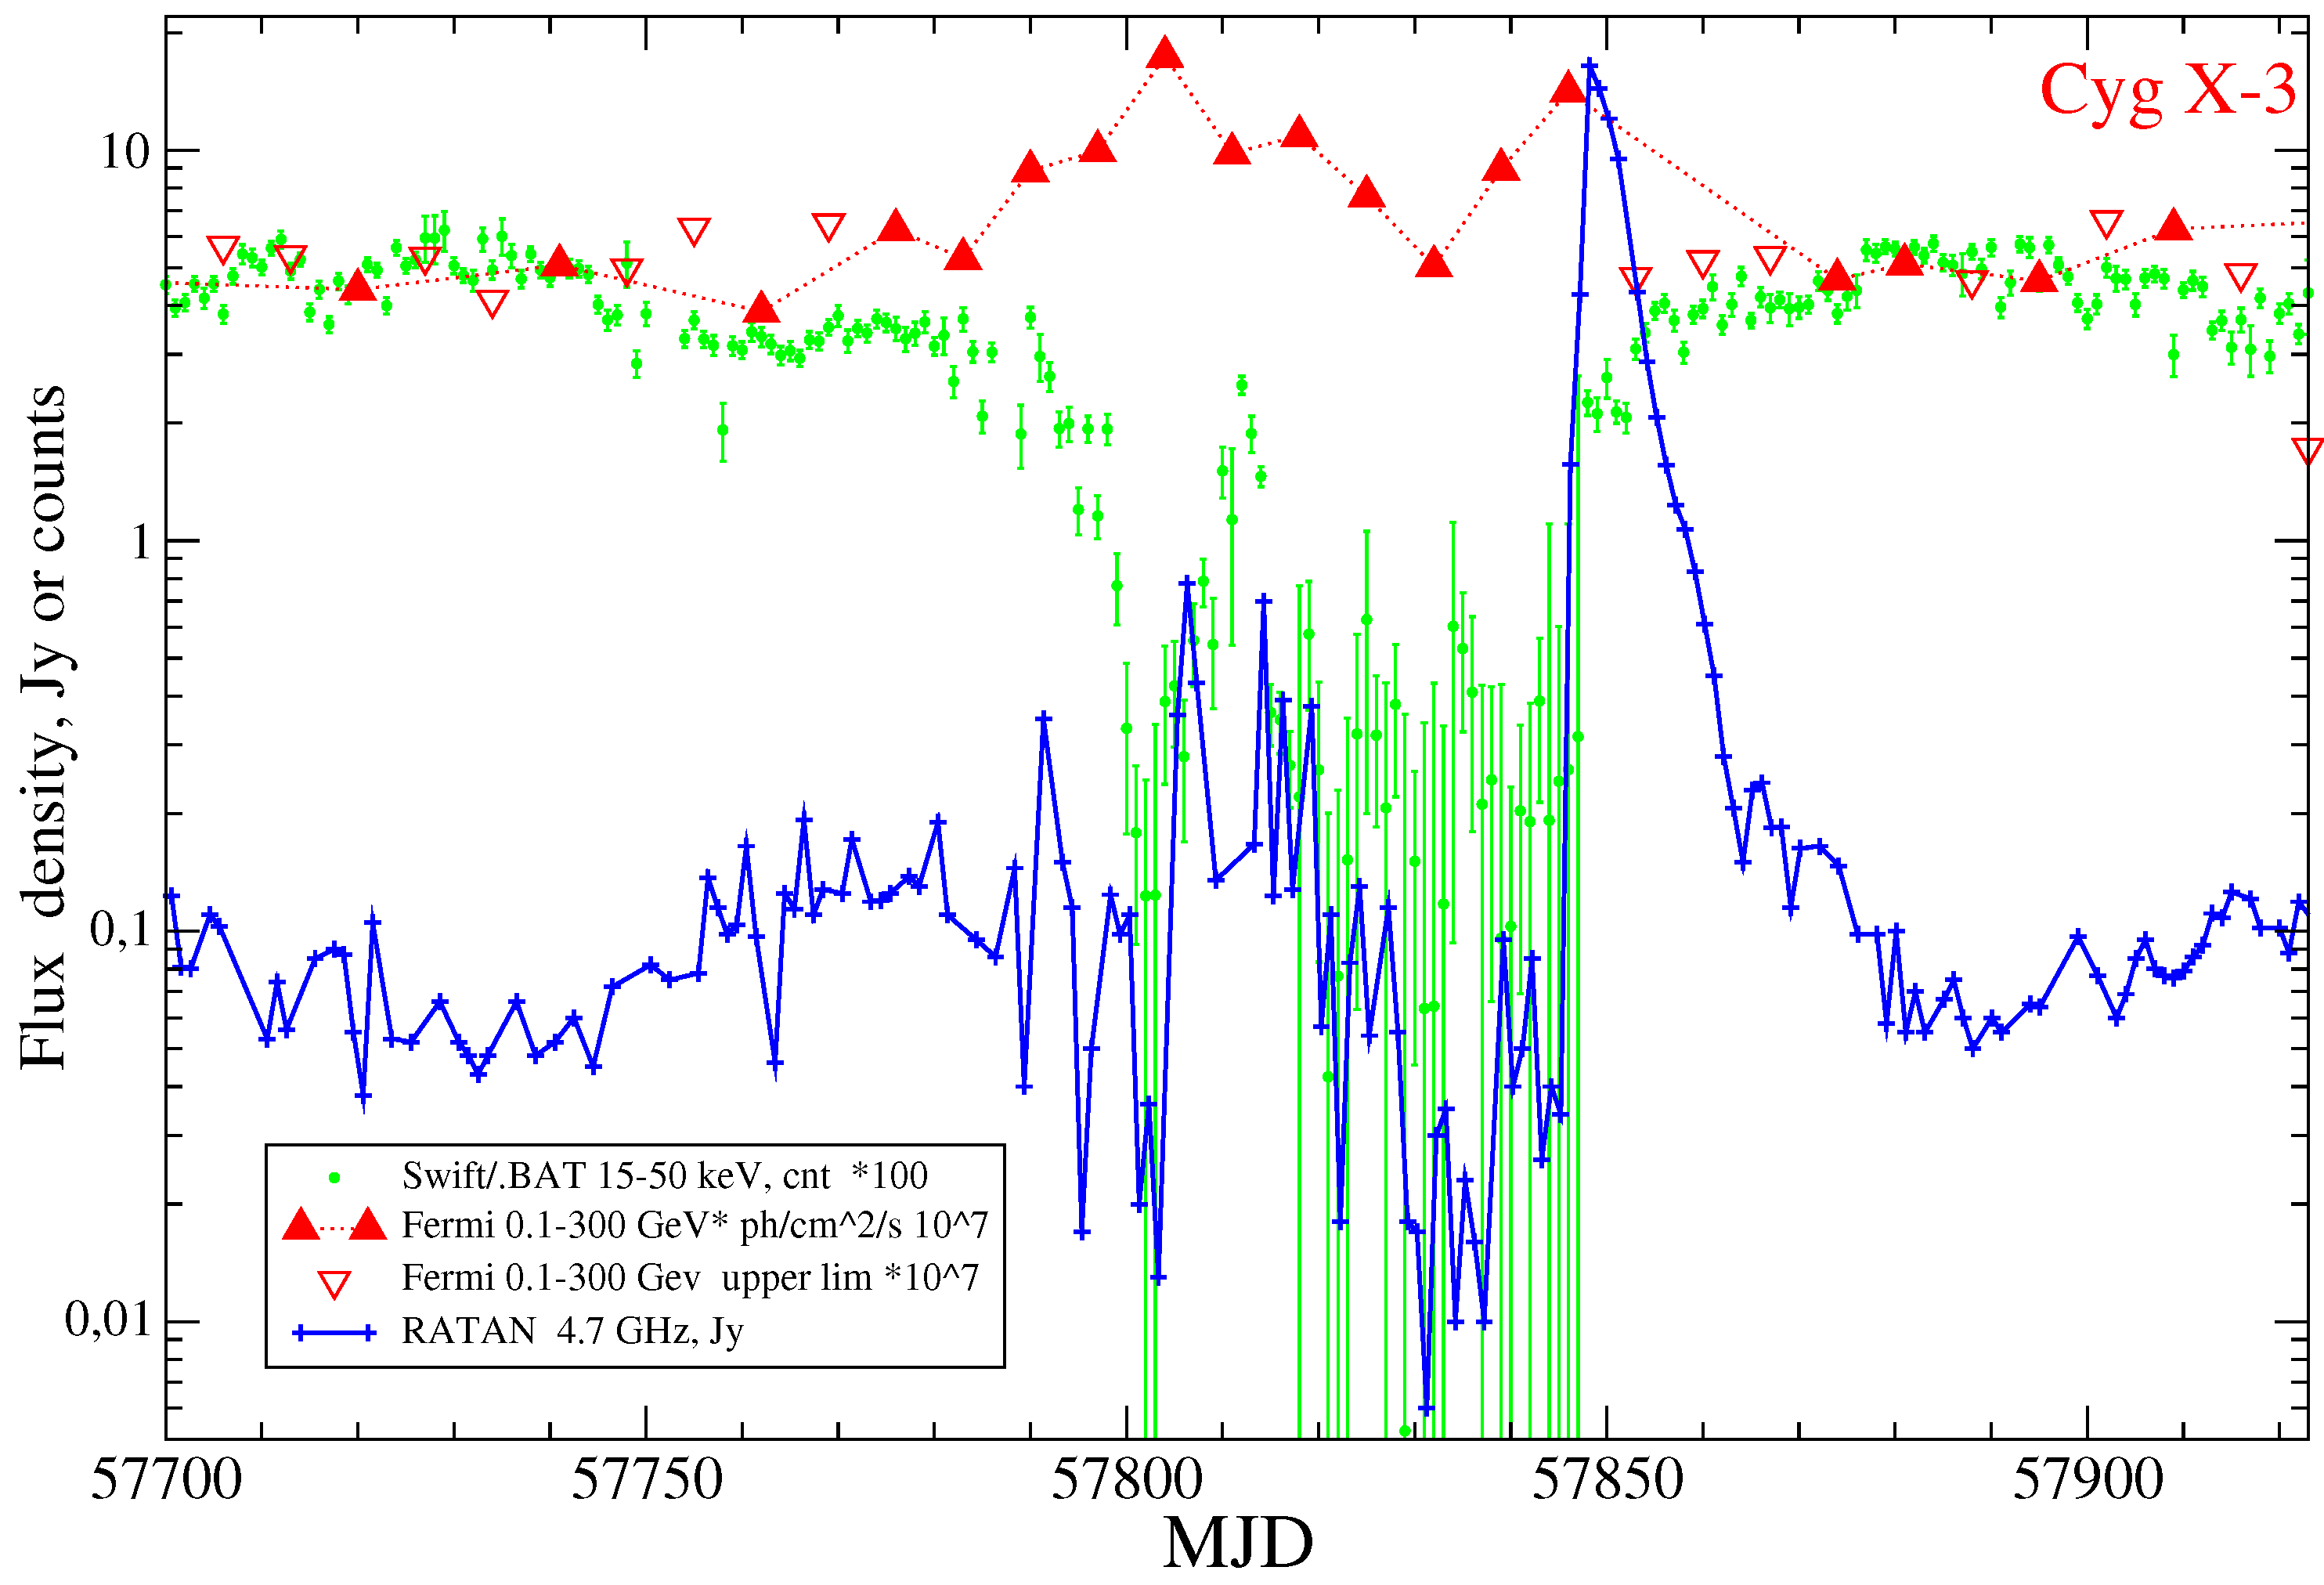
Here, we notice that the -ray activity began even before the entrance of Cyg X-3 into the hypersoft state. The maximal Fermi-LAT fluxes were reached during the mini-flare in March 2017 and then at the beginning of the giant flare in April 2017 [22]. The Fermi-LAT, Swift/BAT and RATAN 4.7-GHz light curves are shown in Figure 3.
We have plotted the light curves of both flares to follow the characteristics of their decays over time. We have fit the decreases of fluxes at different frequencies by the exponential law: , where is the time of the maximal flux . The flare in 2016 decayed with almost the same = 1.7–2 days, but the decay of the flare in 2017 varied with respect to the frequency, and the characteristic times changed almost linearly from days at 2.3 GHz to days at 21.7 GHz.
The decay usually fits a power-law of time. Indeed, such a law is more natural for the evolution of the synchrotron blobs in jets. The synchrotron emission evolutions of two relativistic jets are determined by their conical geometry and an adiabatic expansion of the blobs, which are composed of relativistic electrons embedded in magnetic fields, moving away from the core hollow jets [21,23].
The giant flares in September 2001 and March 2011 decayed as the power-law with amazingly similar indices ∼−4.
Generally, some of the latest giant flares (2001, 2010, 2011, 2016 and 2017) were amazingly similar with respect to their main parameters: the maximal fluxes, the spectral indices of optically-thin regime ( — ), the rates and e-folding times (1.5–3.5 d). The flares in september 2001 and 2016 had two highs (Figure 4). Often, the increases of the flares followed a power-law with index ∼+4.
Acknowledgments
S.A.T. acknowledges support through the Russian Government Program of Competitive Growth of Kazan Federal University.
Author Contributions
The text was prepared by S.T.; discussions of results between S.T. and M.M. were the base of the paper; M.M. contributed in usage data from SMA and Swift/BAT; the primary and final data reductions were made by P.T. and S.T.; the radiometric complex of RATAN-600 was calibrated and adjusted by N.N.
Conflicts of Interest
The authors declare no conflict of interest.
Abbreviations
The following abbreviations are used in this manuscript:
| BATSE | Burst and Transient Source Experiment aboard Compton Gamma Ray Observatory |
| GBI | Green Bank Interferometer, NRAO, USA |
| LAT | Large Area Telescope on-board Fermi observatory, NASA, USA |
| MAXI | The Monitor of All-sky X-ray Image aboard the International Space Station |
| NuStar | Nuclear Spectroscopic Telescope Array |
| RATAN-600 | Radio Astronomical Telescope Academy of Science SAO RAS |
| RXTE ASM | Rossi X-ray Timing Explorer All Sky monitor |
| SAO RAS | Special Astrophysical observatory RAS |
| SMA | Submillimeter Array, Smithsonian Institution and the Academia Sinica |
| Swift/BAT | Burst Alert Telescope aboard Swift observatory, NASA, USA |
References
- Trushkin, S.A. Radio emission of galactic X-ray binaries with relativistic jets. Astron. Astrophys. Trans. 2000, 19, 525–535. [Google Scholar] [CrossRef]
- Trushkin, S.; Bursov, N.N.; Nizhelskij, N.A.; Majorova, E.K.; Voitsik, P.A. What do we understand from multi-frequency monitoring of microquasars? In Proceedings of the VI Microquasar Workshop: Microquasars and Beyond, Como, Italy, 18–22 September 2006. [Google Scholar]
- Trushkin, S.A.; Nizhelskij, N.A.; Bursov, N.N. Multi-Frequency Radio Photometry of the Microquasars with the RATAN-600 Radio Telescope. In Proceedings of the Twelfth Marcel Grossmann Meeting on General Relativity, Paris, France, 12–18 July 2009. [Google Scholar] [CrossRef]
- Koljonen, K.I.I.; Maccarone, T.J. Gemini/GNIRS infrared spectroscopy of the Wolf-Rayet stellar wind in Cygnus X-3. Mon. Non. R. Astron. Soc. 2017, 472, 2181–2195. [Google Scholar] [CrossRef]
- McCollough, M.L.; Robinson, C.R.; Zhang, S.N.; Harmon, B.A.; Hjellming, R.M.; Waltman, E.B.; Foster, R.S.; Ghigo, F.D.; Briggs, M.S.; Pendleton, G.N.; et al. Discovery of Correlated Behavior between the Hard X-Ray and the Radio Bands in Cygnus X-3. Astrophys. J. 1999, 517, 951–955. [Google Scholar] [CrossRef]
- Waltman, E.B.; Fiedler, R.L.; Johnston, K.L.; Ghigo, F.D. The quiescent level of Cygnus X-3 at 2.25 and 8.3 GHz: 1988-1992. Astron. J. 1994, 108, 179–183. [Google Scholar] [CrossRef]
- McCollough, M.L.; Corrales, L.; Dunham, M.M. Cygnus X-3: Its Little Friend’s Counterpart, the Distance to Cygnus X-3, and Outflows/Jets. Astrophys. J. Lett. 2016, 830, L36. [Google Scholar] [CrossRef]
- Williams, P.K.G.; Tomsick, J.A.; Bodaghee, A.; Bower, G.C.; Pooley, G.G.; Pottschmidt, K.; Rodriguez, J.; Wilms, J.; Migliari, S.; Trushkin, S.A. The 2010 May Flaring Episode of Cygnus X-3 in Radio, X-rays, and γ-rays. Astrophys. J. Lett. 2011, 733, L20. [Google Scholar] [CrossRef]
- Corbel, S.; Dubus, G.; Tomsick, J.A.; Szostek, A.; Corbet, R.H.D.; Miller-Jones, J.C.A.; Richards, J.L.; Pooley, G.; Trushkin, S.; Dubois, R.; et al. A giant radio flare from Cygnus X-3 with associated γ-ray emission. Mon. Non. R. Astron. Soc. 2012, 421, 2947–2955. [Google Scholar] [CrossRef]
- Zdziarski, A.A.; Segreto, A.; Pooley, G.G. The radio/X-ray correlation in Cyg X-3 and the nature of its hard spectral state. Mon. Non. R. Astron. Soc. 2016, 456, 775–789. [Google Scholar] [CrossRef]
- Tavani, M.; Bulgarelli, A.; Piano, G.; Sabatini, S.; Striani, E.; Evangelista, Y.; Trois, A.; Pooley, G.; Trushkin, S.; Nizhelskij, N.A.; et al. Extreme particle acceleration in the microquasar Cygnus X-3. Nature 2009, 462, 620–623. [Google Scholar] [CrossRef] [PubMed]
- Piano, G.; Tavani, M.; Vittorini, V.; Trois, A.; Giuliani, A.; Bulgarelli, A.; Evangelista, Y.; Coppi, P.; Del Monte, E.; Sabatini, S.; et al. The AGILE monitoring of Cygnus X-3: Transient gamma-ray emission and spectral constraints. Astron. Astrophys. 2012, 545, A110. [Google Scholar] [CrossRef]
- Trushkin, S.A.; Nizhelskij, N.A.; Tsybulev, P.G.; Zhekanis, G.V. Giant Radio Flare of Cygnus X-3 in September 2016. In Proceedings of the International Conference “Stars: From Collapse to Collapse”, Nizhny Arkhyz, Russia, 3–7 October 2016; pp. 492–494. [Google Scholar]
- Egron, E.; Pellizzoni, A.; Giroletti, M.; Righini, S.; Stagni, M.; Orlati, A.; Migoni, C.; Melis, A.; Concu, R.; Barbas, L.; et al. Single-dish and VLBI observations of Cygnus X-3 during the 2016 giant flare episode. Mon. Non. R. Astron. Soc. 2017, 471, 2703–2714. [Google Scholar] [CrossRef]
- Koljonen, K.I.I.; Maccarone, T.; McCollough, M.L.; Gurwell, M.; Trushkin, S.; Pooley, G. The hypersoft state of Cygnus X-3. A key to jet quenching in X-ray binaries? Astron. Astrophys. 2017. submitted. [Google Scholar]
- Piano, G.; Tavani, M.; Verrecchia, F.; Vercellone, S.; Munar-Adrover, P.; Bulgarelli, A.; Donnarumma, I.; Minervini, G.; Fioretti, V.; Pittori, C.; et al. Enhanced Gamma-Ray Emission from the Microquasar Cygnus X-3 Detected by AGILE. The Astronomer’s Telegram, 17 March 2017. [Google Scholar]
- Krichbaum, T. IRAM 30m telescope flux measurement of Cyg X-3 during a major outburst. The Astronomer’s Telegram, 12 April 2017. [Google Scholar]
- Mukherjee, R.; McCollough, M.L.; Gurwell, M.A.; Petitpas, G.; Trushkin, S.A.; Pooley, G.; Koljonen, K.I.I. VERITAS observations of Cygnus X-3 during a major radio flare. The Astronomer’s Telegram, 8 April 2017. [Google Scholar]
- Fender, R.P.; Belloni, T.M.; Gallo, E. Towards a unified model for black hole X-ray binary jets. Mon. Non. R. Astron. Soc. 2004, 355, 1105–1110. [Google Scholar] [CrossRef]
- Koljonen, K.I.I.; Hannikainen, D.C.; McCollough, M.L.; Pooley, G.G.; Trushkin, S.A. The hardness-intensity diagram of Cygnus X-3: Revisiting the radio/X-ray states. Mon. Non. R. Astron. Soc. 2010, 406, 307–310. [Google Scholar] [CrossRef]
- Marti, J.; Paredes, J.M.; Estalella, R. Modelling Cygnus X-3 radio outbursts—Particle injection into twin jets. Astron. Astrophys. 1992, 258, 309–315. [Google Scholar]
- Loh, A.; Corbel, S. Enhanced high-energy gamma-ray emission from the microquasar Cygnus X-3 detected by Fermi/LAT. The Astronomer’s Telegram, 22 February 2017. [Google Scholar]
- Lindfors, E.J.; Turler, M.; Hannikainen, D.C.; Pooley, G.; Tammi, J.; Trushkin, S.A.; Valtaoja, E. Synchrotron flaring behavior of Cygnus X-3 during the February–March 1994 and September 2001 outbursts. Astron. Astrophys. 2007, 473, 923–929. [Google Scholar] [CrossRef]
Figure 1.
The light curves at 4–11 GHz with RATAN-600 (bottom) and at 15–50 keV with Swift/BAT (top) of Cyg X-3 during 2016–2017. The characteristic X-ray states are marked on the top plot. The detected AGILE flare (>100 MeV) preceded the giant flare on 1 April 2017.
Figure 1.
The light curves at 4–11 GHz with RATAN-600 (bottom) and at 15–50 keV with Swift/BAT (top) of Cyg X-3 during 2016–2017. The characteristic X-ray states are marked on the top plot. The detected AGILE flare (>100 MeV) preceded the giant flare on 1 April 2017.

Figure 2.
The radio spectra of the first flare (left) in September 2016 and the second one in April 2017 (right). There are clear transitions from the optically-thick mode to the optically-thin one in both flares.
Figure 2.
The radio spectra of the first flare (left) in September 2016 and the second one in April 2017 (right). There are clear transitions from the optically-thick mode to the optically-thin one in both flares.

Figure 3.
The light curves during the flare in April 2017 with data from Swift/BAT (15–50 keV) and the Fermi Gamma-ray Space Telescope, LAT (0.1–300 GeV).
Figure 3.
The light curves during the flare in April 2017 with data from Swift/BAT (15–50 keV) and the Fermi Gamma-ray Space Telescope, LAT (0.1–300 GeV).

Figure 4.
Evolution of the first giant flare (left), counted from its start on 13 September 2016, and the second one (right), counted from its start on 1 April 2017.
Figure 4.
Evolution of the first giant flare (left), counted from its start on 13 September 2016, and the second one (right), counted from its start on 1 April 2017.

© 2017 by the authors. Licensee MDPI, Basel, Switzerland. This article is an open access article distributed under the terms and conditions of the Creative Commons Attribution (CC BY) license (http://creativecommons.org/licenses/by/4.0/).
Share and Cite
MDPI and ACS Style
Trushkin, S.; McCollough, M.; Nizhelskij, N.; Tsybulev, P. The Giant Flares of the Microquasar Cygnus X-3: X-Rays States and Jets. Galaxies 2017, 5, 86. https://doi.org/10.3390/galaxies5040086
AMA Style
Trushkin S, McCollough M, Nizhelskij N, Tsybulev P. The Giant Flares of the Microquasar Cygnus X-3: X-Rays States and Jets. Galaxies. 2017; 5(4):86. https://doi.org/10.3390/galaxies5040086
Chicago/Turabian StyleTrushkin, Sergei, Michael McCollough, Nikolaj Nizhelskij, and Peter Tsybulev. 2017. "The Giant Flares of the Microquasar Cygnus X-3: X-Rays States and Jets" Galaxies 5, no. 4: 86. https://doi.org/10.3390/galaxies5040086
Note that from the first issue of 2016, this journal uses article numbers instead of page numbers. See further details here.