Article

Composite Photocatalysts with Fe, Co, and Ni Oxides on Supports with Tetracoordinated Ti Embedded into Aluminosilicate Gel during Zeolite Y Synthesis

1
Institute of Physical Chemistry “Ilie Murgulescu” of the Romanian Academy, 202 Splaiul Independentei, 060021 Bucharest, Romania
2
National Institute of Materials Physics, Atomistilor 405A, 077125 Magurele, Romania
3
Faculty of Sciences and Technology, University of Lorraine, CNRS, L2CM, F-54000 Nancy, France
*
Authors to whom correspondence should be addressed.
Gels 2024, 10(2), 129; https://doi.org/10.3390/gels10020129
Submission received: 30 November 2023 / Revised: 2 February 2024 / Accepted: 3 February 2024 / Published: 5 February 2024
(This article belongs to the Special Issue Designing Gels for Catalysts)

Abstract

:
Ti-aluminosilicate gels were used as supports for the immobilization of Fe, Co, and Ni oxides (5%) by impregnation and synthesis of efficient photocatalysts for the degradation of β-lactam antibiotics from water. Titanium oxide (1 and 2%) was incorporated into the zeolite network by modifying the gel during the zeolitization process. The formation of the zeolite Y structure and its microporous structure were evidenced by X-ray diffraction and N2 physisorption. The structure, composition, reduction, and optical properties were studied by X-ray diffraction, H2-TPR, XPS, Raman, photoluminescence, and UV–Vis spectroscopy. The obtained results indicated a zeolite Y structure for all photocatalysts with tetracoordinated Ti4+ sites. The second transitional metals supported by the post-synthesis method were obtained in various forms, such as oxides and/or in the metallic state. A red shift of the absorption edge was observed in the UV–Vis spectra of photocatalysts upon the addition of Fe, Co, or Ni species. The photocatalytic performances were evaluated for the degradation of cefuroxime in water under visible light irradiation. The best results were obtained for iron-immobilized photocatalysts. Scavenger experiments explained the photocatalytic results and their mechanisms. A different contribution of the active species to the photocatalytic reactions was evidenced.

1. Introduction

Zeolites are support materials widely used for hybrid adsorbents and photocatalyst applications [1,2,3,4,5,6,7] due to their adjustable properties such as high surface area, adsorption, environmentally friendly nature, hydrophobic/hydrophilic surface, and abundant acid/base sites. In photocatalytic reactions, the zeolite acts as a host for the semiconductors or other photoactive guests, and acid/base sites can reduce electron and hole recombination [1]. Thus, the disadvantages of TiO2 nanoparticles (the most commonly used semiconductor in photocatalysis), such as their low surface area, poor affinity for hydrophobic organic pollutants, agglomeration tendency, and light scattering, can be overcome [1]. In addition, to improve the separation of photogenerated charge carriers, the zeolite was doped with metal/non-metal or by introducing other semiconductors with a narrow band gap. The most used zeolites are zeolite Y [4,8,9], zeolite 5A [1,3,10,11], and natural zeolites [12,13]. The previous results [1,14,15,16] reported that the efficiency of TiO2/zeolite photocatalysts was optimized by an adequate choice of the zeolite type with a certain Si/Al molar ratio, specific surface area, and hydrophobicity. Also, among isolated metal oxide moieties with tetrahedral coordination geometry embedded in heteroatom-containing zeolites, titanium oxide has attracted considerable attention. The photocatalytic activity and selectivity of tetracoordinated Ti4+ species from the framework of titanium silicalite-1 (TS-1), which is the most representative one of the “single-site heterogeneous catalysts”, are much higher than those of octahedrally coordinated Ti in the TiO2 semiconductor [17]. The mechanism proposed for the photocatalytic reactions is based on the ligand-to-metal charge transfer (LMCT) process (Ti4+−O2−  h v Ti3+−O). However, TS-1 based photocatalysts are relatively less developed, and the largest limitation is the content of the framework Ti. Much of the relevant research was focused on zeolite synthesis with higher tetra-coordinated Ti in the framework [18,19]. Mesoporous TS-1 with a high Ti active site (Ti/(Si + Ti) > 5%) has been successfully synthesized by using the combined (sol–gel/dry gel conversion) method [19]. Thus, the first step was to obtain amorphous SiO2-TiO2 solids with Si–O–Ti bonds by the sol–gel method. These mixed oxides were impregnated with a tetrapropylammonium hydroxide (TPAOH) solution and hydrothermally treated to obtain more Ti in TS-1.
The first studies regarding the introduction of titanium into the zeolite Y framework by direct synthesis and the effect of Ti concentration on the zeolite structure were carried out by our group [20,21]. Zeolite Y is a faujasite molecular sieve with 7.35 Å diameter pores and a three-dimensional pore structure. The basic structural units are sodalite cages that form supercages that host spheres with high diameters (11.24 Å) [1]. The preservation of the zeolitic network was obtained for 1 and 2% TiO2, and its partial disruption was observed for 5% TiO2. The synthesis of Ti-Y and the effect of titanium concentration on the formation of the zeolite Y structure were evaluated by freezing the sol–gel phases at various periods [21].
In photocatalytic reactions, Ti sites possess strong adsorption capacity for the activated reactant molecules, and the coordinated O sites can accept reaction intermediates. Since the TiO2/zeolite composites exhibit high photocatalytic activity only under UV light irradiation, many approaches have sought to expand the field of applicability of these photocatalysts to visible light by doping a small amount of noble and transition metals [22,23,24,25,26,27,28]. A special interest was evidenced in noble metal nanoparticles (Pt, Pd, Au, and Ag) because of their plasmonic properties [8,9,29,30]. The combination of noble metals with another cheaper and more abundant transition metal was also studied [25]. Among the transition metals whose ions are capable of modifying the optoelectronic properties of TiO2, the following stood out: V, Cr, Fe, Co, Ni, Cu, and Zn [22,23,24,26,27,28,31]. The immobilization of these metals on TiO2/zeolite created active species, modified the surface properties, promoted photoinduced carrier separation, and consequently enhanced the photocatalytic activity. The photocatalytic degradation mechanism of zeolite-based photocatalysts can vary for different organic compounds due to their sensitization effect. For instance, our previous results evidenced the high activity of Co–Ti- or Ni–Ti-supported photocatalysts on zeolite Y, with microporous and hierarchical structures, in amoxicillin photodegradation [32]. The degradation mechanism of amoxicillin (β-lactam antibiotic) under UV and visible light irradiation, investigated in the presence of scavengers, evidenced the effect of metal species interaction and zeolite support. Hence, for practical environmental applications, the zeolite properties, supported metals, pollutant type, and experiment factors play vital roles in the photodegradation process. In this regard, the effect of reaction conditions such as pH, concentration of photocatalysts, and pollutants on degradation efficiency requires further investigation. Therefore, the results obtained so far sustain the performance of zeolite-based photocatalysts in the degradation of organic pollutants and their use in practical environmental applications.
Here, Fe, Co, and Ni/Ti-containing zeolite Y photocatalysts were obtained, characterized, and utilized in the degradation of cefuroxime (β-lactam antibiotic) from water. Cefuroxime (CFX) was selected as the representative of the second generation of cephalosporin, widely used in medicine for the treatment of a broad range of infectious bacteria [33,34,35]. CFX antibiotic was frequently detected in wastewater, surface water, and soil [33,34,35,36] and had the highest persistence among the tested cephalosporins in wastewater effluent [36]. Scavenger experiments were performed to deepen the photodegradation mechanism. Titanium was immobilized, as tetrahedral coordinated Ti in the zeolite Y framework, during the sol–gel process from the zeolite synthesis. Subsequently, Fe, Co, and Ni oxides (5%) were immobilized on the prepared Ti-containing zeolite Y support by the impregnation method. X-ray diffraction, N2 physisorption, H2-TPR, XPS, Raman, UV–Vis, and photoluminescence spectroscopy were used to investigate the structure, texture, composition, configuration, and optoelectronics properties of the photocatalysts. The results obtained in this study, both for titanium and second 3d metal species (Fe, Co, and Ni), were compared with those obtained for similar photocatalysts with titanium immobilized on zeolite Y by impregnation [20,32]. This work provided an effective strategy to address the deactivation problem of TiO2-based photocatalysts by Ti leaching, thus increasing the chances of reusing the photocatalytic materials for wastewater decontamination. Besides this, the proposed materials also present other advantages in photocatalysis, such as high adsorption capacity, very good dispersion of photocatalytically active species, increasing the contact area between active sites and pollutants, and activity in the visible area. All these properties have been discussed in the present paper.

2. Results and Discussion

2.1. Structural, Morphological and Textural Properties

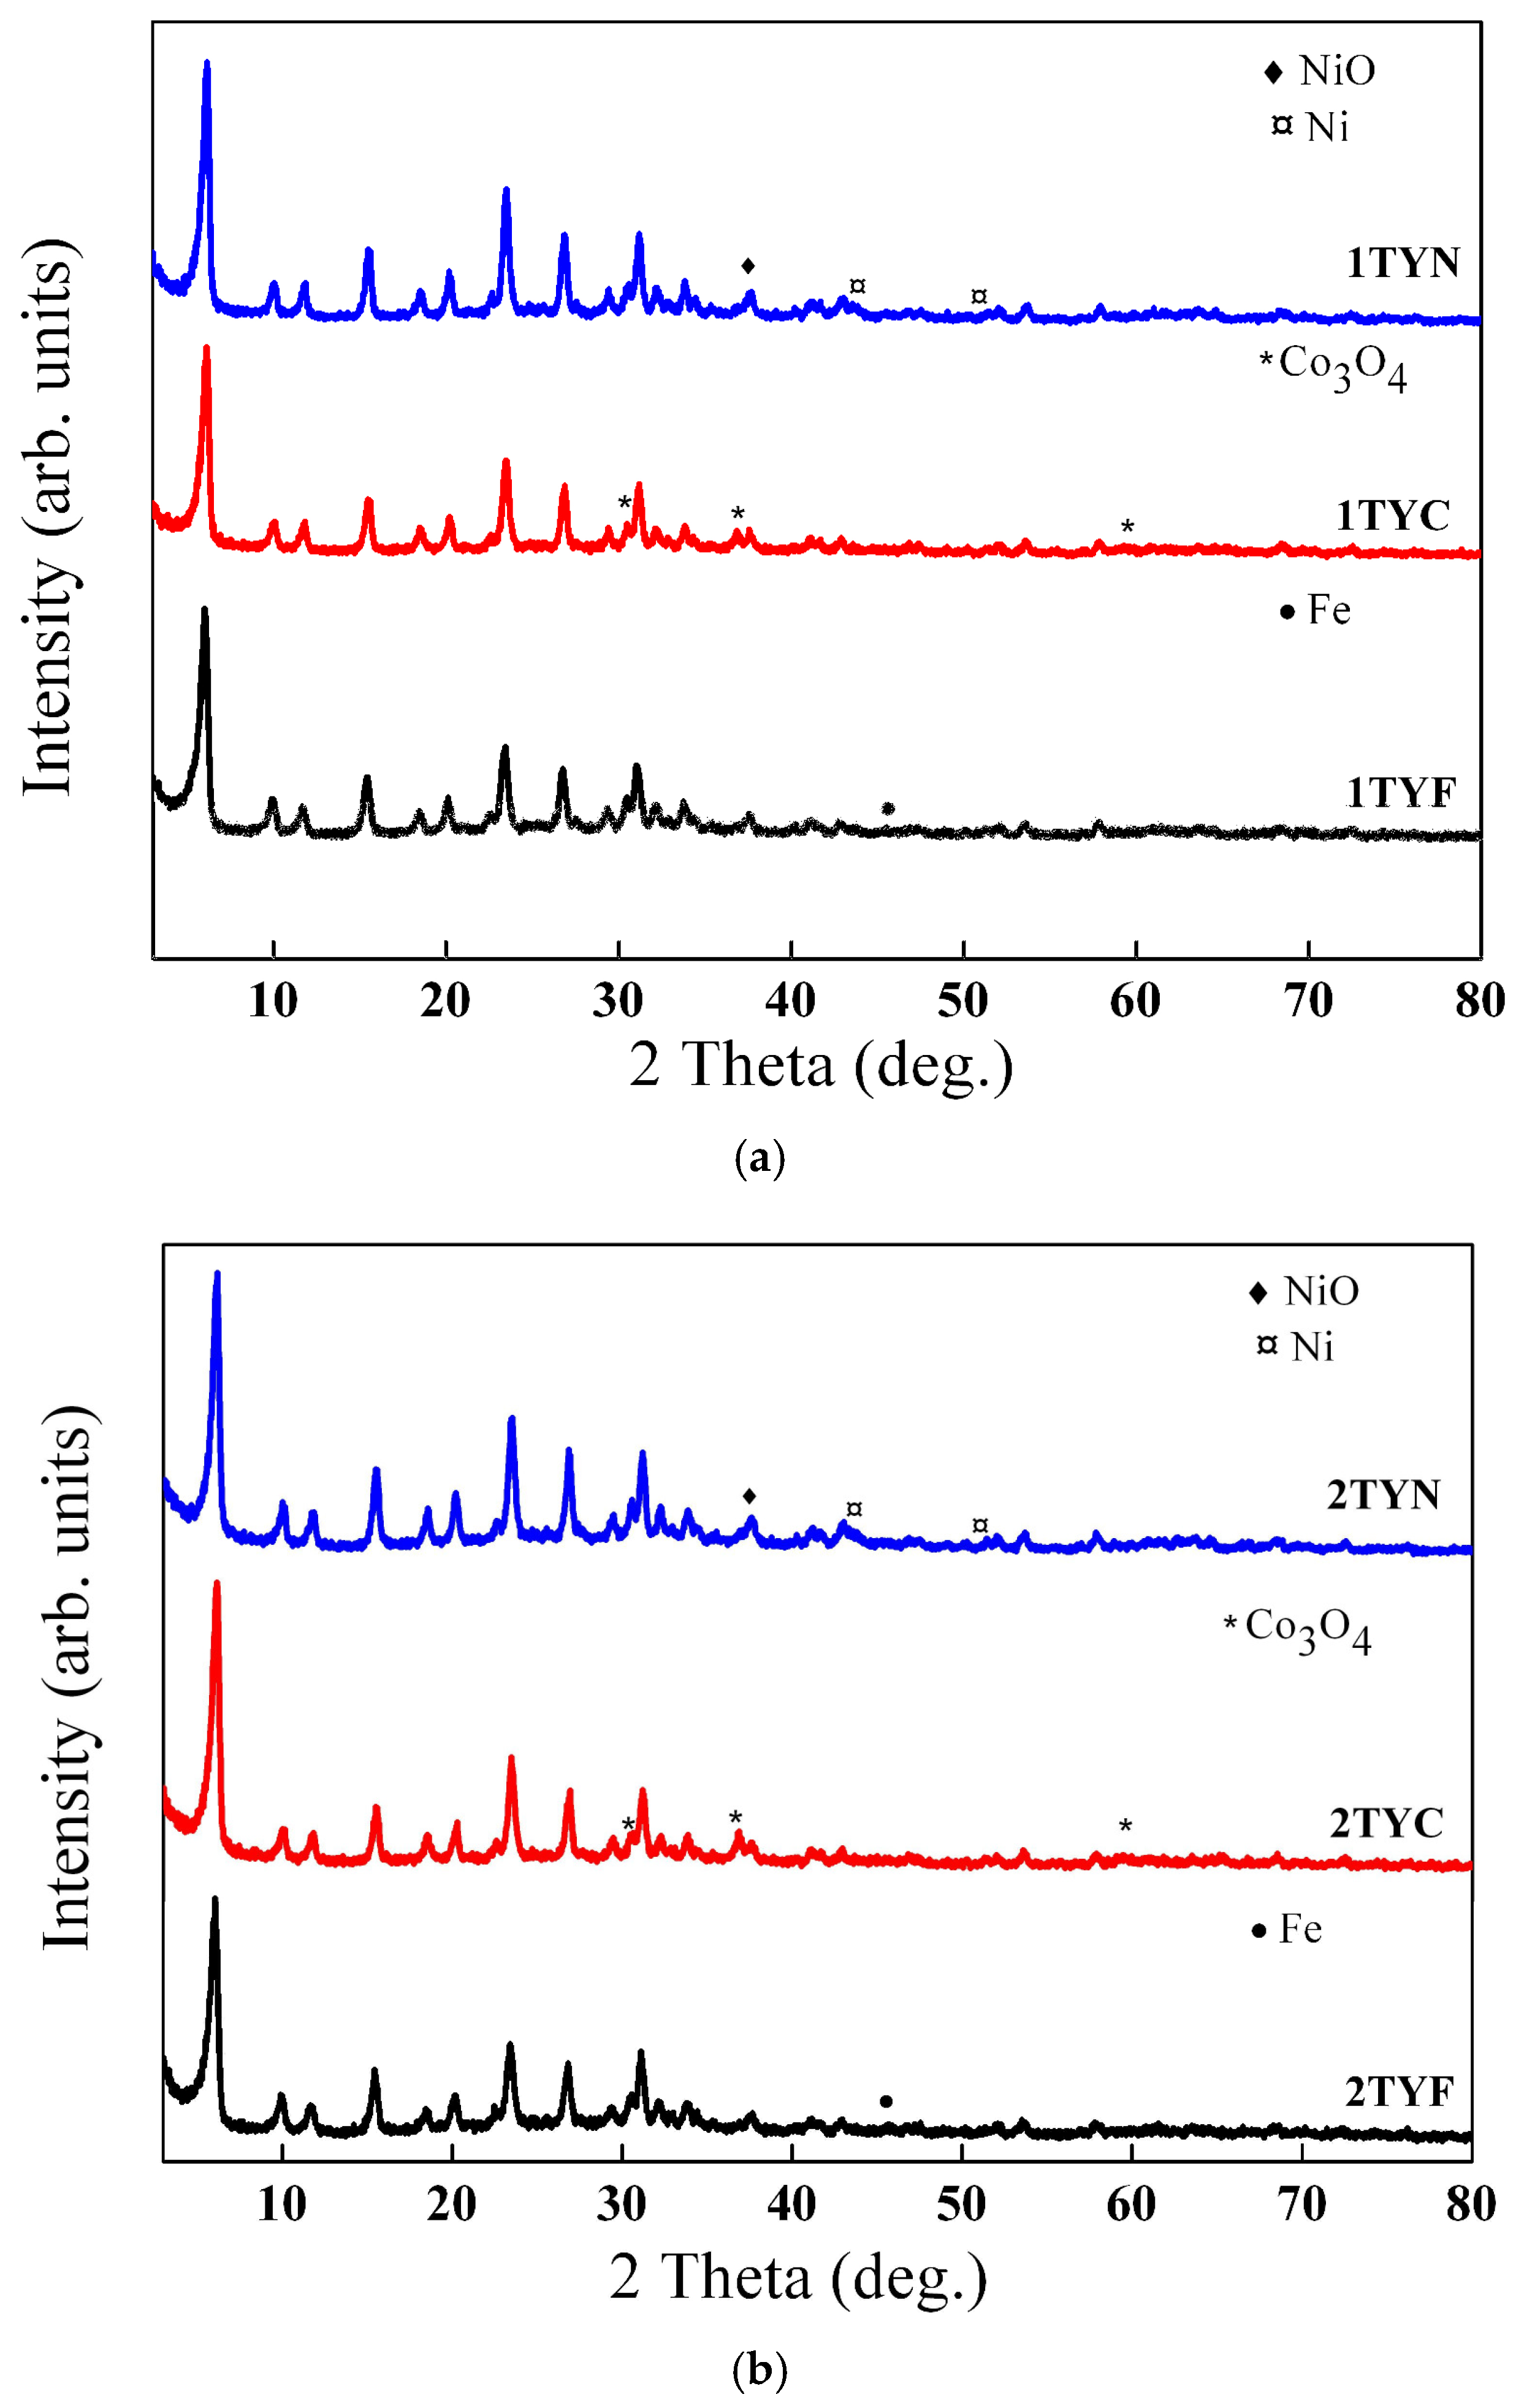
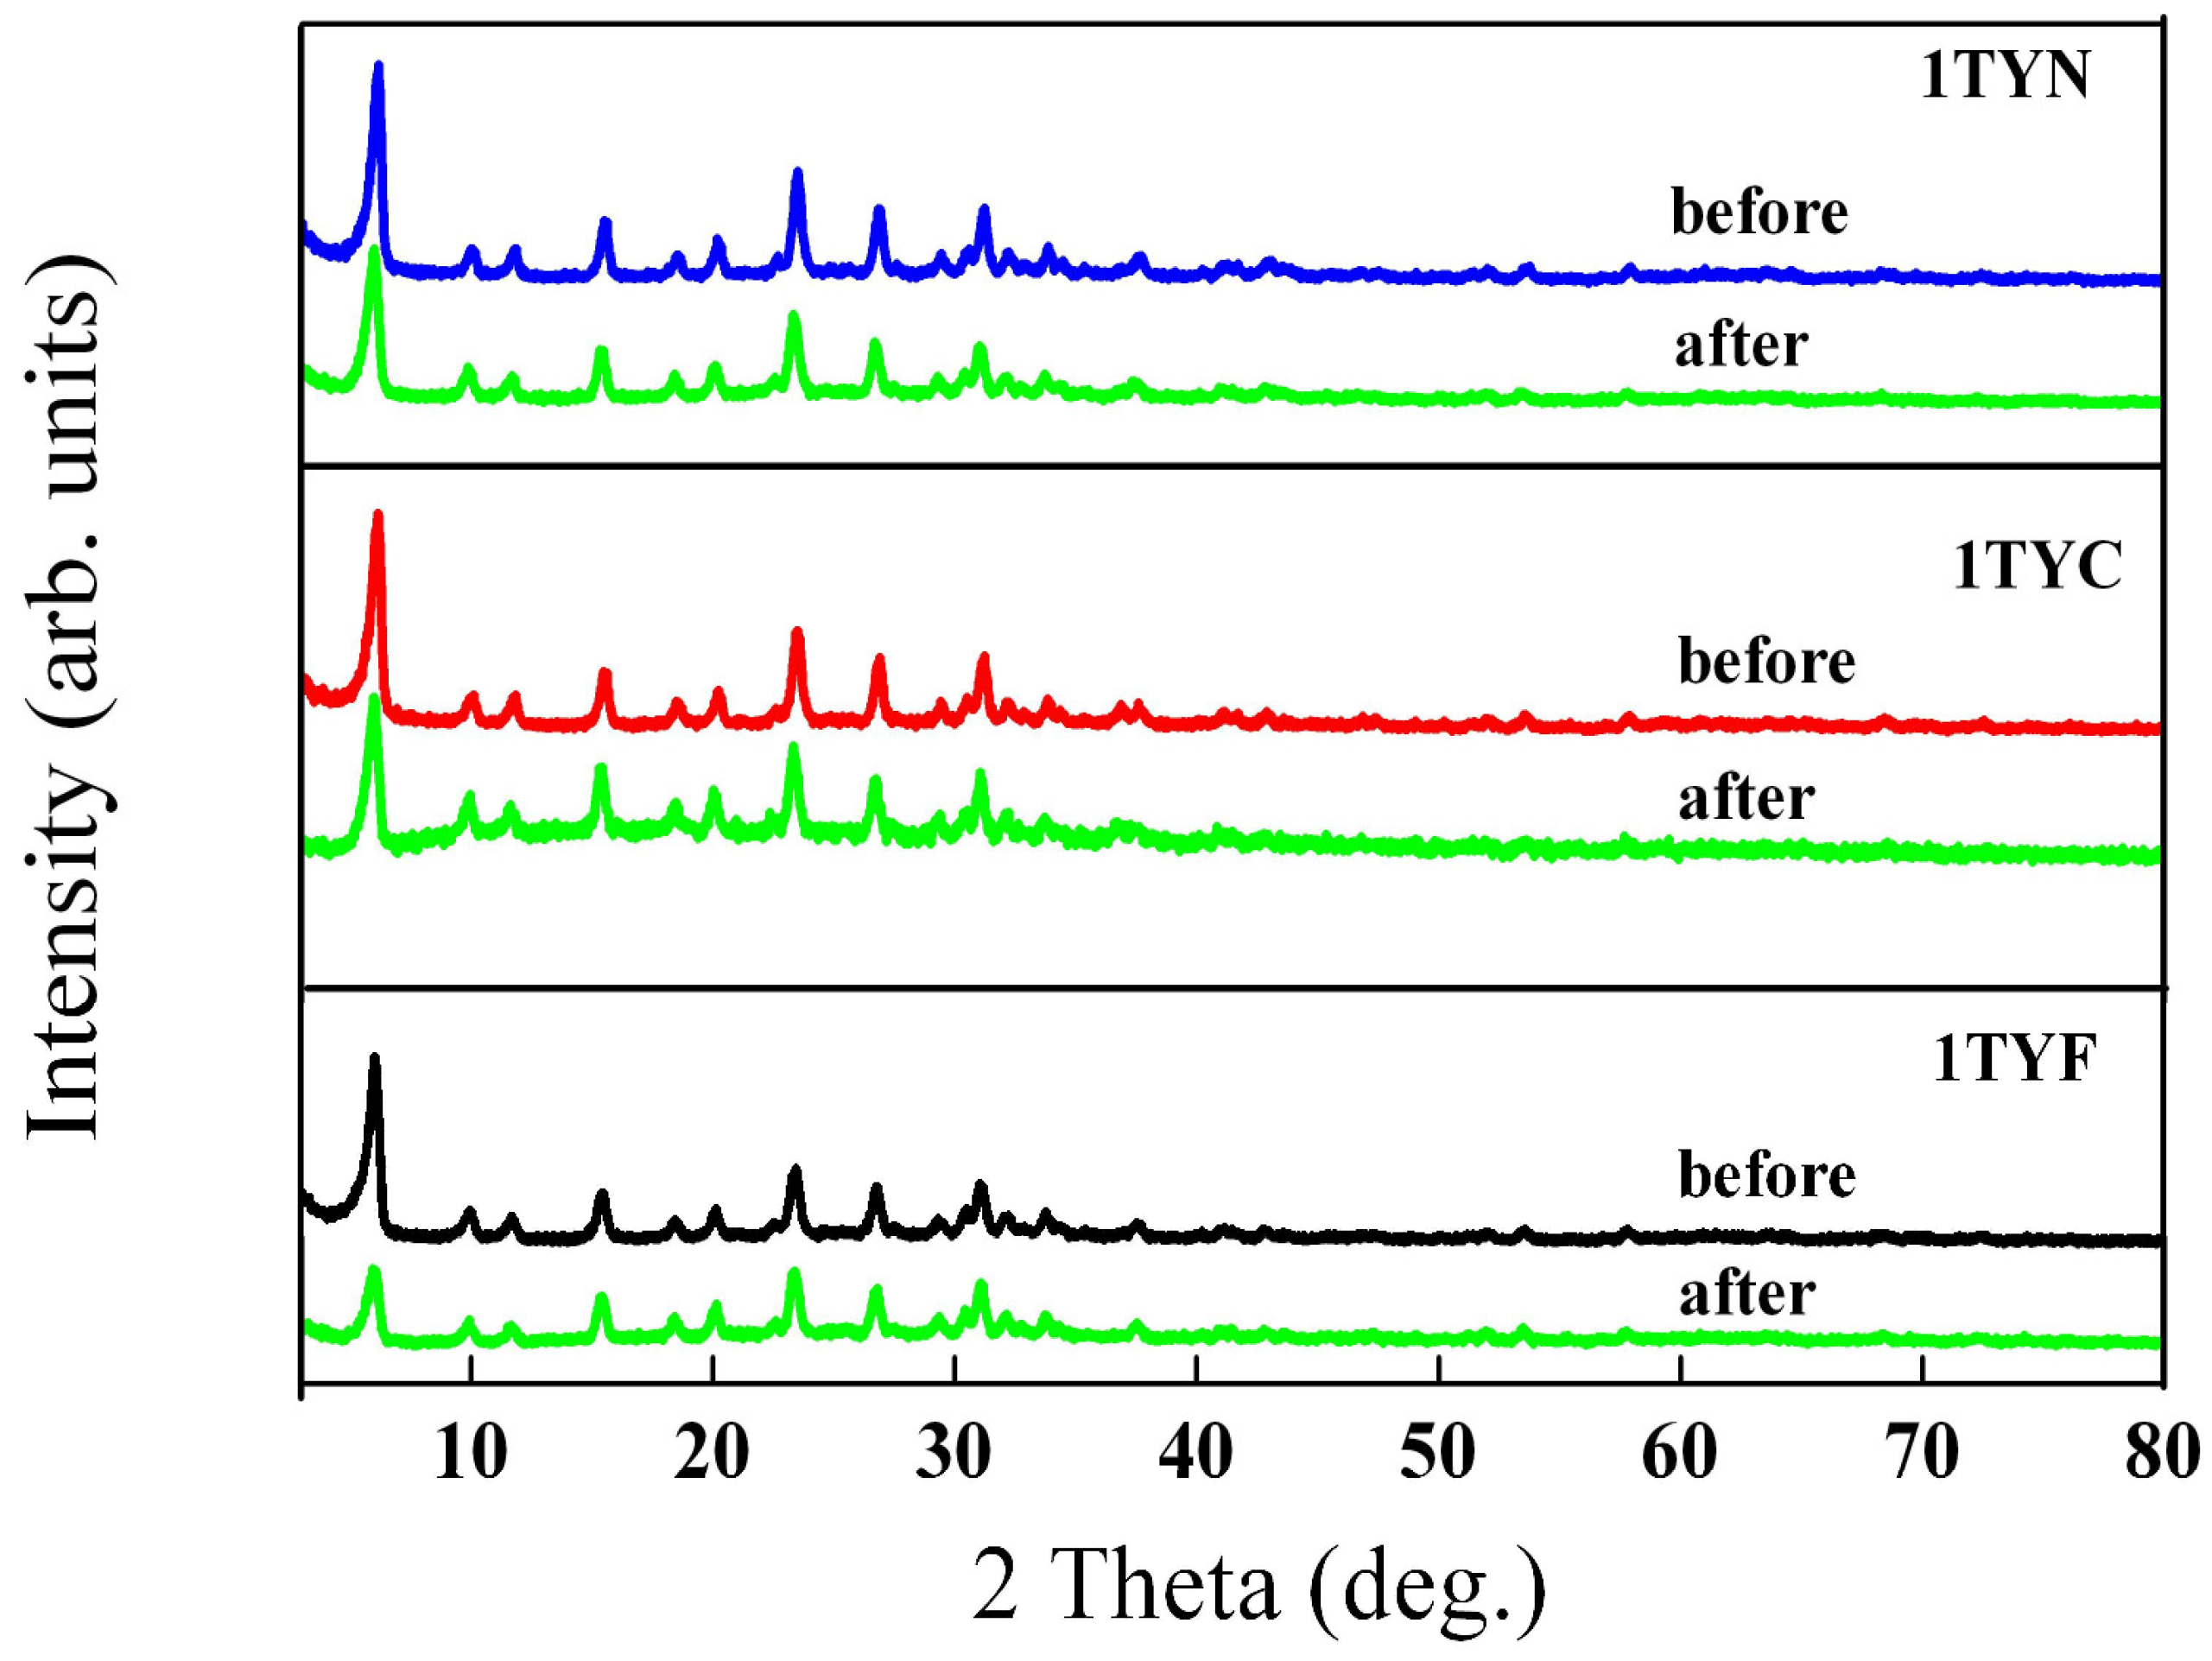
2.1.1. X-ray Diffraction

Structural analysis of zeolites was performed using X-ray diffraction (XRD) and transmission electron microscopy (TEM). The XRD patterns of the samples with Fe, Co, and Ni supported on Ti-zeolite Y are presented in Figure 1. The results mainly indicate the characteristic peaks of faujasite Y (PDF card no. 00-038-0239). It means that the addition of 3d metal oxides, but especially the incorporation of titanium into the aluminosilicate gel framework, did not affect the obtaining of the crystalline structure of zeolite Y. It was proven in studies previously reported by our group [20,21] that the proposed synthesis method succeeds in obtaining titanium-aluminosilicate with the Y faujasite structure for TiO2 concentrations lower than 5%.
In the case of samples modified with cobalt oxide, the XRD results show the formation of the Co3O4 crystalline phase (PDF card no. 00-042-1467). Thus, the peaks located at 31.19°, 36.84°, and 59.31° were attributed to the Co3O4 crystal faces (220), (311), and (511), respectively. Modification of Ti-zeolite Y supports with nickel oxide led to the appearance of several discrete peaks in the XRD patterns at 37.52°, 46.76°, 63.85°, and 76.12° assigned to (111), (200), (220), and (311) planes of bunsenite NiO (PDF card no. 00-047-1049). Besides these, the XRD results also indicate the formation of metallic nickel (PDF card no. 00-901-3028). It is sustained by the presence of the peaks that appear at 43.55° and 51.42° and correspond to the (111) and (200) planes of nickel in metallic form. Meanwhile, for the samples modified with iron oxide, the XRD results did not show the presence of any diffraction peak characteristic of crystalline iron oxide forms, although an experimental concentration of 3.04% was determined by XRF measurements. It is the result of small iron oxide crystallites with a high dispersion, which does not allow their detection by X-ray diffraction. However, a slight signal seems to be obtained at 45.58°, suggesting the formation of metallic iron (PDF card no. 00-900-0669). The corresponding X-ray diffractograms of the unmodified Ti-zeolite Y supports (Figure S1) were used as a reference.

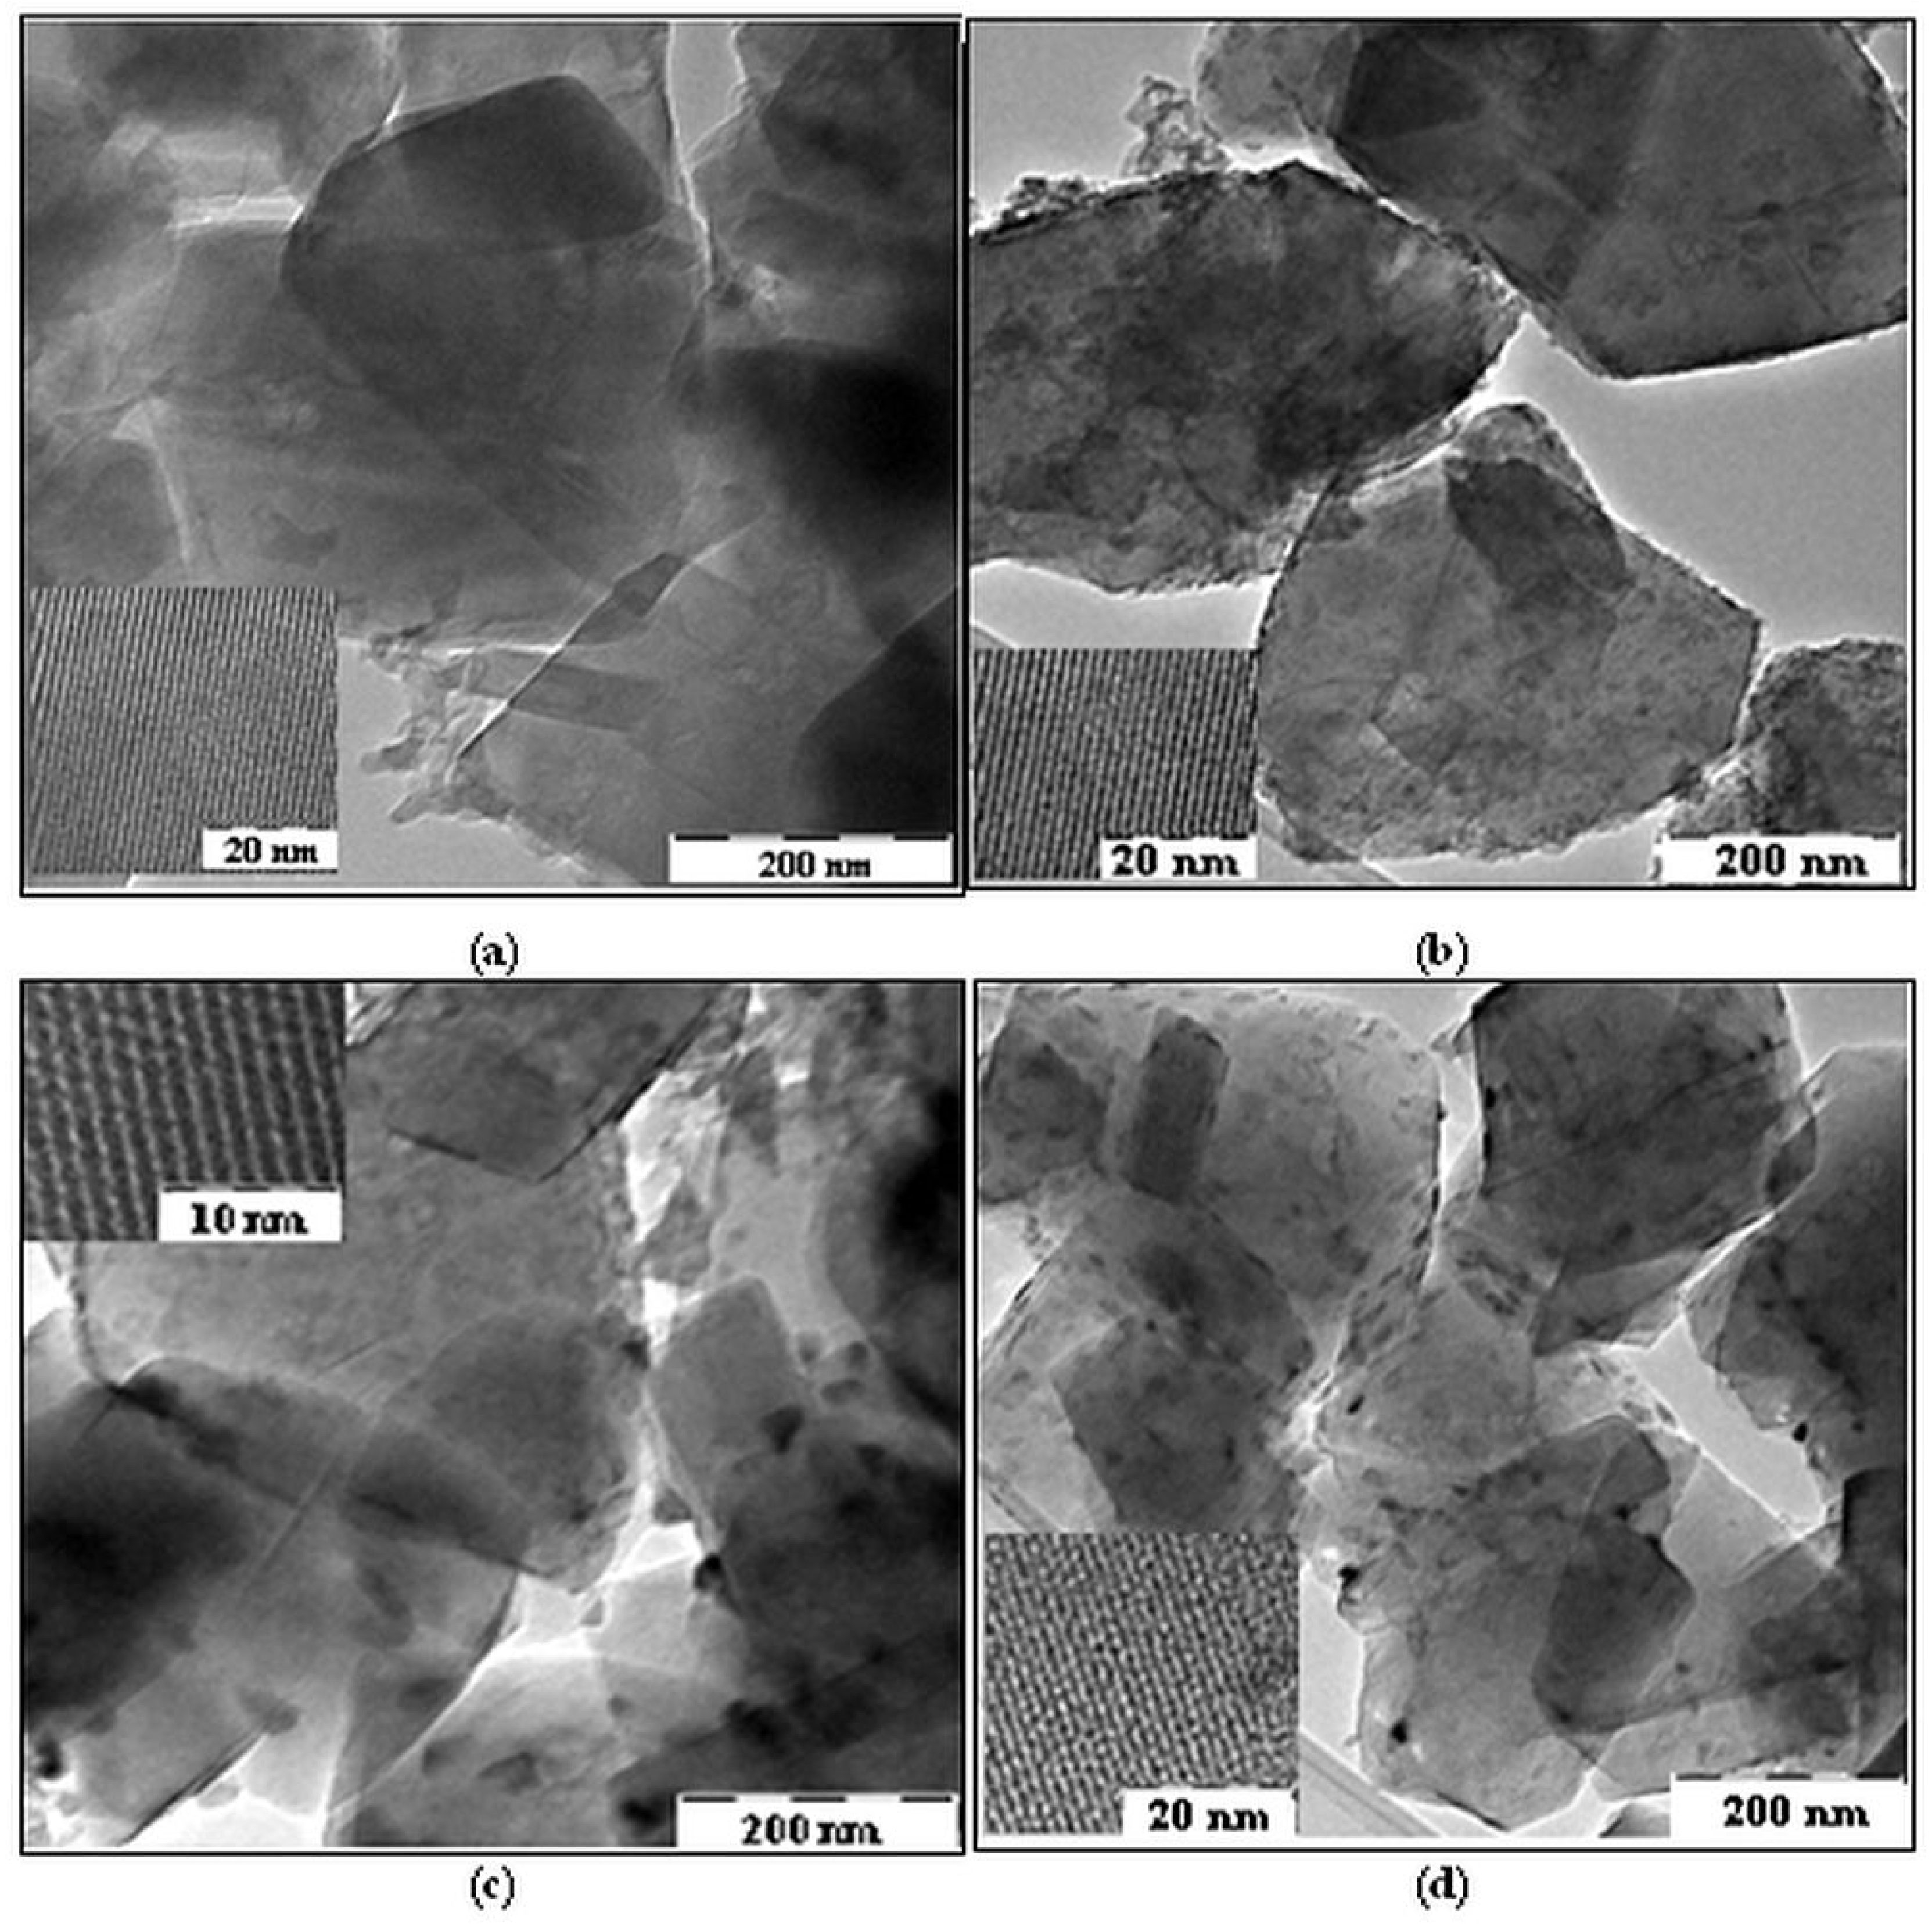
2.1.2. TEM Investigation
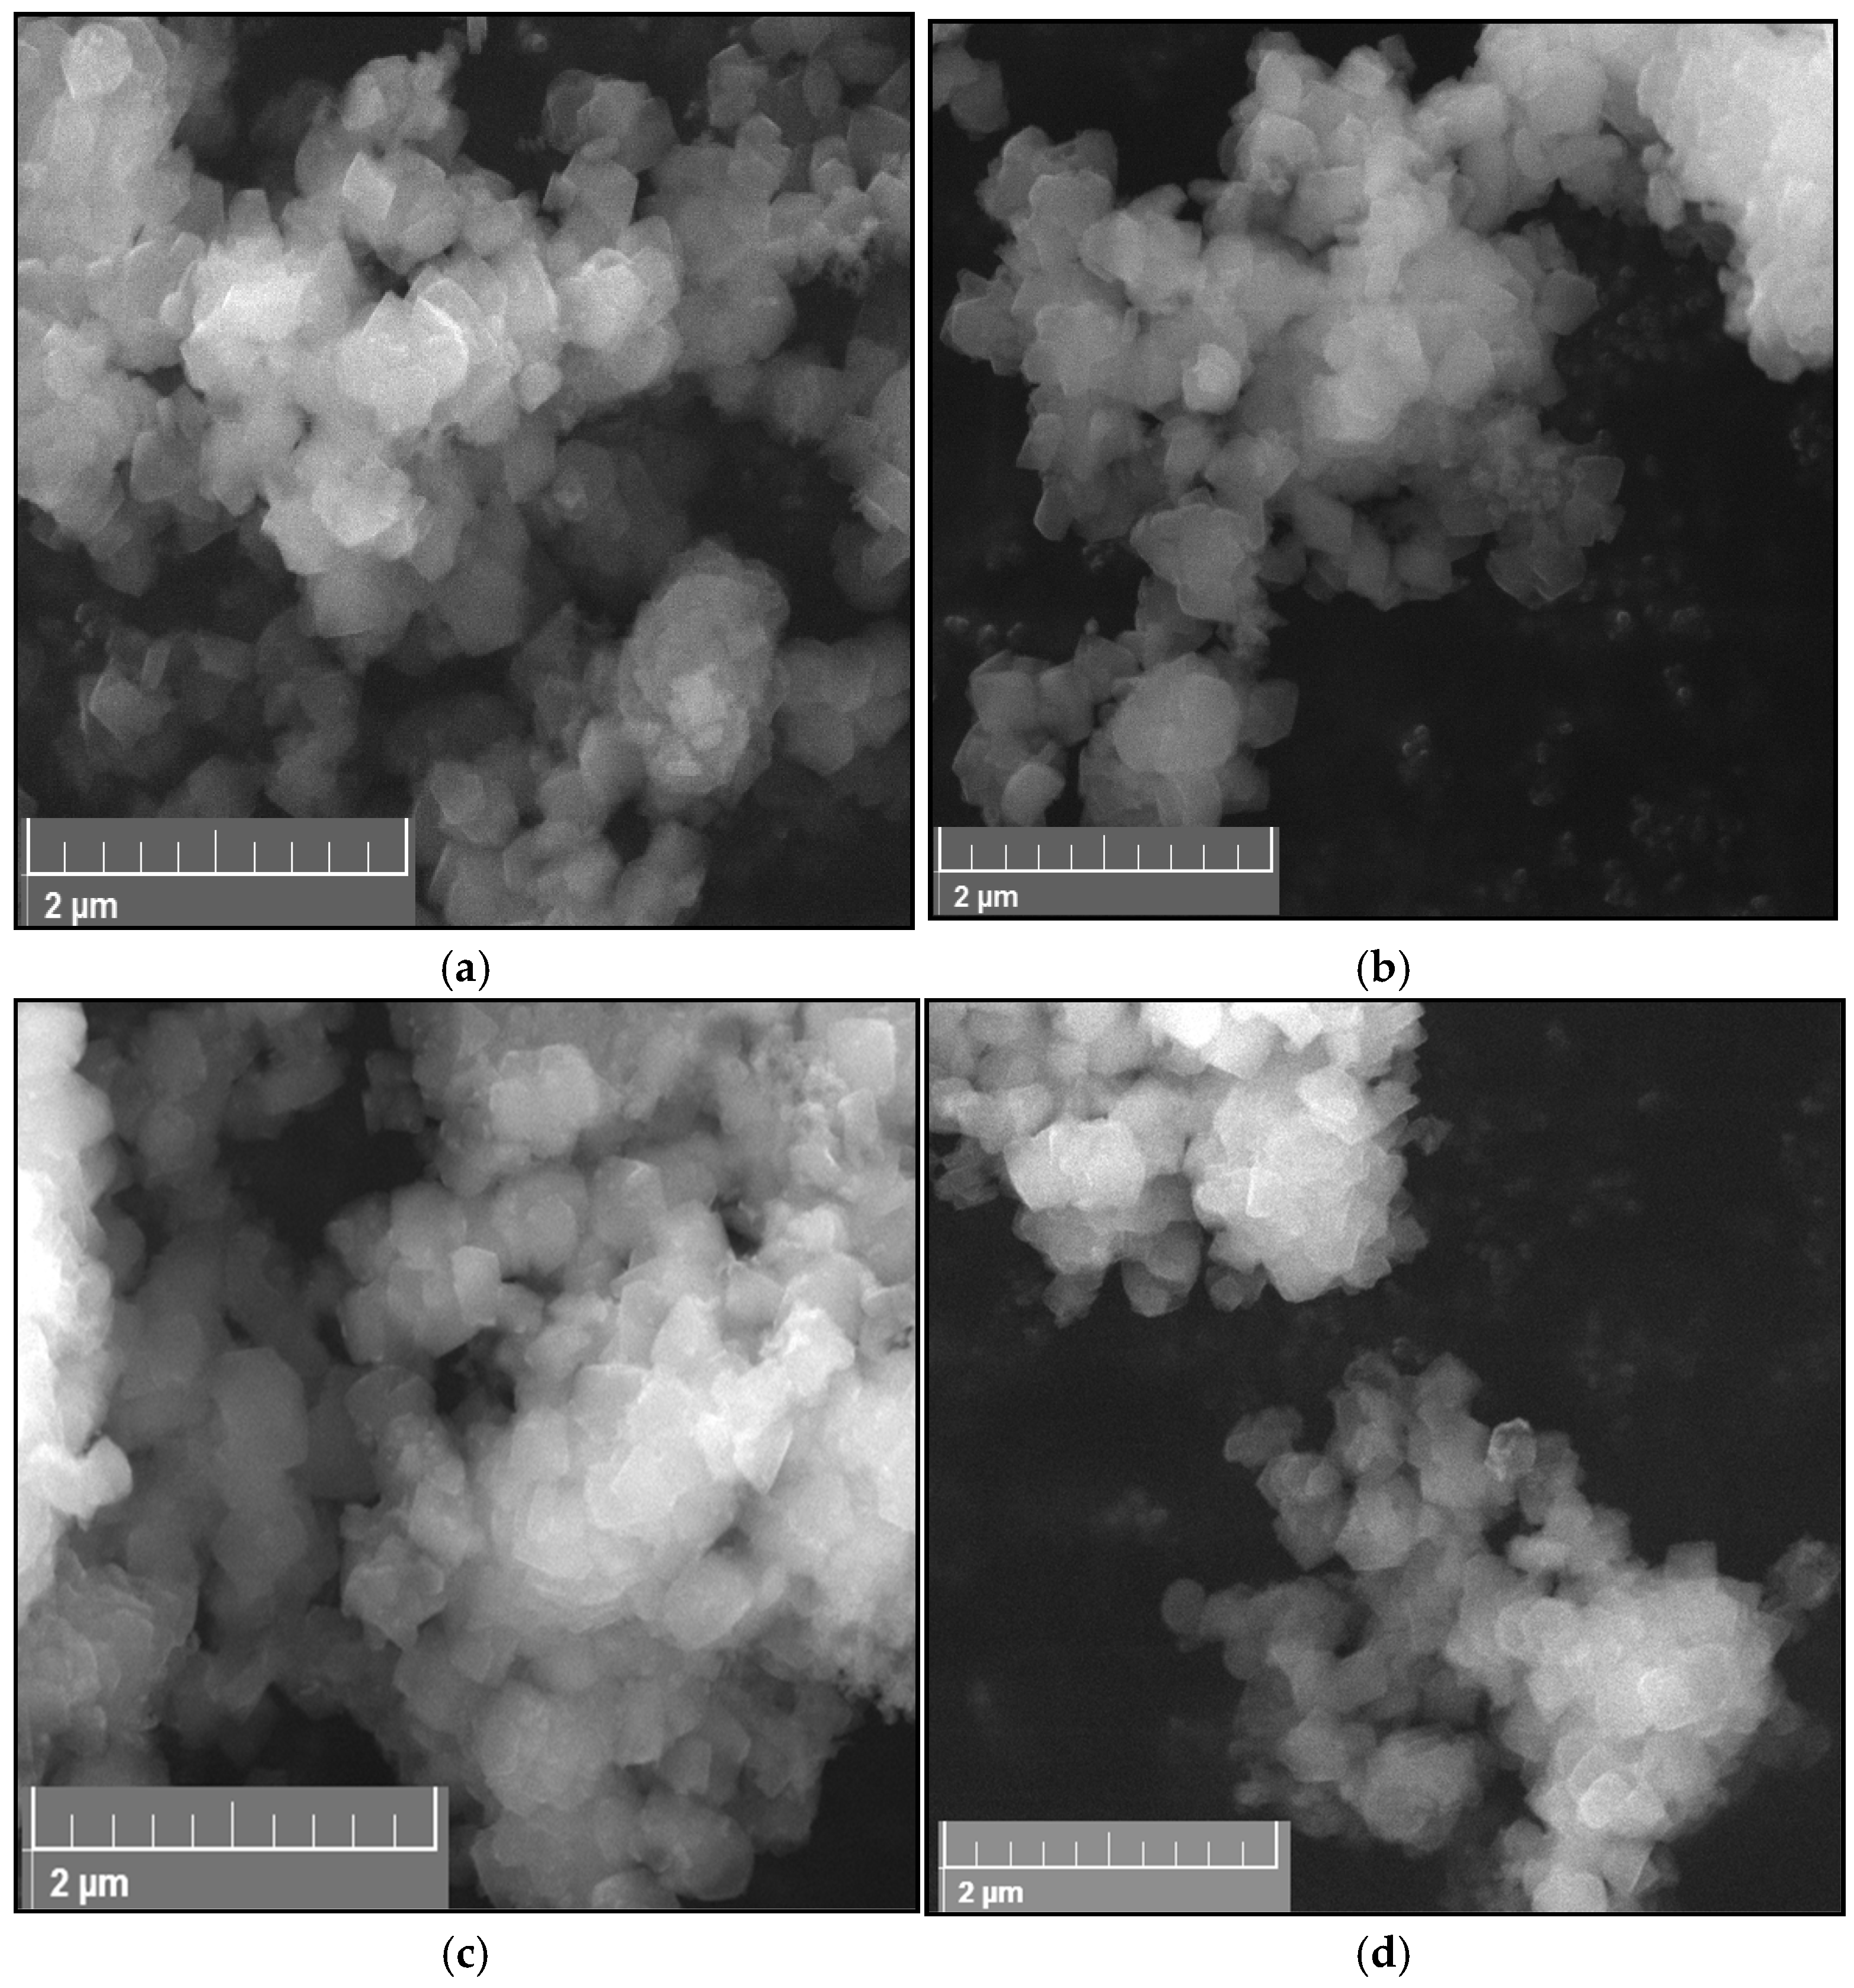
TEM images show (Figure 2) that metal oxides are deposited on the zeolite crystals, forming islands of nanometric dimensions (10–50 nm). In the case of samples with Fe and Co, larger oxide phases can be observed at the interface of the zeolite crystals, which can favor their agglomeration. In the inserted TEM images, the regular arrays of the zeolite Y pores are around 1 nm. After metal oxides’ immobilization, irregularly stretched lines indicating crystal imperfections of Ti-zeolite Y are not observed.

2.1.3. SEM Analysis

The morphology of synthesized materials was evidenced by scanning electron microscopy (SEM). SEM images of Ti-zeolite Y before and after immobilization of Fe, Co, and Ni oxides are presented in Figure 3. The typical morphology of zeolite Y (FAU zeolite), with octahedral crystals and multiple twinning polyhedrals [21,37], is evident in all the SEM images (Figure 3a–d). A slight change in morphology, possibly due to the crystals’ agglomeration, seems more visible for samples with supported iron and cobalt oxides (Figure S2). This confirms the effect of the oxide formations at the interface of the zeolite crystals, as evidenced in the TEM images (Figure 2b,c).

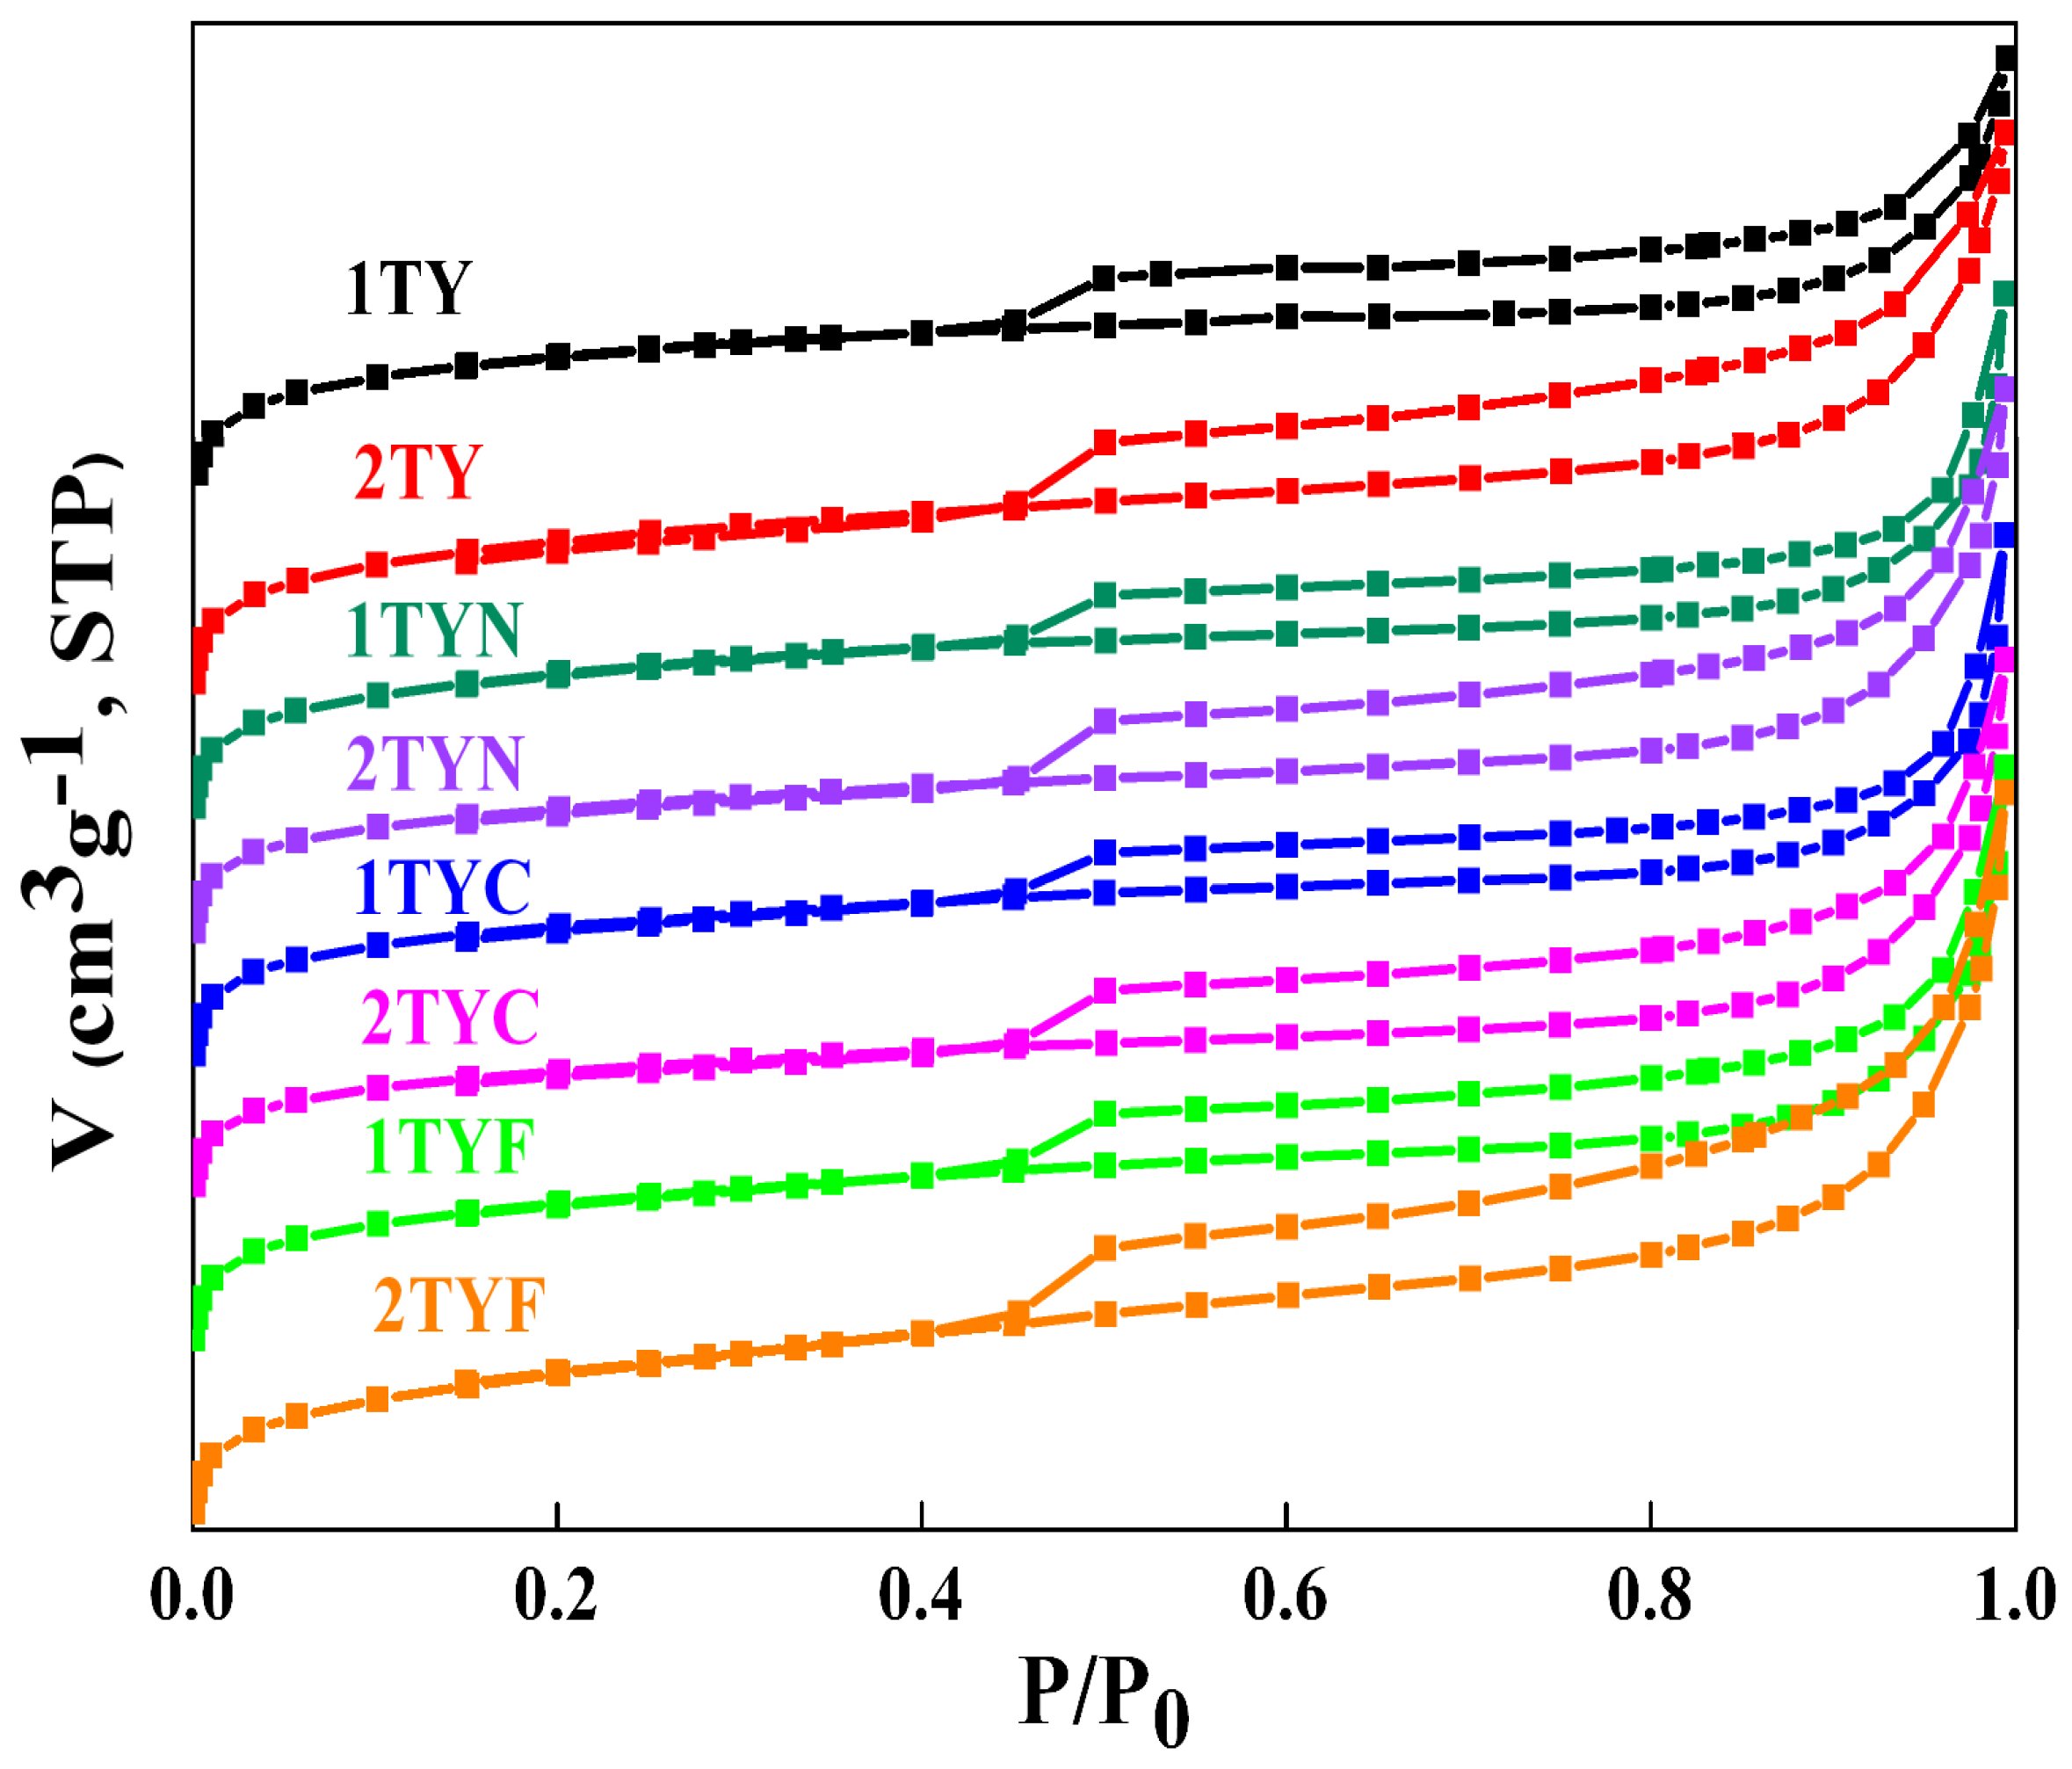
2.1.4. N2 Physisorption

Figure 4 displays the N2 adsorption–desorption isotherms for all samples. Based on the IUPAC classification [38], all the isotherms are composites of type I (a) and type IV (a). This type of isotherm is characteristic of materials with dual porosity generated by micro and mesopores. The isotherms exhibit hysteresis loops at relative pressures higher than 0.45 and can be classified as type H4. The textural parameters of the samples are shown in Table 1.
As can be seen, the surface area of the samples impregnated with metal oxides decreased by 10 to 20% compared to the Ti-zeolite Y supports, but the percentage of micropores and mesopores remains almost constant, 88–90% (micropores) and 10–12% (mesopores). In the case of the 2TYF sample, the percentage of micropores is 84%, and that of mesopores is 16%. Regarding the total volume of the pores, it decreased in the samples impregnated with metal oxides compared to the support samples 1TY and 2TY. This indicates a uniform distribution of metal oxides on the internal surface of the pores. The exception is sample 2TYF, in which the percentage of micropores is 84% and that of mesopores is 16%. Regarding the total volume of the pores, the decrease in the samples impregnated with metal oxides compared to the support samples 1TY and 2TY is lower than in the case of the surface. It can also be seen that the decrease in total pore volume is between 1 and 13%, while the micropore volume decreases by a higher percentage, between 10 and 21%.

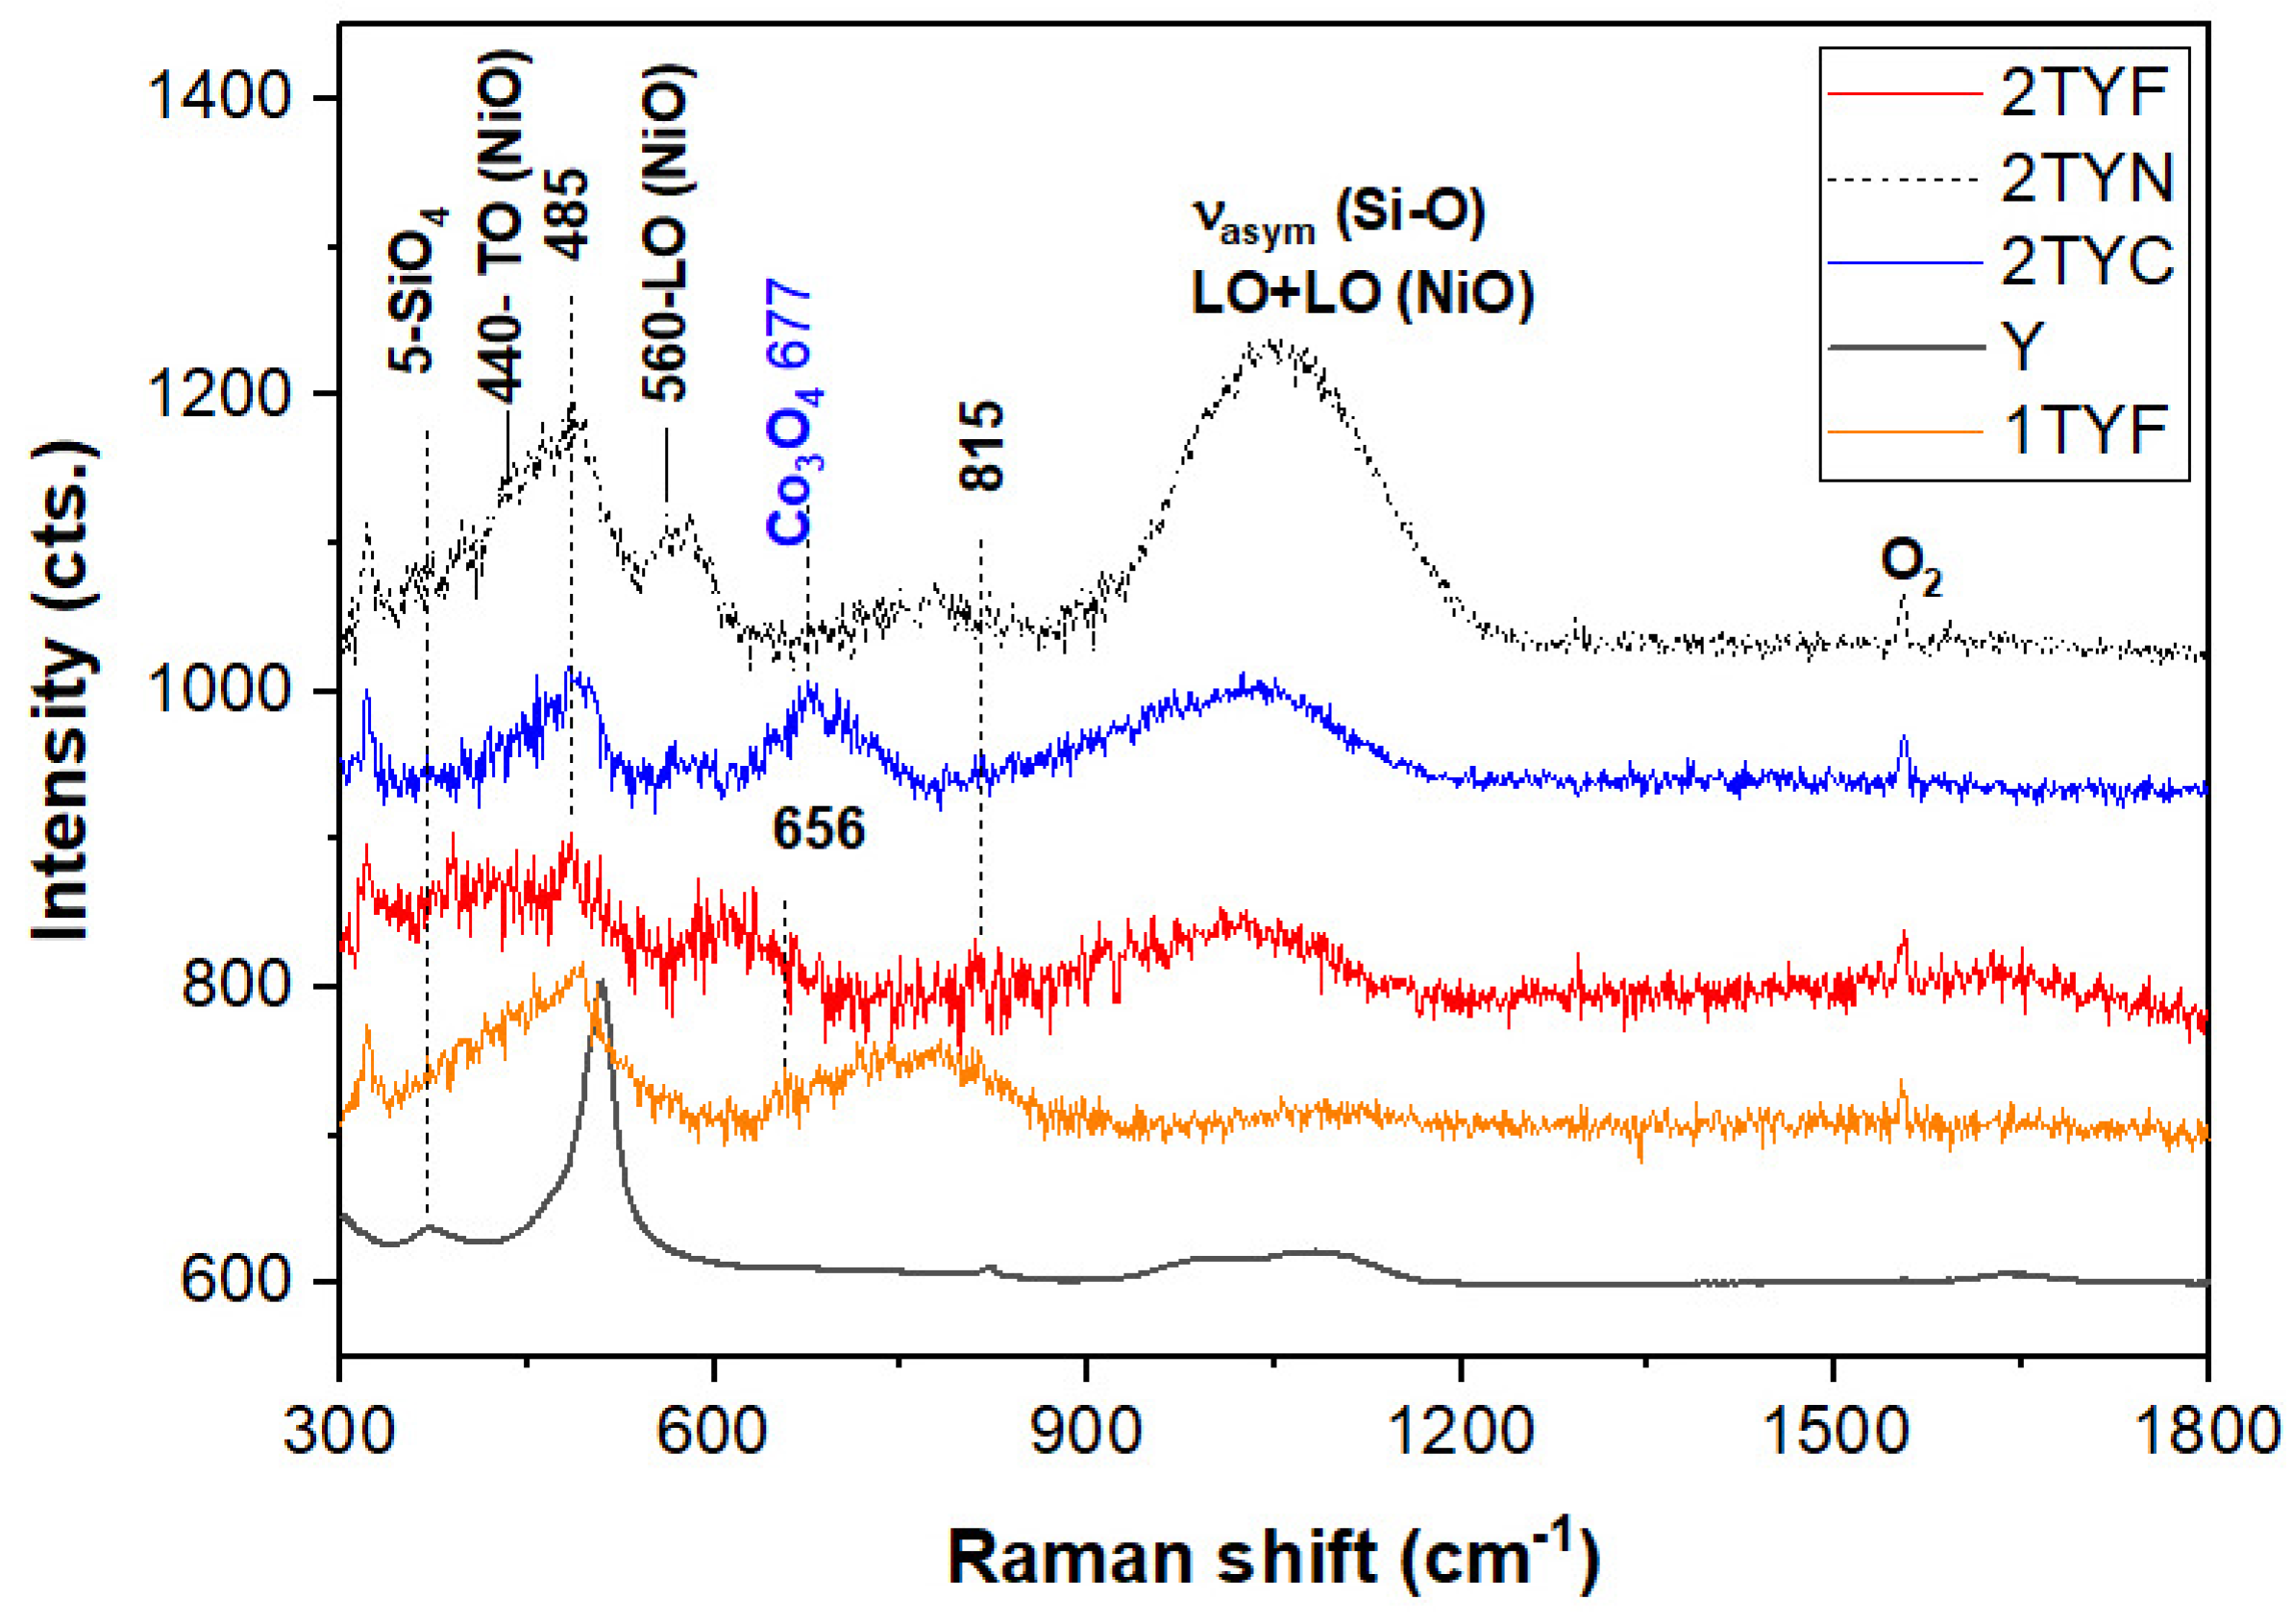
2.1.5. Raman Spectroscopy

The UV Raman spectroscopy has been recently used for structural investigation of the surface of catalysts due to the limited penetration depth of the UV lasers [39]. Less intense and wider UV-Raman bands are present in the (1/2)TY(F/N/C) spectra in Figure 5 in contrast with the zeolite Y spectrum (372 cm−1, six-membered SiO4 rings, ~500 cm−1, four-membered SiO4 rings, 1006 cm−1, and 1081 cm−1, asymmetric stretching mode of the (Al/Si)-O linkages in tetrahedral coordination [40]). This is a consequence of the vitreous surface of the zeolite-supported catalysts.
The tinny band at about 672 cm−1 belongs to the A1g modes of the Co3O4 [41] in the 2TYC spectrum. Moreover, the spinel structure, Co2+(Co3+)2O24−, of Co3O4 was identified for the (1/2)TYC samples by Vis-Raman spectroscopy (Figure S3) at 194, 485, 521, 622, and 692 cm−1 (F2g, Eg, F2g, F2g, and A1g). A two-phonon wide band at about 1060 cm−1 was reported for CoO [41]. However, the later band at 1050 cm−1 in Figure S3 can also belong to the T–O stretch, as pointed out in Table 2. Most of the NiO vibrations [42] (see Table 2) overlap those of SiO2 [43].
Given the low titania content and lack of the Raman bands of the anatase (398 cm−1, B1g, and 633 cm−1, Eg) and/or rutile (611 cm−1 and 826 cm−1 due to A1g and B2g modes [44]) in Figure 5, tetrahedral framework titanium atoms were obtained in the (½)TY(F/N/C) powders by adding titanium acetylacetonate to the aluminosilicate gel, according to the synthesis method.
Given the strong UV adsorption due to the ligand-to-metal charge transfer transition of O2−-−Fe3+ → O−Fe2+ was reported to occur below 300 nm [45], the Fe–O–Si bonds in a zeolite framework give only faint Raman signals regardless of the iron oxide content when an exciting laser line of 325 nm is used. Fan et al. [46] reported that Raman bands (collected with a 244 nm laser closed to the charge transfer transition) at about 516 and 1115 cm−1 in the Fe-ZSM-5 belong to the symmetric and asymmetric stretching modes of the Fe–O–Si bonds of the tetrahedral coordinated Fe3+. In the case of the 2TYF sample, the 1115 band might be obscured by the stronger Si–O stretching modes peaking up at 1027 cm−1 or extra-framework iron species (magnetite and/or hematite) that are present. The latter species should be confirmed by UV adsorption bands or shoulders at about 350 nm and 480 nm for hematite [45] (see below Section 2.3).
Table 2. Peak position, assignments, and references of the 2TY (N/C/F) and Y zeolite.
Y2TYN2TYC2TYFAssignmentReference
372396 391Bending mode of double 6-membered SiO2 rings and Eg of Fe2O3 (412 cm−1) [40,46]
440455 TO modes NiO, Eg of Co3O4 (470 cm−1) and n-membered SiO4 rings (n ≤ 6)[41,43]
506485495485Breathing of the 4-membered SiO2 rings (4R, 508 cm−1) in 6-membered double rings (D6R, 490 cm−1) and Co3O4[41,43]
560 LO modes of NiO[42]
577 Al–O–Si stretching in connection with ring structures[46]
611Eg modes of Fe2O3[47]
652Symmetric Fe-O breathing A1g modes[45]
677 A1g of CoO6 (675 cm−1)[41]
705
740 2TO modes of NiO[42]
776 O–O stretching of adsorbed O22−[41]
1006 Asymmetric T–O stretch (T = Al and Si)[40]
105410321027Asymmetric T–O stretch (T = Al, Ti, and Fe) and two-phonon modes of CoO[41,43]
1081 Asymmetric T–O stretch (T = Al and Si)[40]

2.2. Composition and Reduction in Photocatalysts

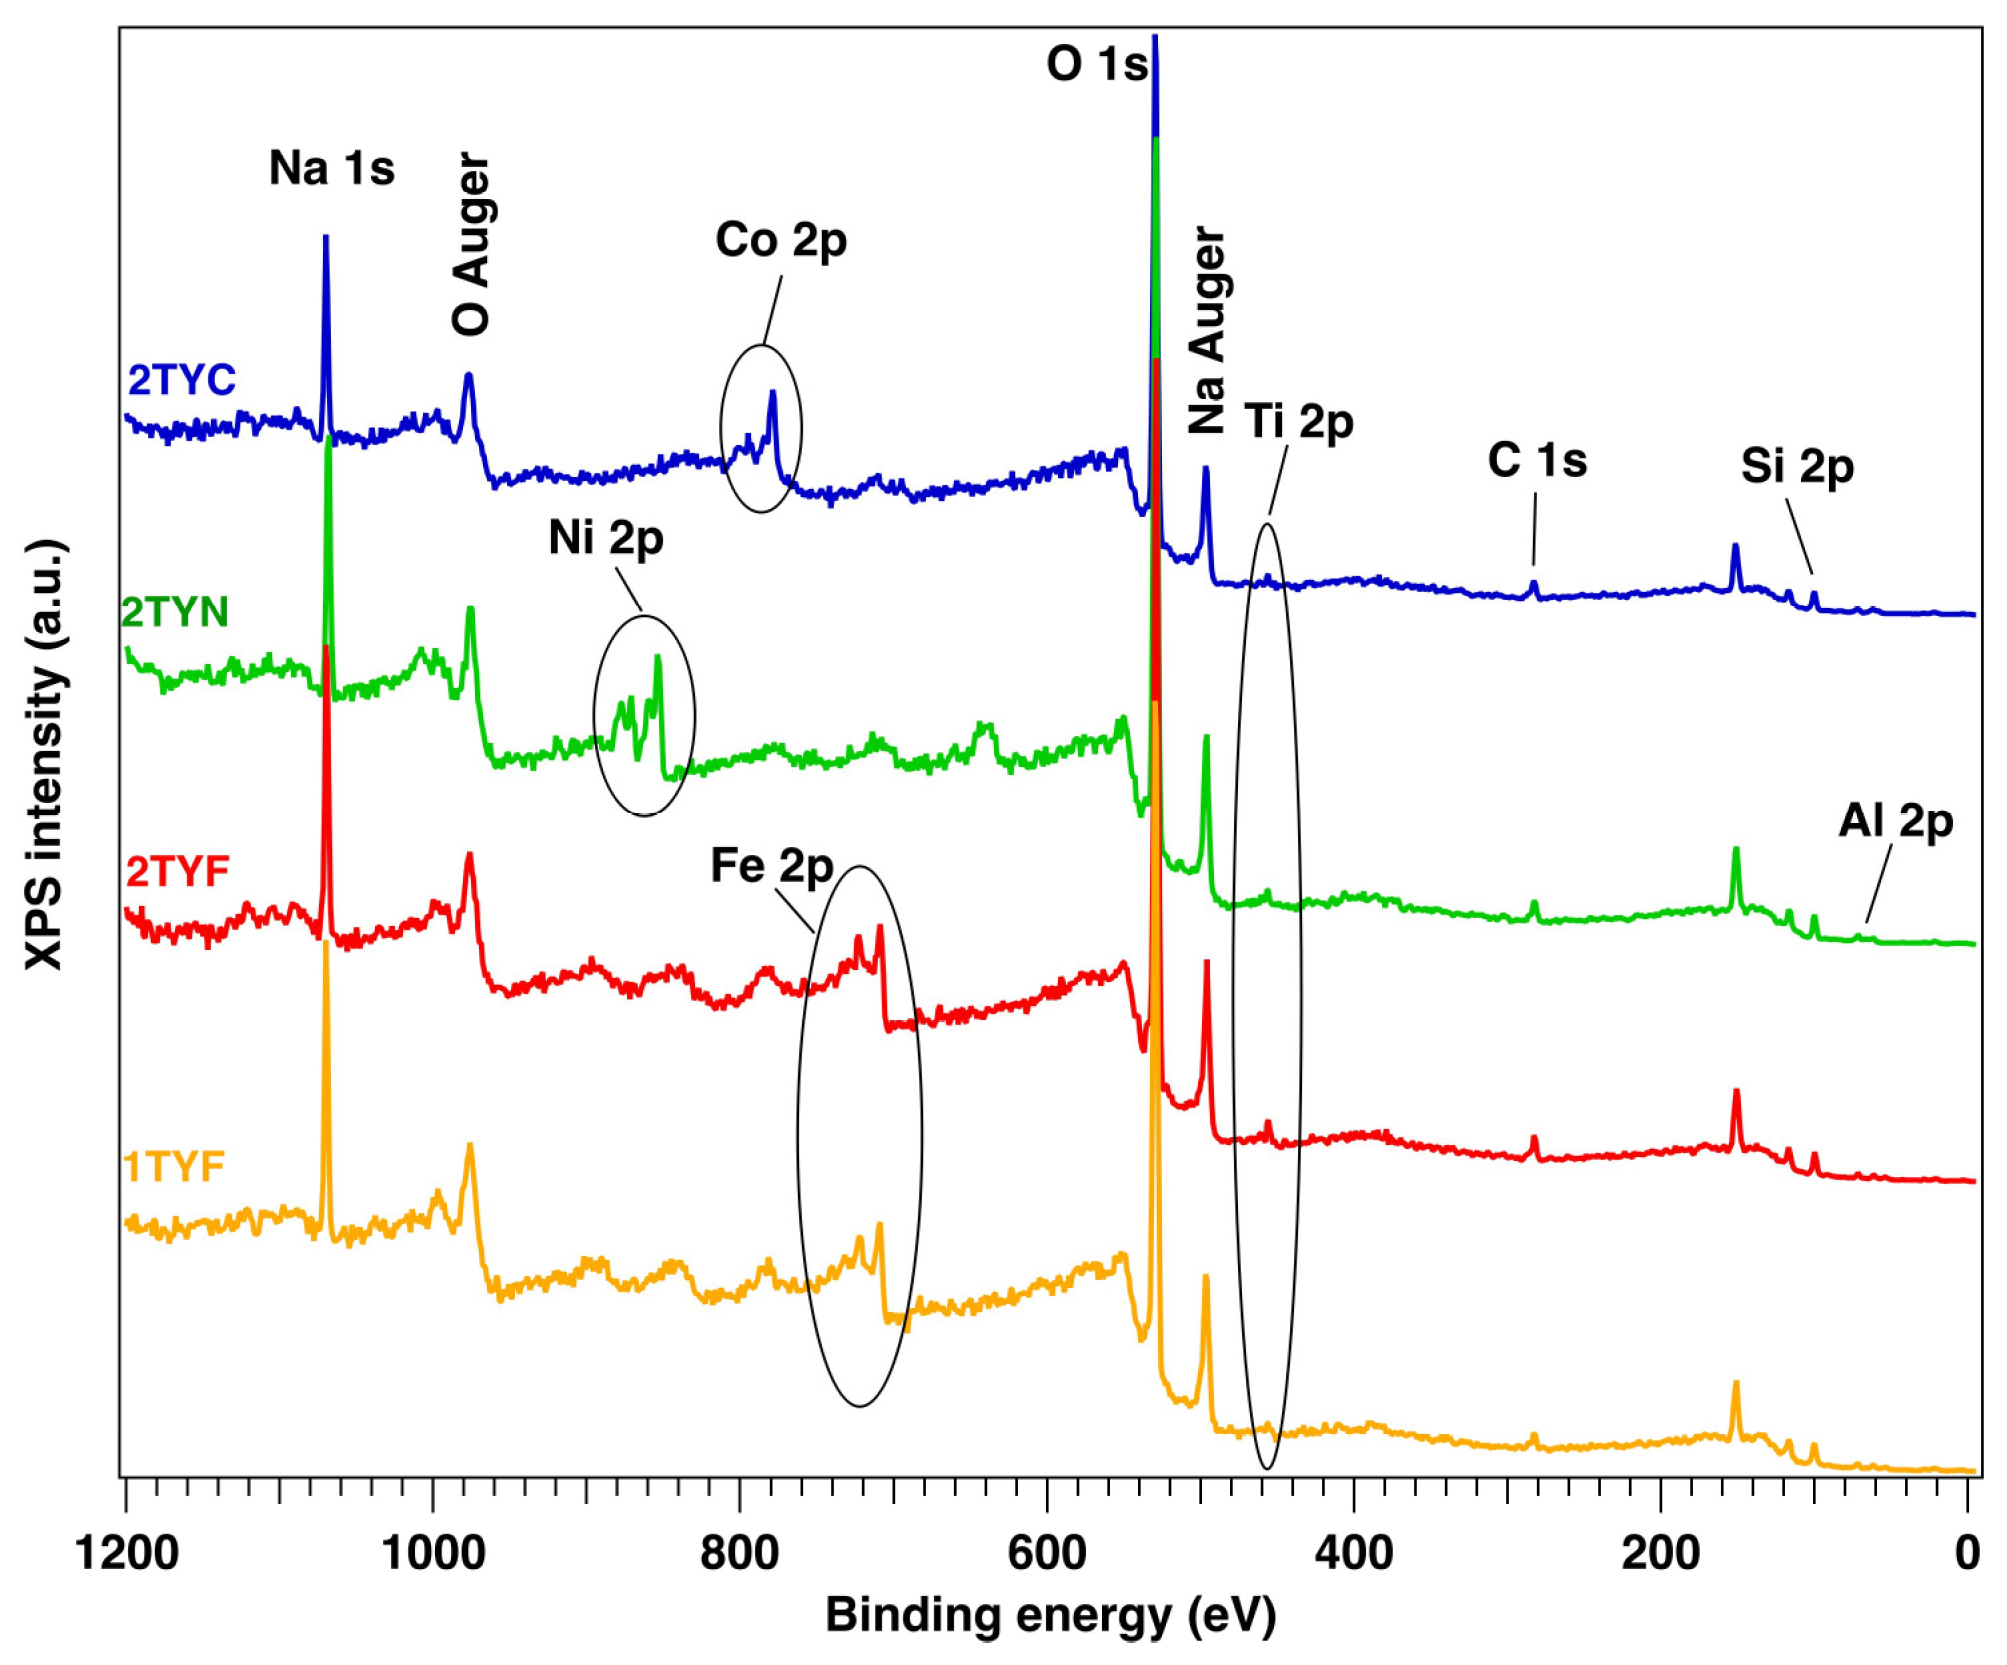
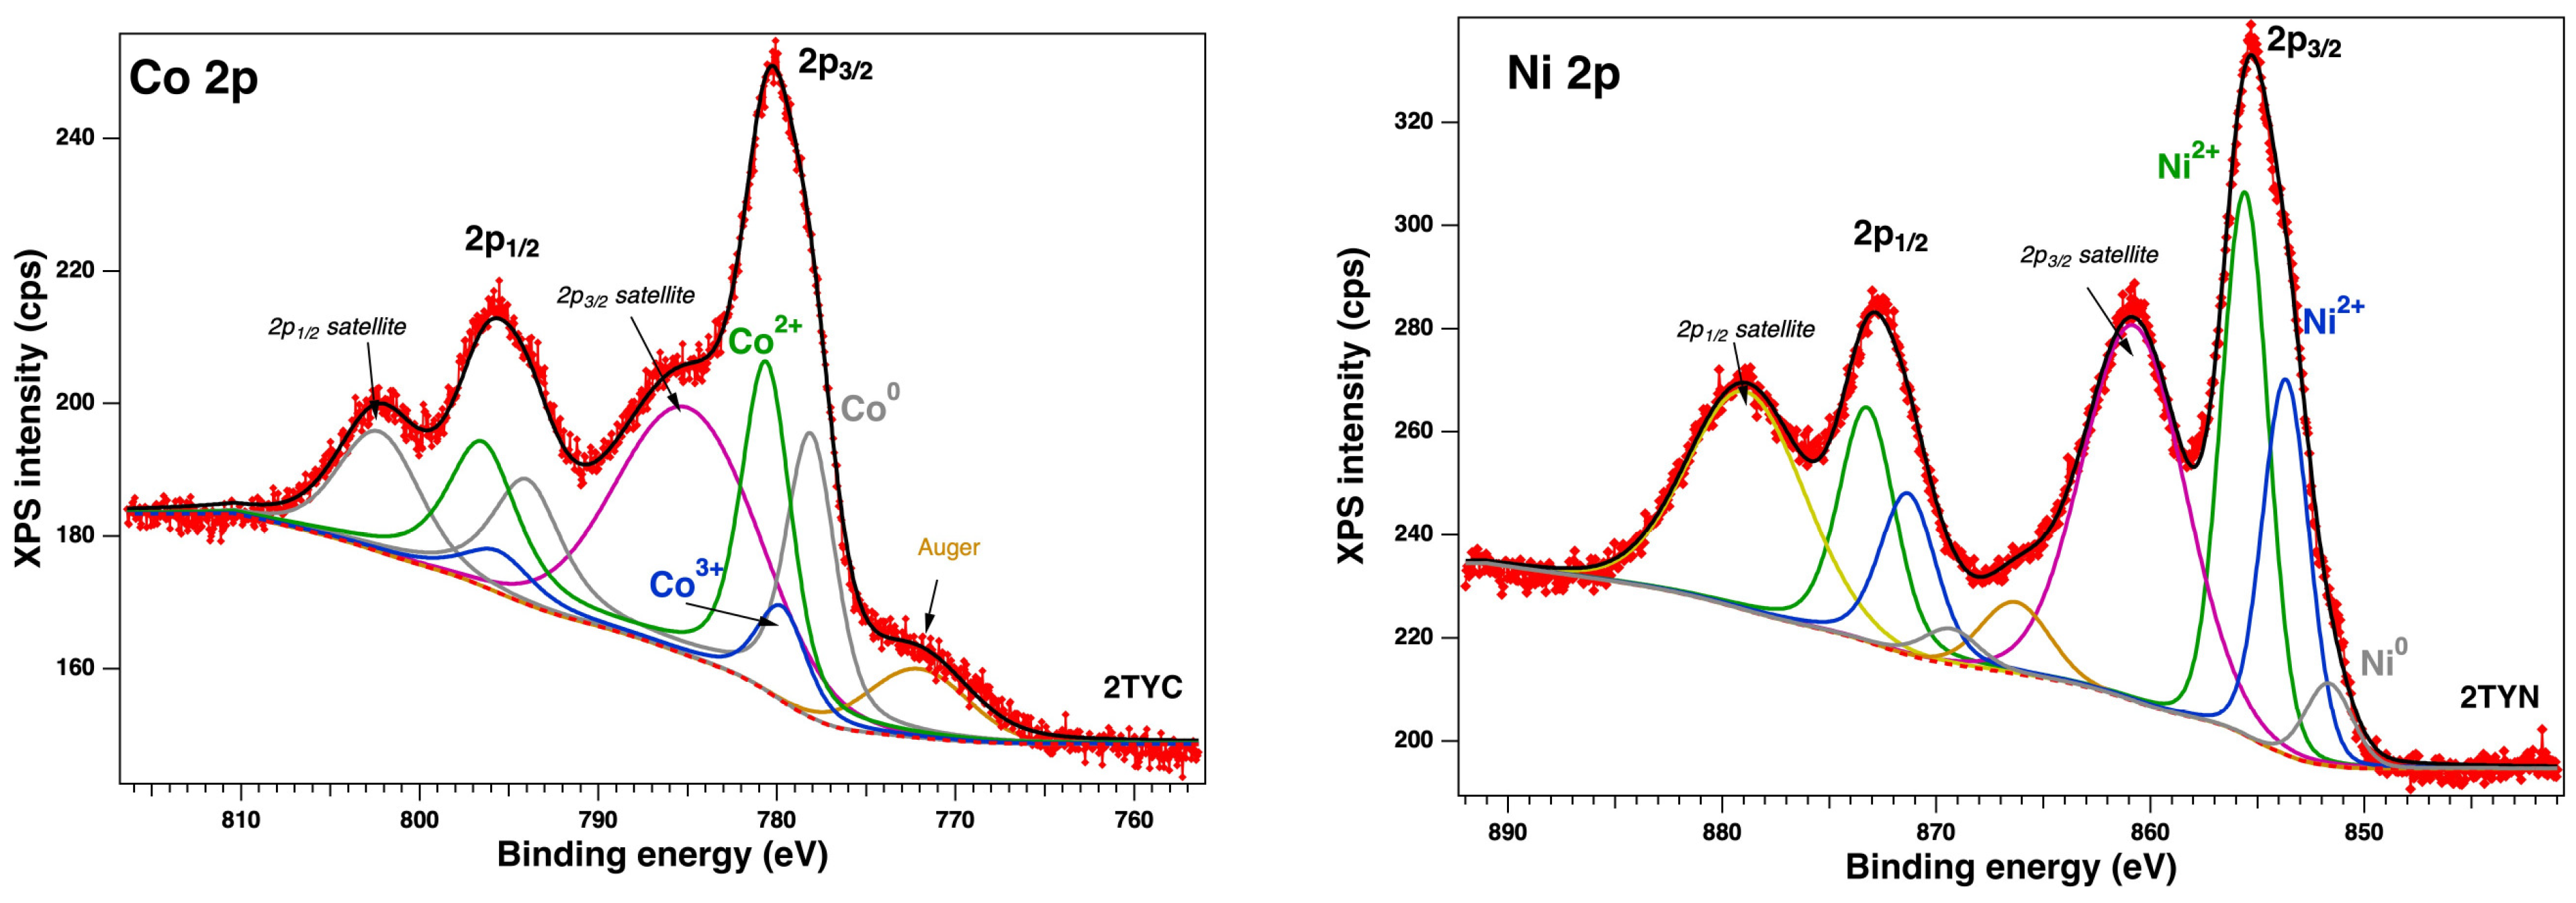
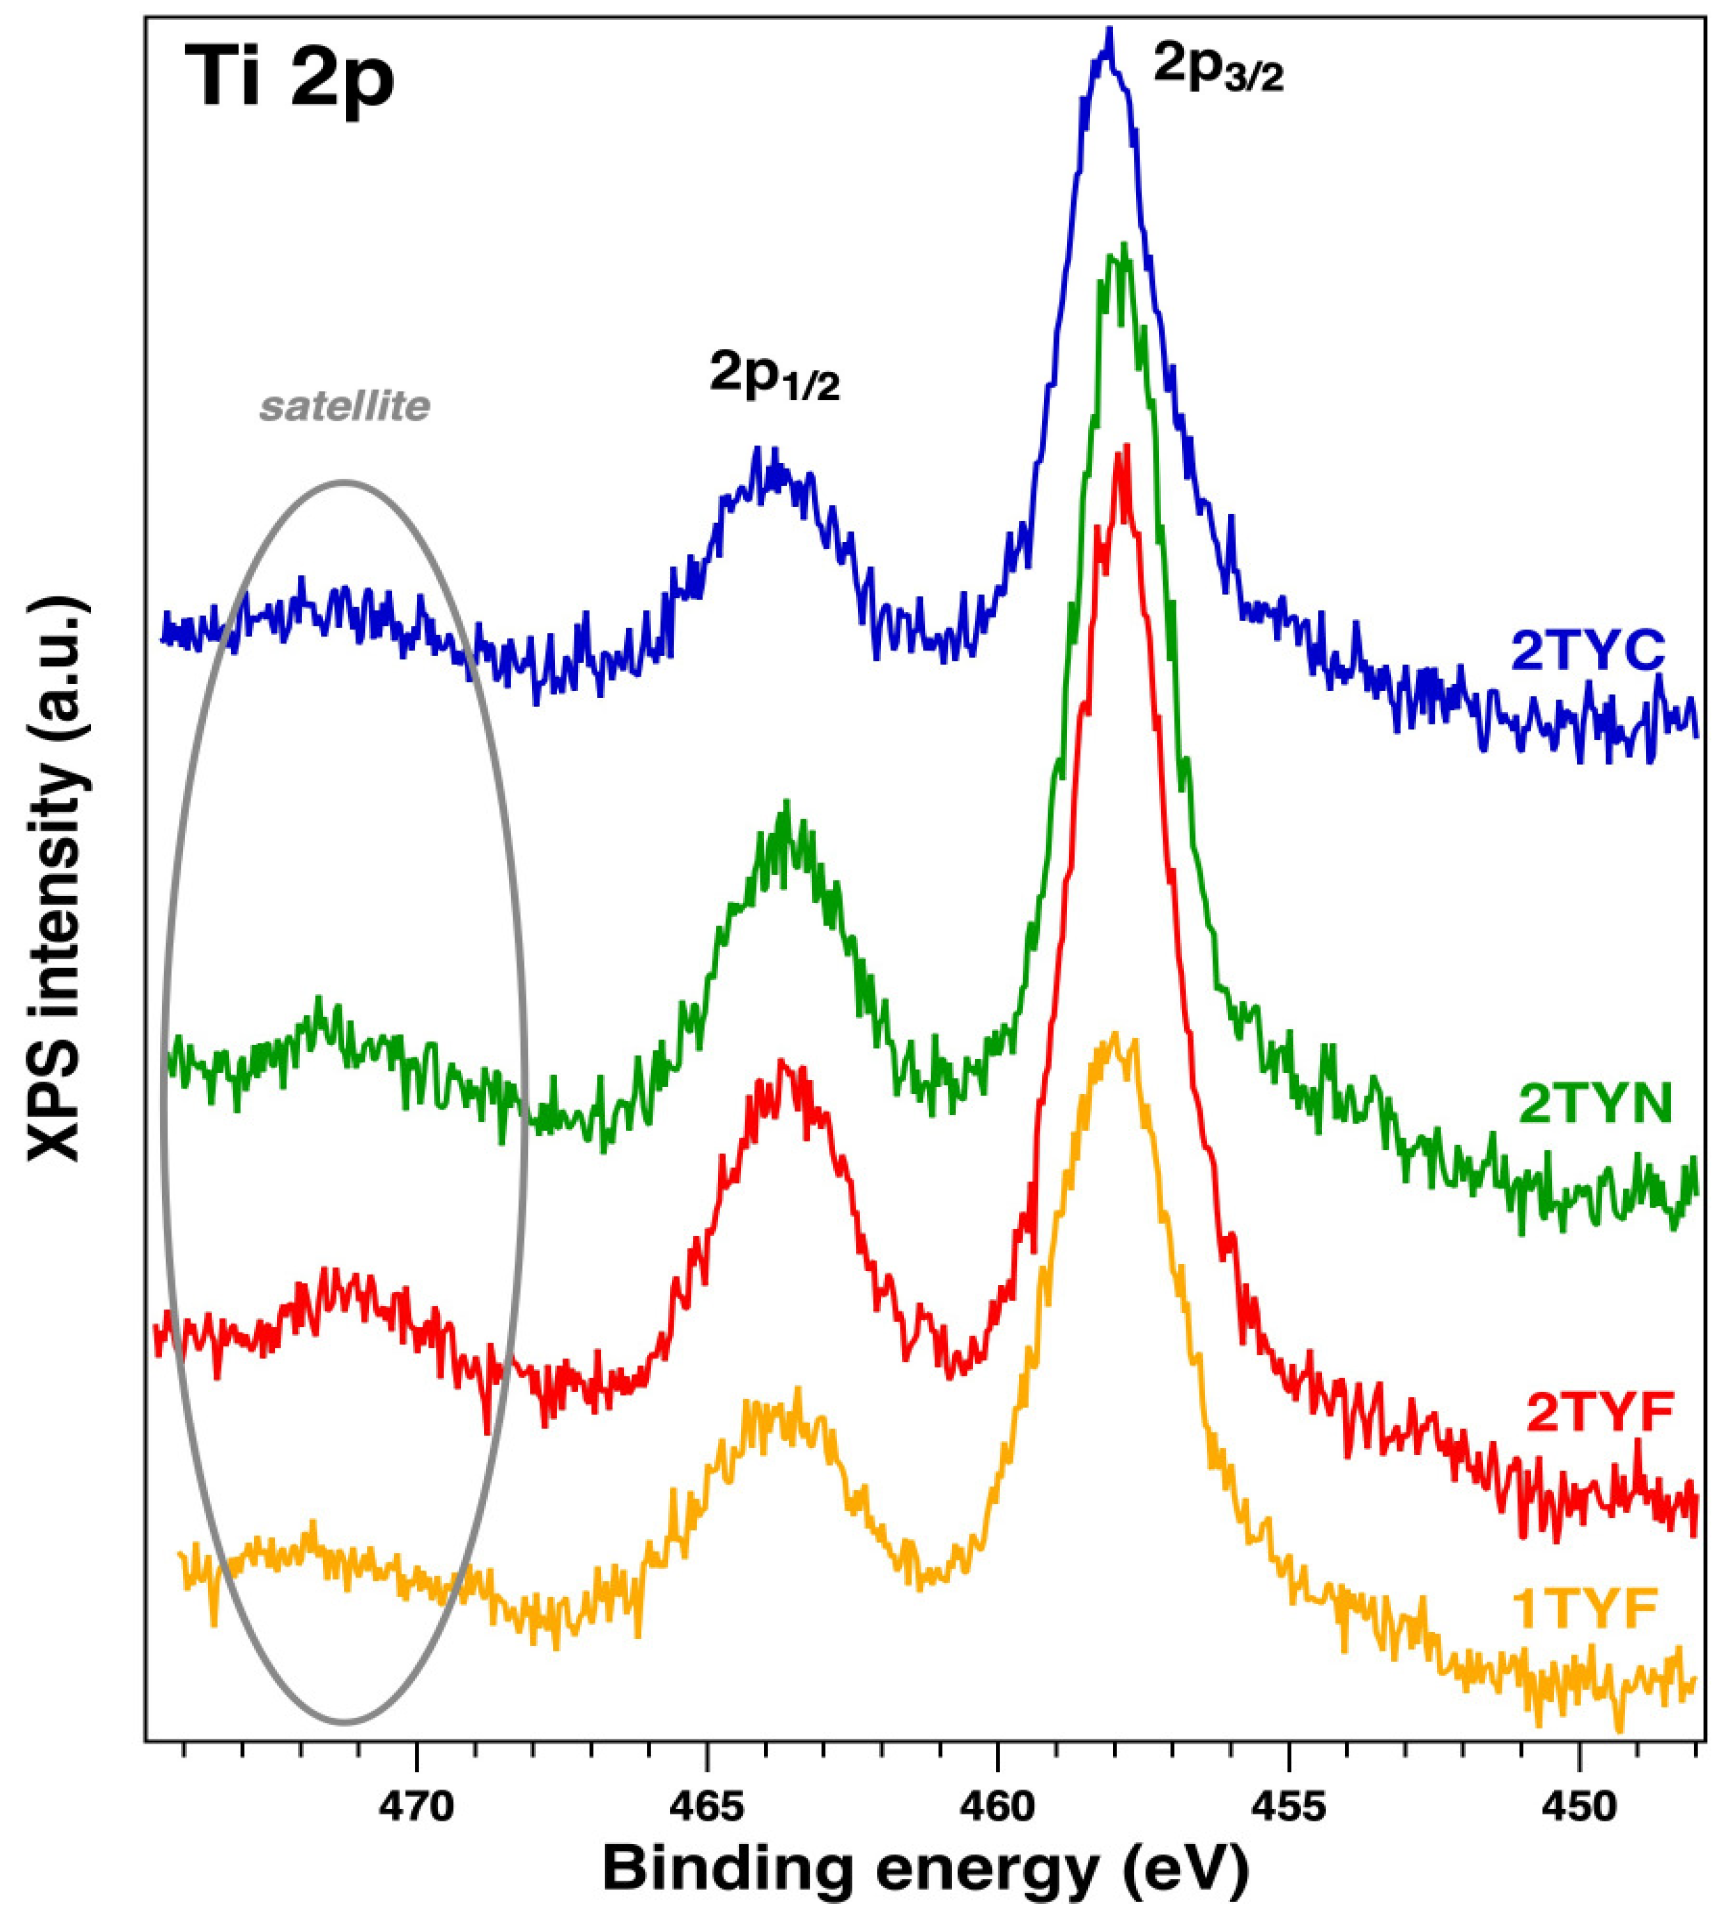
2.2.1. XPS Spectroscopy

The elemental composition and the chemical states of the sample surfaces were measured by X-ray photoelectron spectroscopy (XPS). The binding energies scale was calibrated to the standard value of C 1s, 284.6 eV. The core-level spectra were analyzed using Voigt profiles based on the methods described in ref. [48]. Thus, each component has its own background and could provide supplementary information [49,50]. The XPS survey (Figure 6) shows the following core levels: O 1s, Si 2p, Al 2p, Na 1s, C 1s, Ti 2p, Co 2p, Ni 2p, and Fe 2p. The analyzed fitted spectra of Fe 2p, Co 2p, and Ni 2p (Figure 7 and Figure 8) revealed the coexistence of different chemical states of each metal.
Unfortunately, it is known that Fe 2p, Co 2p, and Ni 2p core-level spectra are complicated peaks due to the overlapping photoelectron lines, their satellites, and Auger lines in the spectrum. Thus, we extracted the surface chemical species by fitting the data with Voigt profiles [32] while using a Shirley background. The samples with Fe 2p showed up in three chemical states (Figure 7), according to the database: metallic (~707 eV), Fe2+ (~709 eV), and Fe3+ (~709.5 eV) [51]. Also, Co 2p presents (Figure 8) three main components and their satellites at binding energies (BE) of ~778.2 eV, 779.7 eV, and 780.5 eV, attributed to the metal, 3+, and 2+ chemical states [32,52,53] with a spin–orbit splitting of ~15.8 eV. The Ni 2p core level is illustrated in Figure 8, and the fitting revealed the coexistence of two chemical states: Ni0—851.7 eV (a small amount), Ni2+—853.7 eV (NiO), and 855.6 eV (Ni(OH)2), according to the tabulated data [54]. The spectra of Ti 2p for all samples show a main component at ~458 eV attributed to Ti4+ (see Figure 9). This attribution is also supported by the presence of the satellite at 471–472 eV [55]. Also, it can be seen from the different intensities of Ti 2p that this could be related to the interaction with the dopants.
The presence of titania in the synthesized materials was also confirmed by X-ray fluorescence. In the samples with lower titanium content, the percent of titania varied like this: 1.13% (1TYF), 1.11% (1TYC, 1TYN). For higher Ti content, the percent was 2.53 for 2TYF, 2.30 for 2TYC, and 2.54 for the 2TYN sample. The EDX results obtained for the first three samples are presented in Table S1. The dispersion of Fe, Co, and Ni oxides on Ti-containing zeolite Y crystals was evidenced by STEM microscopy (Figure S4). The images evidenced a good dispersion of the oxide nanoparticles on the surface of the support crystals.

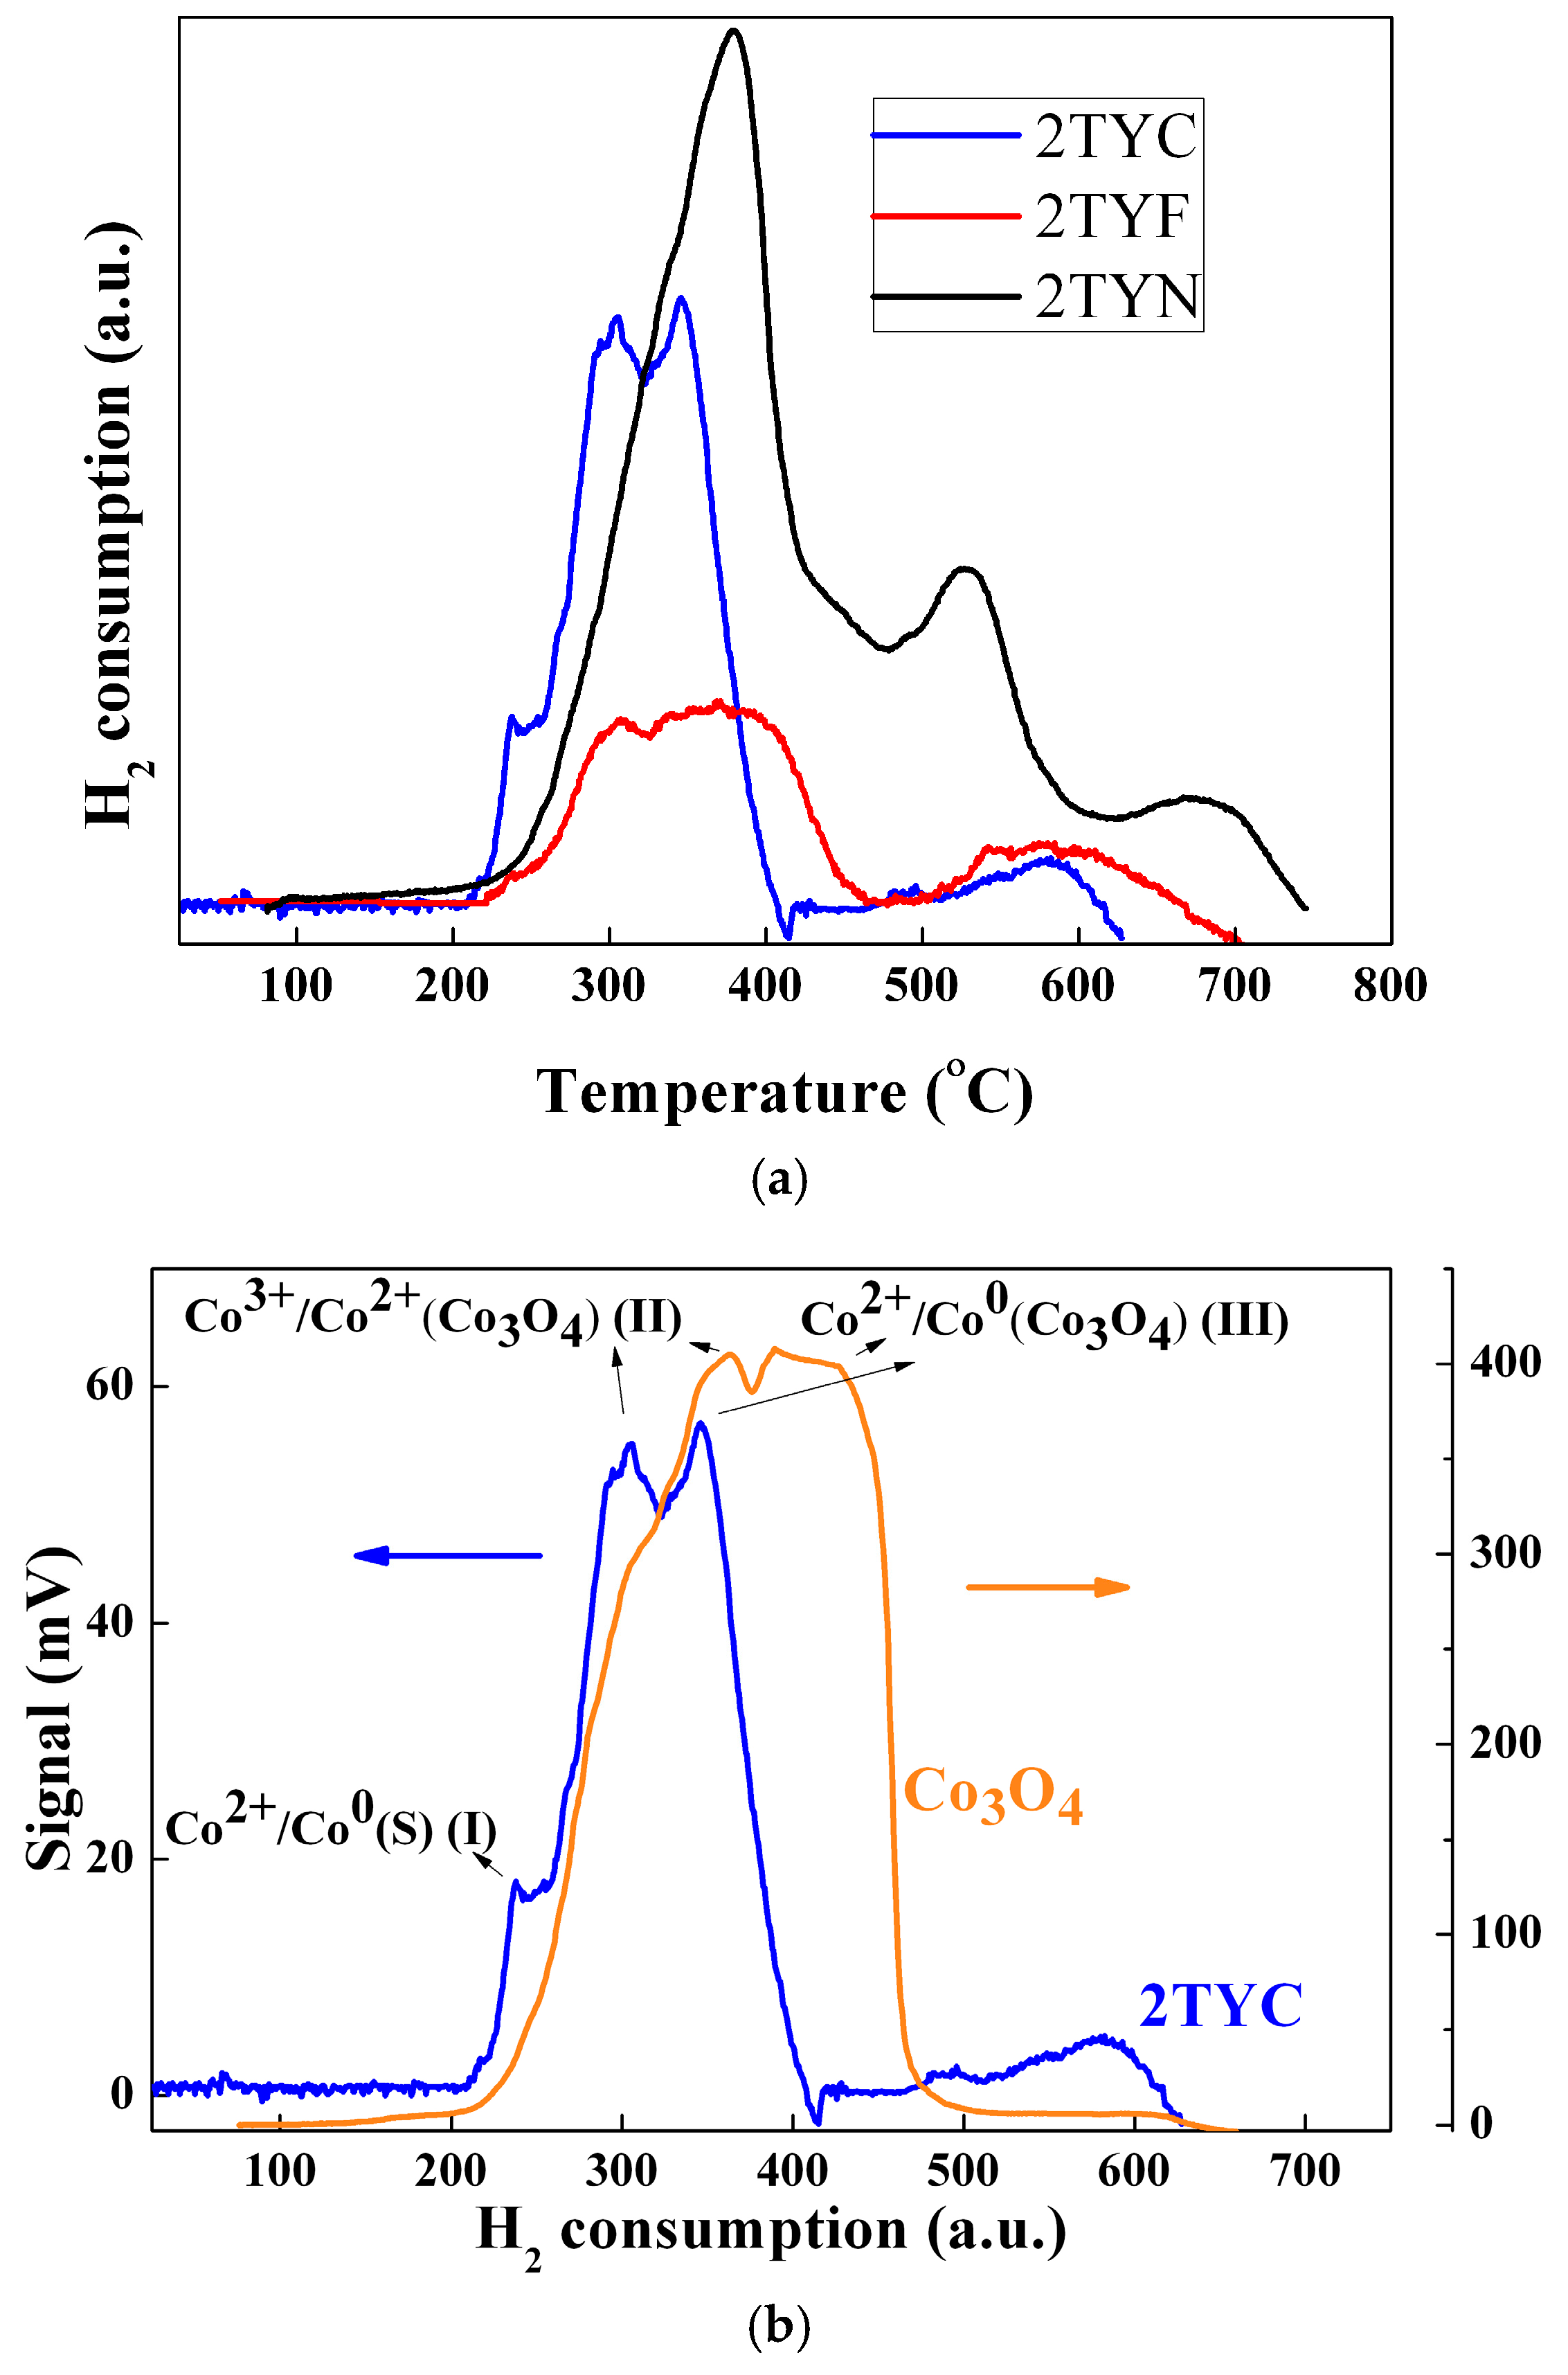
2.2.2. H2-Thermoprogrammed Reduction

The H2-TPR results illustrate a significant effect of metal oxides’ interaction with the support. Thus, Fe, Co, and Ni cations were immobilized as oxide species on zeolite Y support, with tetrahedral Ti4+ isolated into the network. Under these conditions, the oxide species of these cations in the mass concentration of 5% can disperse on the surface or locate inside the supercages of the zeolite Y.
The location of the oxide species influences the interaction with the support and, hence, their reduction temperature. Also, the interaction with Ti cations, especially in the case of the isolated oxides of these transition metals from channels or cages, influences the reduction in temperature. Figure 10 depicts H2-consumption profiles for samples obtained by immobilization of Fe, Co, and Ni on zeolite Y support with 2% TiO2. The reduction profiles obtained for the Ni/Ti-zeolite Y photocatalyst (Figure 10a) present one main peak with a maximum at ~378 °C and a weak shoulder at around 340 °C. The shoulder is due to the reduction of free NiO species, and the peak is associated with the reduction of NiO in weak interaction with the zeolite support [56,57]. The other two peaks of lower intensity, at ~524 °C and 667 °C, suggest the presence of different types of NiO species in stronger interaction with the zeolite support. The XPS results (Figure 8) confirm the presence of Ni2+ species on the zeolite surface for this sample.
The reduction profile for 2TYF material, obtained by immobilizing iron oxide species on zeolite Y with 2% TiO2, shows (Figure 10a) a little shoulder at 240 °C and two overlapping peaks with maximums at around 310 °C and 380 °C that can be connected to the conversion of Fe2O3 to Fe3O4 [58,59]. The first peak can be attributed to the reduction of the isolated Fe3+ species to Fe2+ and the second, broader one, to the oxide, which is probably located inside the supercages by different coordination with the framework oxygen atoms [60,61]. The last broad peak at around 600 °C can be related to the conversion of Fe3O4 to FeO. The iron oxide species that interact more or less strongly with the zeolite support justify this broad peak of the 2TYF sample reduction profile. The XPS spectra (Figure 7) of samples 1TYF and 2TYF indicate the presence of Fe2+, Fe3+, and also Fe0 on the surface. The fact that part of the iron species is already reduced to Fe2+ and their reduction to Fe0 can take place at higher temperatures (around 800 °C) justifies the reduced volume of hydrogen consumed compared to 2TYN (Figure 10a).
For the 2TYC sample containing supported cobalt oxides, reduction peaks were obtained at ~240 °C, 300 °C, 350 °C, and 580 °C. Compared to the pristine (Figure 10b), two reduction peaks were detected for pure Co3O4, at around 360 °C attributed to the reduction of Co3+ to Co2+ and at ~450 °C corresponding to the reduction of Co2+ to Co0 [62,63]. These peaks are shifted, for sample 2TYC, to lower temperatures (300 °C and 350 °C). Due to the dispersion on the support, both hydrogen adsorption and its interaction with the oxide species are favored. The XPS results (Figure 8) showed the presence of Co2+, Co3+, and Co0 on the surface of the 2TYC sample. The broader peak with a maximum at approximately 600 °C, only for supported cobalt oxide, may be due to a stronger interaction of Co2+ species with the support. In Figure 10, each H2-consumption profile shows a shoulder or a peak between 200 °C and 300 °C. Each shoulder is assignable to the adsorption on the surface of hydrogen. In the case of samples 2TYC and 2TYF, the peak and little shoulder at ca. 240 °C from the H2-consumption profiles can be due to the hydrogen spillover effect. For Fe2O3 supported on ZSM-5 zeolite, the effect of Fe0 and other transition metals on hydrogen atoms’ migration (H2 spillover) and the reduction of oxides were observed [61]. Thus, in the case of 2TYF and 2TYC samples, the spillover effect can be favored by Fe0 and Co0, as evidenced by XPS spectroscopy (Figure 7 and Figure 8), and by Ti4+ from the gel network of the zeolite Y support.

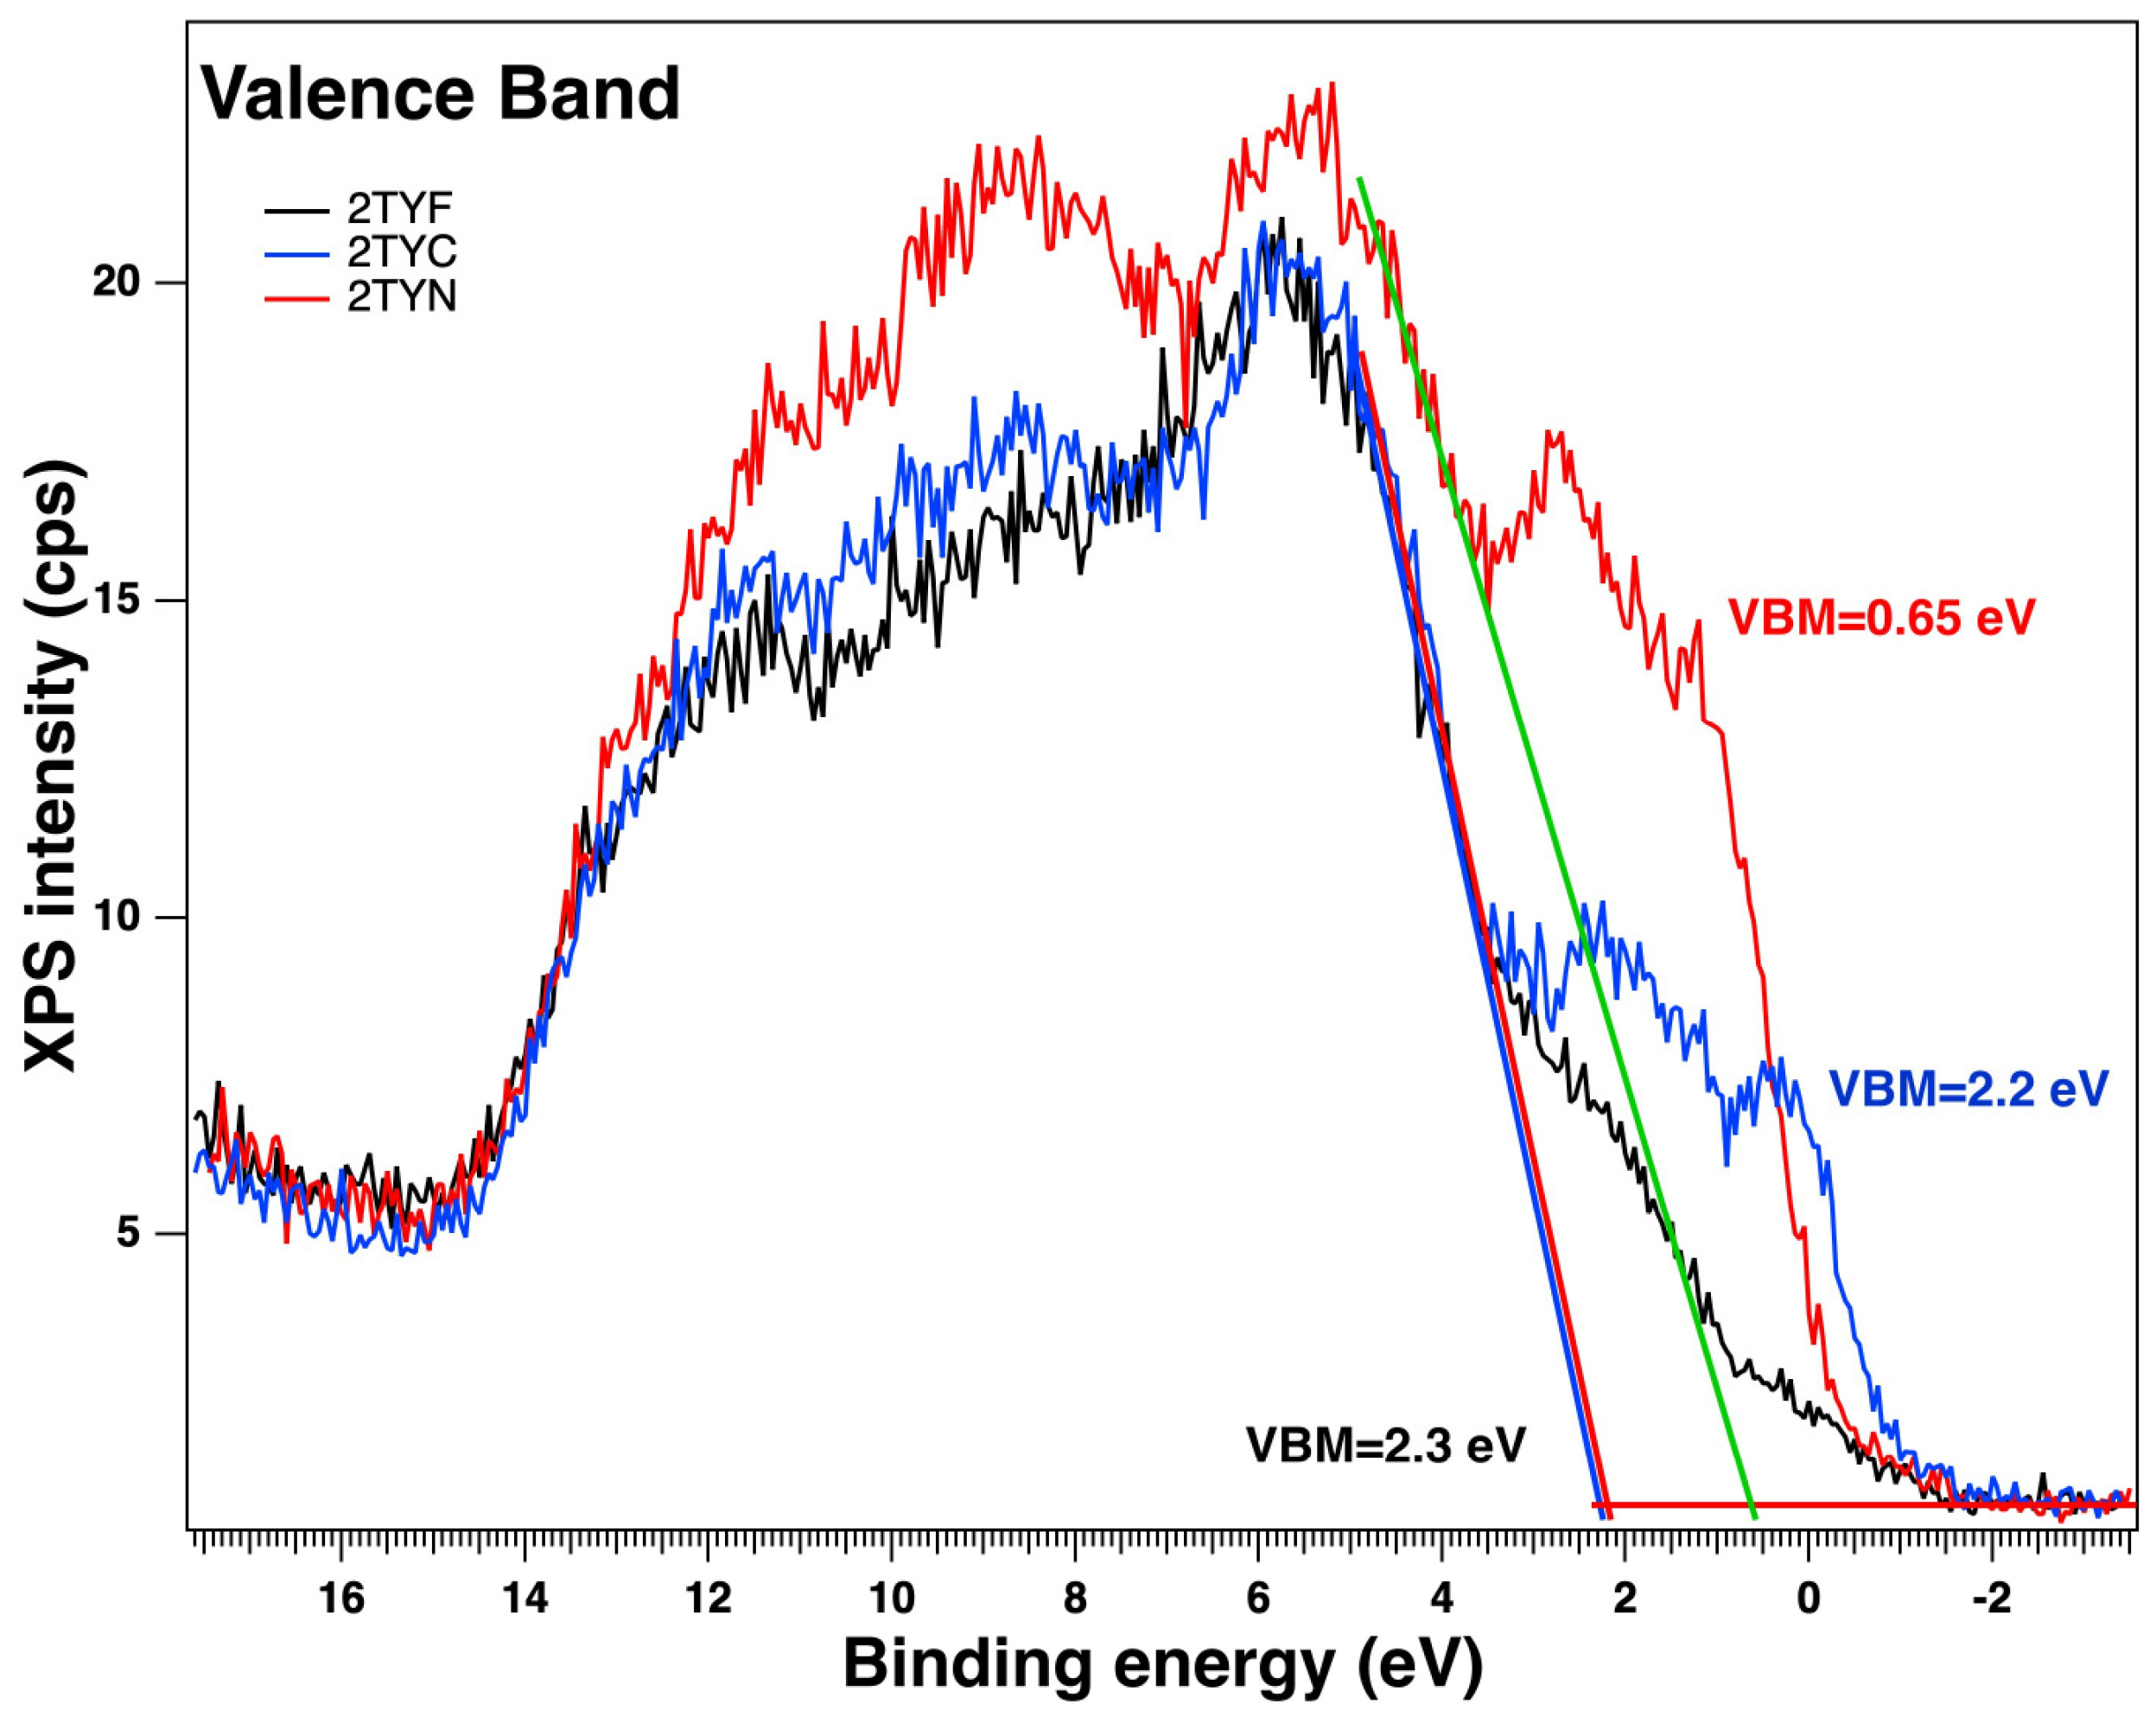
2.3. Optical Properties

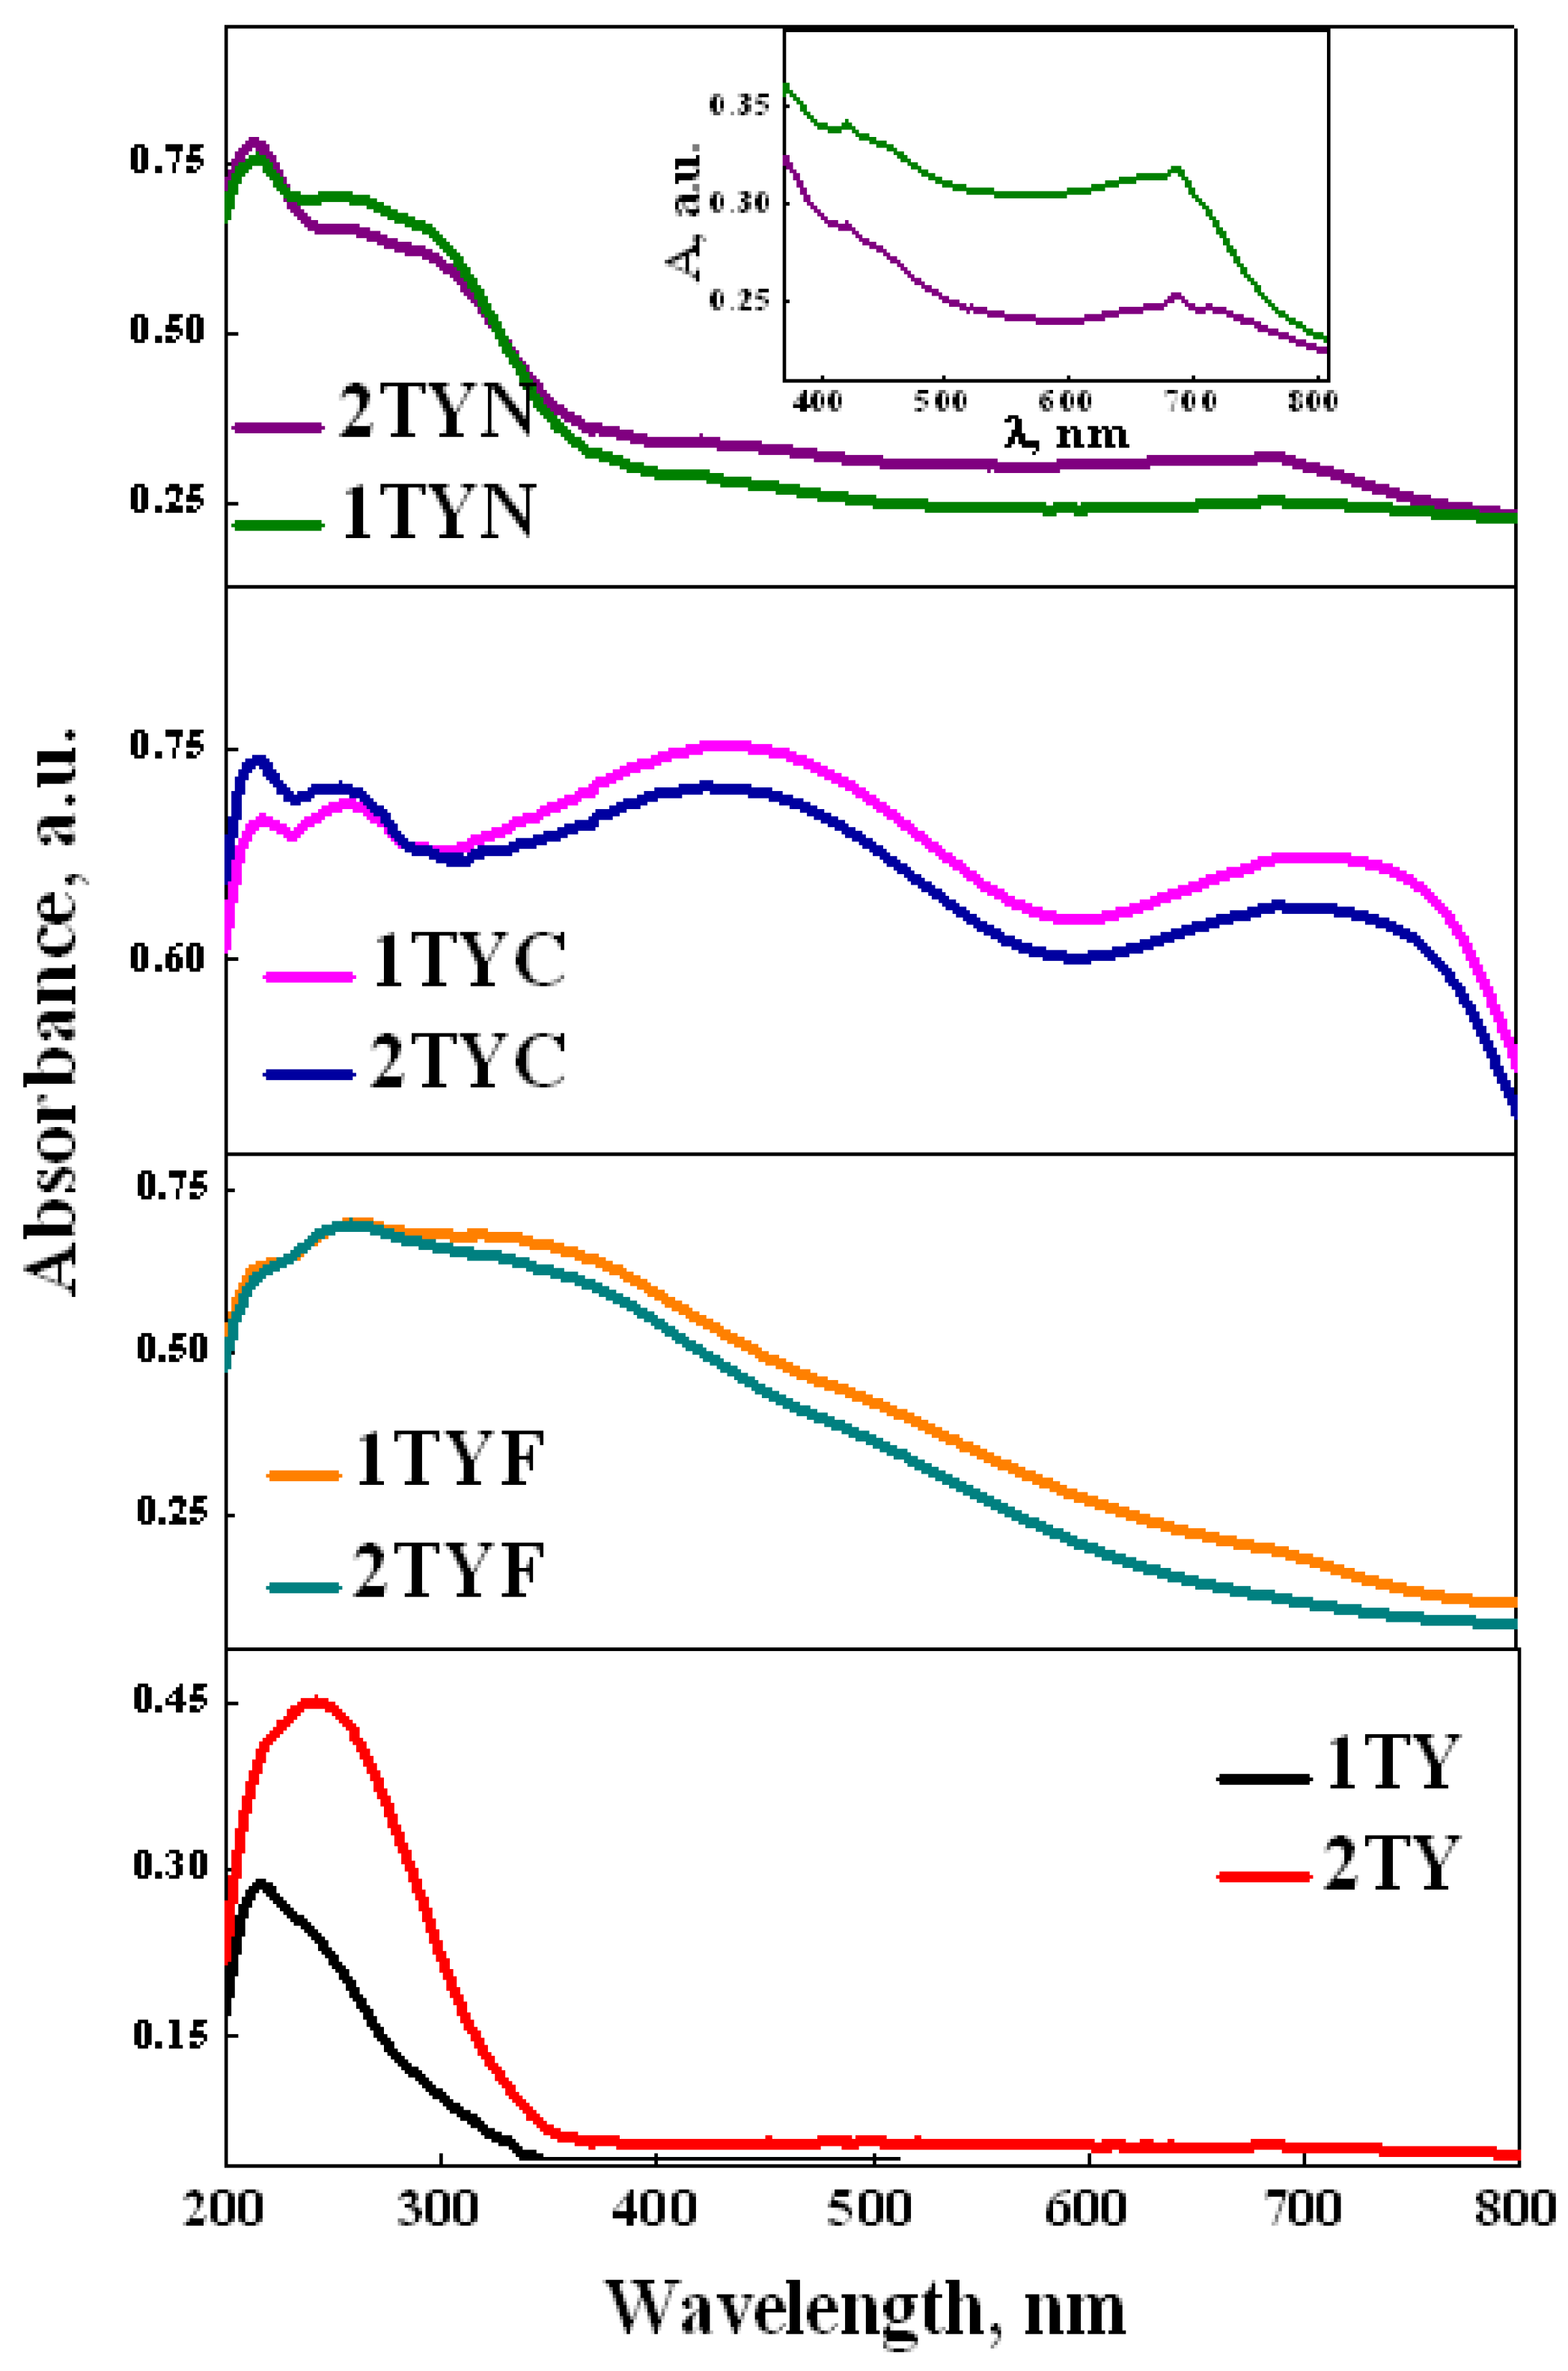
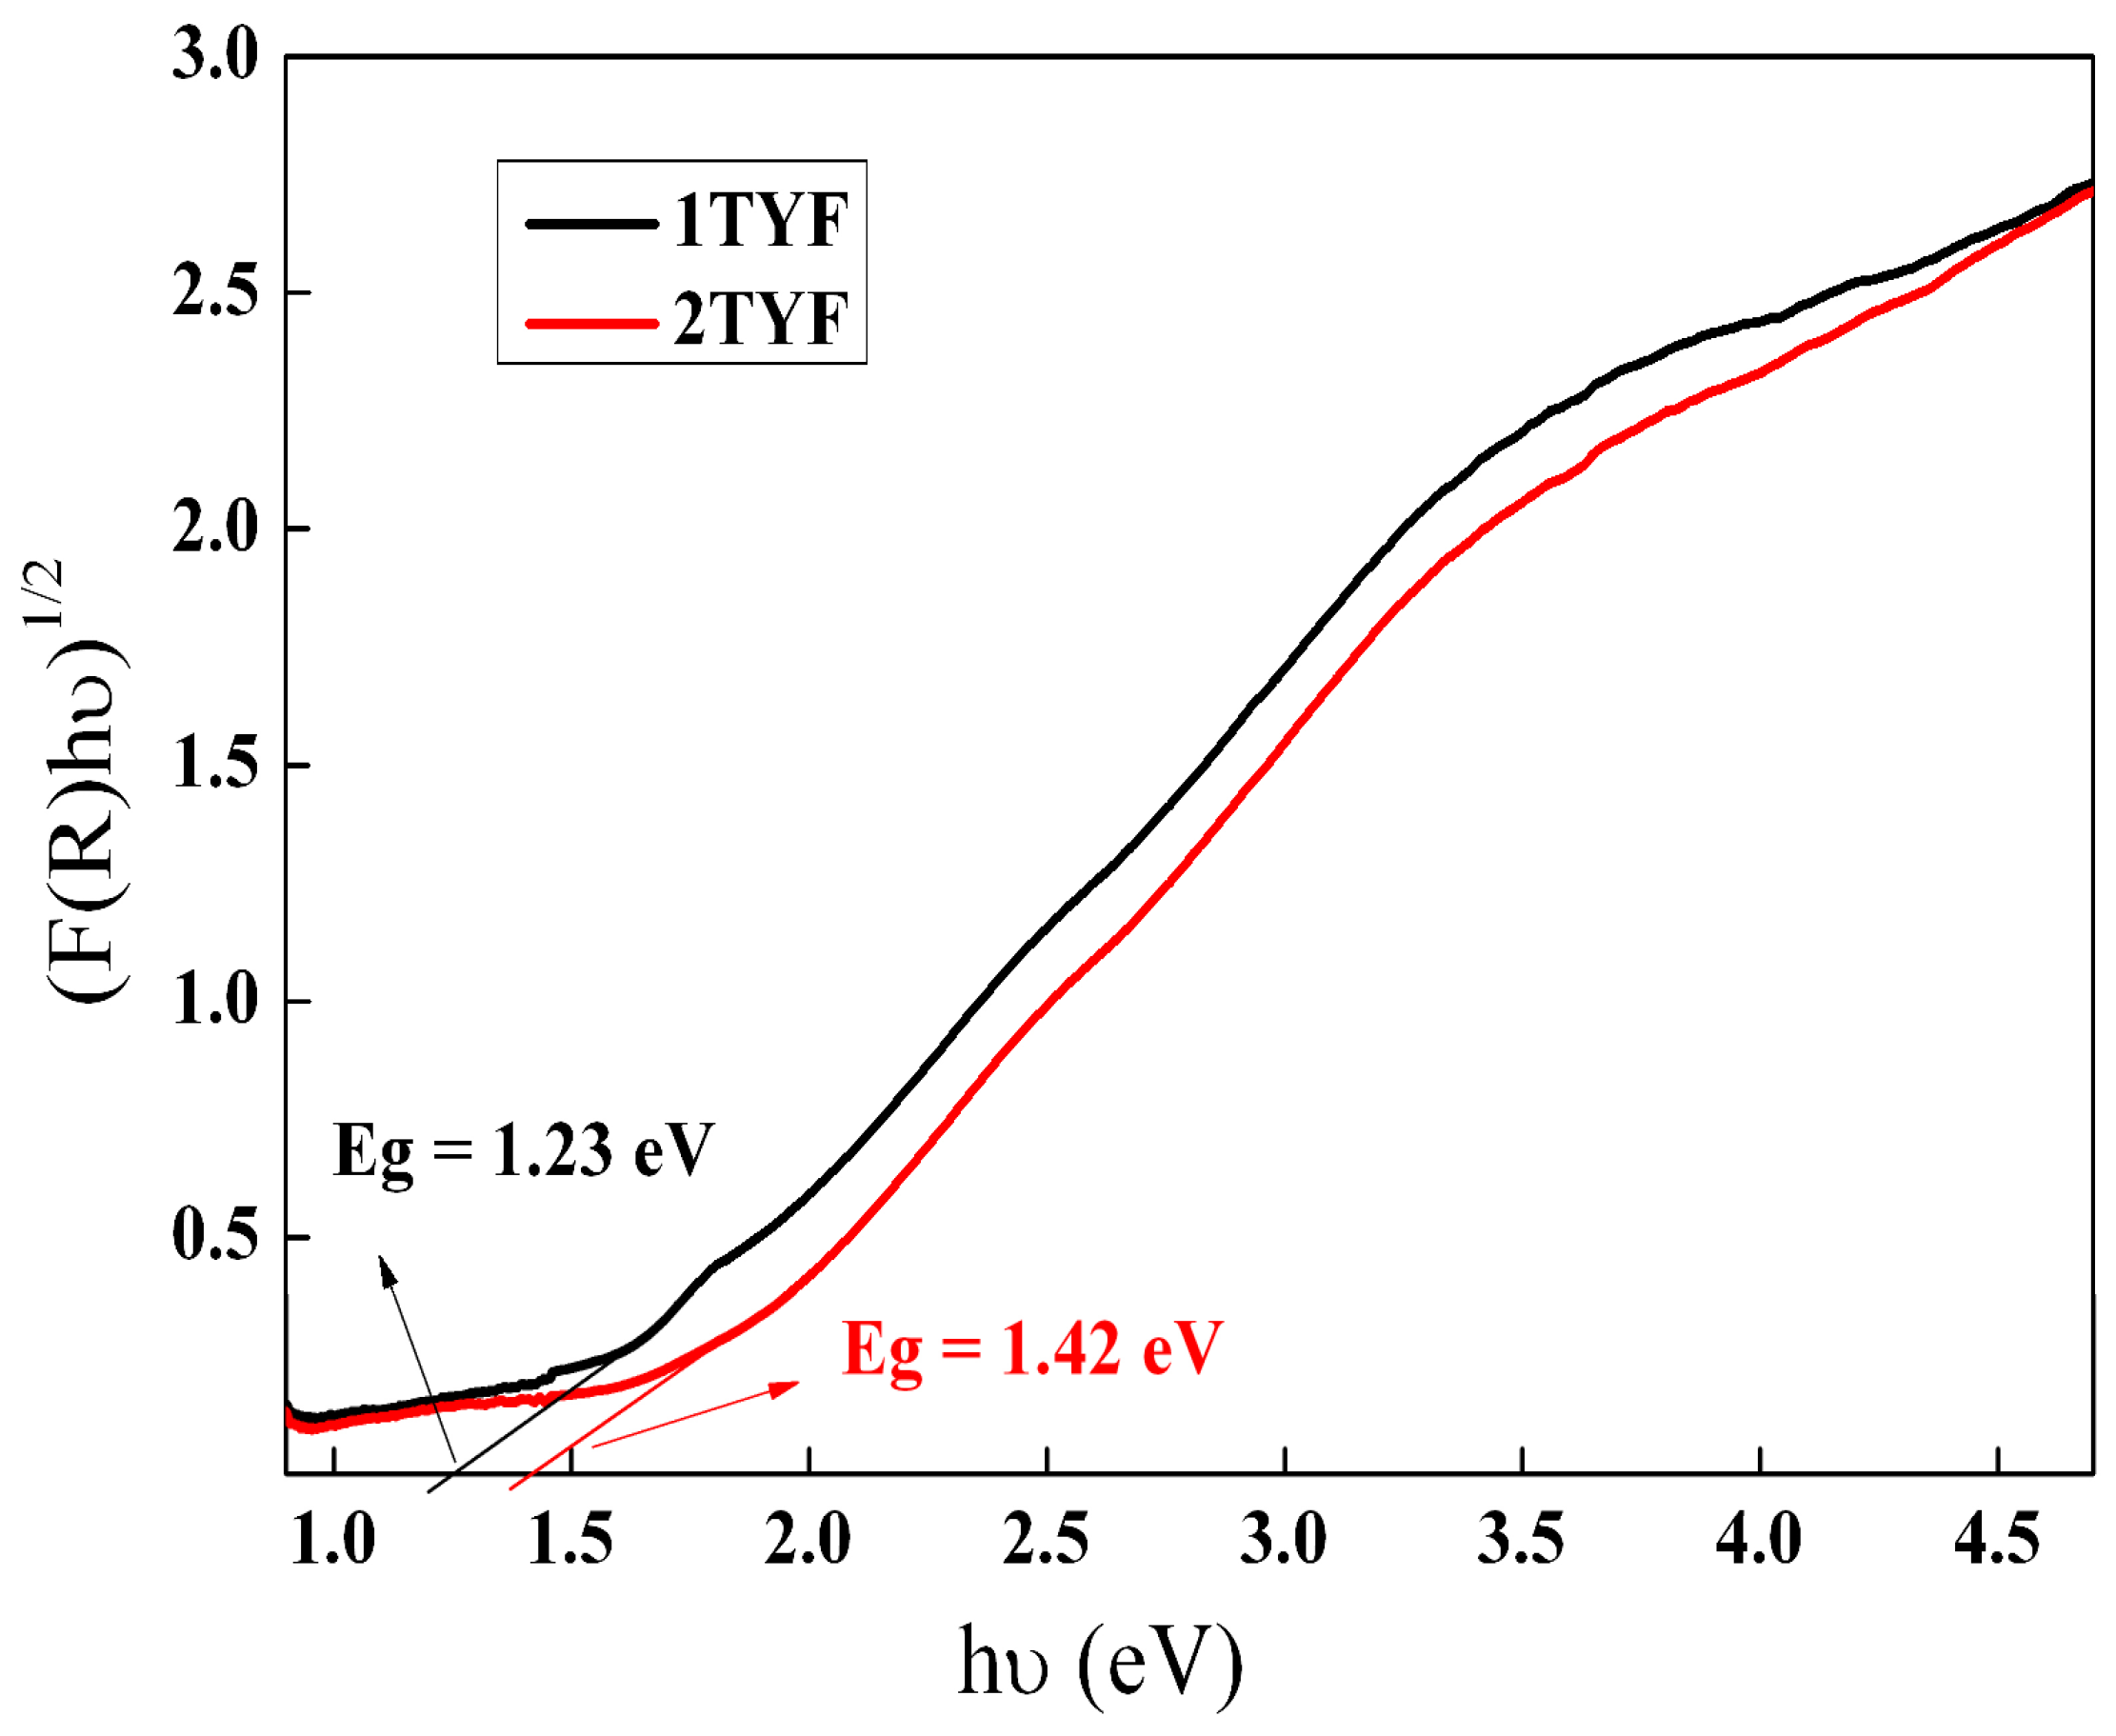
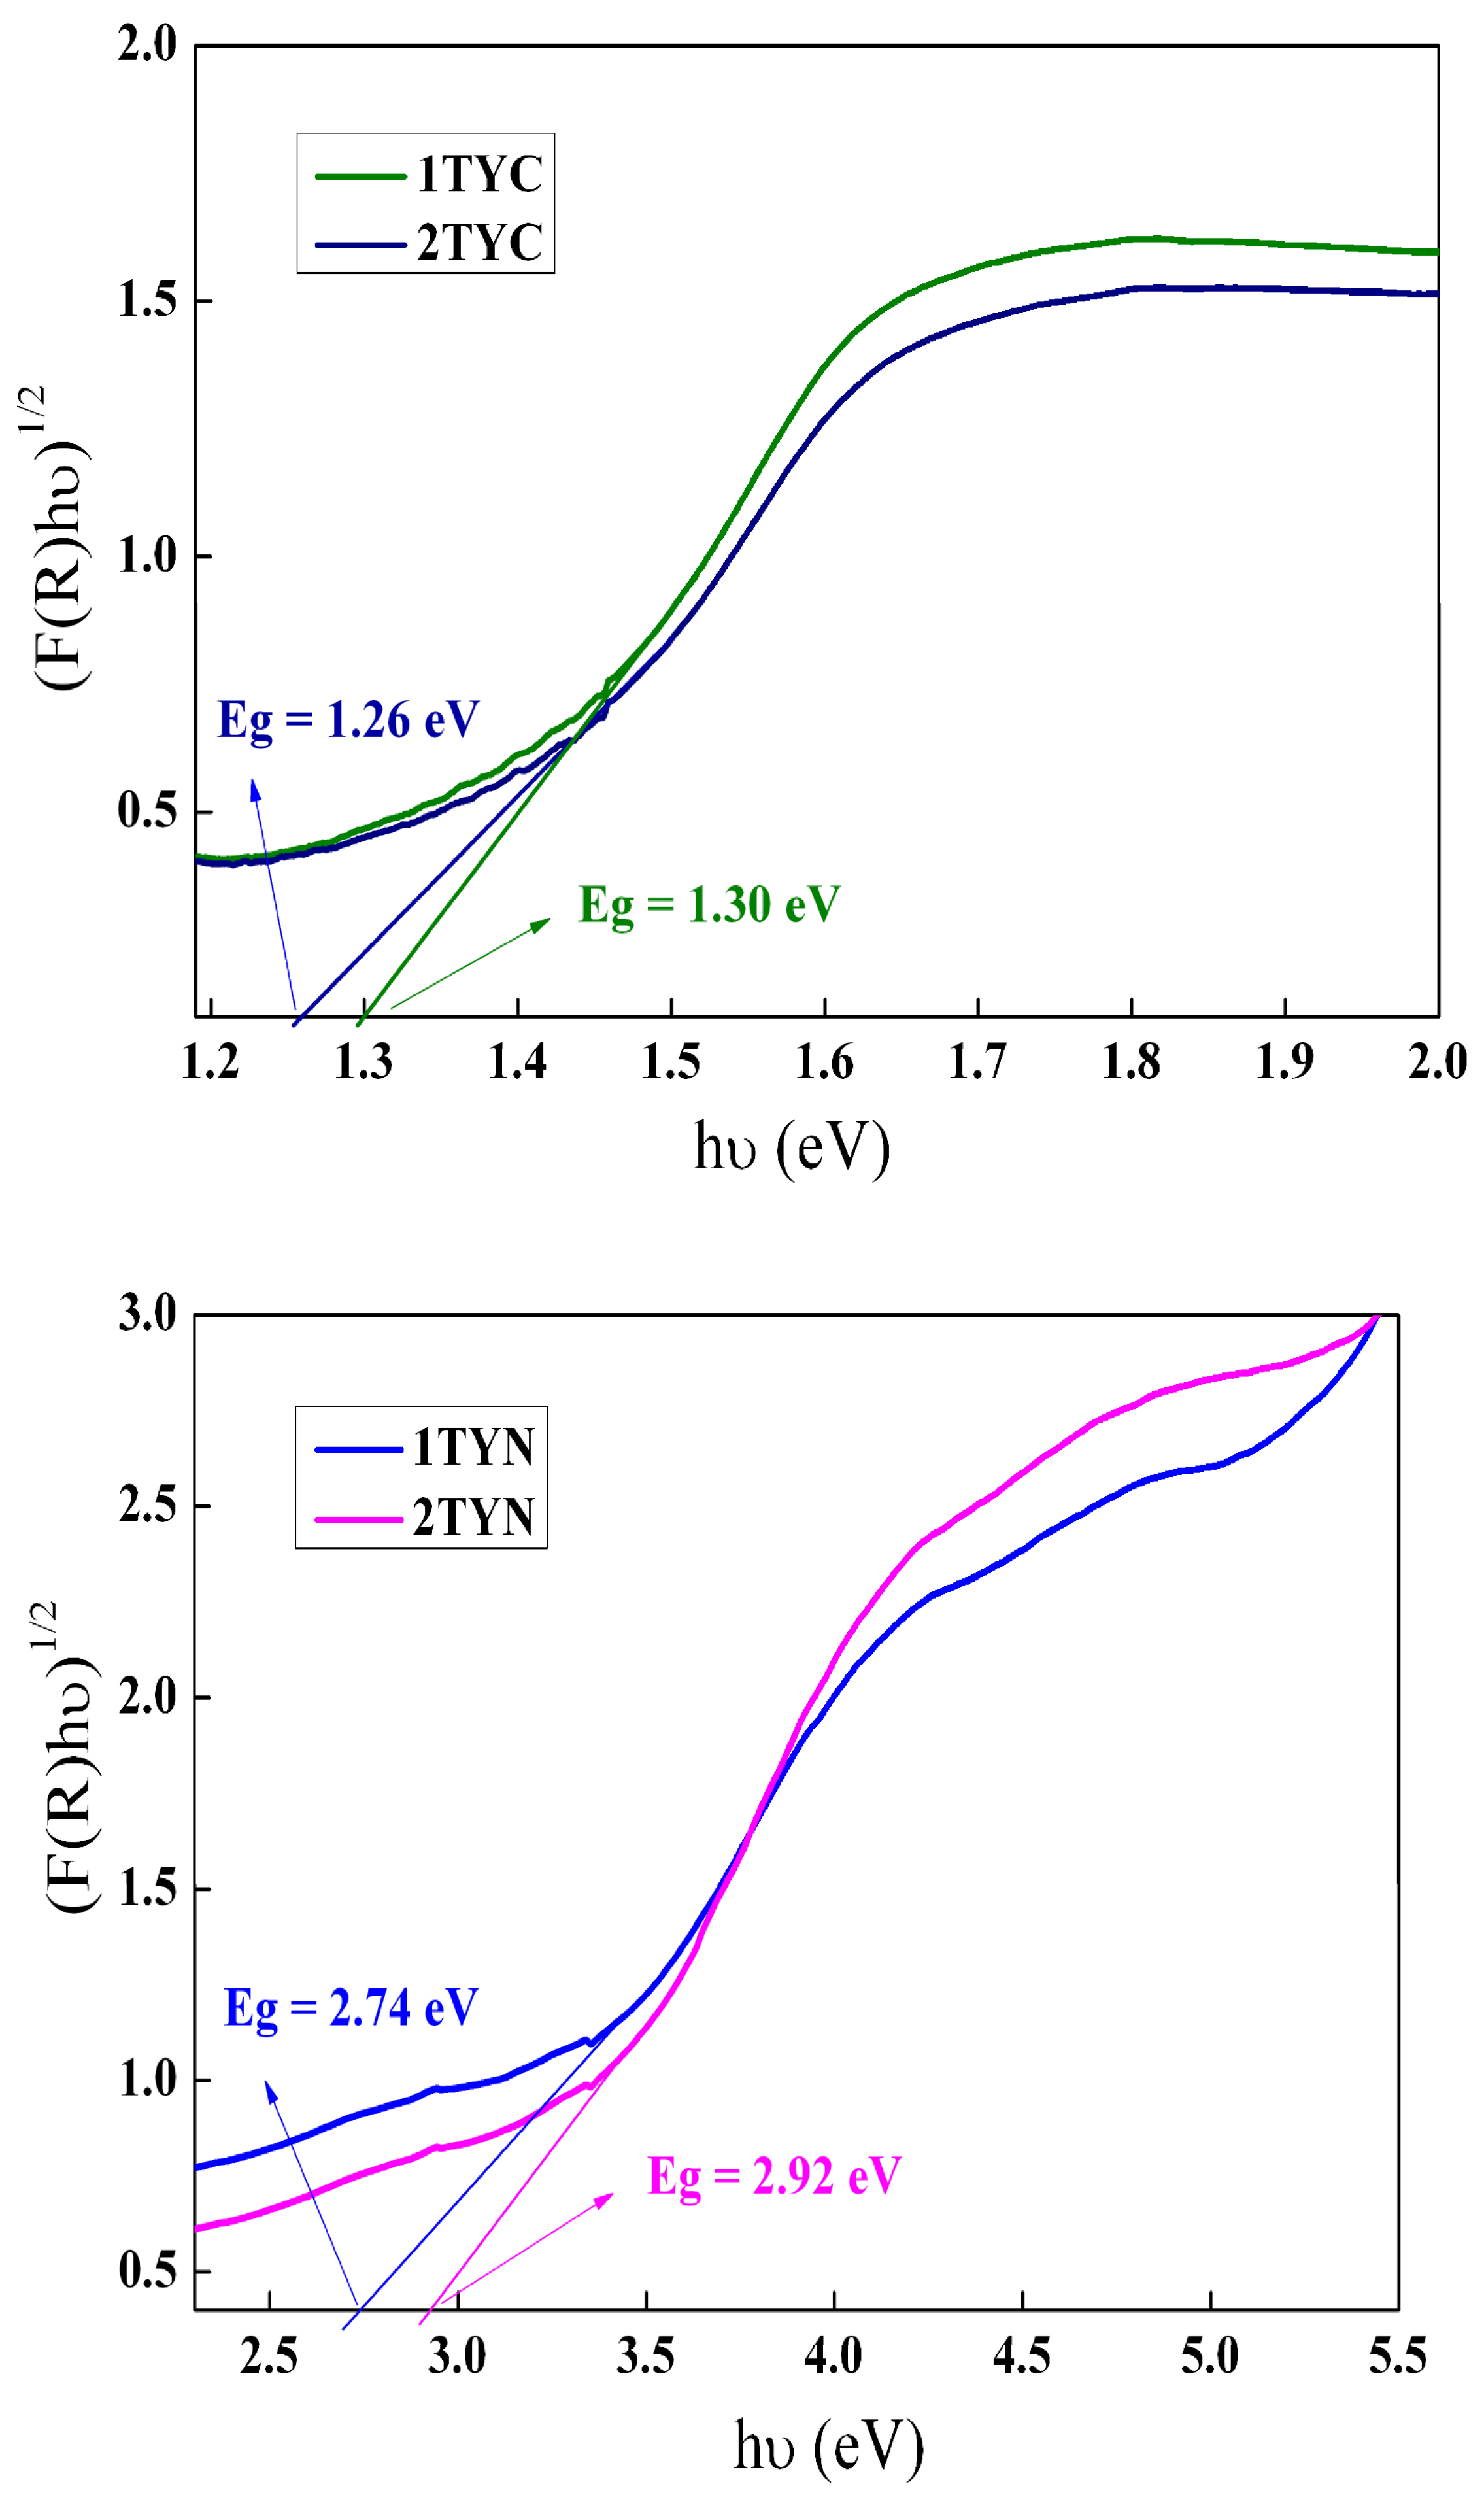
2.3.1. UV–Vis Spectroscopy

The optical properties of the synthesized materials were evaluated by UV–Vis absorption spectroscopy. The recorded spectra are presented in Figure 11 and suggest the successful incorporation of Ti in the aluminosilicate gel framework of zeolite Y. It is supported by the absorption band located at 210 nm, assigned to the ligand-to-metal charge transfer Ti4+O2− → Ti3+O [64].
An additional broad absorption band appeared toward a higher wavelength (250 nm), was more visible for the samples with a higher Ti content (2%), and indicated the formation of extra-framework Ti species [64,65]. The small shoulder, located at 330 nm, is usually assigned to anatase traces. A strong redshift of absorption spectra was observed after iron oxide immobilization, given by the charge transfer of oxygen to octahedral Fe3+ from Fe2O3 nanoparticles. In addition, the band located at 350 nm suggests the formation of some extra-framework FeOx oligomers [66]. Also, Co-modified materials present two intense absorption bands in the visible range, with maximums located at 440 and 710 nm, assigned to the charge transfer transitions O2− → Co2+ and O2− → Co3+ [32,67]. Modification of Ti-zeolite Y supports with nickel oxide led to a slight broadening of the absorption band in the UV range due to O2 → Ni2+ charge transfer, which overlapped with the absorption bands given by the titanium species. Also, it was observed that two new broad absorption bands appeared in the visible range, located at 420 nm and 690 nm. These are related to the 3A2g3T1g (P) and 3A2g3T1g (F) transitions (Table 3) given by the presence of Ni2+ ions in octahedral or pseudo-octahedral symmetry [68,69].
The band gap energies of all the samples were obtained from the Tauc plot using the Kubelka–Munk function, as in ref. [71], by extrapolating the linear part of the plot to the x-axis (Figure 12).
The band gap values determined for indirect transitions are summarized in Table 4 and showed a decrease compared with pristine TiO2 (3.2 eV [72]). An important narrowing of the band gap energy was observed by modifying the Ti-zeolite Y support with iron and cobalt oxide, obtaining values below 1.5 eV (Table 4). It means that less energy is required for e transfer, improving the photocatalytic process. Although the immobilization of nickel oxide also leads to a decrease in the energy of the band gap, the effect is not as important as in the case of iron and cobalt oxides.
In order to represent the reaction mechanisms of the synthesized materials, the values of their valence band (VB) energy for the photocatalysts were obtained from the valence band (VB) XPS measurements (Figure 13).
The XPS valence band spectra revealed the VB maxima of 2.3 eV for the 2TYF sample, very close to the VB potential of 2TYC (2.2 eV) and 0.65 eV for 2TYN. Further, the conduction band (CB) minima of the samples were calculated using the following Equation (1):
ECB (vs. NHE) = EVB (vs. NHE) − Eg,
where ECB is CB potential, EVB is VB potential, and Eg is band gap energy [73]. So, the obtained CB potentials for the samples were 0.88 eV for 2TYF, 0.94 eV for 2TYC, and −2.27 eV for 2TYN.

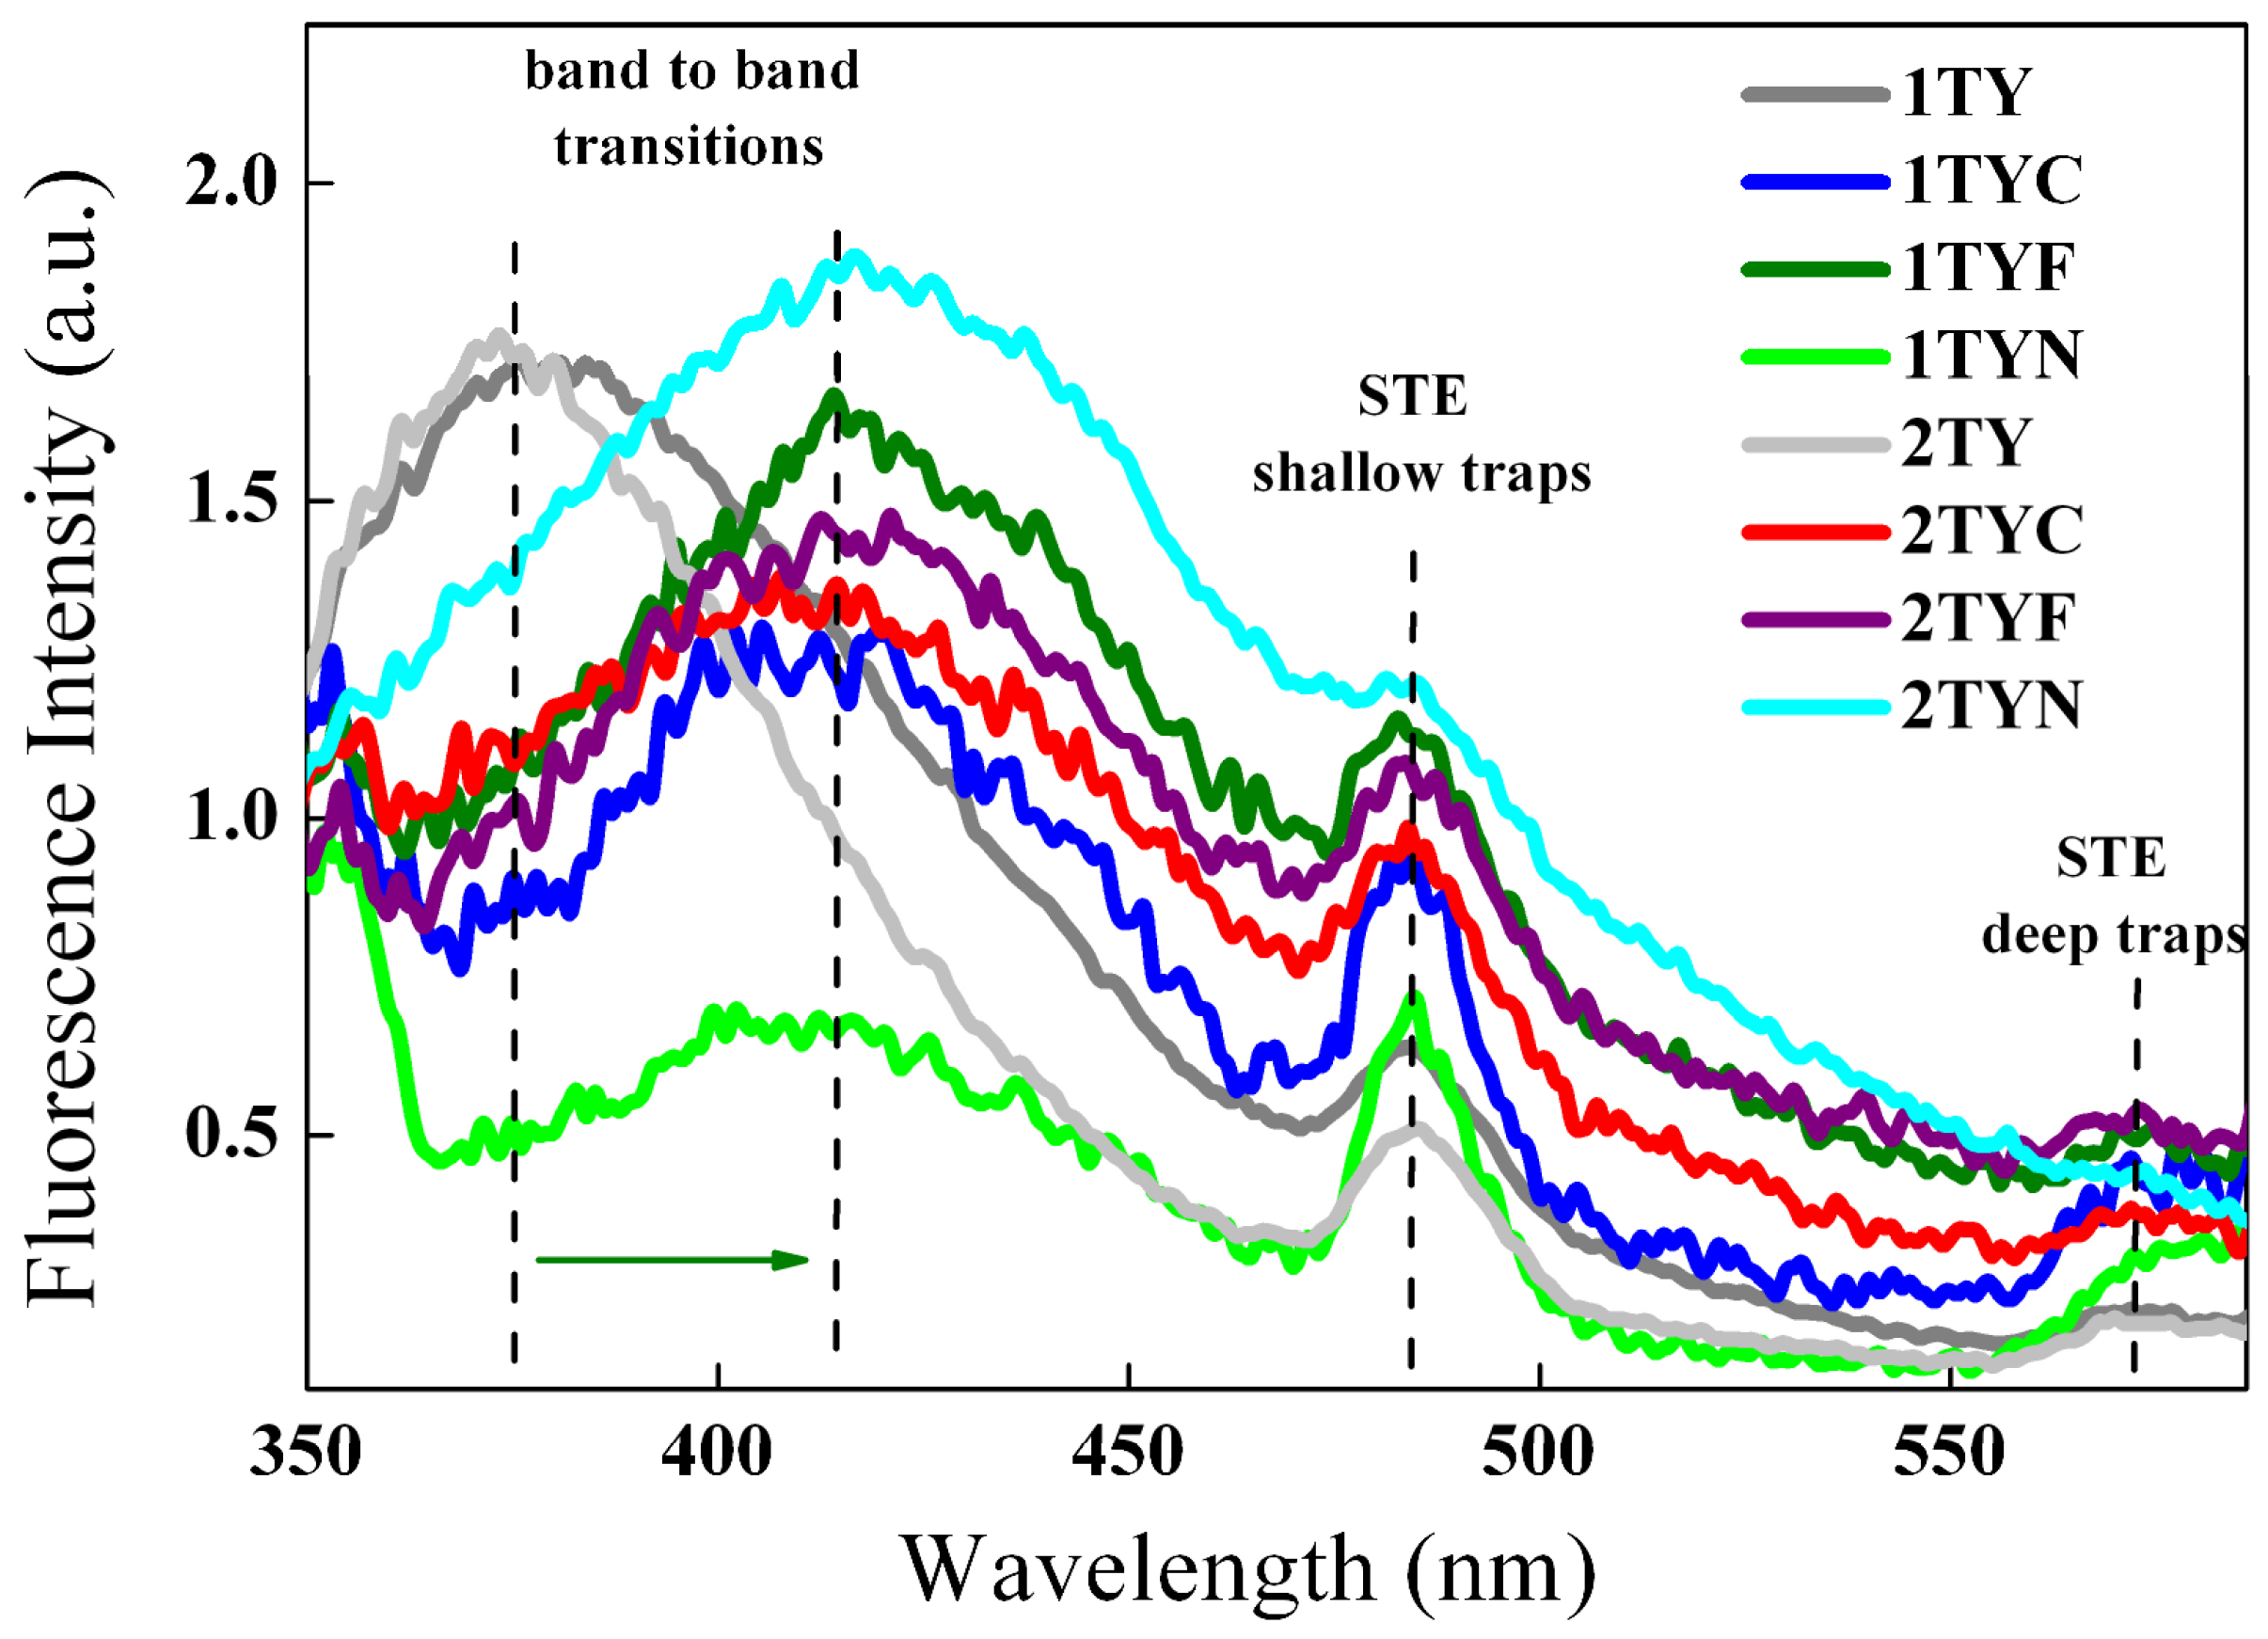
2.3.2. Photoluminescence Spectroscopy

The photoluminescence (PL) technique has been used to investigate the effect of 3d metals from the VIII group on the optical and photochemical properties of Ti-zeolite Y. The recorded PL spectra of Ti-zeolite Y and Fe/Co/Ni-modified Ti-zeolite Y, using an excitation wavelength of 320 nm, are shown in Figure 14. Ti-zeolite Y materials with different amounts of TiO2 display two clear PL emissions peaks related to the indirect band-to-band recombination of photogenerated electron–hole pairs (in the high energy range) [74] and to the self-trapped excitons (STE) formed by electrons binding to the oxygen vacancies and defects, respectively (in the low energy range) [70,74,75].
Modification of aluminosilicate gel containing titanium in the network with oxides of 3d metals from the VIII group leads to obtaining three obvious PL signals at about 415, 485, and 575 nm, respectively. It is reported that the bands appearing in the visible range are mainly related to surface defects, band edge-free excitons, and oxygen vacancies [76,77,78]. The type of dopant species like Fe, Co, or Ni seems to have an important effect on the photoluminescence properties due to the different effects on the separation of photogenerated electron(e)/holes(h+) pairs and their recombination process. Figure 14 shows that the post-synthesis modification of aluminosilicate gel containing titanium in the network with cations of 3d metals from the VIII group led to a shift in the lower energy range and to a quenching of the first PL emission signal. This is most probably due to the formation of some sub-bands (surface states) by the addition of 3d metallic species, so the transfer of excited electrons from the bottom of the conduction band to the top of the valence band takes place via new sub-bands through a non-radiative process firstly and a radiative one, secondly [79]. The formation of new sub-bands leads to a delay in the electron–hole repair, which is desirable in photocatalysis. The second PL signal seems to keep its position but increases in intensity after the immobilization of 3d metallic oxides. It is related to the formation of new oxygen vacancies and defects as shallow trap centers, iron oxide having the most pronounced effect, followed by cobalt oxide. Also, the results showed a new broad PL band appearing in the lower energy domain, assigned to deep defects and oxygen vacancies [70,75].

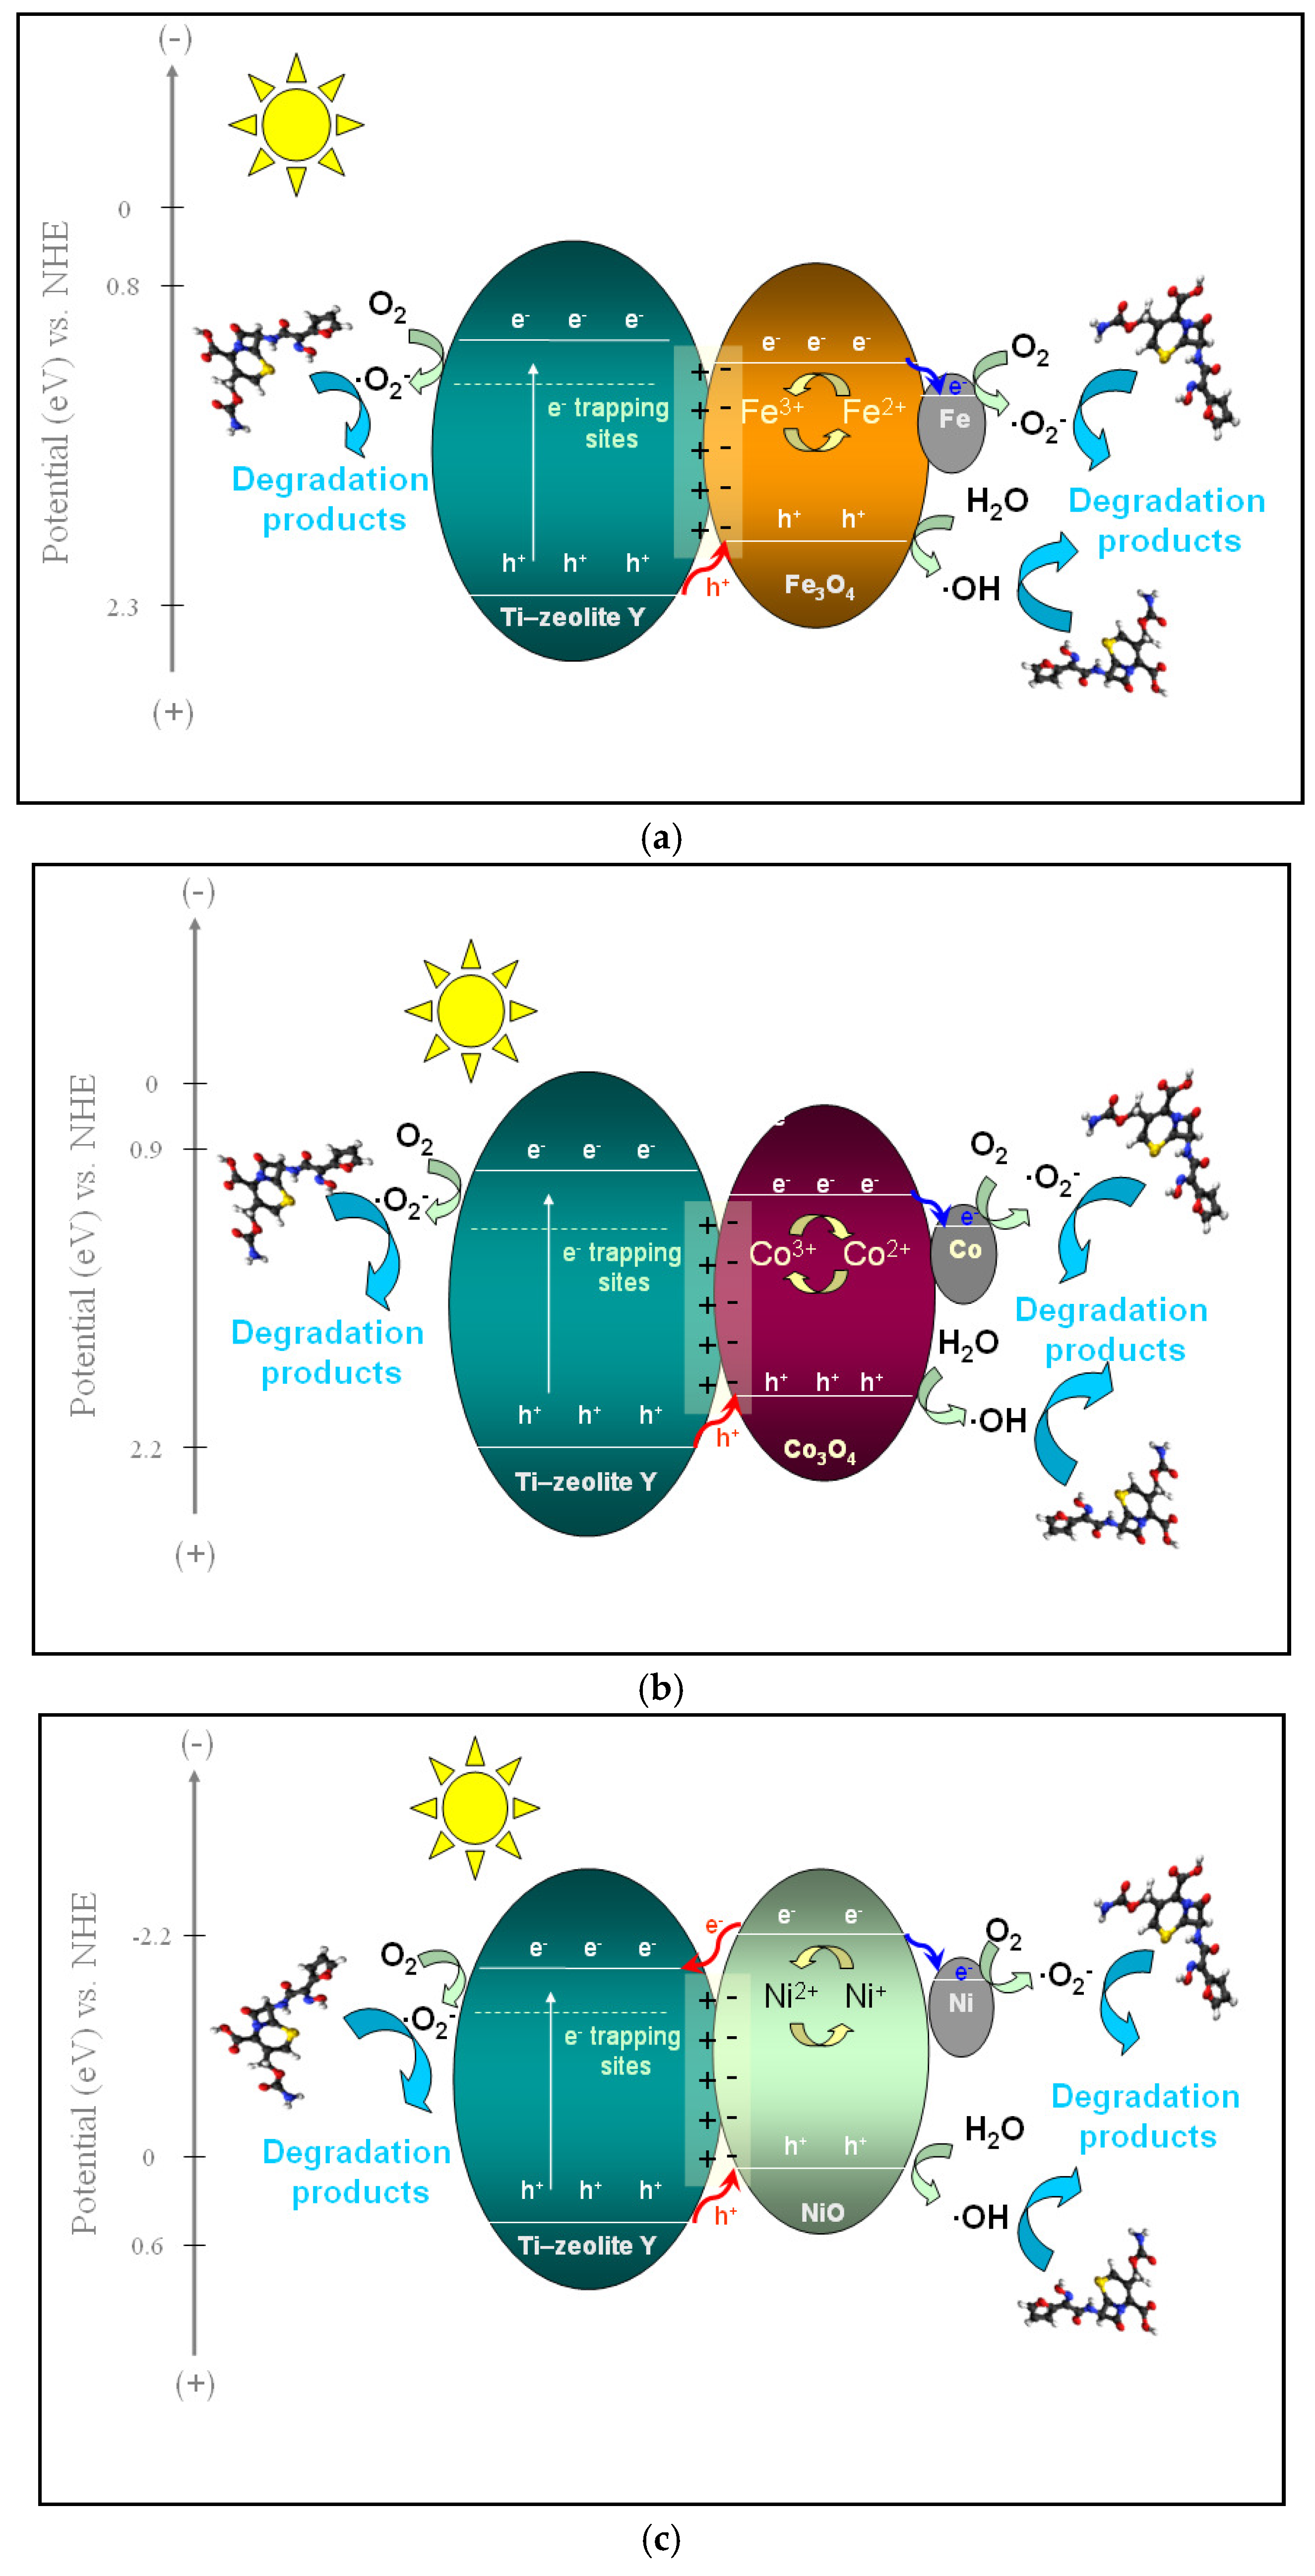
2.4. Photocatalytic Activity

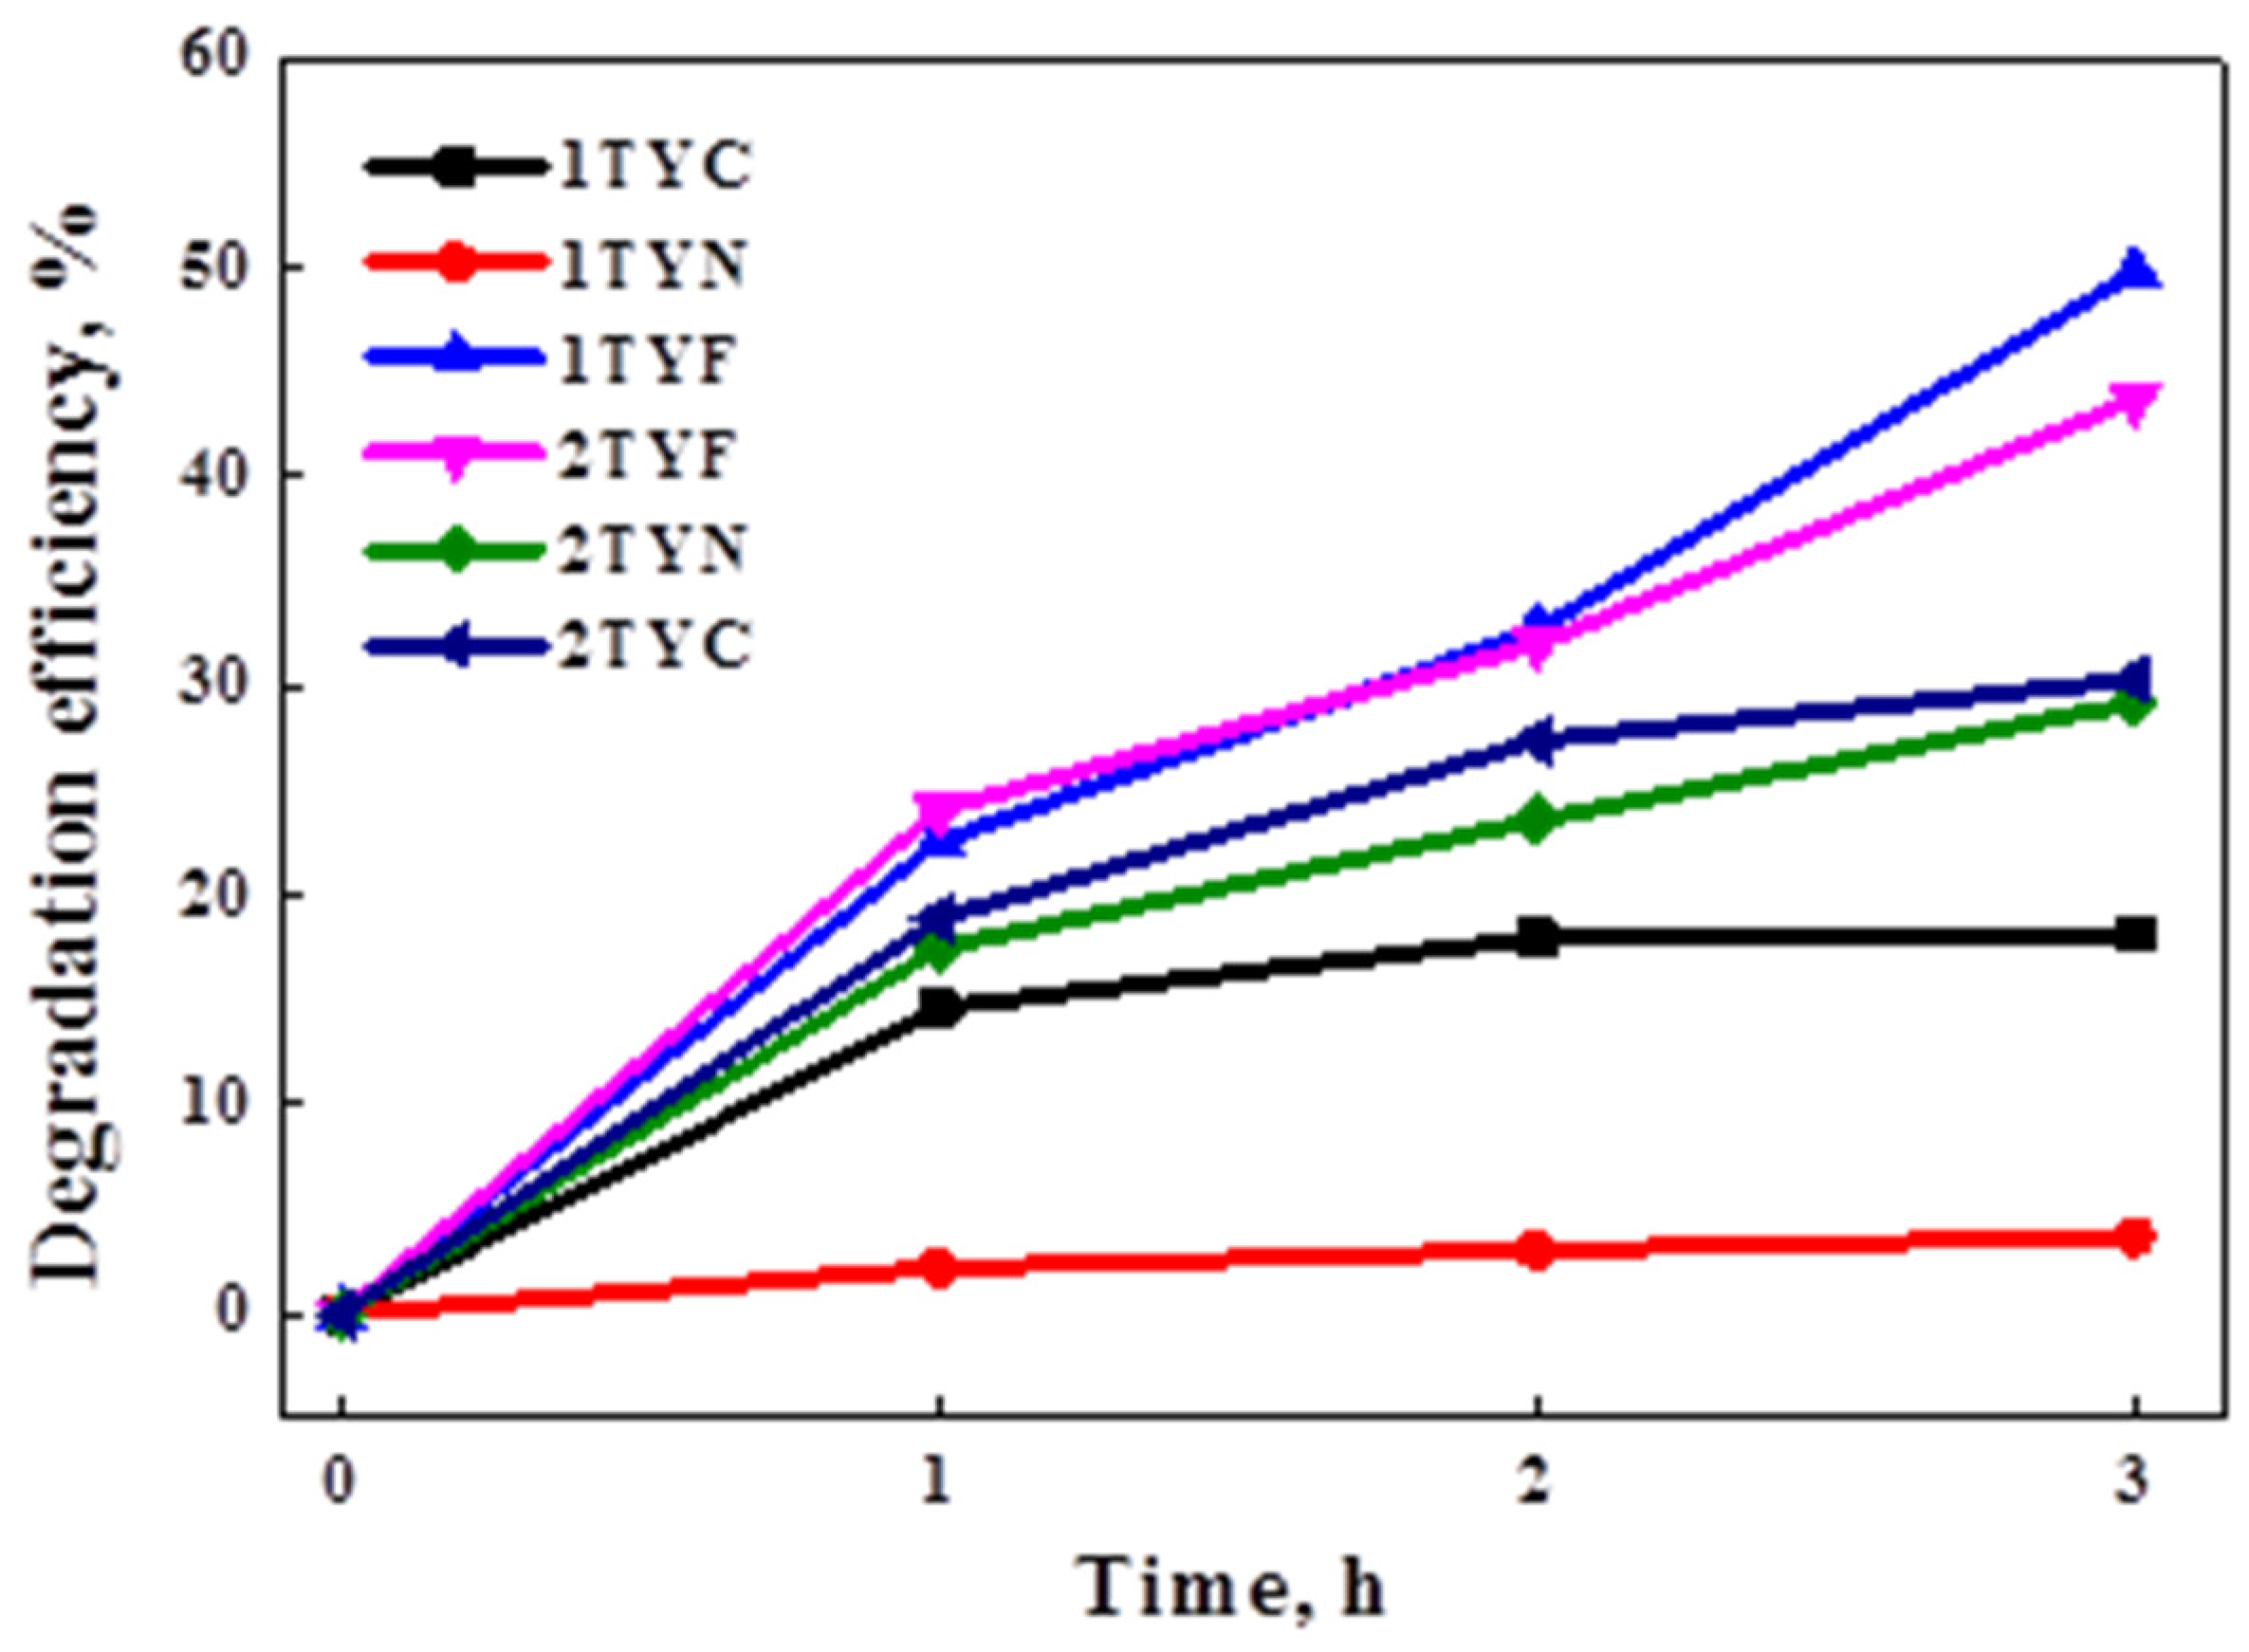
2.4.1. Photocatalytic Degradation of Cefuroxime

The photocatalytic performances of the samples were evaluated in the degradation of cefuroxime (β-lactam) antibiotic from water under visible light irradiation. The results are shown in Figure 15 and indicate the highest degradation efficiencies for the samples modified with iron oxide. This is explained by the lower value of the band gap energy (1.23 eV for 1TYF and 1.30 eV for 2TYF, Table 4), thus contributing to the electron transfer process under visible light irradiation.
Noteworthy, the photocatalytic activity of Ti-aluminosilicate gel modified with transition metals from the VIII group (Fe, Co, and Ni) exhibits a direct relationship with the PL signals associated with surface trap excitons processes. It suggests the important effect of oxygen vacancies and defects obtained during the synthesis, which bind the photogenerated electrons, preventing e/h+ pairing and thus improving their availability to further interact with oxygen molecules adsorbed on the surface and generate superoxide radicals, active in the degradation process.
Better photocatalytic performances were obtained for the photocatalysts reported in this work compared to similar materials previously obtained by our group through TiO2 immobilization on zeolite Y by the impregnation method [32]. Comparing the results, a significant decrease in photocatalytic activity can be observed for samples with incorporated Ti in the zeolite Y network and immobilized nickel oxide. The physicochemical properties of materials that are strongly influenced by the synthesis method, the nature of the pollutant, and the experimental test conditions determine their photocatalytic performances. Fe-, Co-, or Ni-TiO2 nanocomposites have been used in different reactions for the photocatalytic degradation of several pollutants from wastewater, such as Acid Orange 7 and Methylene Blue, with high photocatalytic efficiencies [80,81], but similar materials with Ti dispersed in the zeolite framework by direct synthesis have not yet been reported, to our knowledge.
It was shown that in the process of TS-1 doping with Fe or Ni, the migration of electrons is from iron species to the support, respectively, from the support to nickel species [82]. The different interactions with the support and different energies of valence and conduction bands of the photocatalysts with Fe and Ni compared to Ti-containing zeolite support influence the mechanism of the photocatalytic reaction as well as the degradation efficiency (Figure 15). The proposed mechanisms of cefuroxime degradation over the prepared photocatalysts are presented in Figure 16.
Adding various p-type semiconductors such as Fe3O4, Co3O4, and NiO to Ti-containing zeolite Y (n-type semiconductor) with titanium incorporated in the network leads to the formation of a p–n type heterojunction. There is an internal electric field that ensures the spatial separation of the photogenerated charge carriers and directs the transfer of holes from an n-type semiconductor to a p-type semiconductor and the transfer of electrons in reverse [83]. According to the band edge position, a difference appears between the three types of synthesized materials. As can be seen in Figure 16, while the holes generated in the valence band (VB) of TiO2 are transferred to the VB of all the used p-type semiconductors, the electron transfer from the conduction band (CB) of p-type semiconductors to the CB of TiO2 is allowed only for NiO. However, there is a transfer of electrons from the conduction band of the 3d metal oxides (Fe3O4, Co3O4, and NiO) to the metallic species formed, as was suggested by the XPS data (Figure 7 and Figure 8) for each of the three types of photocatalytic systems. Thus, the recombination of e/h+ pairs is reduced.
Meanwhile, the high dispersion of iron oxide, as was suggested by XRD results, ensures an efficient p–n heterojunction and, hence, better separation of photogenerated charge, improving the photocatalytic performances. Under light irradiation, the separated electrons and holes are available to interact with O2 and H2O from the reaction medium, leading to the generation of different reactive species that are free to degrade the cefuroxime molecules. As illustrated in Figure 16, the photogenerated electrons reduce O2, producing superoxide (·O2) radicals, while the separated holes oxidize H2O molecules, forming hydroxyl (·OH) radicals in the system. These two reactive oxygen species thus obtained are considered to be the main ones involved in the photocatalytic degradation of organic pollutants in water [73,80,84]. To further investigate the degradation mechanism and to clarify the role of each reactive species, scavenger experiments were carried out.

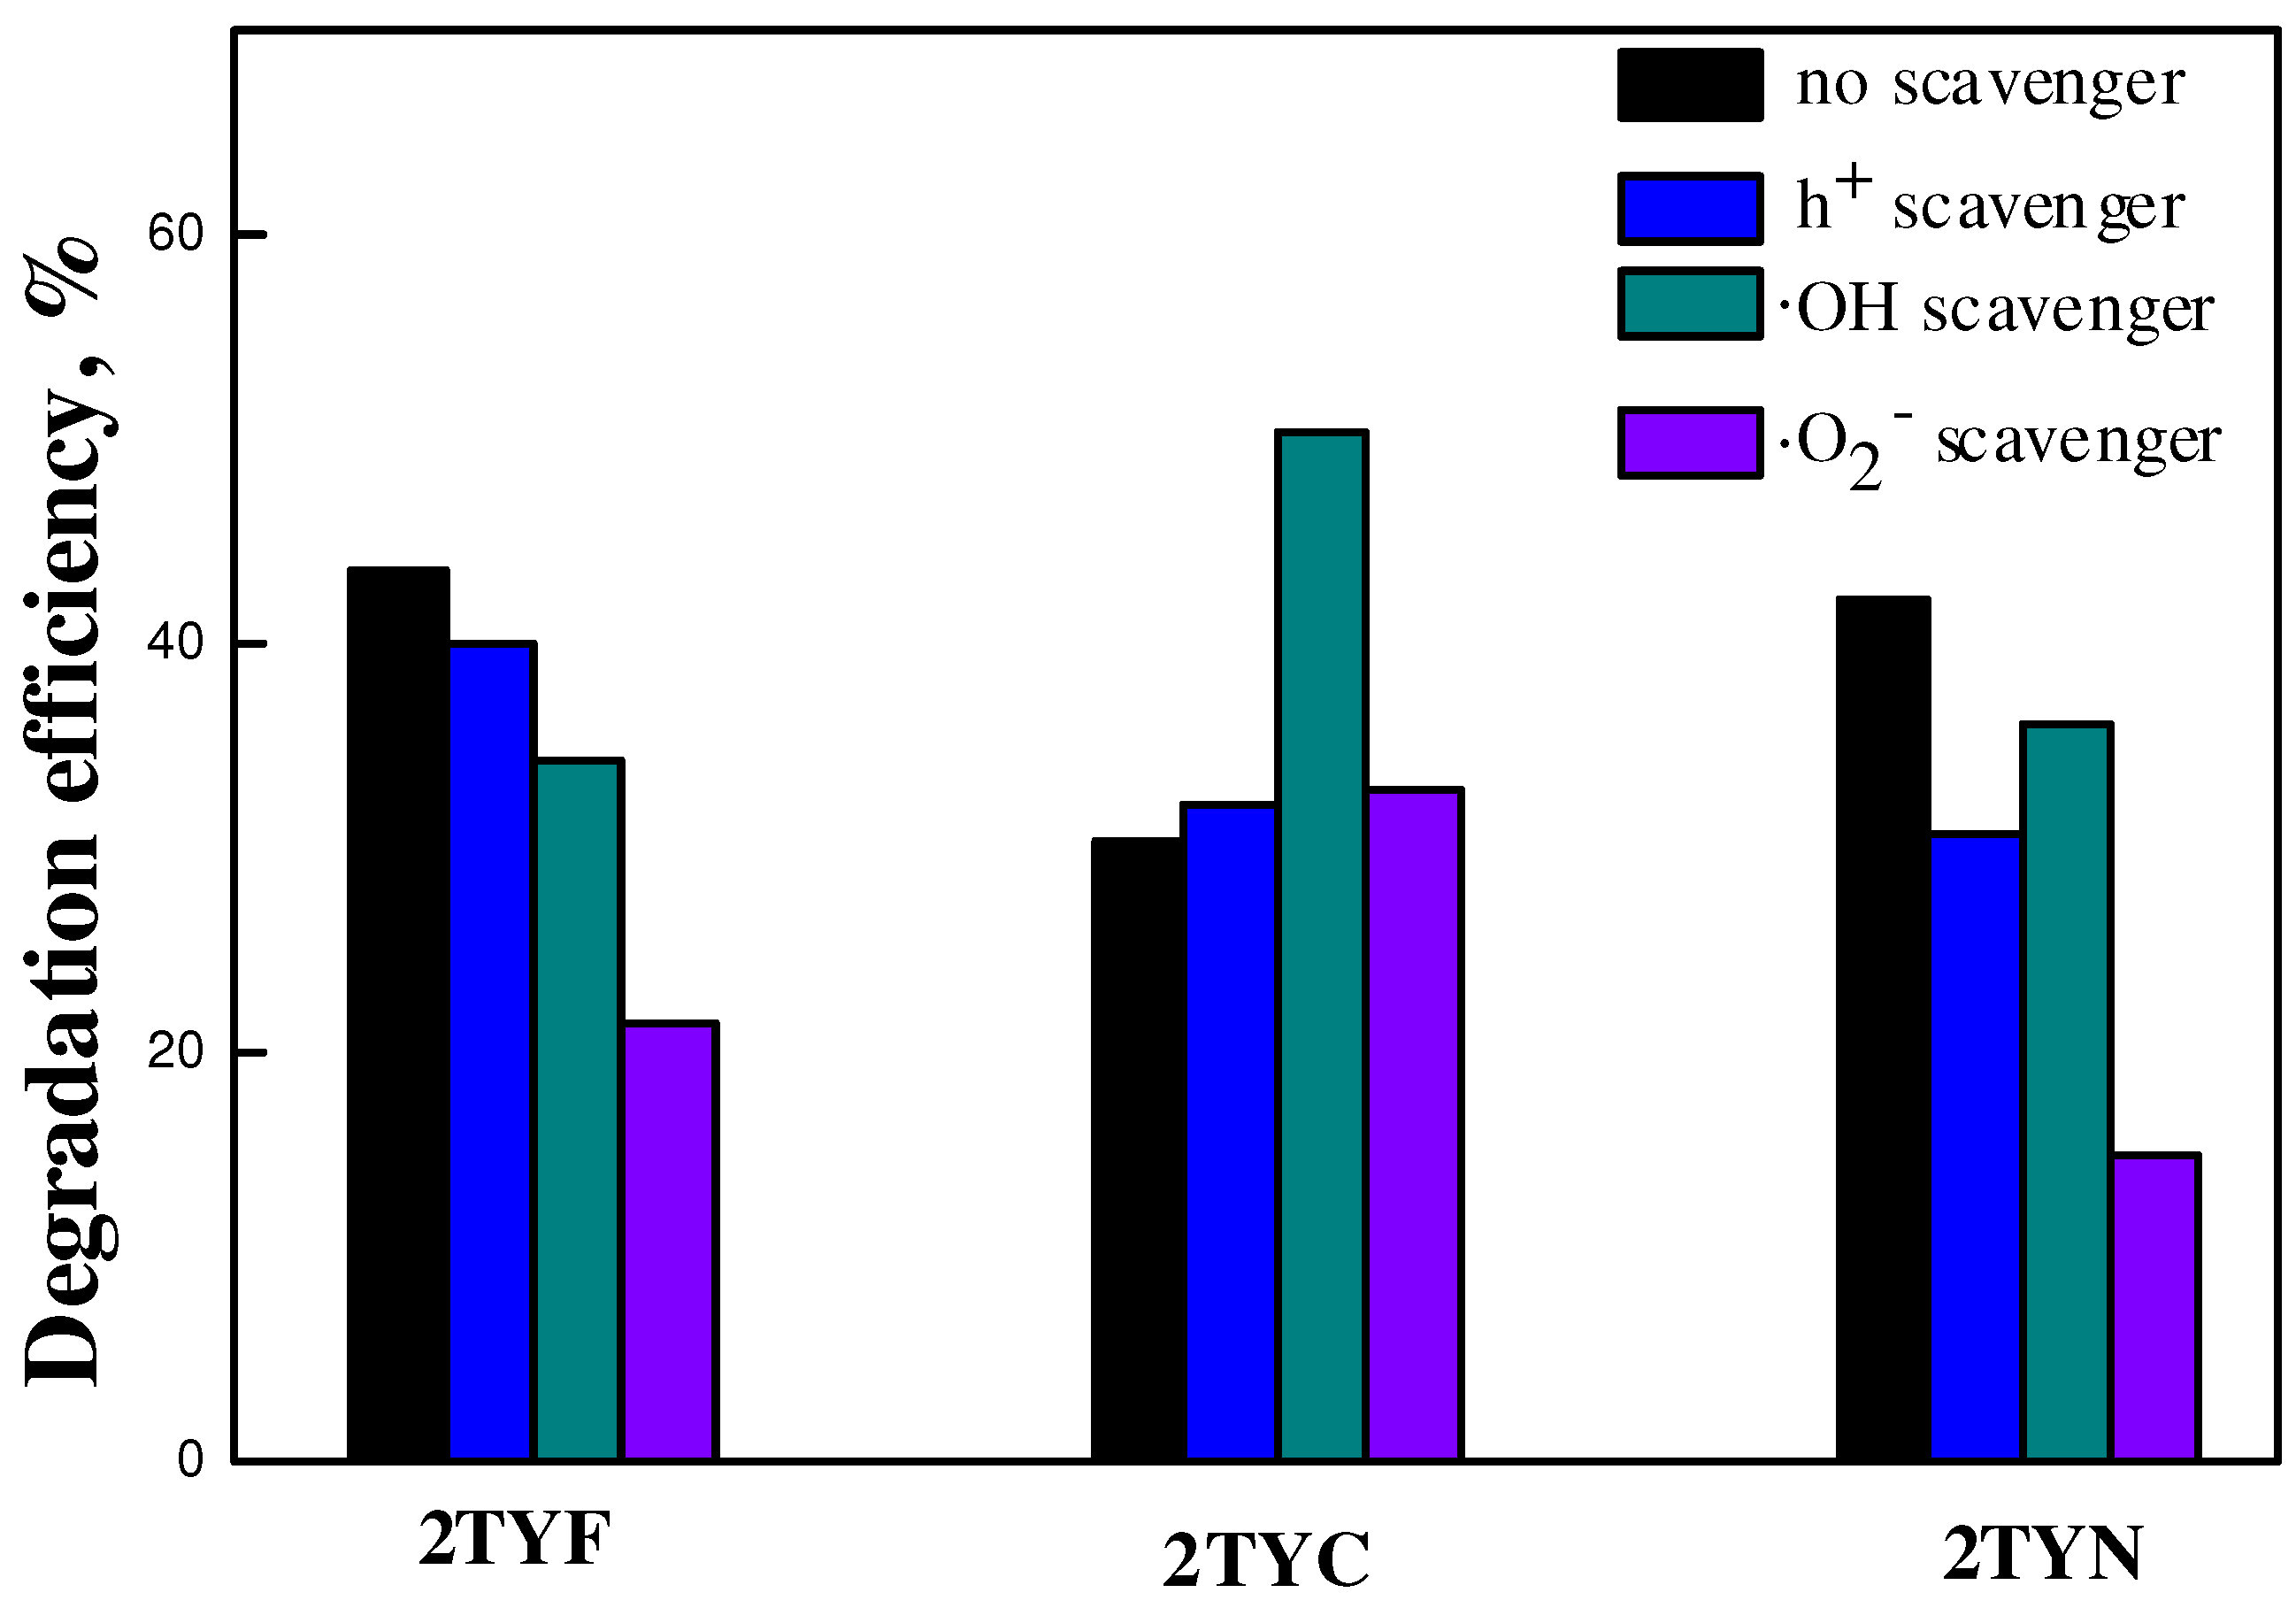
2.4.2. Scavenger Experiments

Exploration of the degradation mechanism depending on the type of 3d metal oxide supported on Ti-incorporated zeolite Y was performed using different quenching molecules, which interact specifically with the main reactive species resulting under irradiation.
As shown in Figure 17, the scavenger addition in the reaction system led to a distinct decrease in the efficiency of cefuroxime degradation, indicating that several reactive species are involved in the process. The addition of the h+ scavenger had a moderately decreasing effect on the photocatalytic efficiency, indicating that the photogenerated holes also participated in the degradation process. For all the samples, it was observed that the addition of p-BQ significantly decreased the degradation reaction, suggesting that superoxide radicals (·O2) played a key role in the oxidation of cefuroxime.
A considerable decrease in the photocatalytic efficiency by adding ·O2 scavenger was found in the case of the sample modified with Ni oxide, suggesting that for this material, the degradation of cefuroxime takes place mainly through superoxide species. This behavior can be explained by the higher probability of superoxide radical formation, led by a better separation of electron–hole pairs. The significant increase in efficiency for the 2TYC photocatalyst in the presence of the ·OH scavenger evidenced the effect of 3d metal oxides and their interaction with Ti-incorporated into the zeolite Y gel network on quenching molecule degradation.

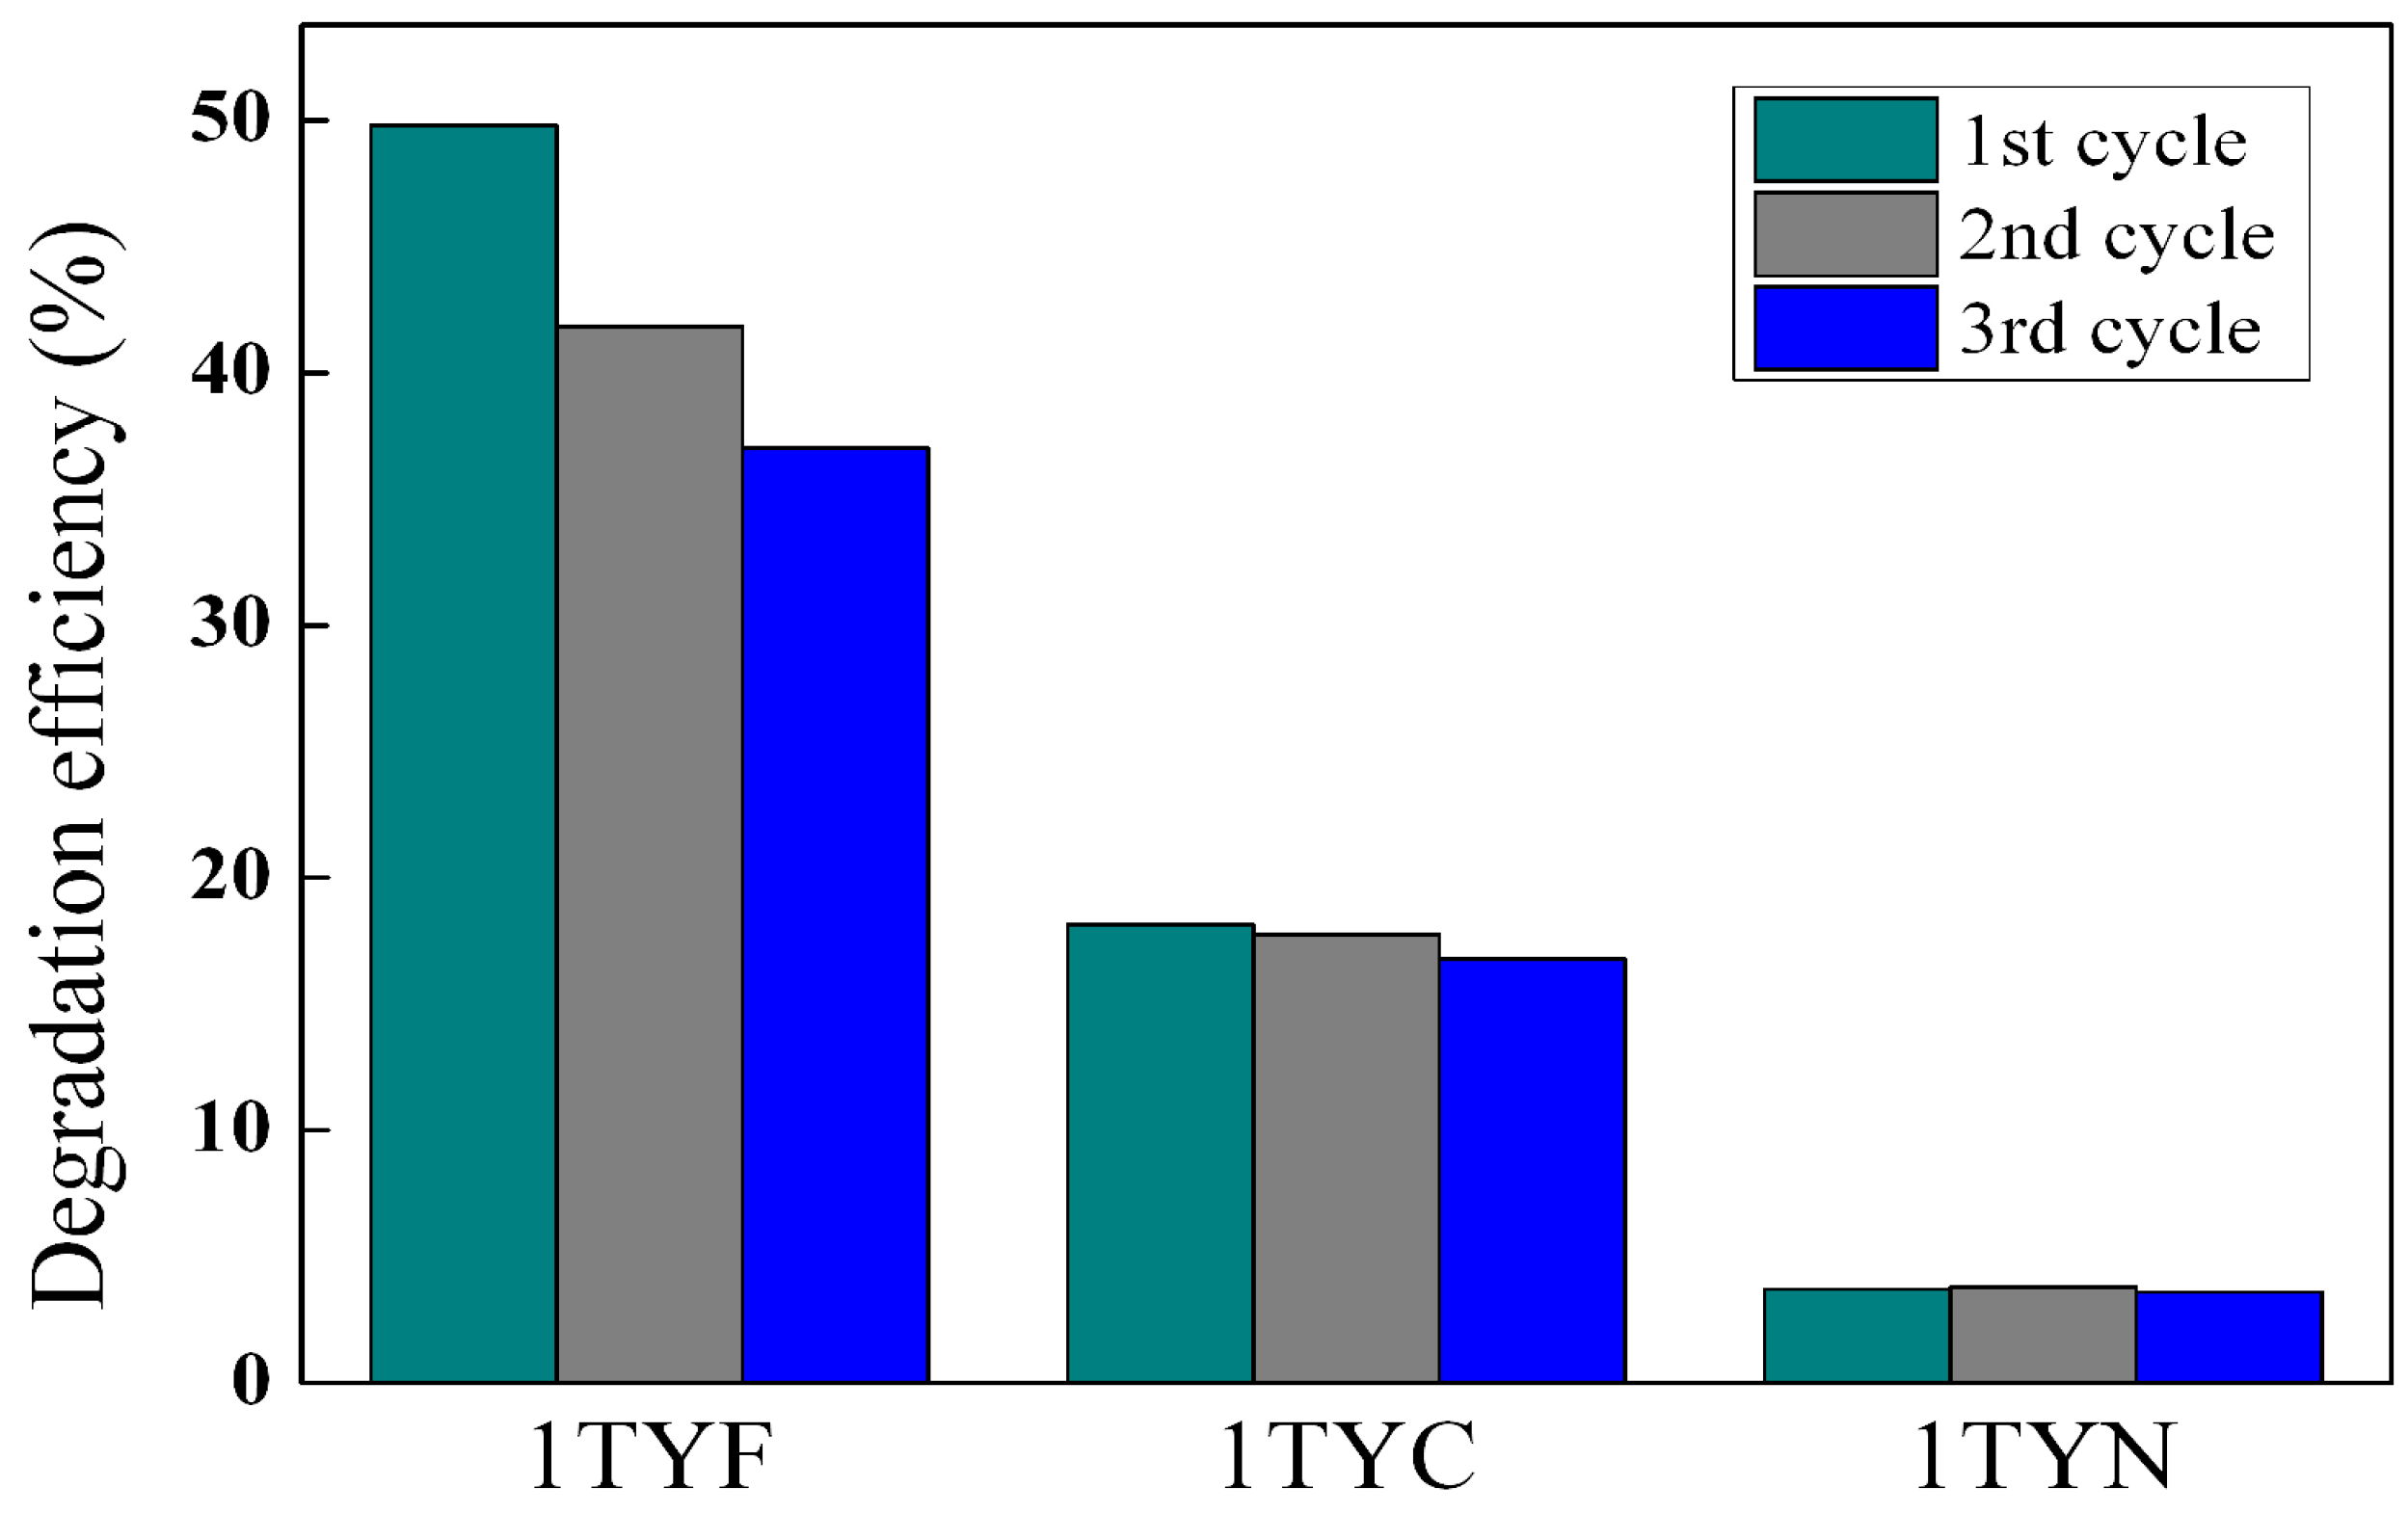
2.4.3. Stability of the Photocatalysts

The synthesized materials show good stability after three consecutive cyclic reactions, as shown in Figure 18. Only for the 1TYF sample was there a tendency to decrease the photocatalytic efficiency.
The X-ray diffractograms (Figure 19) of the used photocatalysts indicated a slight decrease in the peak intensity for samples with Co and Ni. In the case of the sample with Fe, the variation in intensity after the three consecutive reaction cycles is more significant and is correlated with the decrease in the crystalline phase percent in the sample. This may be the result of the interaction of iron species with the support, which reduces its stability. The possibility of Fe3+ incorporation as a tetrahedral coordinated ion in both the zeolite framework and the extra framework was confirmed by Raman (Table 2) and EPR spectroscopy [20]. SEM images of the used samples (Figure S5) do not indicate changes in morphology. The less contoured forms of the crystalline assemblies observed for the 1TYF sample confirm the XRD results. Therefore, the stability of the samples decreases with their activity.

3. Conclusions

In the present work, an aluminosilicate gel was used as a raw material for the synthesis of efficient photocatalysts for the degradation of β-lactam antibiotics. Titanium was incorporated in different concentrations (1 and 2%) into the zeolite network by modifying the gel during the zeolitization process. A series of 3d metals from the VIII group, such as Fe, Co, and Ni, were supported on Ti-containing zeolite Y, and their photocatalytic properties were studied. H2-TPR, Raman, XPS, and UV–Vis spectroscopy results showed the formation of Fe3O4, Co3O4, and NiO, along with small amounts of metals for all obtained samples. These species and their interaction with support facilitated the charge separation across the p–n heterojunction interface and also the presence of oxygen vacancies and surface defects, which can bind the photogenerated electrons. The influence of metallic species that receive electrons from the conduction band of the corresponding oxide on the photocatalytic reaction mechanism and the effect of each metal oxide on degradation efficiency were also evidenced. The best results were obtained for iron-supported samples. In this case, a stronger interaction of the iron with the support was observed, which can explain both the higher activity and the lower stability of the photocatalysts.

4. Materials and Methods

4.1. Materials

4.1.1. Chemicals

For the synthesis of titanium-zeolite Y supports were used in sodium silicate solution (26.5 wt. % SiO2, 10.6 wt. % Na2O), sodium aluminate (NaAlO2), and titanium acetylacetonate ((CH3)2CHO]2Ti(C5H7O2). The basic medium required for the zeolitization process was ensured by using NaOH (98 wt. %). All the chemicals were purchased from Sigma-Aldrich (St. Louis, MO, USA). The post-synthesis modification of the supports was made by using iron (III) nitrate nonahydrate (Fe(NO3)3·9H2O (Sigma Aldrich), nickel (II) nitrate (Ni(NO3)2·6H2O), and cobalt (II) nitrate (Co(NO3)2·6H2O) from Merck (Darmstadt, Germany).
For the photocatalytic experiments, cefuroxime (C16H16N4O8S) was used, and for the scavenger experiments, potassium iodide (KI), ethanol (C2H5OH), and p-benzoquinone (C6H4O2). All of these chemicals were purchased from Merck (Darmstadt, Germany).

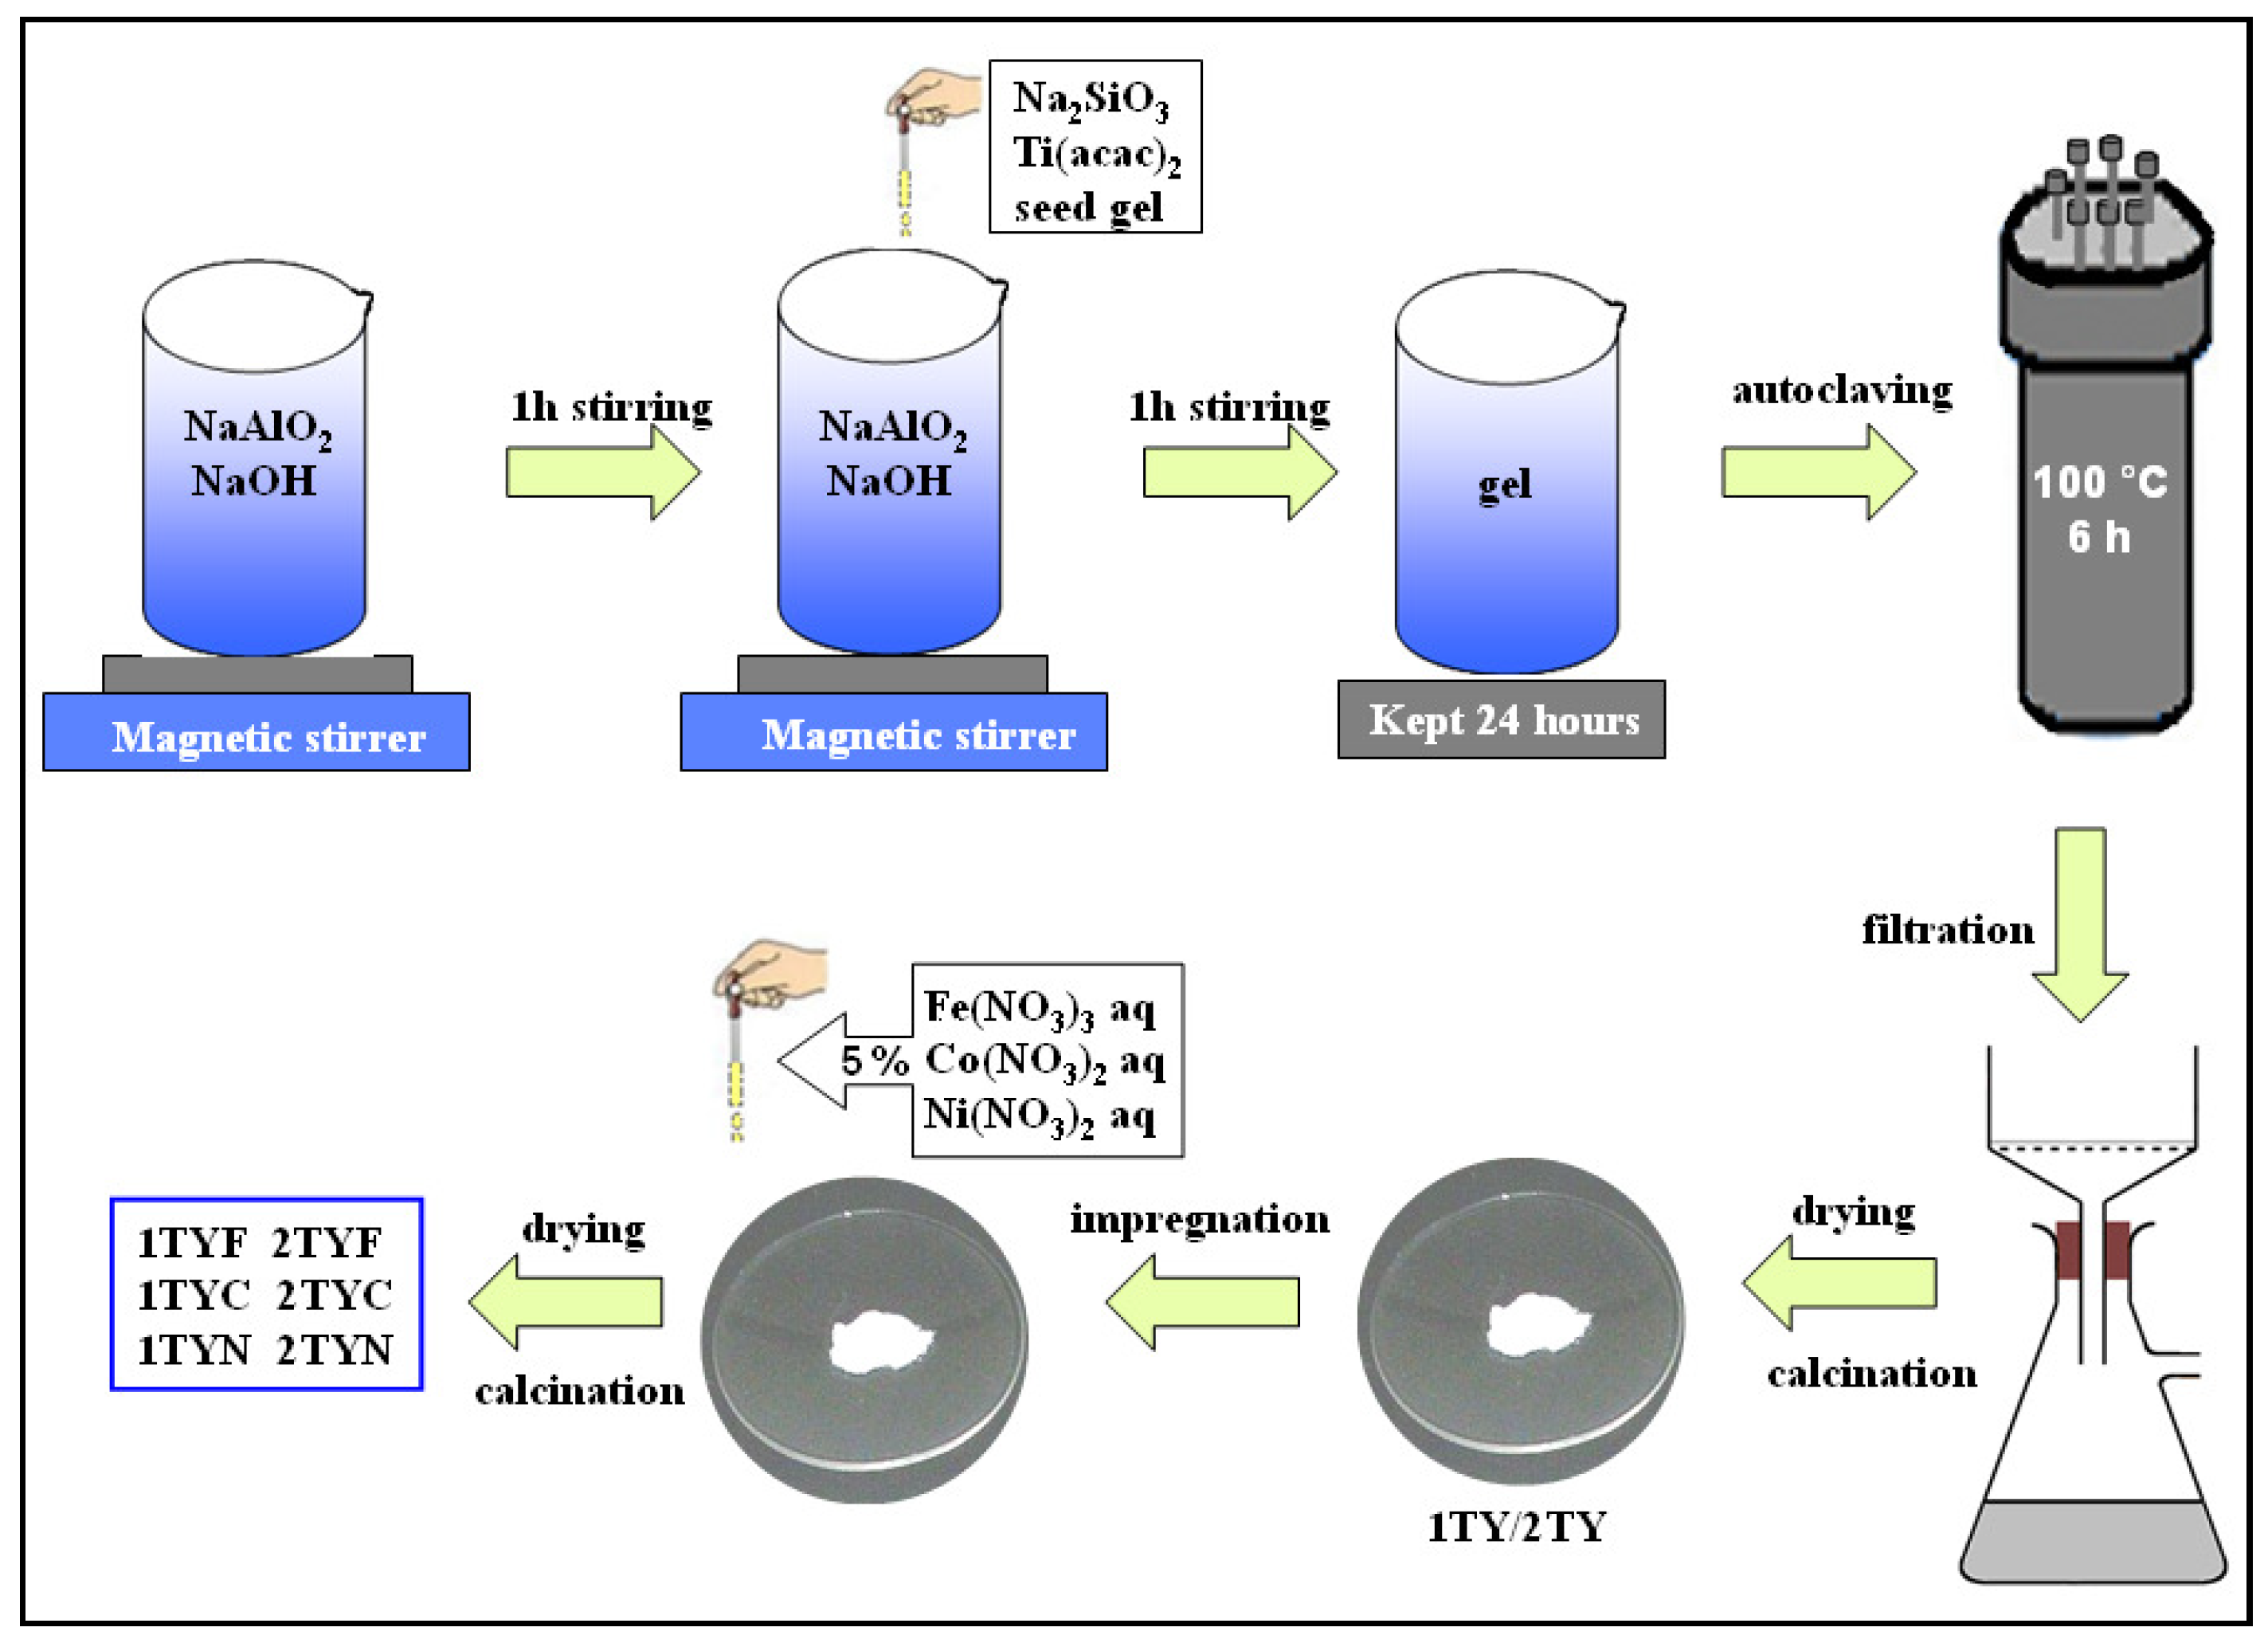
4.1.2. Sample Preparation

Titanium-containing Y zeolite materials with different titanium concentrations (noted xTY, x = 1, 2 for 1% and 2% calculated titania content, respectively) were obtained by a seed-assisted method. This method ensures the incorporation of titanium into the aluminosilicate gel network corresponding to zeolite Y by direct synthesis, using titanium acetylacetonate as a titanium precursor. The two sol–gels prepared as has been described before by our group [21] were hydrothermally treated to obtain the crystalline structure specific to faujasite Y. After filtration, the precipitates were washed with deionized water, dried at 60 °C, and calcined at 600 °C.
The two supports thus obtained were further modified with 5 wt. % 3d metal oxide by the impregnation method using an aqueous solution of Fe(NO3)3, Co(NO3)2, or Ni(NO3)2. The amount of iron, cobalt, and nickel precursor was equivalent to 5 wt.% of oxide in each sample and was dispersed in a calculated volume of water, according to the impregnation capacity of the support (impregnation ratio aqua:powder was 1 for 1TY and 0.93 for 2TY). The samples were firstly dried at room temperature overnight and then at 100 °C for 8 h. Co and Ni-modified photocatalysts were calcined at 450 °C for 6 h and Fe-modified samples at 500 °C for 5 h in air with a heating rate of 2 °C/min. The obtained materials were noted as xTYMe, where x is 1 or 2 and represents the concentration of titanium species, and Me is the 3d metal used for impregnation (Fe, Co, or Ni). A schematic representation of the photocatalysts’ preparation process is presented in Figure 20.

4.2. Methods of Characterization

X-ray diffraction (XRD) patterns were recorded using a Rigaku Ultima IV diffractometer (Rigaku Corp., Tokyo, Japan) with Cu Kα (λ = 0.15406 nm) within a 2θ range ranging from 5° to 80° with a speed of 2°/min and a step size of 0.02°. Phase identification was performed using Rigaku’s PDXL software (Version 1.8) connected to the ICDD database.
Elemental analysis of the samples was performed in a vacuum using a Rigaku ZSX Primus II spectrometer (Tokyo, Japan). The results were analyzed using EZ-scan combined with Rigaku SQX fundamental parameters software (Version 5.18) (standard less), which is capable of automatically correcting all matrix effects, including line overlaps. Structure and morphology were evidenced by transition electron microscopy using a JEOL 2100 TEM microscope (Tokyo, Japan) and scanning electron microscopy using a TESCAN Lyra3 XMU SEM microscope (Brno, Czech Republic). SEM was operated at 20 kV and a 15 mm working distance. Images have been obtained using secondary electron (SE) mode. TEM was operated at 200 kV. Images have been obtained in bright field mode.
The textural characterization of the samples was performed by N2 physisorption analysis using a Micromeritics ASAP 2020 instrument (Norcross, GA, USA). The samples were degassed under vacuum for five hours at 300 °C before each measurement. The BET model was used to calculate the apparent surface areas from the adsorption branches, while the amount of nitrogen adsorbed at the relative pressure of 0.99 was used to calculate the total pore volume. The micropore and mesopore volumes, together with the micropore and mesopore surface areas, were calculated using the t-plot method.
The XPS spectra were obtained using an AXIS Ultra DLD (Kratos Surface Analysis, Manchester, UK) setup, using Al Kα1 (1486.74 eV) radiation produced by a monochromatized X-ray source at an operating power of 144 W (12 kV × 12 mA). The survey spectra were recorded using hybrid lens mode with a 160 eV pass energy and slot aperture, and the high-resolution spectra were measured with a 40 eV pass energy.
Hydrogen temperature-programmed reduction (H2-TPR) of the samples was performed by means of a ChemBET 3000-Quantachrome (Pittsburgh, PA, USA) with a thermal conductivity detector (TCD). A continuous flow of 5 vol% H2 in Ar (70 mL/min) over 50 mg of photocatalyst was used, with a heating rate of 10 °C/min.
The UV-Raman spectra of the xTY(F/N/C) samples were recorded using a LabRam HR800 spectrometer (Horiba France SAS, Palaiseau, France) equipped with a 325 nm laser line. Vis-Raman spectra of the (½)TYC samples were collected by means of a Jobin -Yvon T64000 spectrometer (Horiba Jobin-Yvon, Palaiseau, France). The samples were analyzed with a wavelength of 532 nm and a power of 0.5 mW.
DR-UV/Vis spectroscopy was used to detect the coordination states of 3d metallic species added to the zeolite Y framework during the synthesis (in the case of Ti) or post-synthesis by the impregnation method (for Fe, Co, and Ni). The spectra of the samples were recorded by means of a JASCO V570 spectrophotometer (Tokyo, Japan) in the range of 200–1000 nm.
The photoluminescence spectra of the powders were recorded by means of an FLSP 920 spectrofluorimeter (Edinburgh Instruments, Livingston, UK) with a Xe lamp as an excitation source (λexc = 320 nm). For all measurements, the excitation and emission slits were 7 nm.
The photocatalytic tests were conducted under stirring in a closed room at 30 °C by adding 10 mL aqueous solution of cefuroxime, CFX (5 mg/L), and 20 mg of the photocatalyst. The reaction mixture was stirred in darkness for 30 min to allow the adsorption of cefuroxime molecules on the hydrophobic surface of zeolite materials. Further, a halogen lamp (2 × 60 W) with a filter for visible light was used for irradiation. At intervals of one hour, a fixed volume of the mixture was taken out, and the photocatalyst was separated using a Millipore syringe filter of 0.45 μm. The filtered solution was spectrophotometrically measured using the same JASCO V570 UV–Vis spectrophotometer, reading the maximum absorbance of CFX at λ = 280 nm. The photocatalytic degradation efficiency was obtained using the relation (A0 − At)/A0 × 100, where A is the absorbance of the solution at time t = 1, 2, or 3 h and A0 is the initial absorbance of cefuroxime at t = 0. For scavenger experiments, 0.1 mmol of potassium iodide, ethanol, and p-benzoquinone were added to the CFX solution as h+, ·OH, and ·O2 scavengers, respectively. The procedure was similar to the photocatalytic experiments. The results were presented for the case of irradiation for 3 h.

Supplementary Materials

The following supporting information can be downloaded at: https://www.mdpi.com/article/10.3390/gels10020129/s1, Figure S1: XRD patterns of Ti-zeolite Y supports; Figure S2: SEM images of (a) 1TY, (b) 1TYF, (c) 1TYC, and (d) 1TYN samples; Figure S3: Vis-Raman spectra of the (½)TYC materials; Figure S4: STEM images of the samples with Fe, Co, Ni supported on Ti-containing zeolite Y; Figure S5: SEM images of the samples before and after photocatalytic reactions; Table S1: EDX results.

Author Contributions

Conceptualization, V.P. and G.P.; methodology, V.P. and G.P.; validation, V.P.; formal analysis, G.P.; investigation, G.P., E.M.A., I.A., D.C.C., N.G.A., A.K., F.P., A.B. and J.-L.B.; data curation, G.P., E.M.A., I.A., D.C.C., N.G.A., A.K., F.P., A.B. and J.-L.B.; writing—original draft preparation, G.P., E.M.A., D.C.C., N.G.A. and V.P.; writing—review and editing, G.P. and V.P.; visualization, V.P. and G.P.; supervision, V.P. All authors have read and agreed to the published version of the manuscript.

Funding

This research received no external funding.

Institutional Review Board Statement

Not applicable.

Informed Consent Statement

Not applicable.

Data Availability Statement

The data presented in this study are openly available in the article.

Conflicts of Interest

The authors declare no conflict of interest.

References

  1. Hu, G.; Yang, J.; Duan, X.; Farnood, R.; Yang, C.; Yang, J.; Liu, W.; Liu, Q. Recent developments and challenges in zeolite-based composite photocatalysts for environmental applications. Chem. Eng. J. 2021, 417, 129209. [Google Scholar] [CrossRef]
  2. Umejuru, E.C.; Mashifana, T.; Kandjou, V.; Amani-Beni, M.; Sadeghifar, H.; Fayazi, M.; Karimi-Maleh, H.; Thandiwe Sithole, N. Application of zeolite based nanocomposites for wastewater remediation: Evaluating newer and environmentally benign approaches. Environ. Res. 2023, 231, 116073. [Google Scholar] [CrossRef]
  3. Camposeco, R.; Castillo, S.; Hinojosa-Reyes, M.; Mejía-Centeno, I.; Zanella, R. Effect of incorporating vanadium oxide to TiO2, Zeolite-ZM5, SBA and P25 supports on the photocatalytic activity under visible light. J. Photochem. Photobiol. A 2018, 367, 178–187. [Google Scholar] [CrossRef]
  4. Kamegawa, T.; Kido, R.; Yamahana, D.; Yamashita, H. Design of TiO2-zeolite composites with enhanced photocatalytic performances under irradiation of UV and visible light. Microporous Mesoporous Mater. 2013, 165, 142–147. [Google Scholar] [CrossRef]
  5. Dubey, N.; Rayalu, S.S.; Labhsetwar, N.K.; Naidu, R.R.; Chatti, R.V.; Devotta, S. Photocatalytic properties of zeolite-based materials for the photoreduction of methyl orange. Appl. Catal. A Gen. 2006, 303, 152–157. [Google Scholar] [CrossRef]
  6. Farhadi, N.; Tabatabaie, T.; Ramavandi, B.; Amiri, F. Ibuprofen elimination from water and wastewater using sonication/ultraviolet/hydrogen peroxide/zeolite-titanate photocatalyst system. Environ. Res. 2021, 198, 111260. [Google Scholar] [CrossRef] [PubMed]
  7. Setthaya, N.; Chindaprasirt, P.; Yin, S.; Pimraksa, K. TiO2-zeolite photocatalysts made of metakaolin and rice husk ash for removal of methylene blue dye. Powder Technol. 2017, 313, 417–426. [Google Scholar] [CrossRef]
  8. Petcu, G.; Anghel, E.M.; Buixaderas, E.; Atkinson, I.; Somacescu, S.; Baran, A.; Culita, D.C.; Trica, B.; Bradu, C.; Ciobanu, M.; et al. Au/Ti Synergistically Modified Supports Based on SiO2 with Different Pore Geometries and Architectures. Catalysts 2022, 12, 1129. [Google Scholar] [CrossRef]
  9. Petcu, G.; Papa, F.; Anghel, E.M.; Atkinson, I.; Preda, S.; Somacescu, S.; Culita, D.C.; Baran, A.; Ciobanu, E.M.; Jecu, L.M.; et al. Effects of Aluminosilicate Gel Treatment and TiO2 Loading on Photocatalytic Properties of Au–TiO2/Zeolite, Y. Gels 2023, 9, 503. [Google Scholar] [CrossRef]
  10. Zhao, X.; Chen, W.; Li, G.; Feng, G.; Li, S.; Dong, X.; Song, Y.; Yu, X.; Chen, X.; Wei, W.; et al. Gas-phase CO2 photoreduction via iron/ZSM-5 composites. Appl. Catal. A Gen. 2020, 595, 117503. [Google Scholar] [CrossRef]
  11. John, K.I.; Adeleye, A.T.; Adeniyi, A.G.; Sani, L.A.; Abesa, S.; Orege, I.J.; Adenle, A.A.; Elawad, M.; Omorogie, M.O. Screening of Zeolites series: H-β/H-MOR/H-ZSM-5 as potential templates for photocatalyst heterostructure composites through photocatalytic degradation of tetracycline. J. Mol. Struct. 2023, 1277, 134852. [Google Scholar] [CrossRef]
  12. Du, T.; Cui, M.; Chao, Y.; Xiao, Y.; Ren, Z.; An, Y.; Meng, C. Preparation and photocatalytic properties of highly dispersed samarium vanadate nanoparticles supported on H-mordenite composites by template-free method. J. Photochem. Photobiol. A 2022, 433, 114207. [Google Scholar] [CrossRef]
  13. Alvarez-Aguiñaga, E.A.; Elizalde-González, M.P.; Sergio, A.; Sabinas-Hernández, S.A. Unpredicted photocatalytic activity of clinoptilolite–mordenite natural zeolite. RSC Adv. 2020, 10, 39251–39260. [Google Scholar] [CrossRef]
  14. Jansson, I.; Suarez, S.; Garcia-Garcia, F.J.; Sanchez, B. Zeolite-TiO2 hybrid composites for pollutant degradation in gas phase. Appl. Catal. B Environ. 2015, 178, 100–107. [Google Scholar] [CrossRef]
  15. Li, F.; Jiang, Y.; Yu, L.; Yang, Z.; Hou, T.; Sun, S. Surface effect of natural zeolite (clinoptilolite) on the photocatalytic activity of TiO2. Appl. Surf. Sci. 2005, 252, 1410–1416. [Google Scholar] [CrossRef]
  16. Awad, M.E.; Farrag, A.M.; El-Bindary, A.A.; El-Bindary, M.A.; Kiwaan, H.A. Photocatalytic degradation of Rhodamine B dye using low-cost pyrofabricated titanium dioxide quantum dots-kaolinite nanocomposite. Appl. Organomet Chem. 2023, 37, 7113. [Google Scholar] [CrossRef]
  17. Tao, P.; Wang, X.; Zhao, Q.; Guo, H.; Liu, L.; Qi, X.; Cui, W. Framework Ti-rich titanium silicalite-1 zeolite nanoplates for enhanced photocatalytic H2 production from CH3OH. Appl. Catal. B Environ. 2023, 325, 122392. [Google Scholar] [CrossRef]
  18. Bai, R.; Song, Y.; Tian, G.; Wang, F.; Corma, A.; Yu, J. Titanium-rich TS-1 zeolite for highly efficient oxidative desulfurization. Green Energy Environ. 2023, 8, 163–172. [Google Scholar] [CrossRef]
  19. Soekiman, C.N.; Miyake, K.; Hayashi, Y.; Zhu, Y.; Ota, M.; Al-Jabri, H.; Inoue, R.Y.; Hirota, Y.; Uchida, Y.; Tanaka, S.; et al. Synthesis of titanium silicalite-1 (TS-1) zeolite with high content of Ti by a dry gel conversion method using amorphous TiO2-SiO2 composite with highly dispersed Ti species. Mater. Today Chem. 2020, 16, 100209. [Google Scholar] [CrossRef]
  20. Petcu, G.; Anghel, E.M.; Somacescu, S.; Preda, S.; Culita, D.C.; Mocanu, S.; Ciobanu, M.; Parvulescu, V. Hierarchical Zeolite Y Containing Ti and Fe Oxides as Photocatalysts for Degradation of Amoxicillin. J. Nanosci. Nanotechnol. 2020, 20, 1158–1169. [Google Scholar] [CrossRef] [PubMed]
  21. Petcu, G.; Dobrescu, G.; Atkinson, I.; Ciobanu, M.; Blin, J.-L.; Parvulescu, V. Evolution of Morphology, Fractal Dimensions, and Structure of (Titanium) Aluminosilicate Gel during Synthesis of Zeolites Y and Ti-Y. Fractal Fract. 2022, 6, 663. [Google Scholar] [CrossRef]
  22. Zhao, Z.; Wang, N.; Zhang, H.; Shang, R.; Xing, J.; Zhang, D.; Li, J. Fabrication of ZSM-5 zeolite supported TiO2-NiO heterojunction photocatalyst and research on its photocatalytic performance. J. Solid State Chem. 2022, 309, 122895. [Google Scholar] [CrossRef]
  23. Badvi, K.; Javanbakht, V. Enhanced photocatalytic degradation of dye contaminants with TiO2 immobilized on ZSM-5 zeolite modified with nickel nanoparticles. J. Clean. Prod. 2021, 280, 124518. [Google Scholar] [CrossRef]
  24. Wang, C.; Shi, H.; Li, Y. Synthesis and characteristics of natural zeolite supported Fe3+-TiO2 Photocatalysts. Appl. Surf. Sci. 2011, 257, 6873–6877. [Google Scholar] [CrossRef]
  25. Magdziarz, A.; Colmenares, J.C.; Chernyayeva, O.; Łomot, D.; Sobczak, K. Sonication and light irradiation as green energy sources simultaneously implemented in the synthesis of Pd-Fe- and Pt-Fe-doped TiO2-based photocatalysts. J. Mol. Catal. A Chem. 2016, 425, 1–9. [Google Scholar] [CrossRef]
  26. Alizadeh, T.; Kadkhodayan, H. Construction of Zeolite/Fe2ZnTiO6/graphene oxide multifunctional nanocomposite with high efficiency for photocatalytic removal of inorganic pollutants under visible irradiation. J. Phys. Chem. Solids 2022, 171, 110997. [Google Scholar] [CrossRef]
  27. Castaneda-Juarez, M.; Martinez-Miranda, V.; Almazan-Sanchez, P.T.; Linares-Hernandez, I.; Santoyo-Tepole, F.; Vazquez-Mejia, G. Synthesis of TiO2 catalysts doped with Cu, Fe, and Fe/Cu supported on clinoptilolite zeolite by an electrochemical-thermal method for the degradation of diclofenac by heterogeneous photocatalysis. J. Photochem. Photobiol. A 2019, 380, 111834. [Google Scholar] [CrossRef]
  28. Wang, C.; Shi, H.; Li, Y. Synthesis and characterization of natural zeolite supported Cr-doped TiO2 photocatalysts. Appl. Surf. Sci. 2012, 258, 4328–4333. [Google Scholar] [CrossRef]
  29. Torkian, N.; Bahrami, A.; Hosseini-Abari, A.; Momeni, M.M.; Abdolkarimi-Mahabadi, M.; Bayat, A.; Hajipour, P.; Rourani, H.A.; Abbasi, M.S.; Torkian, S.; et al. Synthesis and characterization of Ag-ion-exchanged zeolite/TiO2 nanocomposites for antibacterial applications and photocatalytic degradation of antibiotics. Environ. Res. 2022, 207, 112157. [Google Scholar] [CrossRef]
  30. Kohsuke Mori, K.; Miura, Y.; Sayoko Shironita, S.; Yamashita, H. New Route for the Preparation of Pd and PdAu Nanoparticles Using Photoexcited Ti-Containing Zeolite as an Efficient Support Material and Investigation of Their Catalytic Properties. Langmuir 2009, 25, 11180–11187. [Google Scholar] [CrossRef]
  31. Dascalu, I.; Hornoiu, C.; Calderon-Moreno, J.M.; Enache, M.; Culita, D.; Somacescu, S. Sol-gel synthesis of ZnO/Zn2-xFexTiO4 powders: Structural properties, electrical conductivity and dielectric behavior. J. Sol-Gel Sci. Technol. 2018, 86, 151–161. [Google Scholar] [CrossRef]
  32. Petcu, G.; Papa, F.; Atkinson, I.; Baran, A.; Apostol, N.G.; Petrescu, S.; Richaudeau, L.; Blin, J.-L.; Parvulescu, V. Co- and Ni-Doped TiO2 Nanoparticles Supported on Zeolite Y with Photocatalytic Properties. Nanomaterials 2023, 13, 2200. [Google Scholar] [CrossRef] [PubMed]
  33. Tan, C.; Yin, Y.; Zuo, J.; Li, J. Preparation of MIT-Ag/ZnO/Bi2WO6 nanocomposites and its application as photocatalyst for cefuroxime sodium degradation. Chem. Phys. Lett. 2023, 830, 140797. [Google Scholar] [CrossRef]
  34. Solís, R.R.; Chávez, A.M.; Monago-Maraña, O.; de la Peña, A.M.; Beltrán, F.J. Photo-assisted ozonation of cefuroxime with solar radiation in a CPC pilot plant. Kinetic parameters determination. Sep Purif Technol. 2021, 266, 118514. [Google Scholar] [CrossRef]
  35. Pourtaheri, A.; Nezamzadeh-Ejhieh, A. Enhancement in photocatalytic activity of NiO by supporting onto an Iranian clinoptilolite nano-particles of aqueous solution of cefuroxime pharmaceutical capsule. Spectrochim. Acta A Mol. Biomol. Spectrosc. 2015, 137, 338–344. [Google Scholar] [CrossRef]
  36. Kong, X.X.; Jiang, J.L.; Qiao, B.; Liu, H.; Cheng, J.S.; Yuan, Y.J. The biodegradation of cefuroxime, cefotaxime and cefpirome by the synthetic consortium with probiotic Bacillus clausii and investigation of their potential biodegradation pathways. Sci. Total Environ. 2019, 651, 271–280. [Google Scholar] [CrossRef]
  37. Qin, Z.; Wang, B.; Asano, N.; Wang, L.; Zhou, Y.; Liu, X.; Shen, B.; Mintova, S.; Asahina, S.; Valtchev, V. Towards a comprehensive understanding of mesoporosity in zeolite Y at the single particle level. Inorg Chem. Front. 2022, 9, 2365–2373. [Google Scholar] [CrossRef]
  38. Thommes, M.; Kaneko, K.; Neimark, A.V.; Olivier, J.P.; Rodriguez-Reinoso, F.; Rouquerol, J.; Sing, K.S.W. Physisorption of Gases, with Special Reference to the Evaluation of Surface Area and Pore Size Distribution (IUPAC Technical Report). Pure Appl. Chem. 2015, 87, 1051–1069. [Google Scholar] [CrossRef]
  39. Hess, C. New advances in using Raman spectroscopy for the characterization of catalysts and catalytic reactions. Chem. Soc. Rev. 2021, 50, 3519. [Google Scholar] [CrossRef]
  40. Yu, Y.; Xiong, G.; Li, C.; Xiao, F.S. Characterization of aluminosilicate zeolites by UV Raman spectroscopy. Micropor. Mesopor. Mater. 2001, 46, 23–34. [Google Scholar] [CrossRef]
  41. Ilieva, L.; Petrova, P.; Venezia, A.M.; Anghel, E.M.; State, R.; Avdeev, G.; Tabakova, T. Mechanochemically Prepared Co3O4-CeO2 Catalysts for Complete Benzene Oxidation. Catalysts 2021, 11, 1316. [Google Scholar] [CrossRef]
  42. Wang, W.; Liu, Y.; Xua, C.; Zheng, C.; Wang, G. Synthesis of NiO nanorods by a novel simple precursor thermal decomposition approach. Chem. Phys. Lett. 2002, 362, 119–122. [Google Scholar] [CrossRef]
  43. Mendoza-Castro, M.J.; De Oliveira-Jardim, E.; Ramírez-Marquez, N.-T.; Trujillo, C.-A.; Linares, N.; García-Martínez, J. Hierarchical Catalysts Prepared by Interzeolite Transformation. J. Am. Chem. Soc. 2022, 144, 5163–5171. [Google Scholar] [CrossRef] [PubMed]
  44. Zhang, J.; Xu, Q.; Li, M.; Feng, Z.; Li, C. UV Raman Spectroscopic Study on TiO2. II. Effect of Nanoparticle Size on the Outer/Inner Phase Transformations. J. Phys. Chem. C 2009, 113, 1698–1704. [Google Scholar]
  45. Bian, K.; Zhang, A.; Yang, H.; Fan, B.; Xu, S.; Guo, X.; Song, C. Synthesis and Characterization of Fe-Substituted ZSM-5 Zeolite and Its Catalytic Performance for Alkylation of Benzene with Dilute Ethylene. Ind. Eng. Chem. Res. 2020, 59, 22413–22421. [Google Scholar] [CrossRef]
  46. Fan, F.; Feng, Z.; Li, C. UV Raman spectroscopic study on the synthesis mechanism and assembly of molecular sieves. Chem. Soc. Rev. 2010, 39, 4794–4801. [Google Scholar] [CrossRef] [PubMed]
  47. Rana, B.S.; Singh, B.; Kumar, R.; Verma, D.; Bhunia, M.K.; Bhaumik, A.; Sinha, A.K. Hierarchical mesoporous Fe/ZSM-5 with tunable porosity for selective hydroxylation of benzene to phenol. J. Mater. Chem. 2010, 20, 8575–8581. [Google Scholar] [CrossRef]
  48. Teodorescu, C.M.; Esteva, J.M.; Karnatak, R.C.; El Afif, A. An approximation of the Voigt I profile for the fitting of experimental X-ray absorption data. Nucl. Instrum. Meth. Phys. Res. A 1994, 345, 141. [Google Scholar] [CrossRef]
  49. Mardare, D.; Luca, D.; Teodorescu, C.M.; Macovei, D. On the hydrophilicity of nitrogen-doped TiO2 thin films. Surf. Sci. 2007, 601, 4515–4520. [Google Scholar] [CrossRef]
  50. Luca, D.; Teodorescu, C.M.; Apetrei, R.; Macovei, D.; Mardare, D. Preparation and characterization of increased-efficiency photocatalytic TiO2–2xNx thin films. Thin Solid Films 2007, 515, 8605–8610. [Google Scholar] [CrossRef]
  51. Available online: https://www.thermofisher.com/ro/en/home/materials-science/learning-center/periodic-table/transition-metal/iron.html (accessed on 15 November 2023).
  52. Available online: https://www.thermofisher.com/ro/en/home/materials-science/learning-center/periodic-table/transition-metal/cobalt.html (accessed on 15 November 2023).
  53. Wu, W.; Zhang, Q.; Wang, X.; Han, C.; Shao, X.; Wang, Y.; Liu, J.; Li, Z.; Lu, X.; Wu, M. Enhancing Selective Photooxidation through Co−Nx-doped Carbon Materials as Singlet Oxygen Photosensitizers. ACS Catal. 2017, 7, 7267–7273. [Google Scholar] [CrossRef]
  54. Available online: https://www.thermofisher.com/ro/en/home/materials-science/learning-center/periodic-table/transition-metal/nickel.html (accessed on 15 November 2023).
  55. Available online: https://www.thermofisher.com/ro/en/home/materials-science/learning-center/periodic-table/transition-metal/titanium.html (accessed on 15 November 2023).
  56. Czuma, N.; Zarębska, K.; Motak, M.; Gálvez, M.E.; Da Costa, P. Ni/zeolite X derived from fly ash as catalysts for CO2 methanation. Fuel 2020, 267, 11713. [Google Scholar] [CrossRef]
  57. Alalga, L.; Benamar, A.; Trari, M. Hydrogen production via methane decomposition over nickel supported on synthesized ZSM-5/MCM41 zeolite composite material. Int. J. Hydrogen Energy 2021, 46, 28501–28512. [Google Scholar] [CrossRef]
  58. Ren, T.; Wang, S.; Lian, C.; Xu, W.; Xia, A.; Xie, X. Synthesis of the hierarchical Fe-substituted porous HBeta zeolite and the exploration of its catalytic performance. J. Fuel Chem. Technol. 2019, 47, 1476–1485. [Google Scholar]
  59. Zhang, T.; Qiu, Y.; Liu, G.; Chen, J.; Peng, Y.; Liu, B.; Li, J. Nature of active Fe species and reaction mechanism over high-efficiency Fe/CHA catalysts in catalytic decomposition of N2O. J. Catal. 2020, 392, 322–335. [Google Scholar] [CrossRef]
  60. Peng, X.Y.; Liu, L.J.; Shen, B.X.; Yao, B.I.; Su, L.C. Insight into the catalytic oxidation of toluene over M/ZSM-5 (M=Cu, Mn, Fe, Ce, Ti) catalysts. J. Fuel Chem. Technol. 2023, 51, 841–851. [Google Scholar] [CrossRef]
  61. Lebedeva, O.E.; Wolfgang, M.H.; Sachtler, W.M.H. Enhanced Reduction of Fe2O3 Caused by Migration of TM Ions out of Zeolite Channels. J. Catal. 2000, 191, 364–372. [Google Scholar] [CrossRef]
  62. Rabee, A.I.M.; Gaid, C.B.A.; Mekhemer, G.A.H.; Zaki, M.I. Combined TPR, XRD, and FTIR studies on the reduction behavior of Co3O4. Mater. Chem. Phys. 2022, 289, 126367. [Google Scholar] [CrossRef]
  63. Xue, C.H.; Wang, X.F.; Xun, W.A.; Deng, C.B.; Cao, M.M. Effect of highly dispersed Co3O4 on the catalytic performance of LaCoO3 perovskite in the combustion of lean methane. J. Fuel Chem. Technol. 2023, 51, 367–375. [Google Scholar]
  64. Wang, Y.; Wang, H.; Shao, Y.; Li, T.; Tatsumi, T.; Wang, J.-G. Direct Synthesis of Ti-Containing CFI-Type Extra-Large-Pore Zeolites in the Presence of Fluorides. Catalysts 2019, 9, 257. [Google Scholar] [CrossRef]
  65. Tang, B.; Dai, W.; Sun, X.; Guan, N.; Li, L.; Hunger, M. A procedure for the preparation of Ti-Beta zeolitesfor catalytic epoxidation with hydrogen peroxide. Green Chem. 2014, 16, 2281. [Google Scholar] [CrossRef]
  66. Saramok, M.; Szymaszek, A.; Inger, M.; Antoniak-Jurak, K.; Samojeden, B.; Motak, M. Modified Zeolite Catalyst for a NOx Selective Catalytic Reduction Process in Nitric Acid Plants. Catalysts 2021, 11, 450. [Google Scholar] [CrossRef]
  67. Bhargava, R.; Khana, S.; Ahmad, N.; Ansari, M.M.N. Investigation of Structural, Optical and Electrical Properties of Co3O4 Nanoparticles. In Proceedings of the 2nd International Conference on Condensed Matter and Applied Physics (ICC 2017), Bikaner, India, 24–25 November 2017. [Google Scholar] [CrossRef]
  68. Emayavaramban, P.; Babu, S.G.; Karvembu, R.; Dharmaraj, N. Nickel Oxide Doped Hydroxyapatite for Catalytic Oxidation of Alcohols to Carbonyl Compounds at Room Temperature. Adv. Sci. Eng. Med. 2014, 6, 659–666. [Google Scholar] [CrossRef]
  69. Gingasu, D.; Oprea, O.; Marinescu, G.; Calderon Moreno, J.M.; Culita, D.C.; Preda, S.; Surdu, V.-A. Structural, Morphological, and Optical Properties of Single and Mixed Ni-Co Aluminates Nanoparticles. Inorganics 2023, 11, 371. [Google Scholar] [CrossRef]
  70. Mannaa, M.A.; Qasim, K.F.; Alshorifi, F.T.; El-Bahy, S.M.; Salama, R.S. Role of NiO Nanoparticles in Enhancing Structure Properties of TiO2 and Its Applications in Photodegradation and Hydrogen Evolution. ACS Omega 2021, 6, 30386–30400. [Google Scholar] [CrossRef] [PubMed]
  71. Makuła, P.; Pacia, M.; Macyk, W. How to correctly determine the band gap energy of modified semiconductor photocatalysts based on UV−Vis spectra. J. Phys. Chem. Lett. 2018, 9, 6814–6817. [Google Scholar] [CrossRef] [PubMed]
  72. Jiang, D.; Otitoju, T.A.; Ouyang, Y.; Shoparwe, N.F.; Wang, S.; Zhang, A.; Li, S. A Review on Metal Ions Modified TiO2 for Photocatalytic Degradation of Organic Pollutants. Catalysts 2021, 11, 1039. [Google Scholar] [CrossRef]
  73. Din, S.T.U.; Xie, W.-F.; Yang, W. Synthesis of Co3O4 Nanoparticles-Decorated Bi12O17Cl2 Hierarchical Microspheres for Enhanced Photocatalytic Degradation of RhB and BPA. Int. J. Mol. Sci. 2022, 23, 15028. [Google Scholar] [CrossRef]
  74. Saha, A.; Moya, A.; Kahnt, A.; Iglesias, D.; Marchesan, S.; Wannemacher, R.; Prato, M.; Vilatela, J.J.; Guldi, D.M. Interfacial charge transfer in functionalized multiwalled carbon nanotube@TiO2 nanofibres. Nanoscale 2017, 8, 1–3. [Google Scholar]
  75. Negoescu, D.; Atkinson, I.; Gherendi, M.; Culita, D.C.; Baran, A.; Petrescu, S.; Trica, B.; Ionescu, R.; Pelinescu, D.; Bratan, V.; et al. Brij 58–activated carbon assisted synthesis of Ag/Ag2O/TiO2-AC photocatalysts for efficient organic pollutants degradation. J. Alloys Comp. 2023, 931, 167528. [Google Scholar] [CrossRef]
  76. Hassan, S.M.; Ahmed, A.I.; Mannaa, M.A. Surface Acidity, Catalytic and Photocatalytic Activities of New Type H3PW12O40/Sn-TiO2 Nanoparticles. Colloid. Surf. Physicochem. Eng. Aspect. 2019, 577, 147–157. [Google Scholar] [CrossRef]
  77. Li, D.; Cheng, X.; Yu, X.; Xing, Z. Preparation and Characterization of TiO2-Based Nanosheets for Photocatalytic Degradation of Acetylsalicylic Acid: Influence of Calcination Temperature. Chem. Eng. J. 2015, 279, 994–1003. [Google Scholar] [CrossRef]
  78. Zhou, M.; Yu, J.; Liu, S.; Zhai, P.; Jiang, L. Effects of Calcination Temperatures on Photocatalytic Activity of SnO2/TiO2 Composite Films Prepared by an EPD Method. J. Hazard. Mater. 2008, 154, 1141–1148. [Google Scholar] [CrossRef]
  79. Liqiang, J.; Yichun, Q.; Baiqi, W.; Shudan, L.; Baojiang, J.; Libin, Y.; Wei, F.; Honggang, F.; Jiazhong, S. Review of photoluminescence performance of nano-sized semiconductor materials and its relationships with photocatalytic activity. Sol. Energy Mater Sol. Cells 2006, 90, 1773–1787. [Google Scholar] [CrossRef]
  80. Lizeth Katherine, T.N.; Vendula, B.; Jaroslav, K.; Jaroslav, C. Structure and Photocatalytic Properties of Ni-, Co-, Cu-, and Fe-Doped TiO2 Aerogels. Gel 2023, 9, 357. [Google Scholar] [CrossRef] [PubMed]
  81. Sun, L.; Zhai, J.; Li, H.; Zhao, Y.; Yang, H.; Yu, H. Study of Homologous Elements: Fe, Co, and Ni Dopant Effects on the Photoreactivity of TiO2 Nanosheets. ChemCatChem 2014, 6, 339–347. [Google Scholar] [CrossRef]
  82. Liang, W.; Xu, G.; Fu, Y. Selective photocatalytic oxidation of furfural to C4 compounds with metal-TS-1 zeolite. Appl. Catal. B. 2024, 340, 123220. [Google Scholar] [CrossRef]
  83. Saeed, M.; Usman, M.; Ibrahim, M.; Haq, A.; Khan, I.; Ijaz, H.; Akram, F. Enhanced photo catalytic degradation of methyl orange using p–n Co3O4-TiO2 heterojunction as catalyst. Int. J. Chem. React. Eng. 2020, 18, 20200004. [Google Scholar] [CrossRef]
  84. Tang, J.; Fu, M.; Mao, Y.; Yang, S.; Lin, W.; Yu, Y.; Song, S. Decorating {0 0 1} TiO2 nanosheets on hydrophobic NaY zeolite: An efficient deactivation-resistant photocatalyst for gaseous toluene removal. Chem. Eng. J. 2023, 472, 144883. [Google Scholar] [CrossRef]
Figure 1. XRD patterns of the (a) 1TY(F/C/N) samples and (b) 2TY(F/C/N) samples.
Gels 10 00129 g001
Figure 2. TEM images of (a) 1TY, (b) 1TYF, (c) 1TYC, and (d) 1TYN samples.
Gels 10 00129 g002
Figure 3. SEM images of (a) 1TY, (b) 1TYF, (c) 1TYC, and (d) 1TYN samples.
Gels 10 00129 g003
Figure 4. N2 adsorption–desorption isotherms of the investigated materials.
Gels 10 00129 g004
Figure 5. UV-Raman spectra of the (1/2)TY (F/C/N) samples and zeolite Y (n ≤ 6 and T stands for Al, Ti, and Si).
Gels 10 00129 g005
Figure 6. XPS full scan survey spectra for the samples, indicating all the elements.
Gels 10 00129 g006
Figure 7. XPS spectra of Fe 2p (a) for the samples 1TYF and 2TYF and their deconvolutions with the interpretation. Red symbols—raw data, black line—fit, grey, blue, and green lines—the main components; the other components (yellow-green, orange and magenta lines) are the satellites of Fe(II) and Fe(III); the red dashed line is the Shirley background.
Gels 10 00129 g007
Figure 8. Fitted XPS spectra of Co 2p (red symbols—raw data, black line—fit, blue and green lines—the main components; the other components are the satellites and the Auger line of Co 2p) and of Ni 2p (red symbols—raw data, black line—fit, grey, blue and green lines—the main components; the other components (yellow-green, orange and magenta lines) are the satellites of Ni (2p); the red dashed line is the Shirley background.
Gels 10 00129 g008
Figure 9. XPS spectra of Ti 2p for all the samples (mentioned on each spectrum).
Gels 10 00129 g009
Figure 10. (a) H2-TPR profiles of samples with Fe, Co, and Ni oxides supported on zeolite support with 2% TiO2, and (b) H2-TPR comparative profiles of supported and commercial Co3O4 oxide.
Gels 10 00129 g010
Figure 11. UV–Vis absorption spectra of the synthesized photocatalysts.
Gels 10 00129 g011
Figure 12. Band gap energy (Eg) determination for indirect transitions from the Tauc plot.
Gels 10 00129 g012aGels 10 00129 g012b
Figure 13. Valence band XPS spectra of the photocatalyst, with linear fits through the highest energy slopes of the valence band regions.
Gels 10 00129 g013
Figure 14. PL spectra of Ti-zeolite Y and Fe/Co/Ni modified Ti-zeolite Y with different TiO2 content (λexc. = 320 nm), green arrow suggests the shift of the signals attributed to the band to band transitions after modification with Fe, Co and Ni.
Gels 10 00129 g014
Figure 15. Photocatalytic performances of the samples under visible light irradiation.
Gels 10 00129 g015
Figure 16. Possible mechanism of photocatalytic degradation of cefuroxime over Ti-zeolite Y modified with (a) Fe, (b) Co, or (c) Ni oxides.
Gels 10 00129 g016
Figure 17. Scavenger experiments for the photocatalytic degradation of cefuroxime using Ti-zeolite Y modified with Fe, Co, or Ni oxides.
Gels 10 00129 g017
Figure 18. Photocatalytic performances of the photocatalysts during three consecutive recycling reactions.
Gels 10 00129 g018
Figure 19. Wide-angle X-ray diffraction patterns of the samples before and after three consecutive recycling experiments.
Gels 10 00129 g019
Figure 20. Flowchart for the synthesis of the photocatalysts.
Gels 10 00129 g020
Table 1. Textural parameters of the investigated materials.
SampleBET Surface Area (m2/g)Micropore Area (m2/g)Mesopore Area (m2/g)Total Pore Volume (cm3/g)Micropore Volume (cm3/g)
1TY649585640.3160.221
2TY591521700.3200197
1TYC588532560.3140.201
2TYC481433480.2780.163
1TYF573510630.3190.193
2TYF489409800.3220.156
1TYN551484670.2980.183
2TYN517461560.2930.174
Table 3. Assignments of the absorption peaks recorded for the samples.
SampleAbsorption Peak PositionAssignmentRef.
1TY
2TY
210 nmframework Ti species (Ti4+O2− → Ti3+O charge transfer)[64]
250 nmextra-framework Ti species
330 nmanatase traces
1TYF
2TYF
260 nmcharge transfer of oxygen to Fe3+ cations in octahedral coordination[66]
350 nmextra-framework FeOx oligomers
480 nmoxygen-to-metal charge transfer transitions that involve octahedral Fe3+ species
1TYC
2TYC
440 nmO2− → Co2+ charge transfer transition[32,67]
710 nmO2− → Co3+ charge transfer transition
1TYN
2TYN
420 nm3A2g3T1g (P) charge transfer transition[70]
690 nm3A2g3T1g (F) charge transfer transition
Table 4. Band gap values of the photocatalysts.
Sample1TYF1TYN1TYC2TYF2TYN2TYC
Eg (eV)1.232.741.301.422.921.26
Disclaimer/Publisher’s Note: The statements, opinions and data contained in all publications are solely those of the individual author(s) and contributor(s) and not of MDPI and/or the editor(s). MDPI and/or the editor(s) disclaim responsibility for any injury to people or property resulting from any ideas, methods, instructions or products referred to in the content.

