
Copper-/Zinc-Doped TiO2 Nanopowders Synthesized by Microwave-Assisted Sol–Gel Method
 , ,
, ,  , and
, and 
Abstract
:
1. Introduction
2. Results and Discussion
2.1. As-Prepared Samples
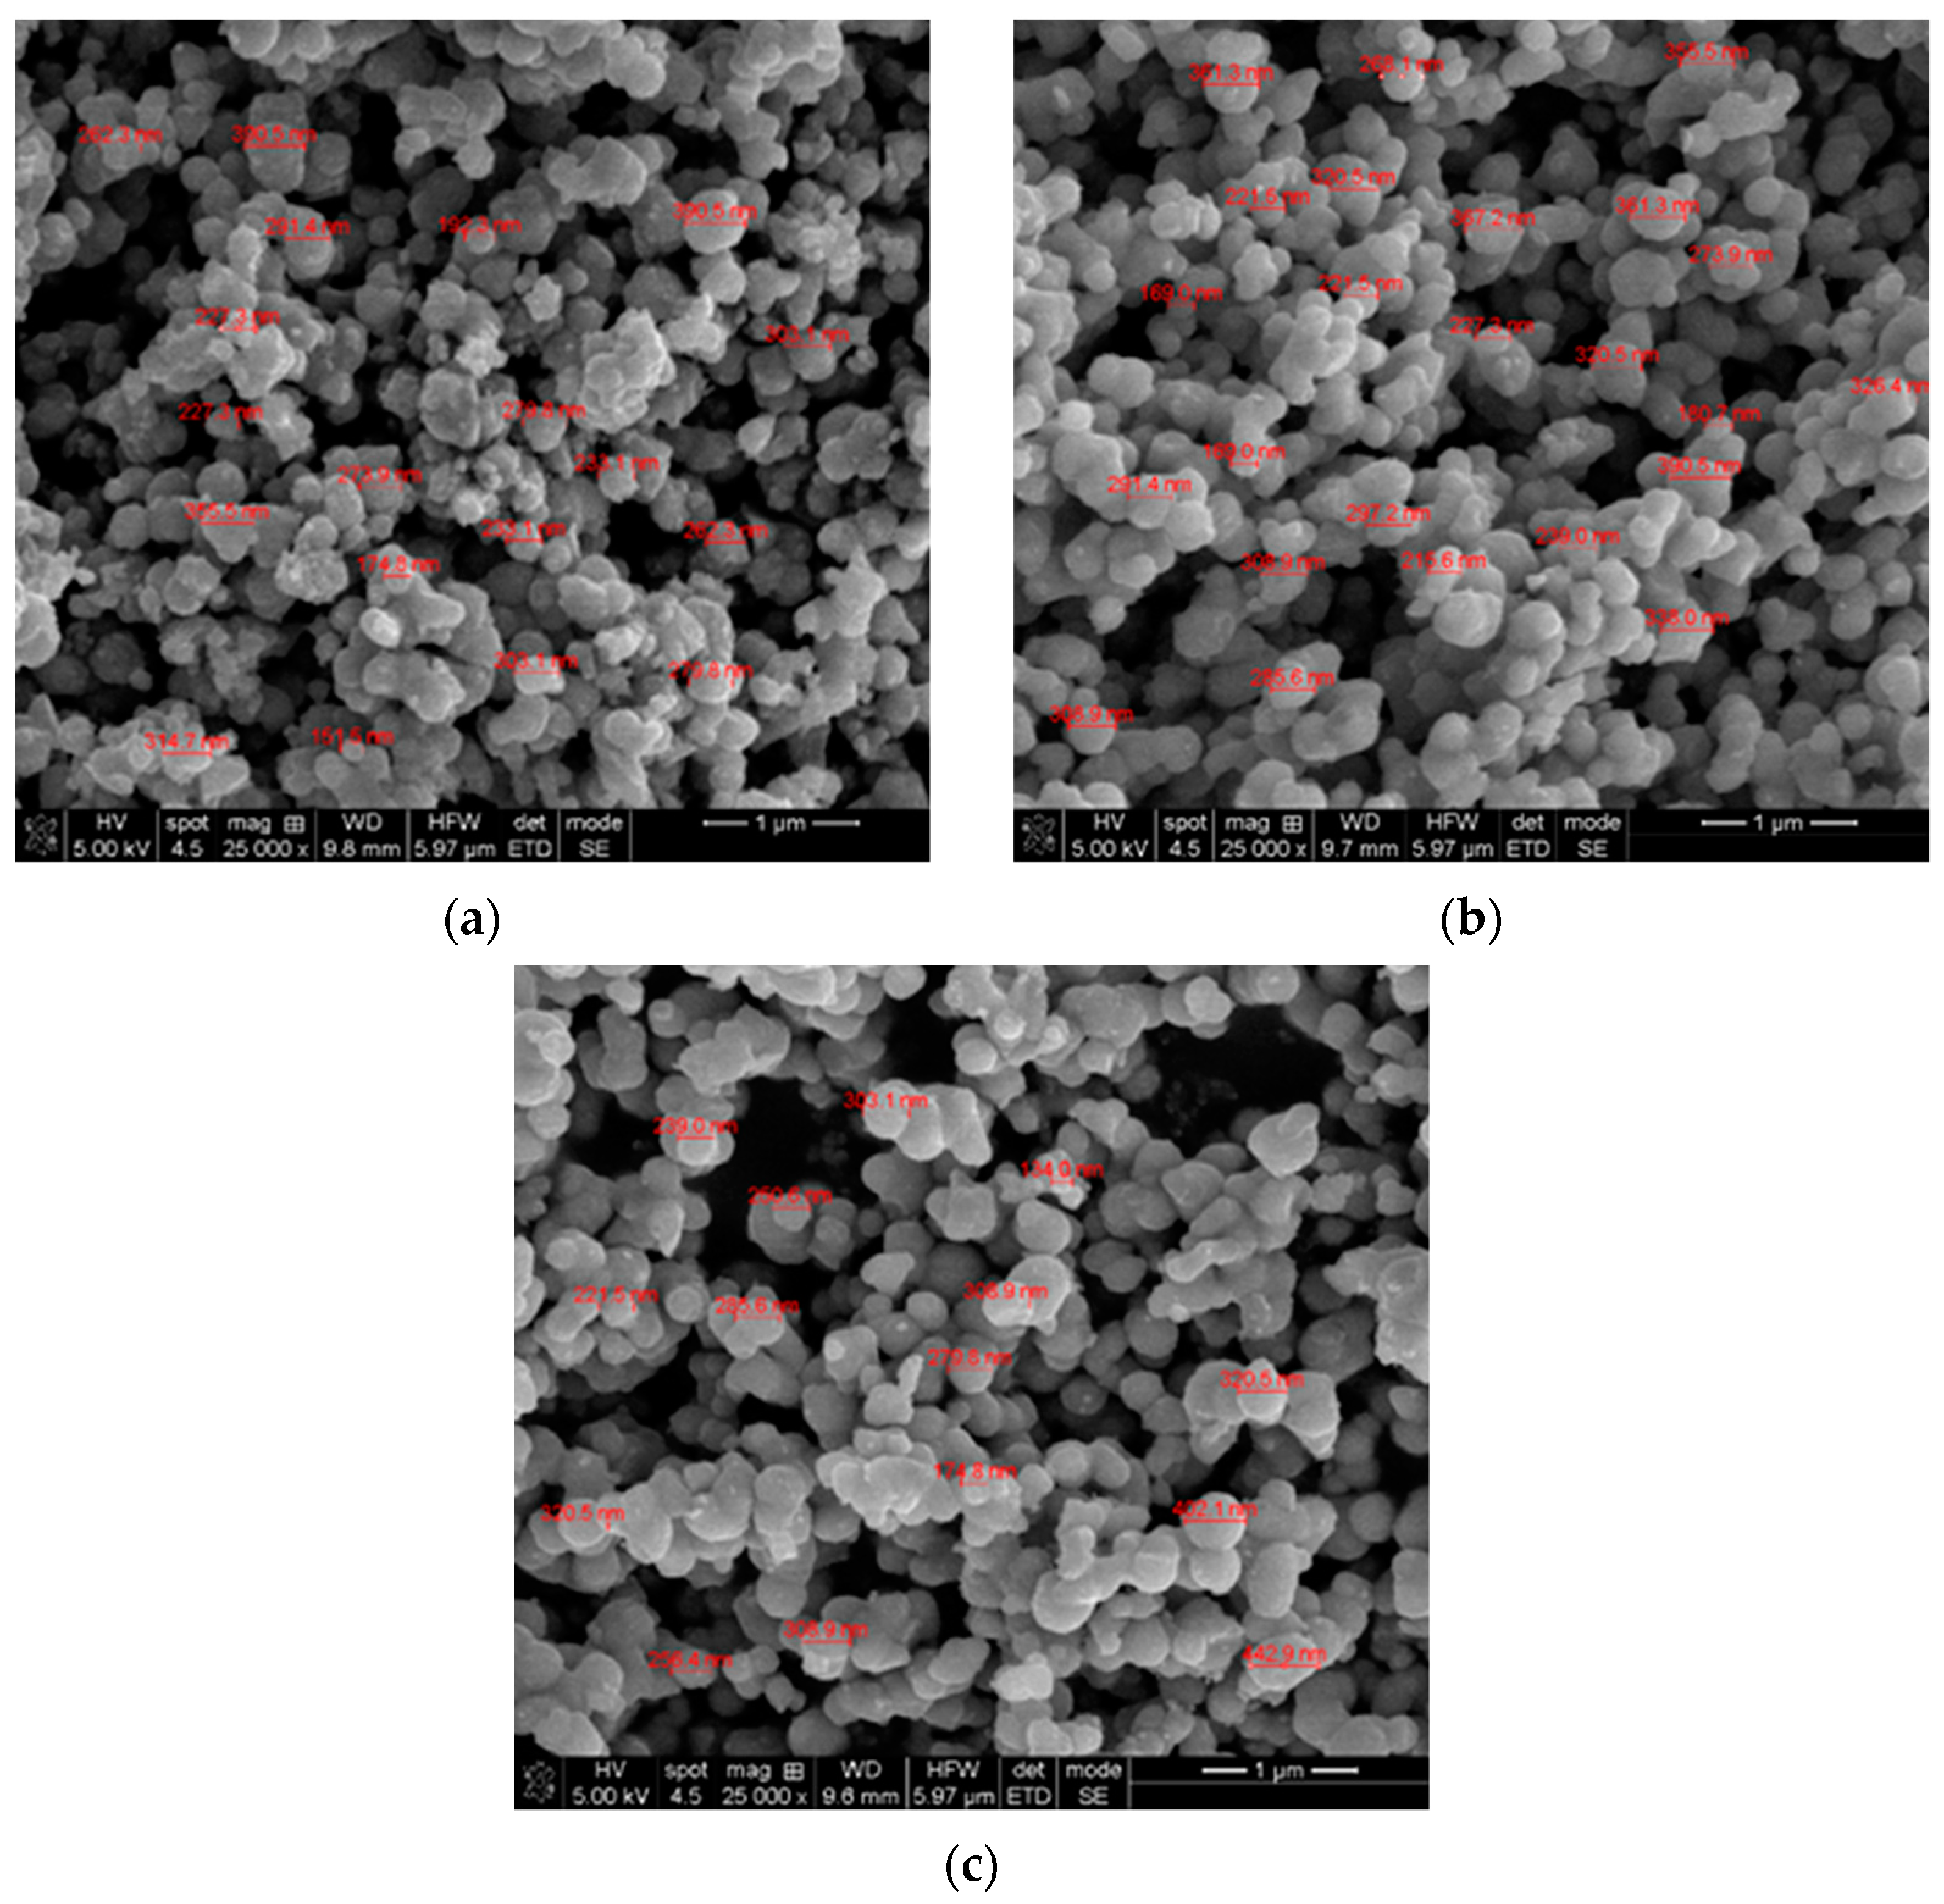
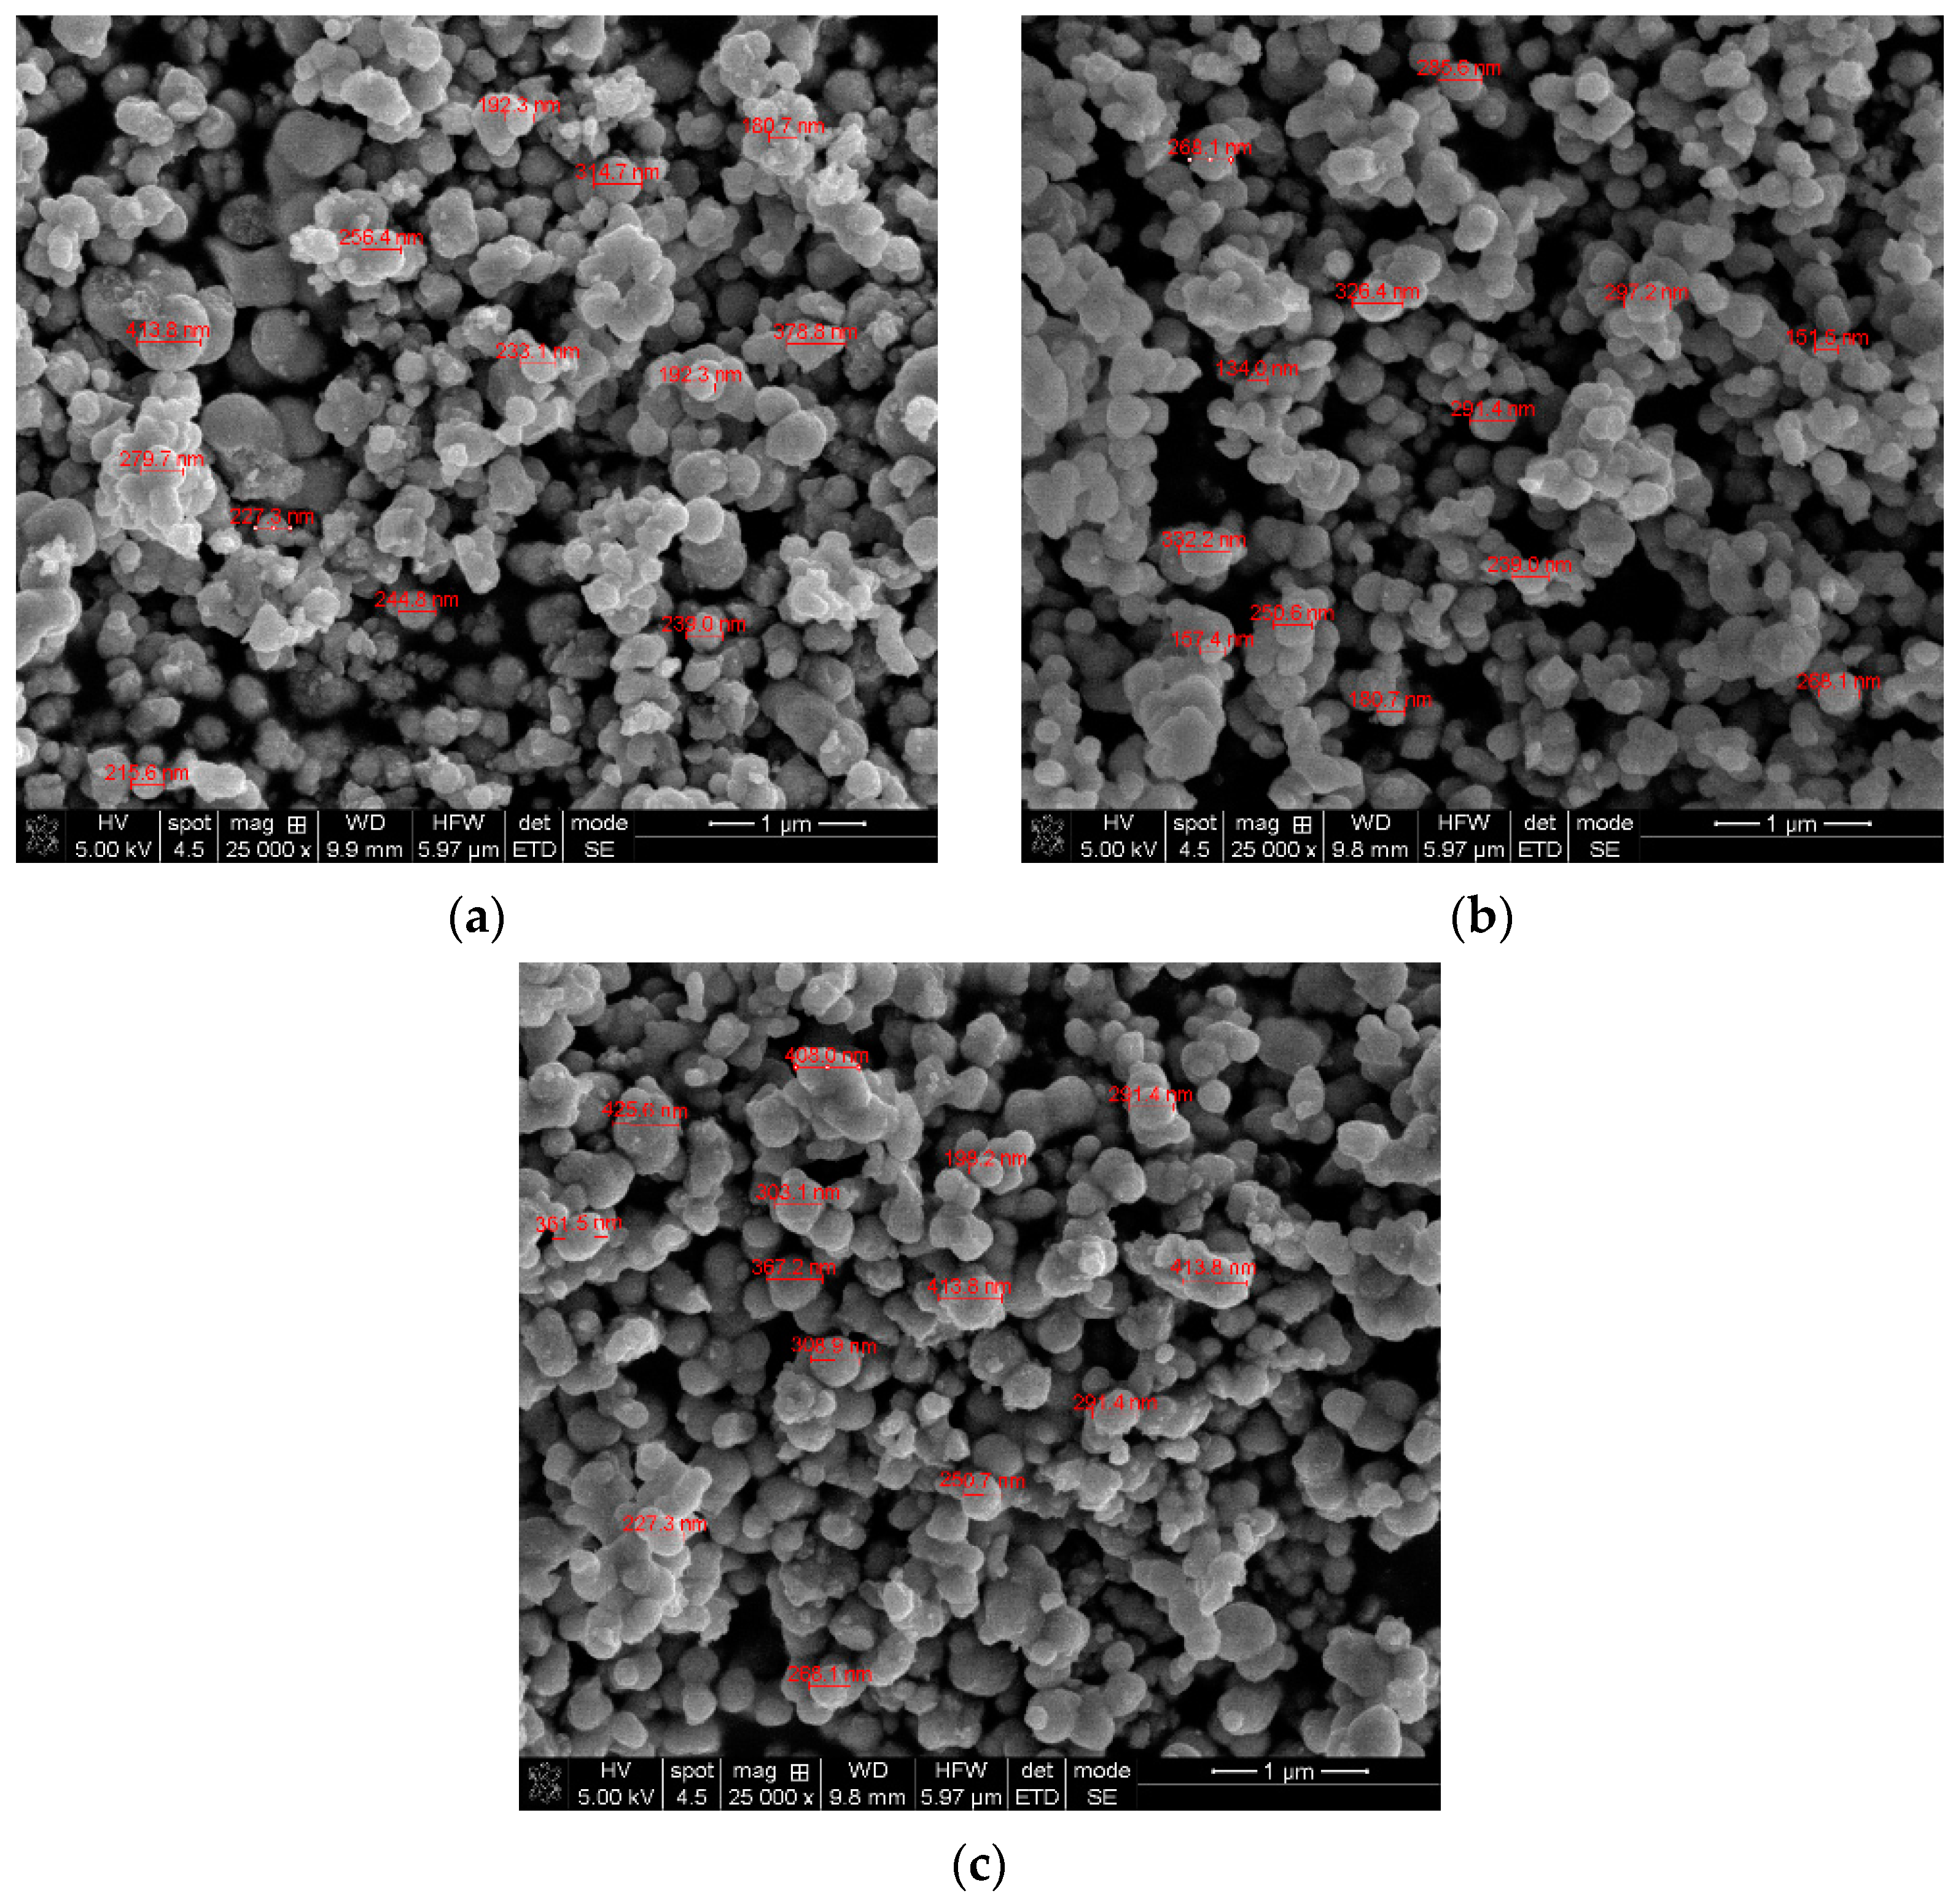
2.1.1. SEM Results
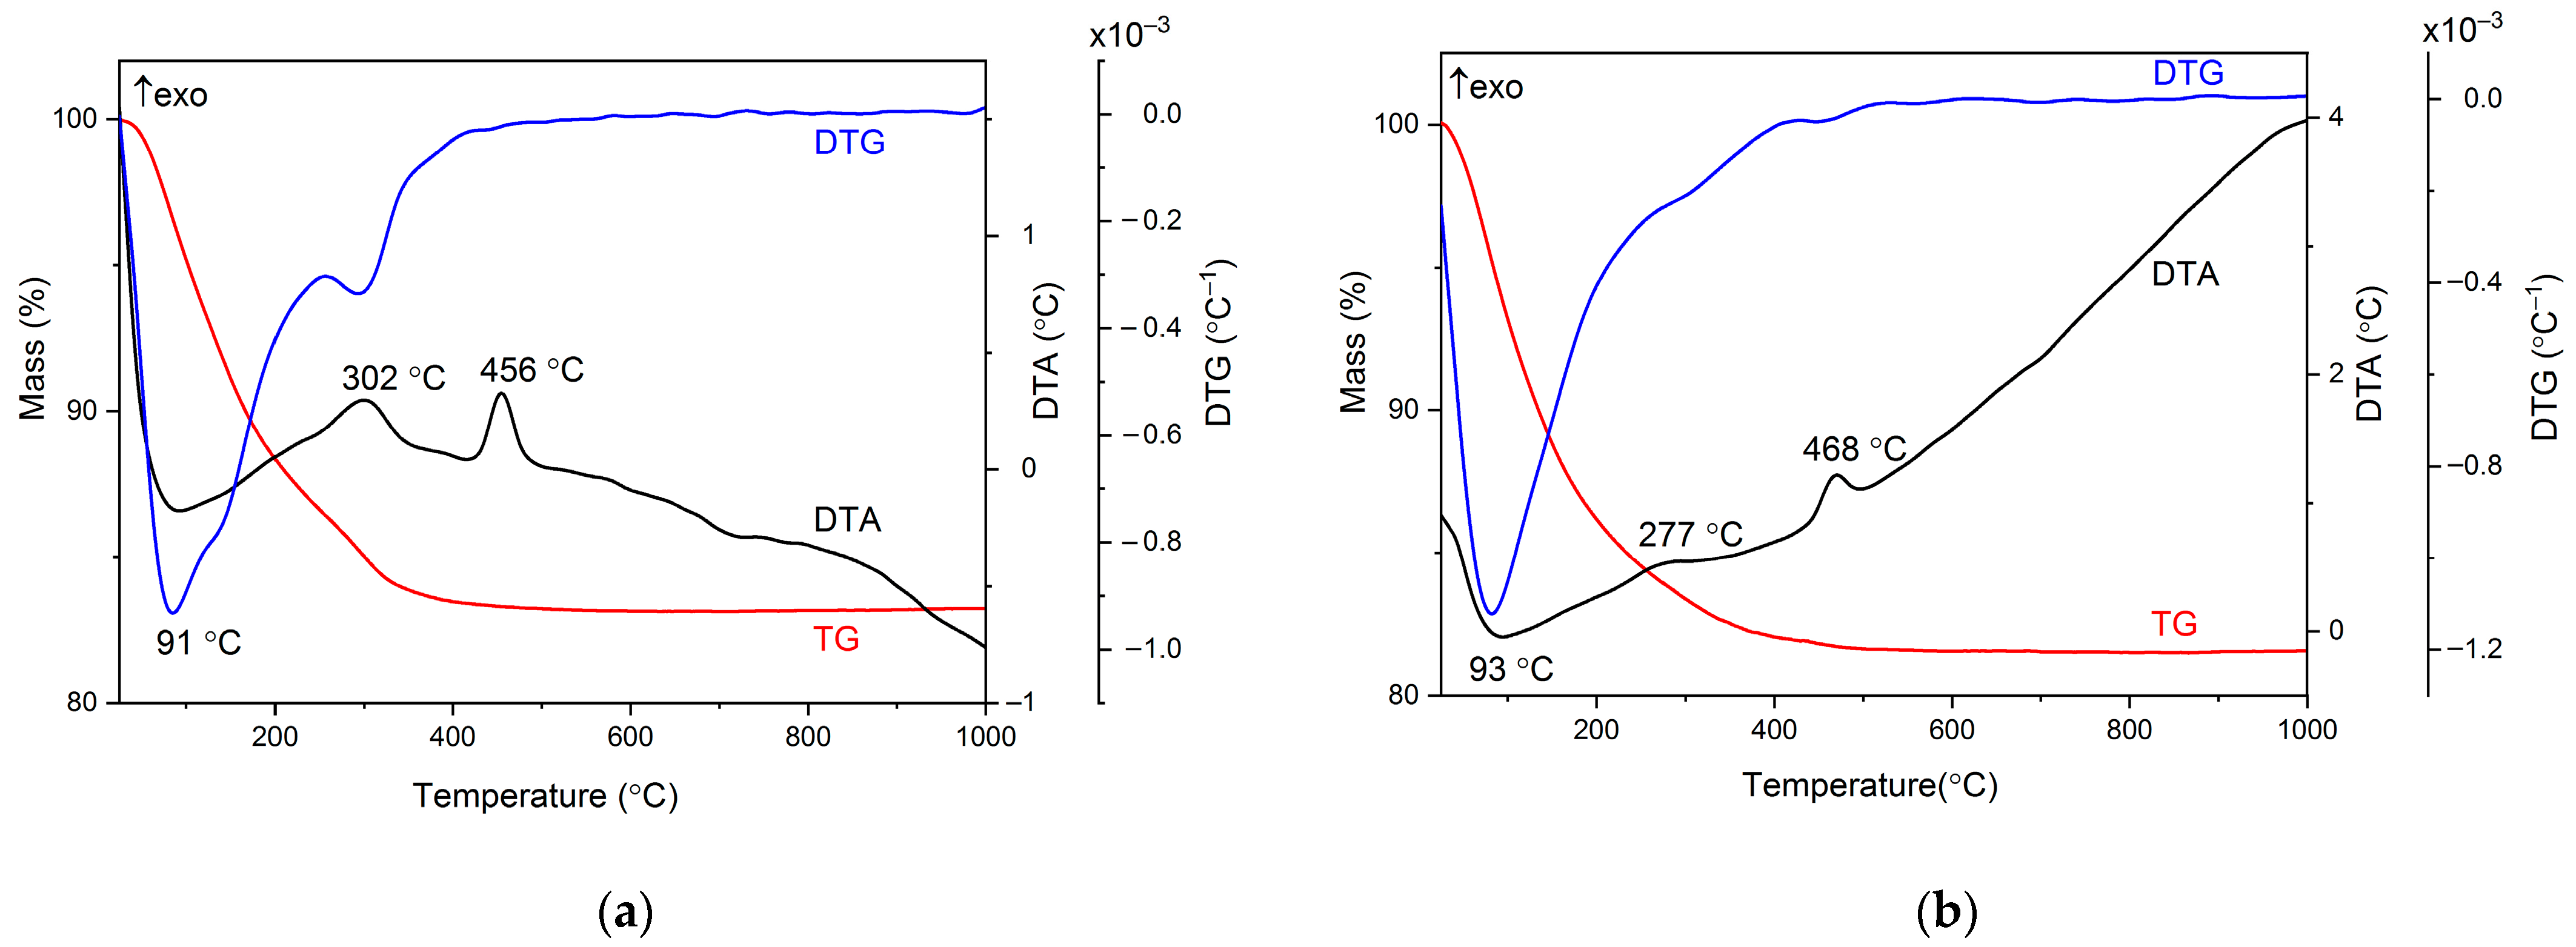
2.1.2. Thermal Behavior
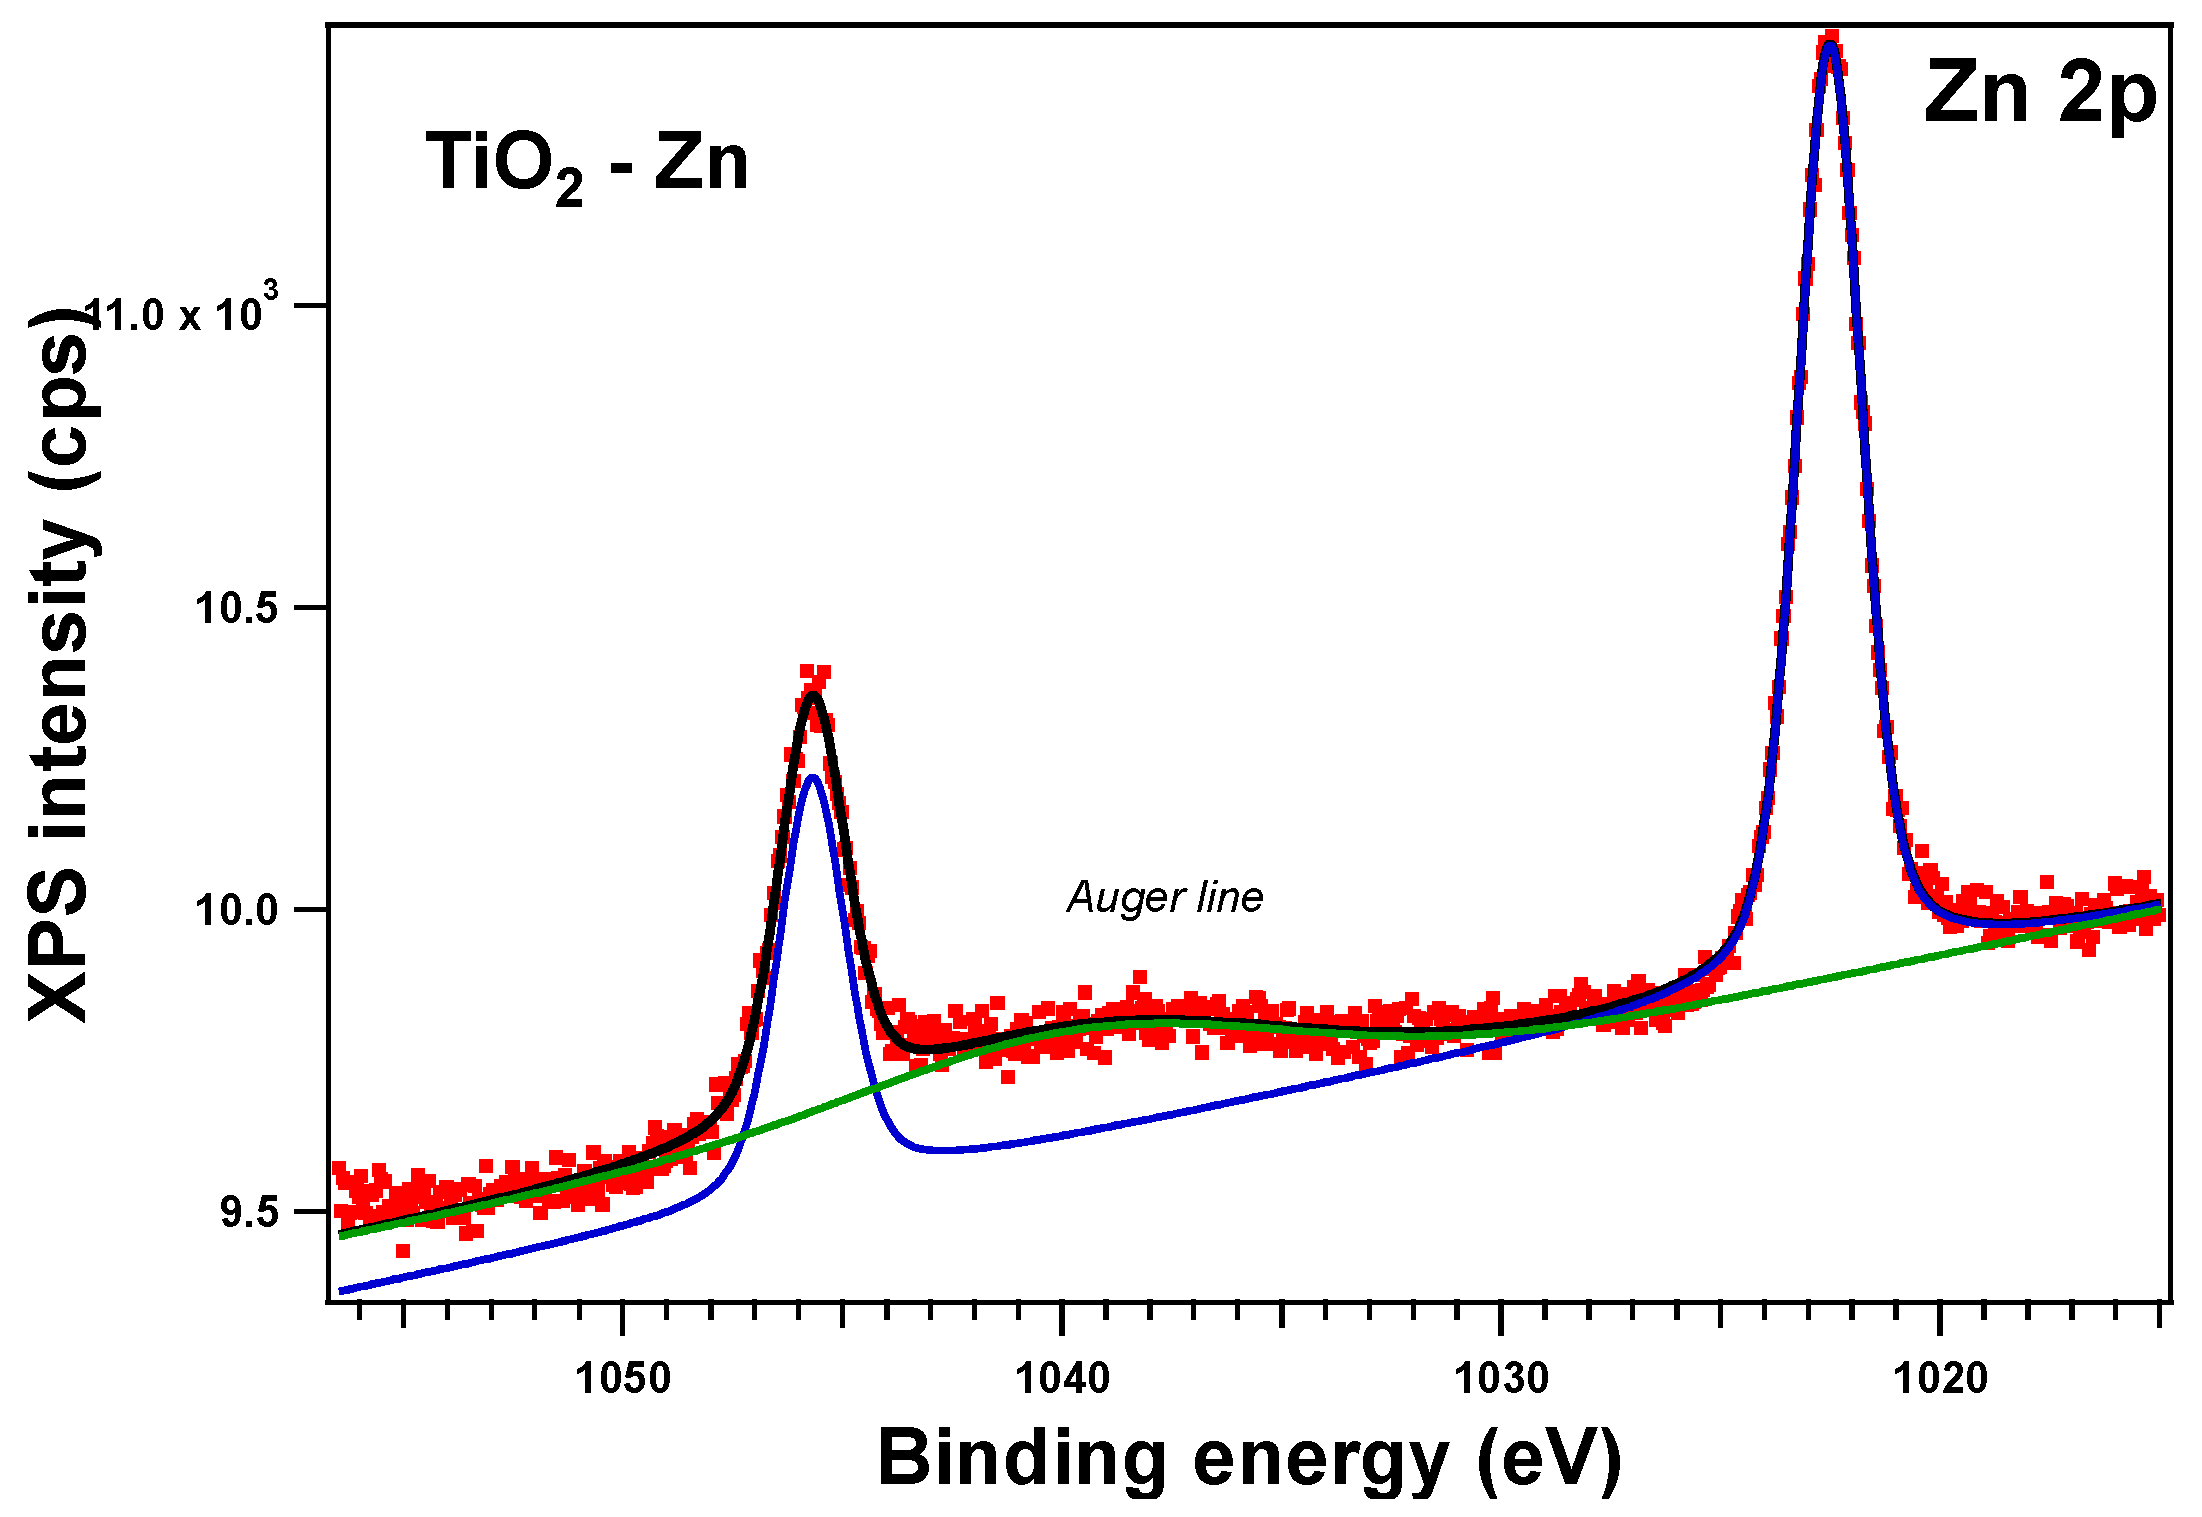
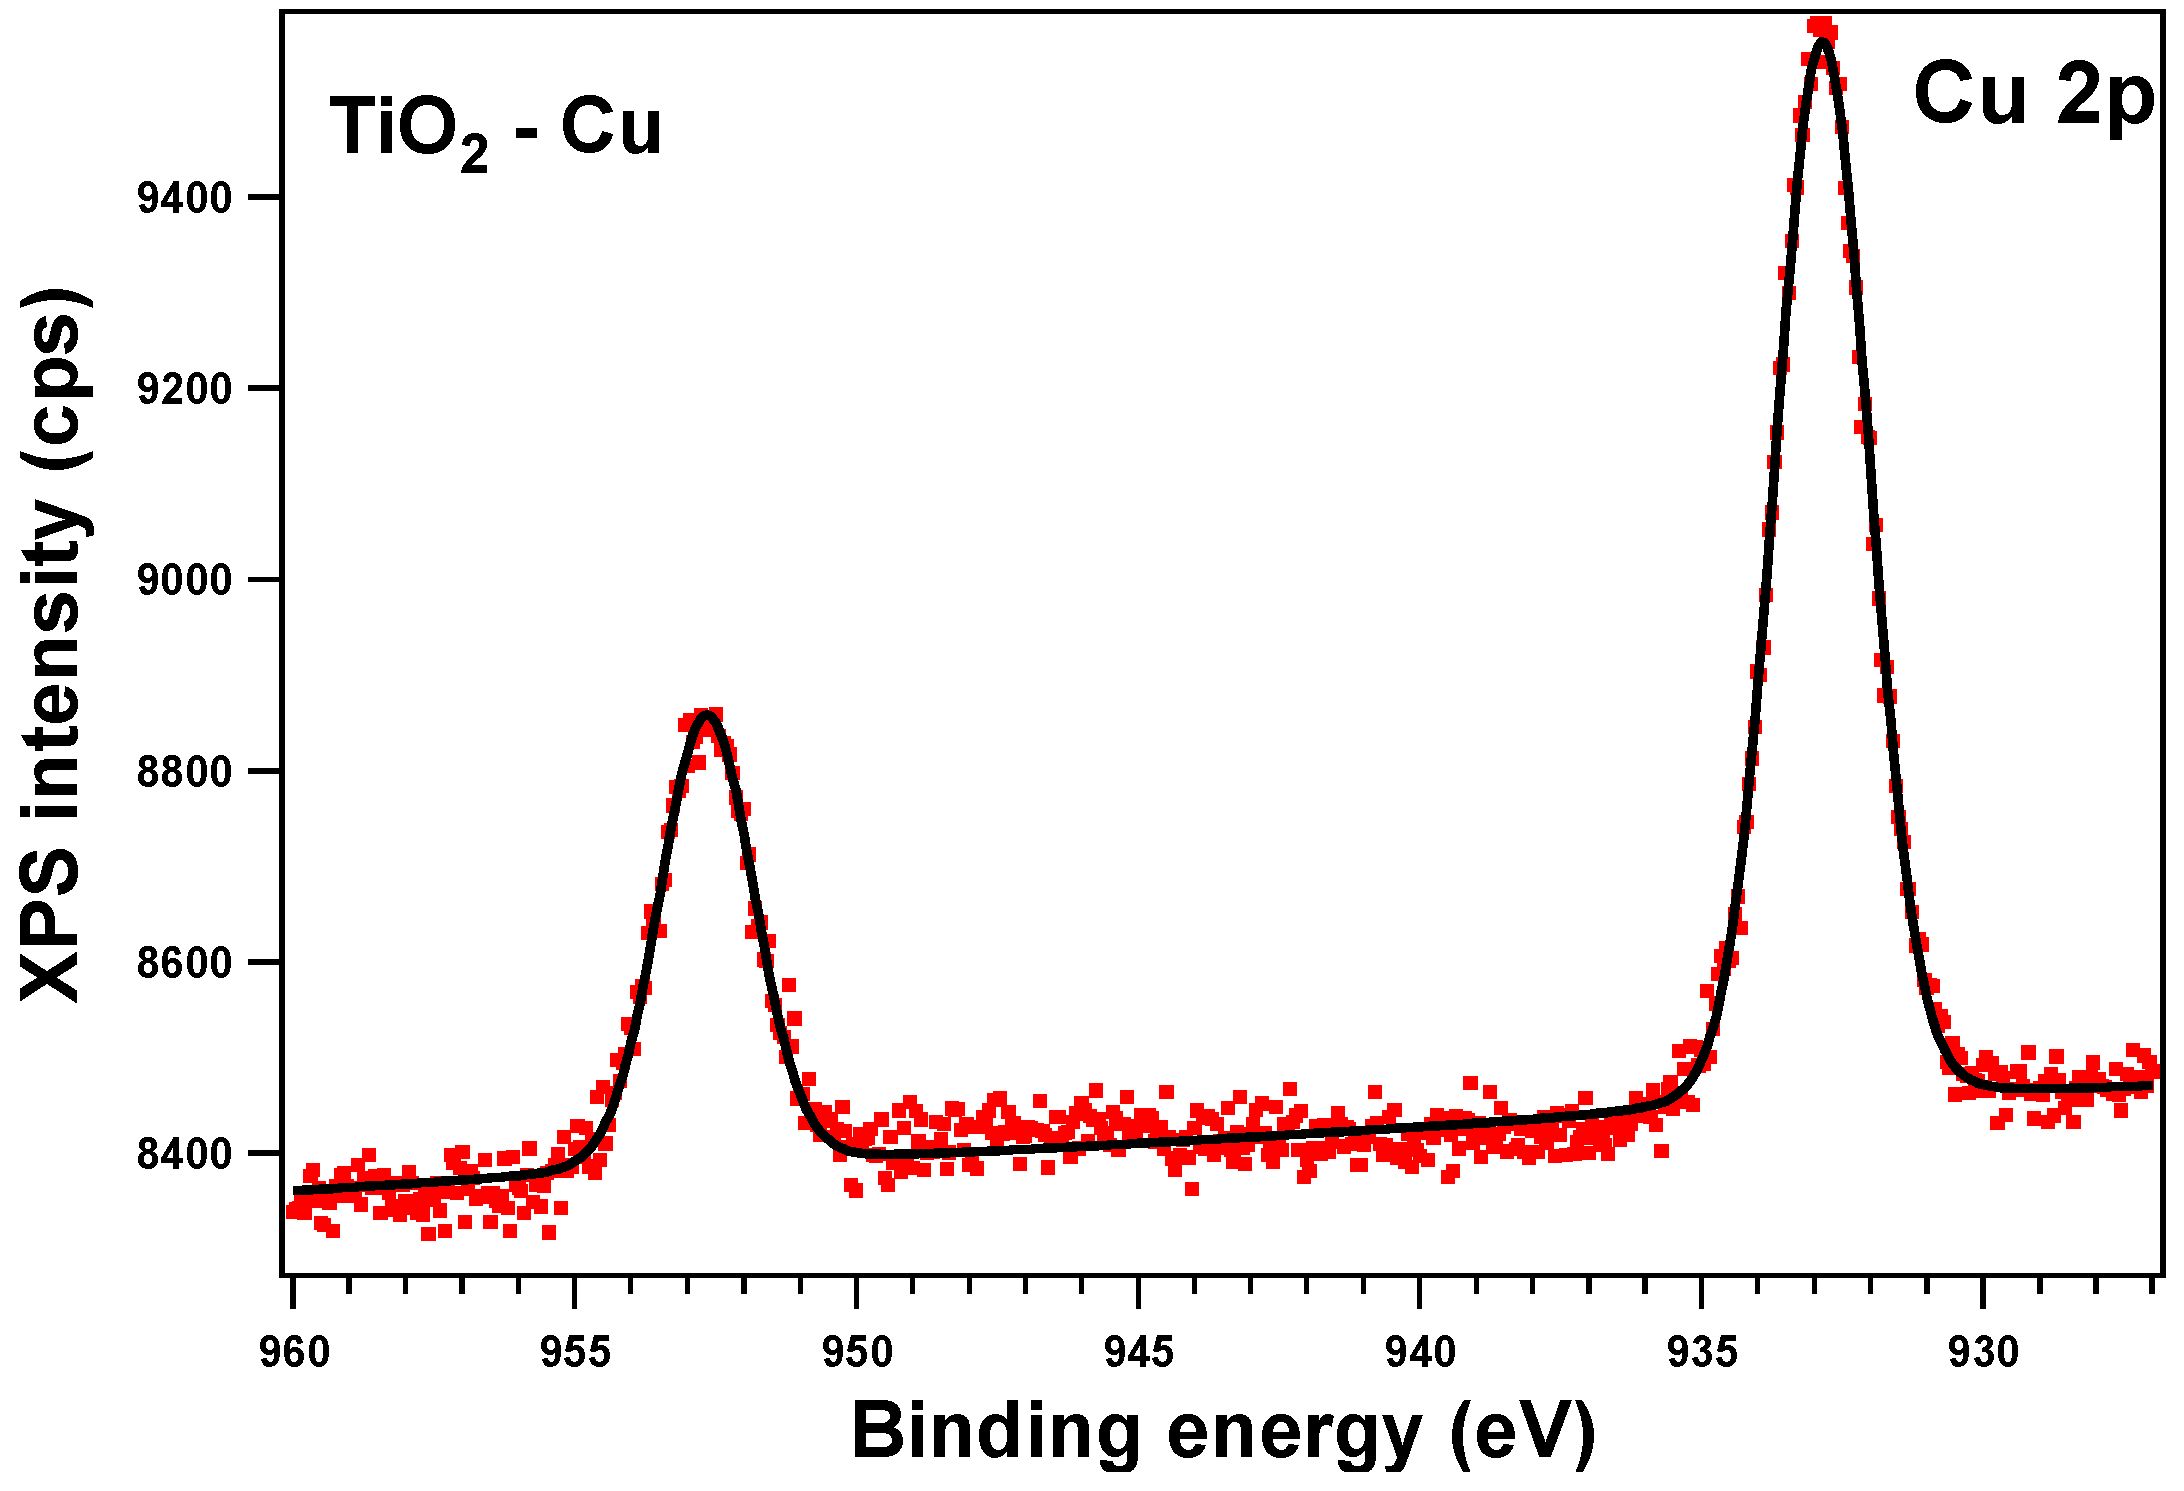
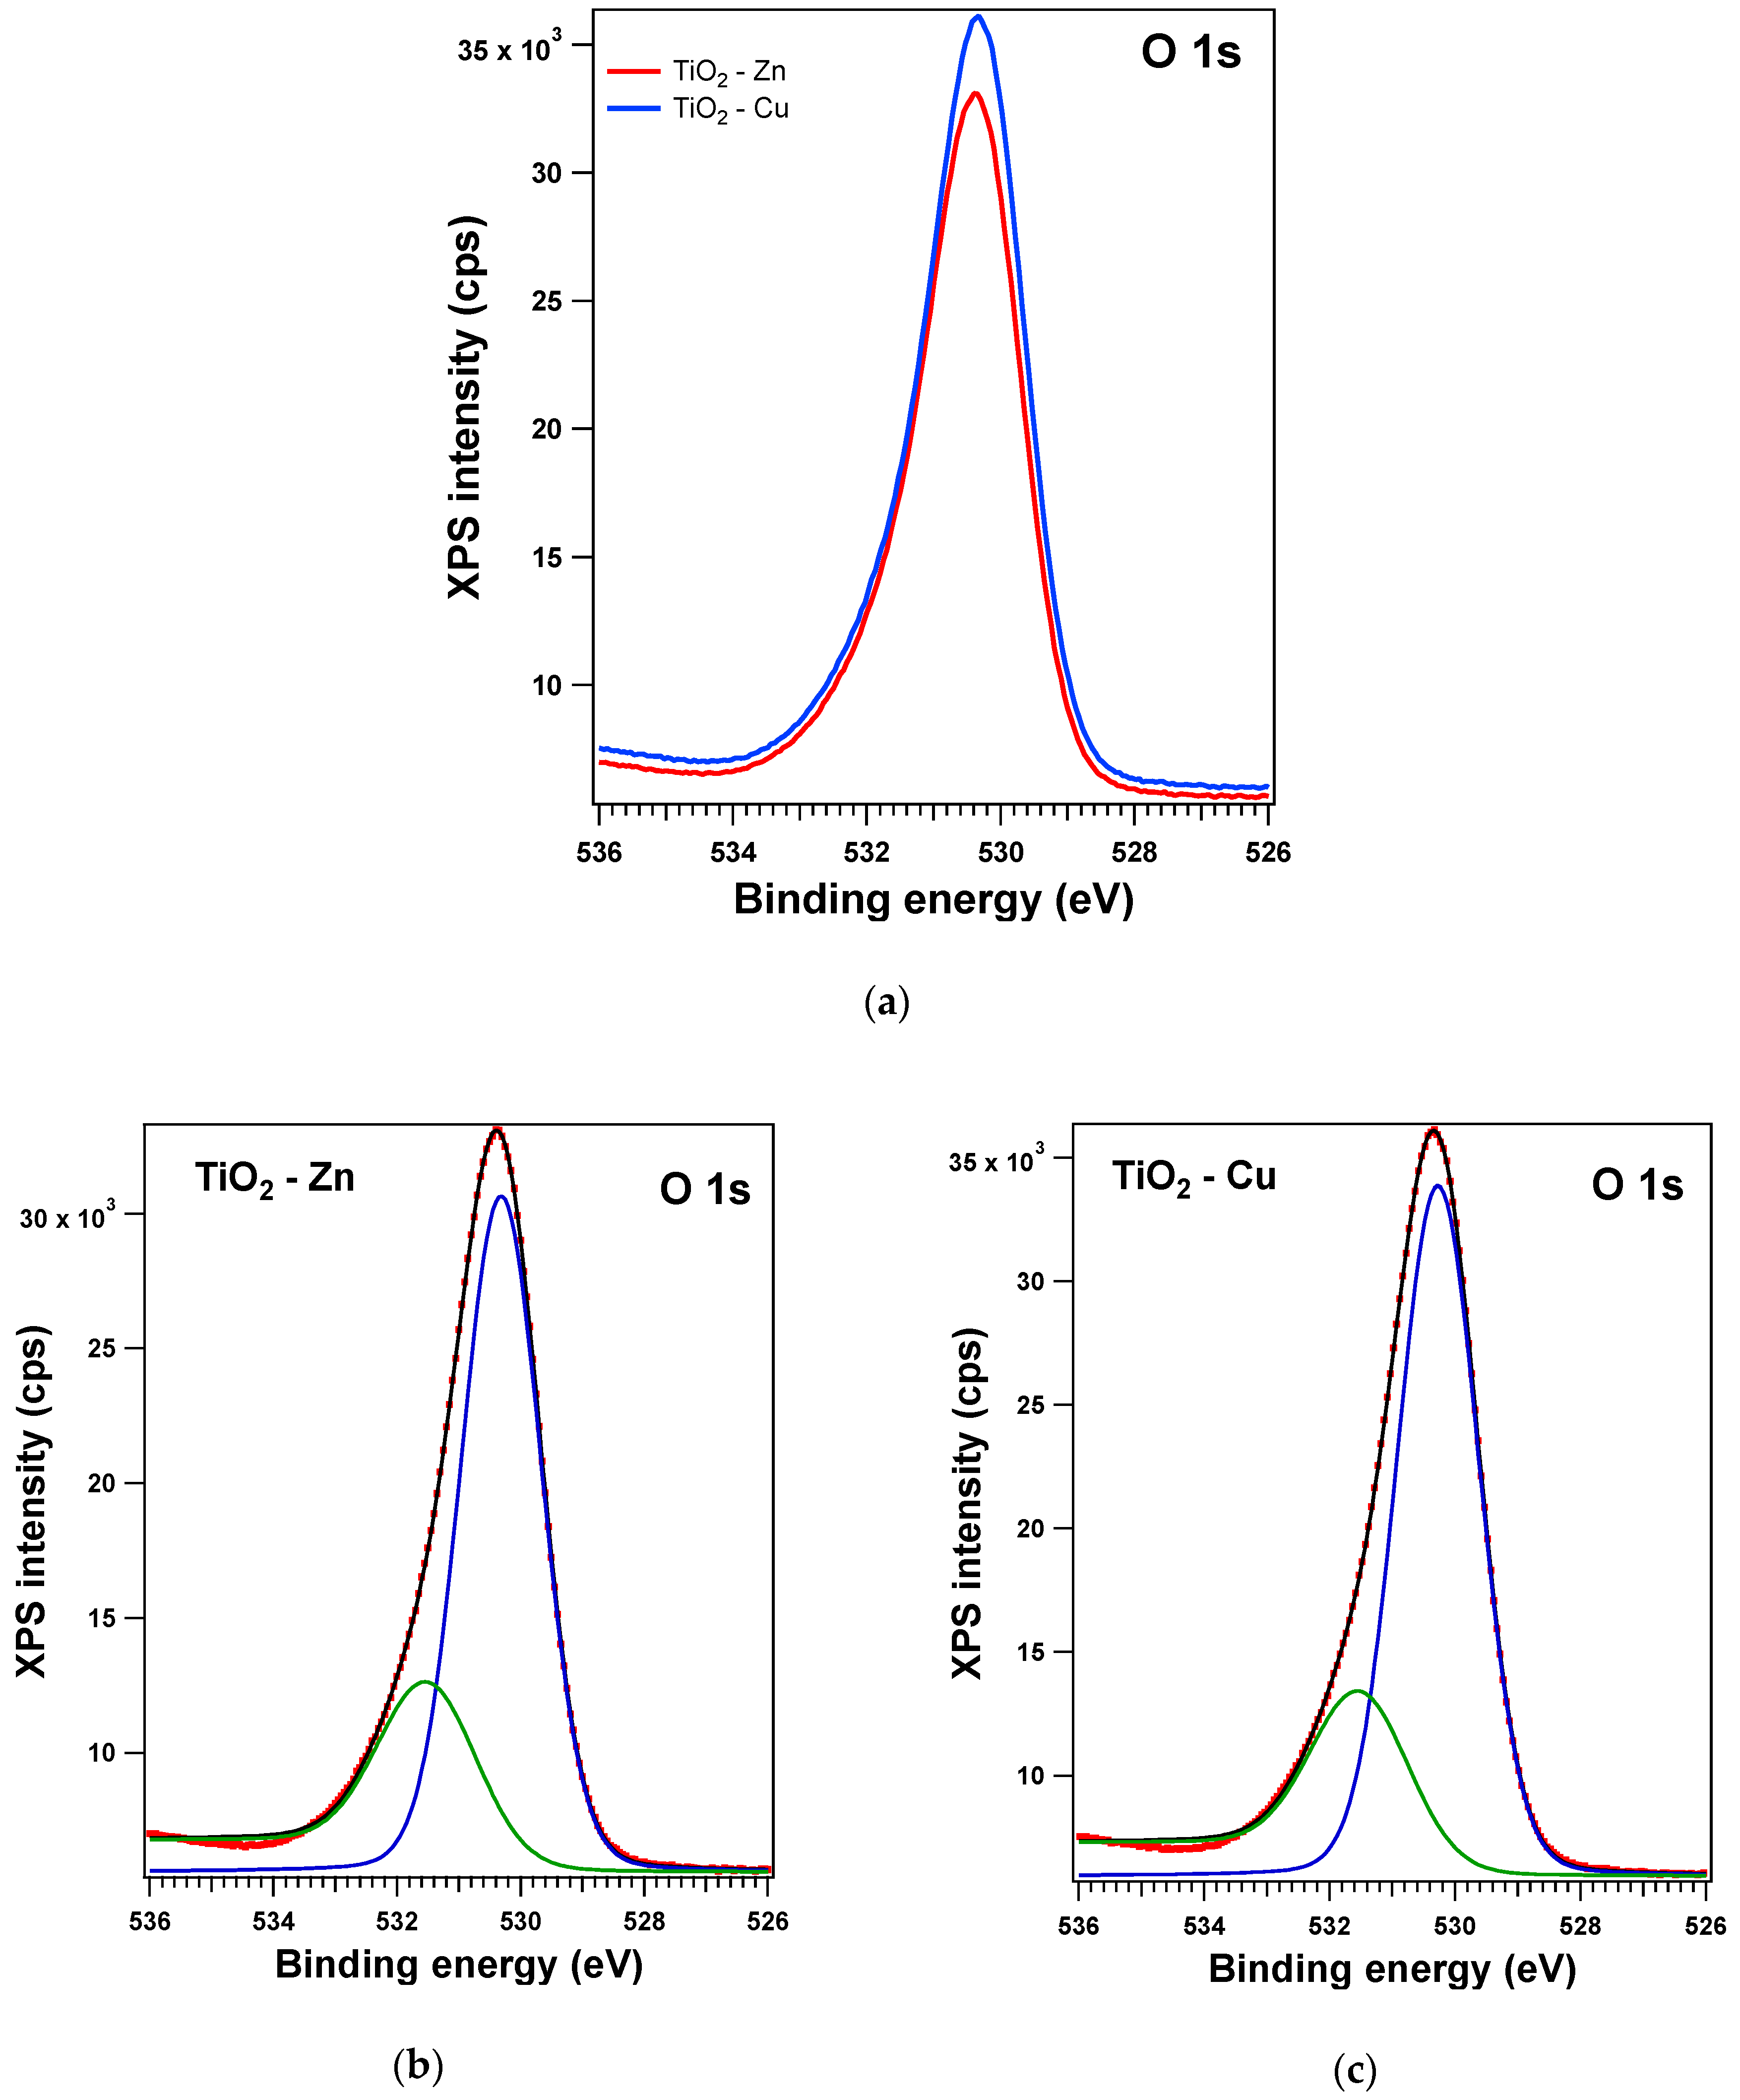
2.1.3. XPS on the As-Prepared Samples
2.2. Thermally Treated Samples
2.2.1. SEM Results
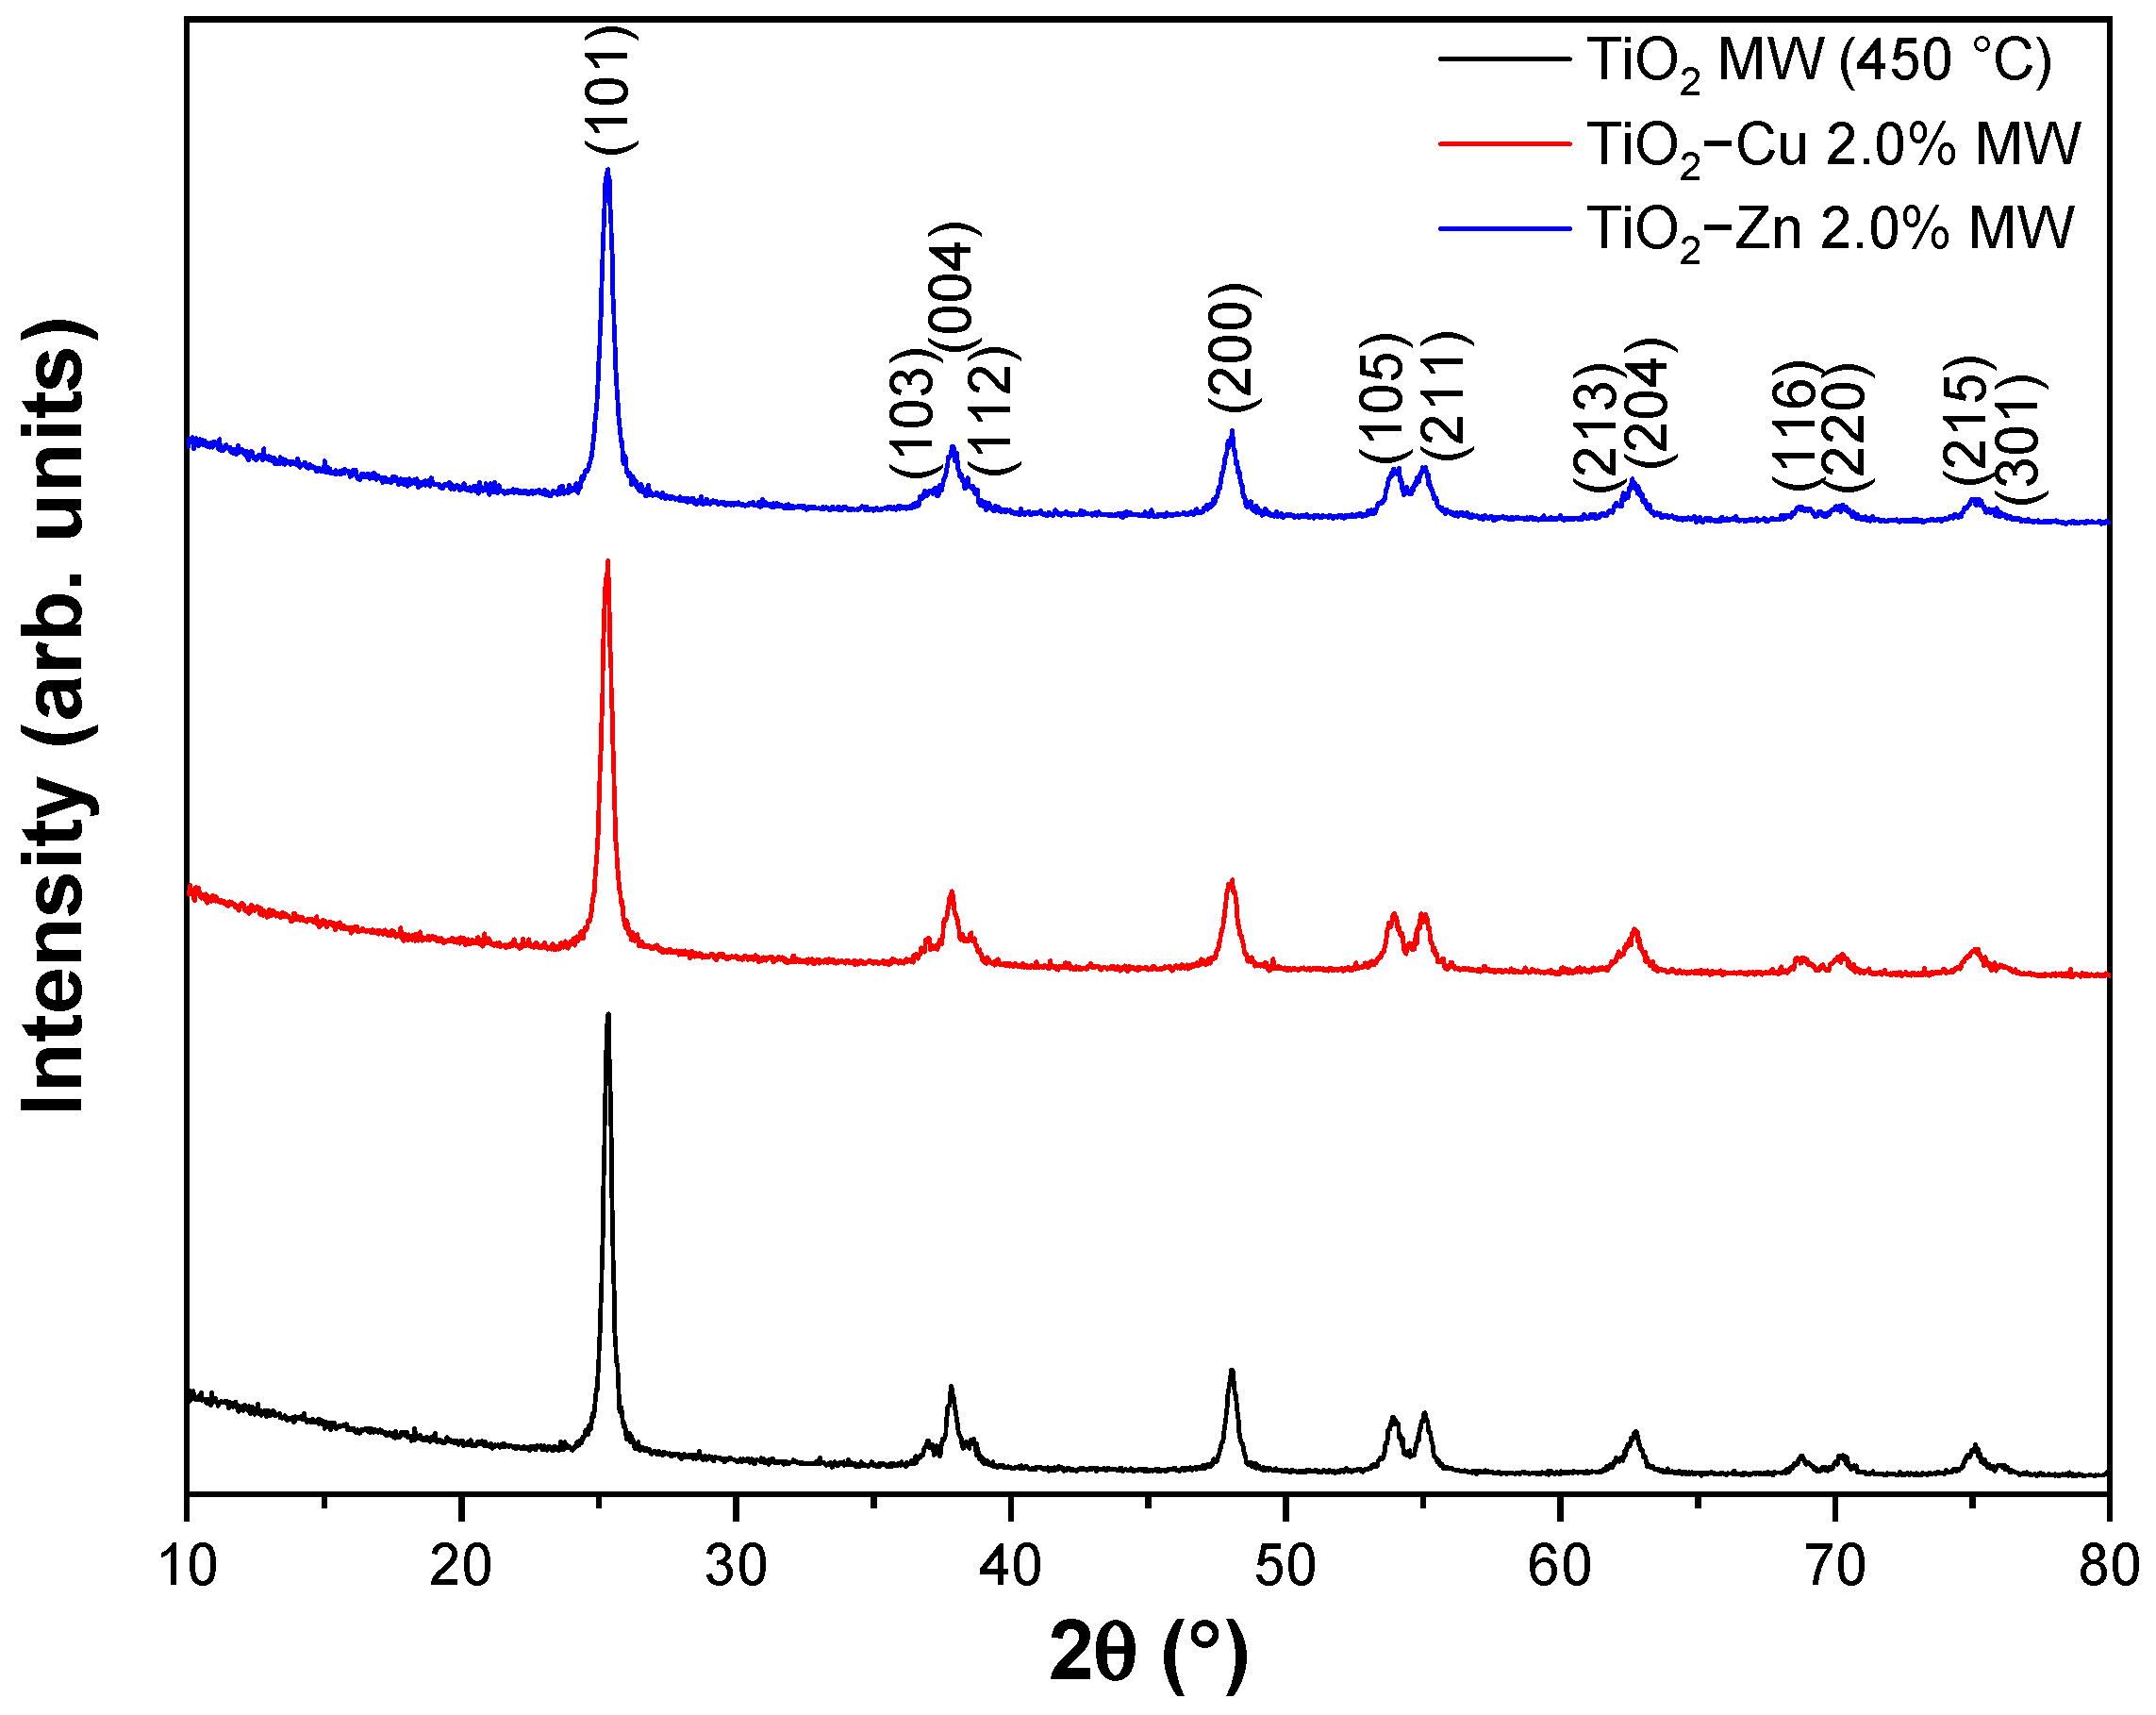
2.2.2. XRD Results
2.2.3. XRF Results
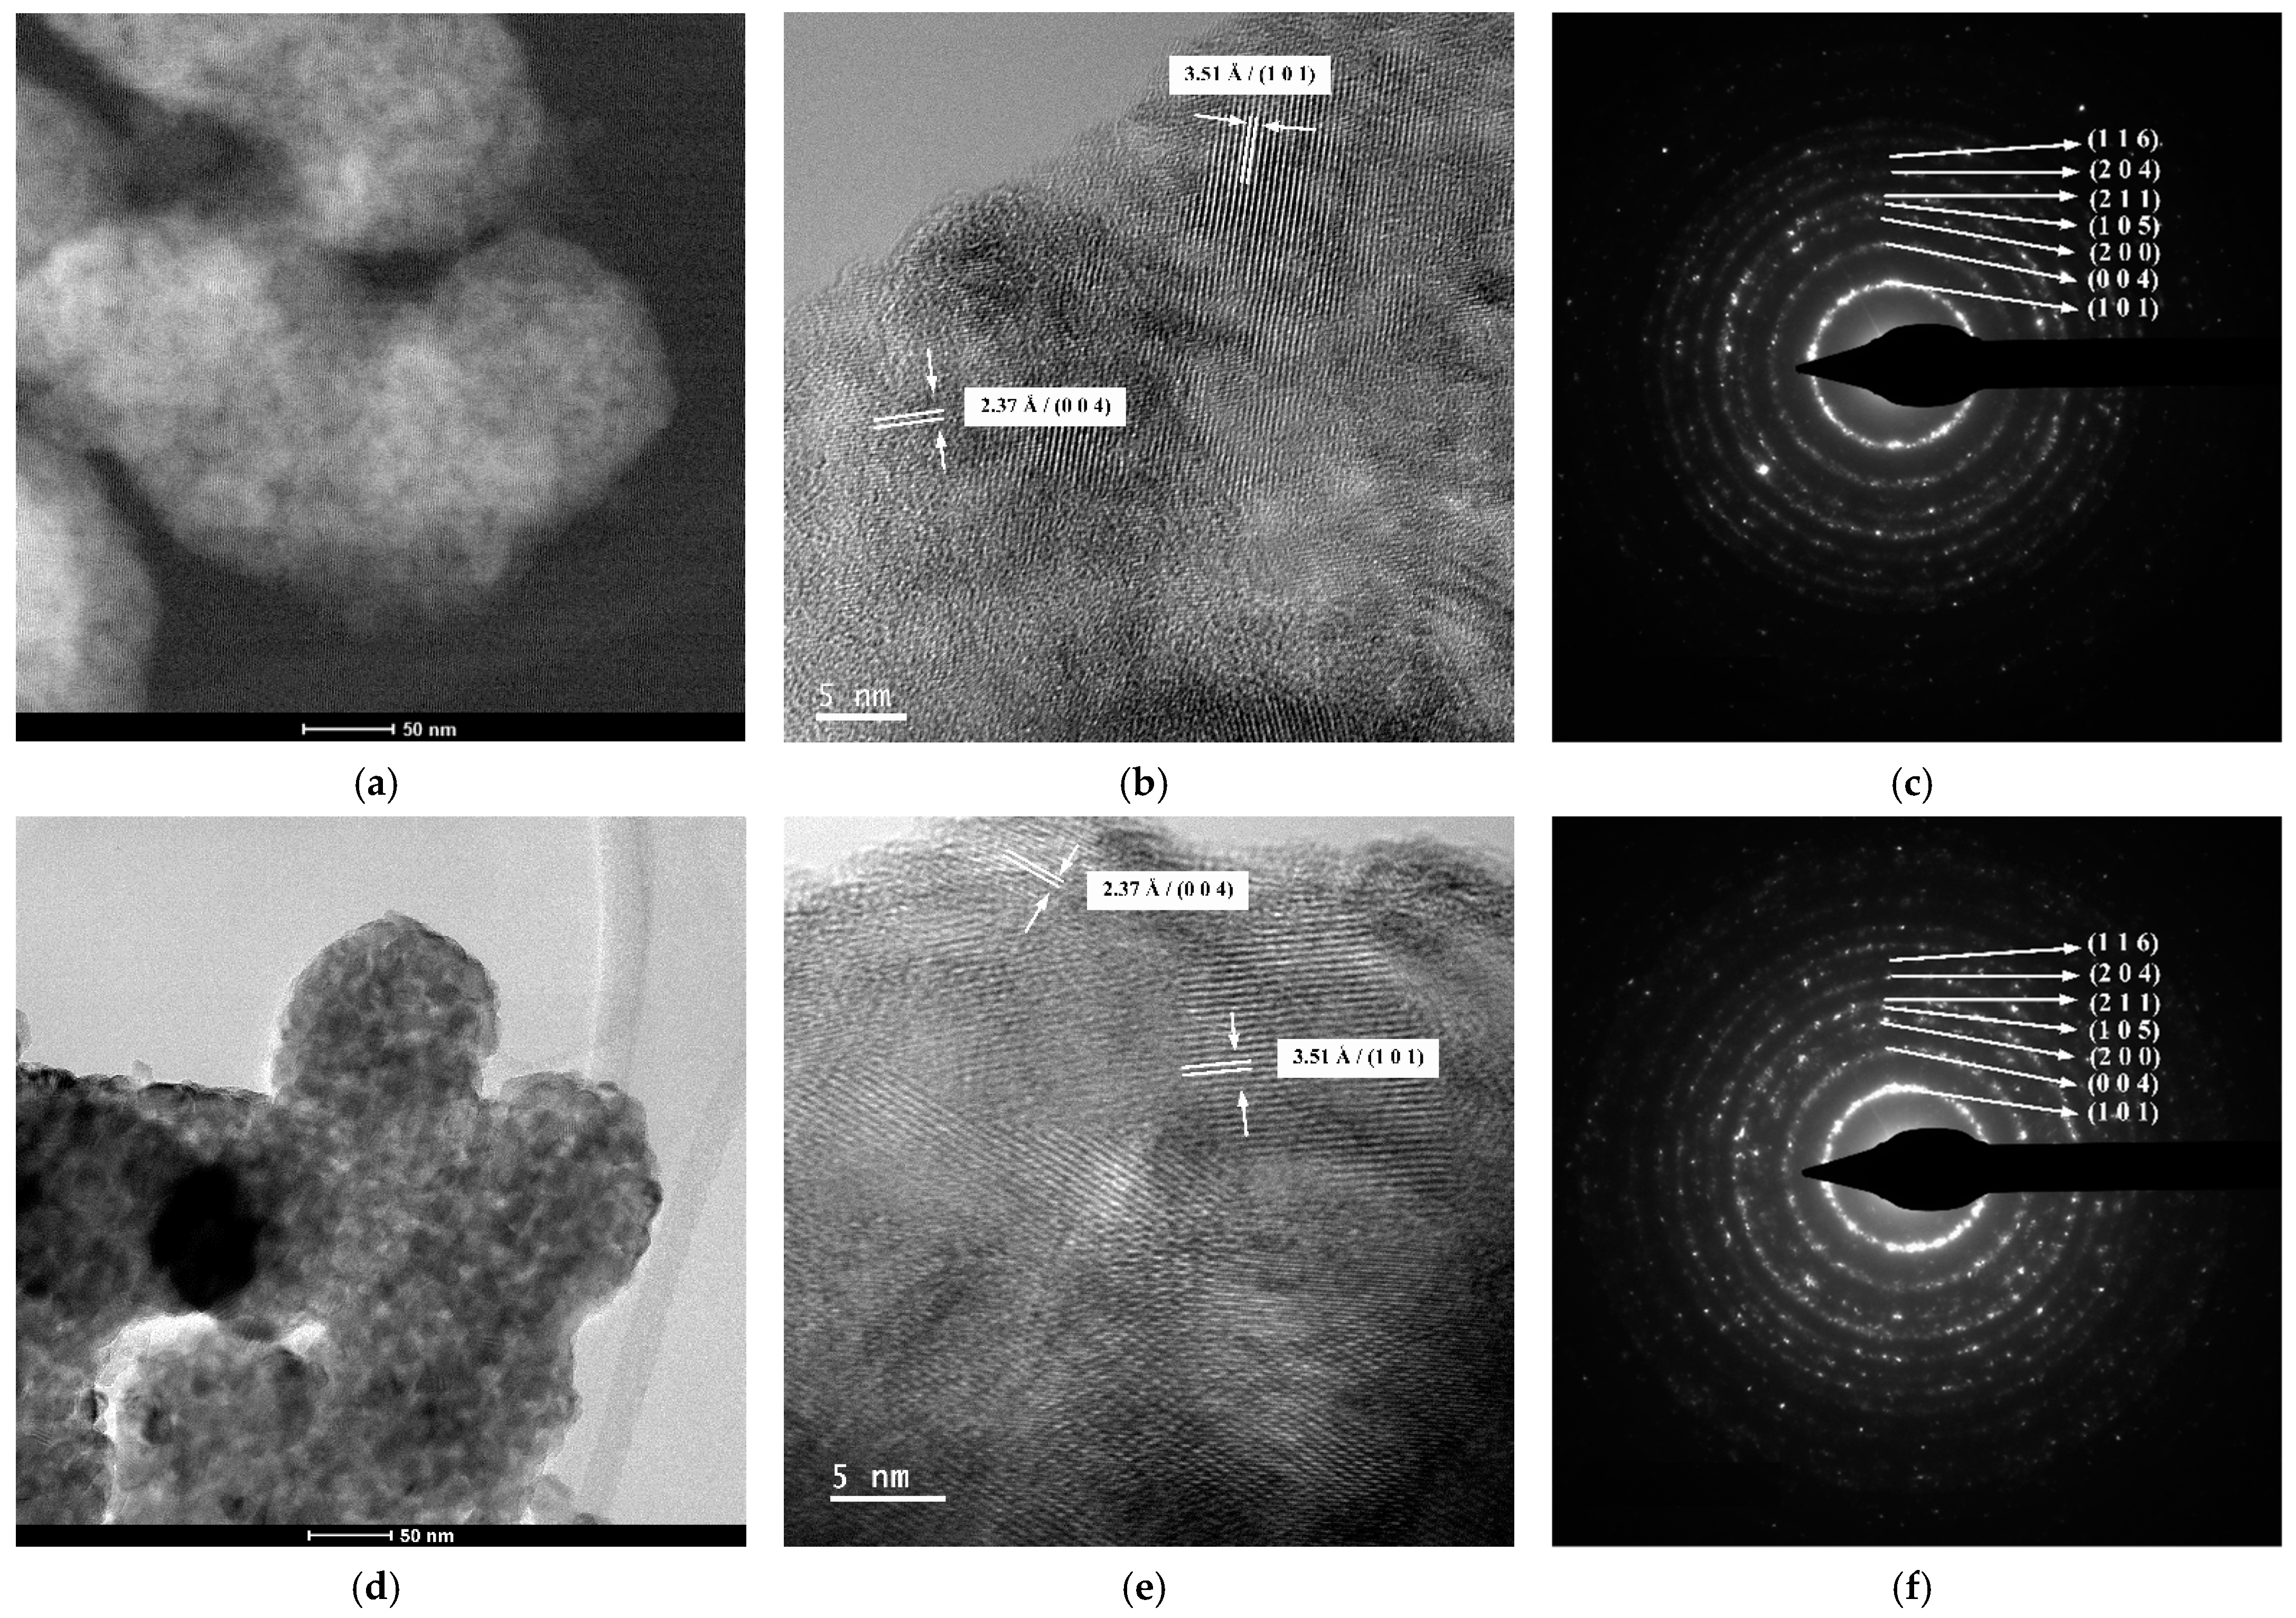
2.2.4. TEM/HRTEM/SAED Investigations
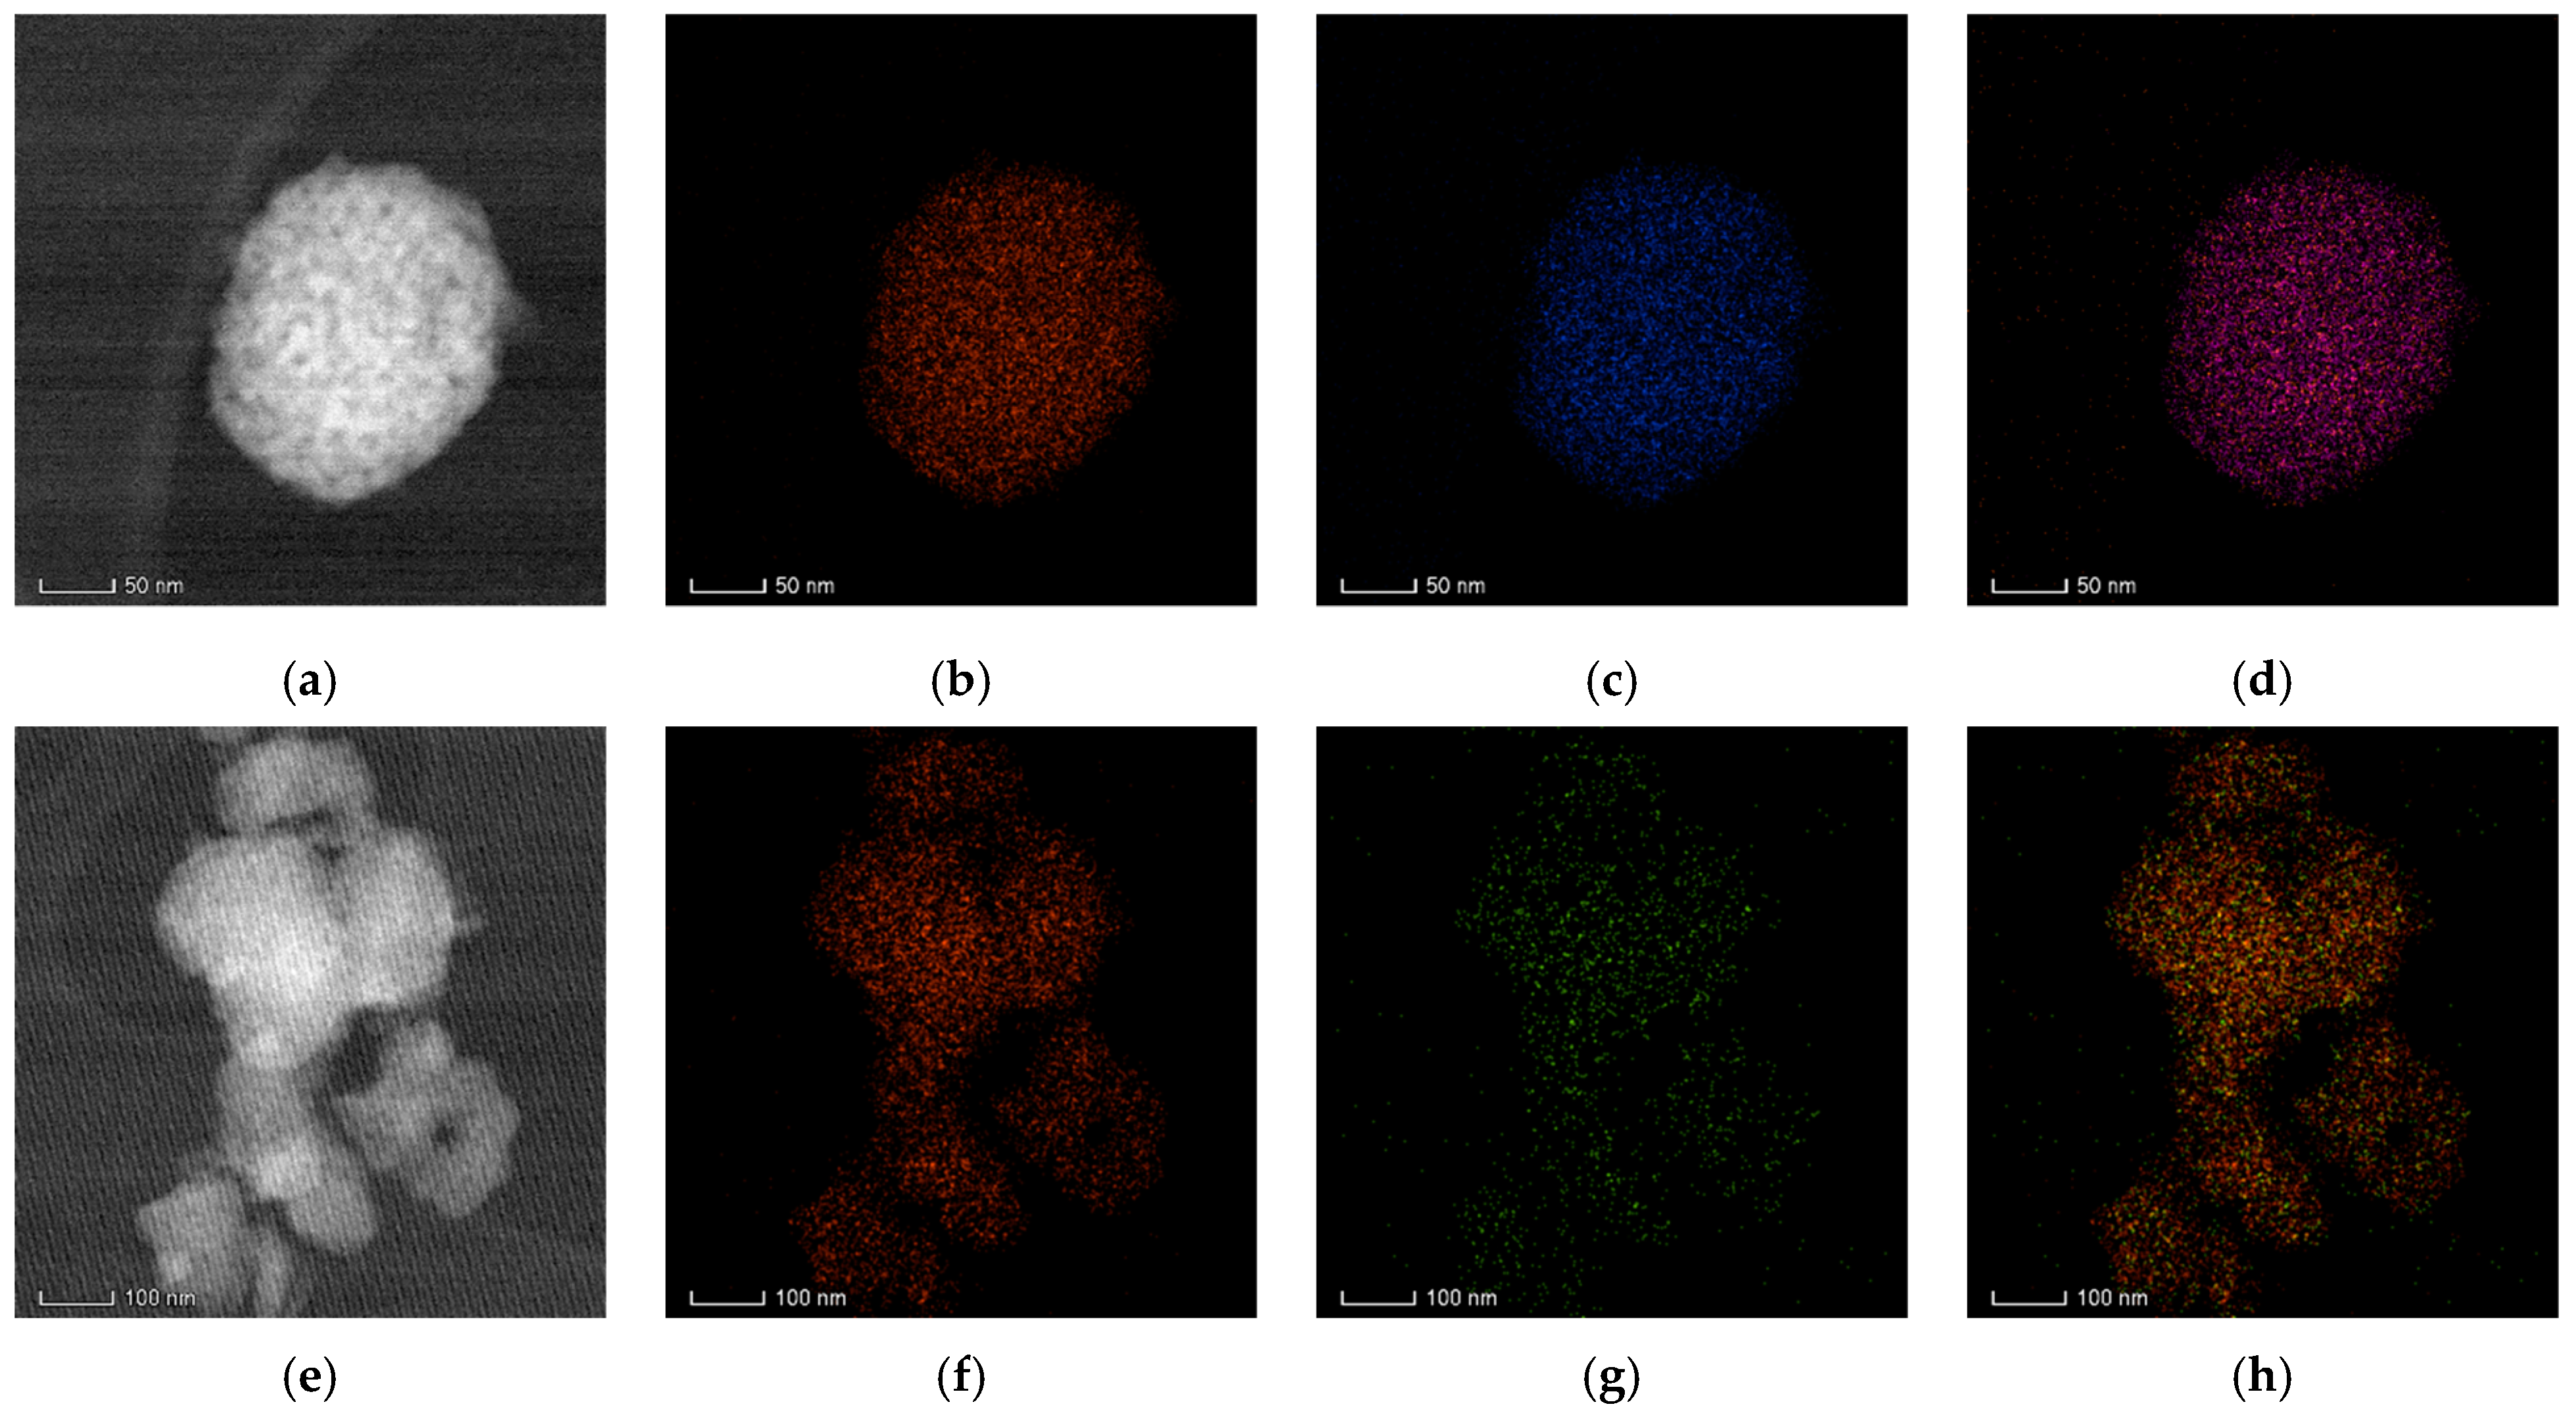
2.2.5. STEM/EDX Investigations
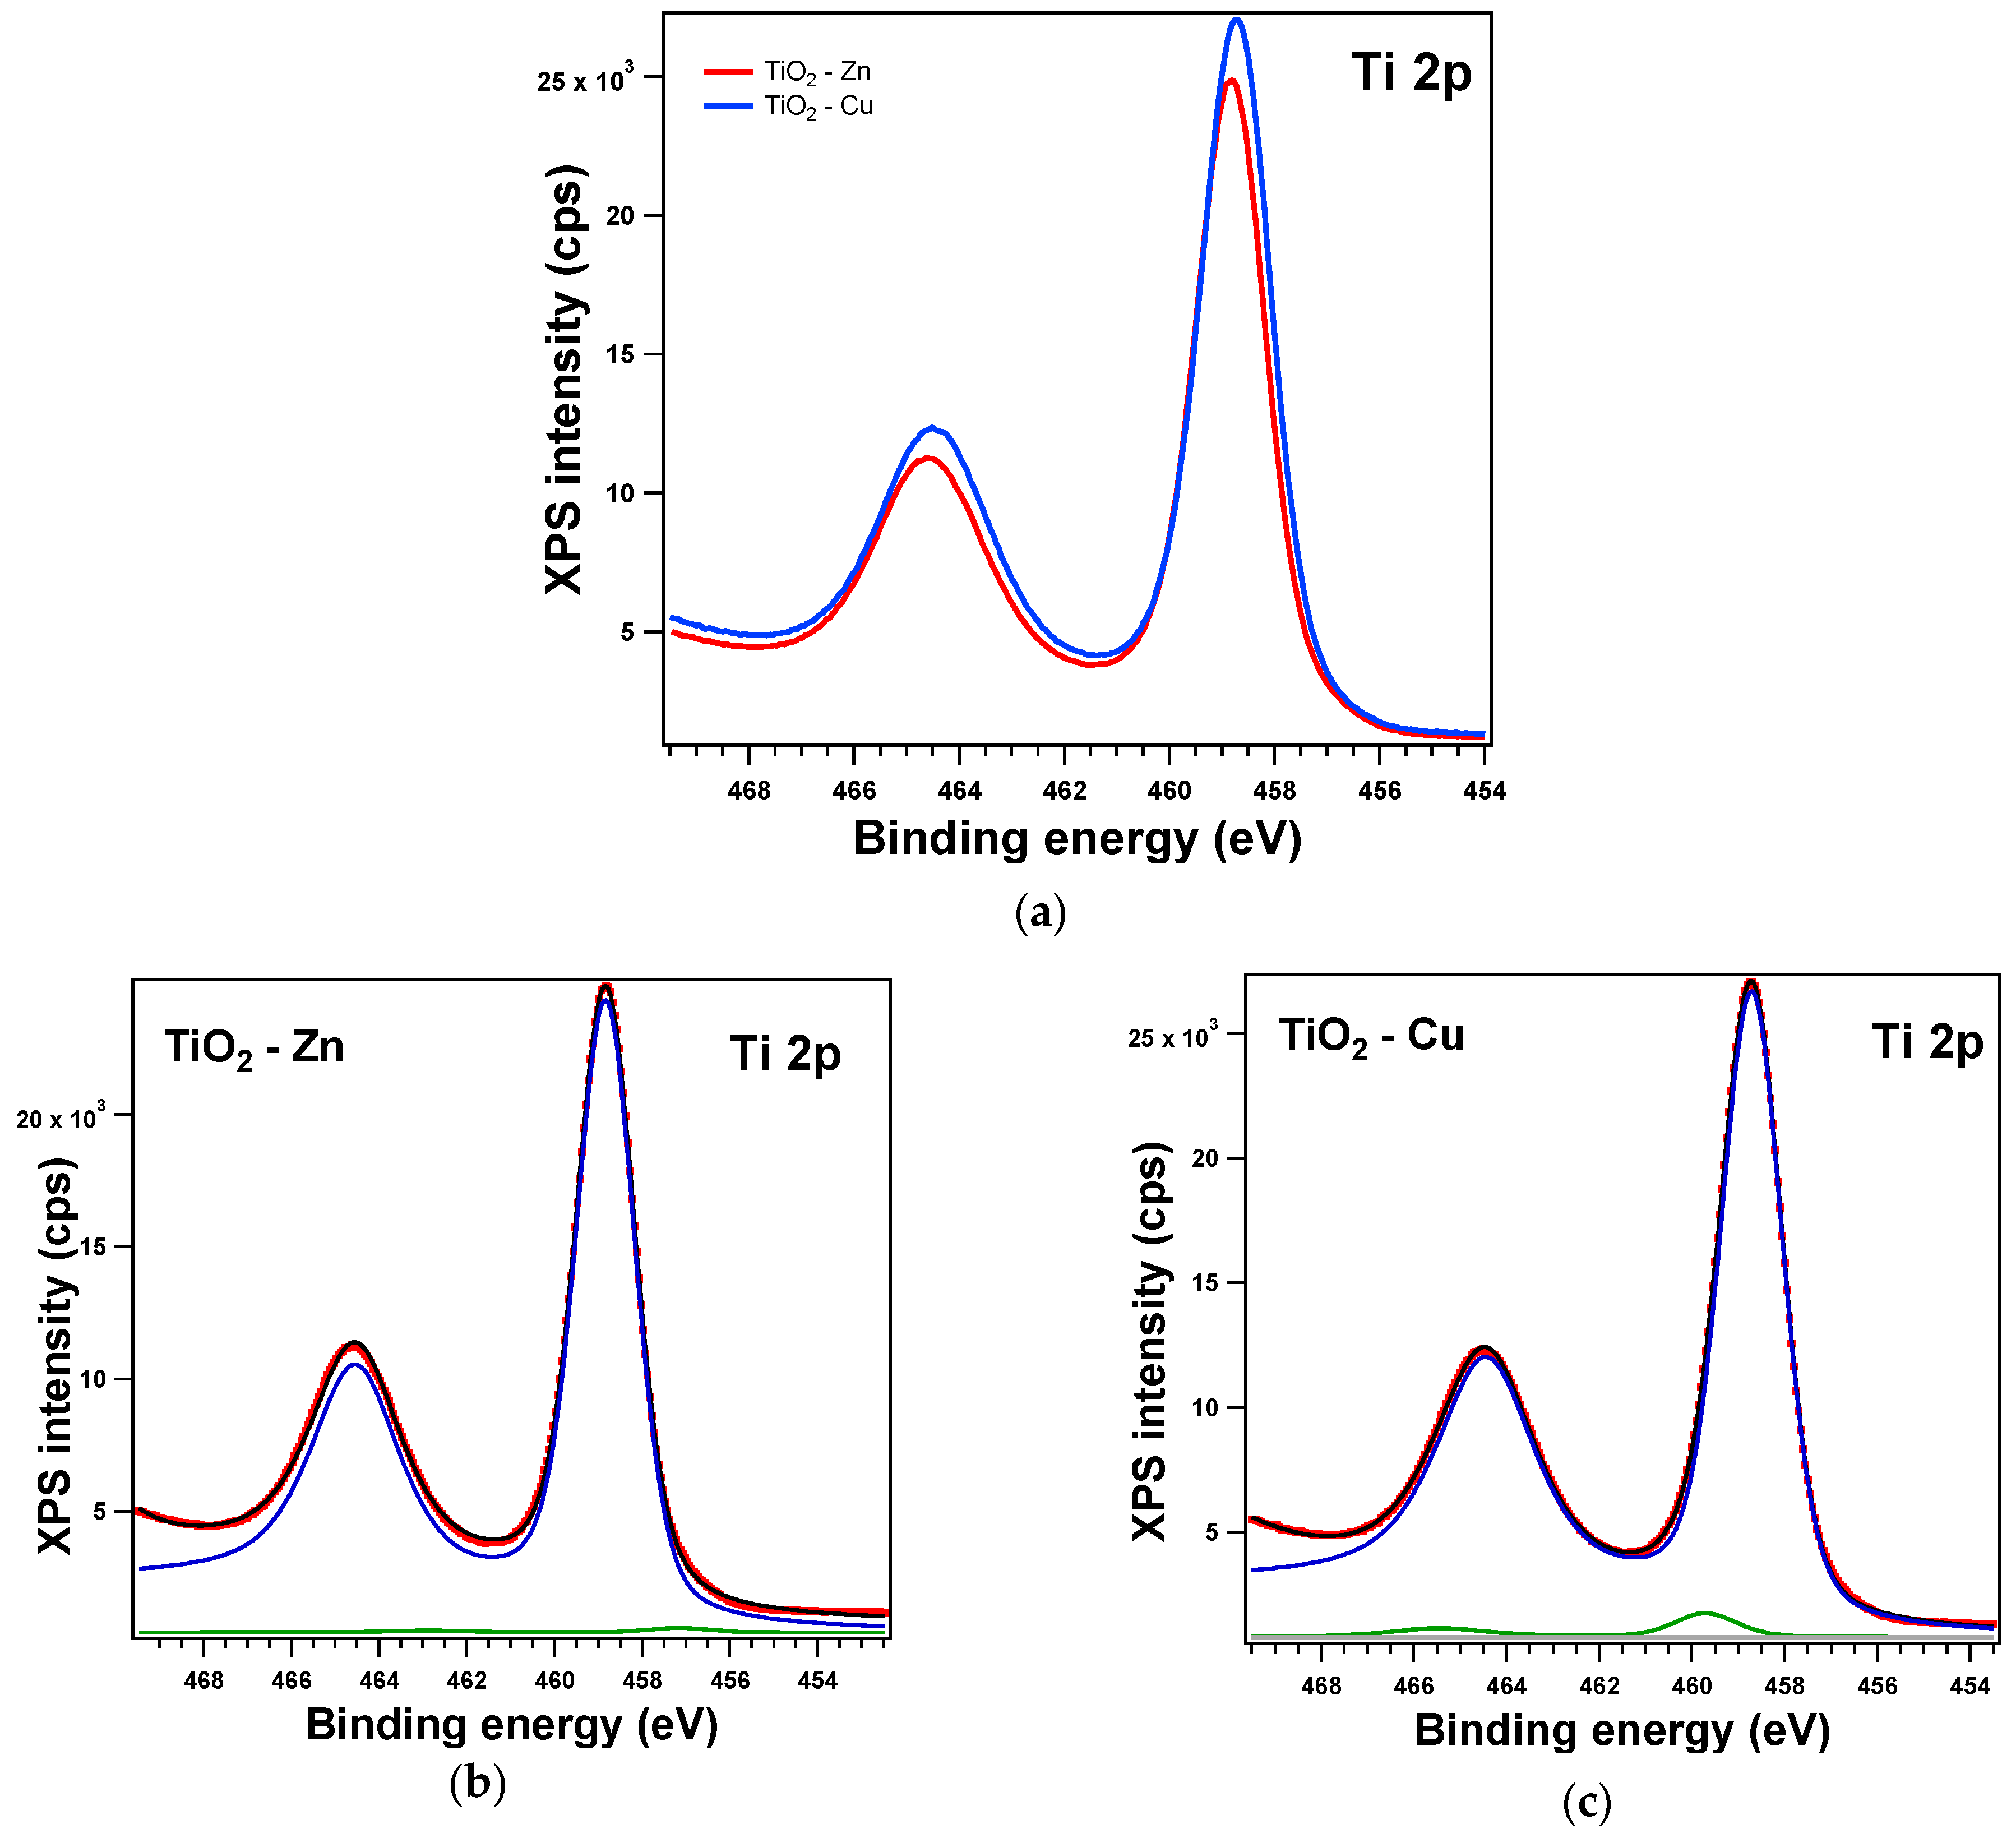
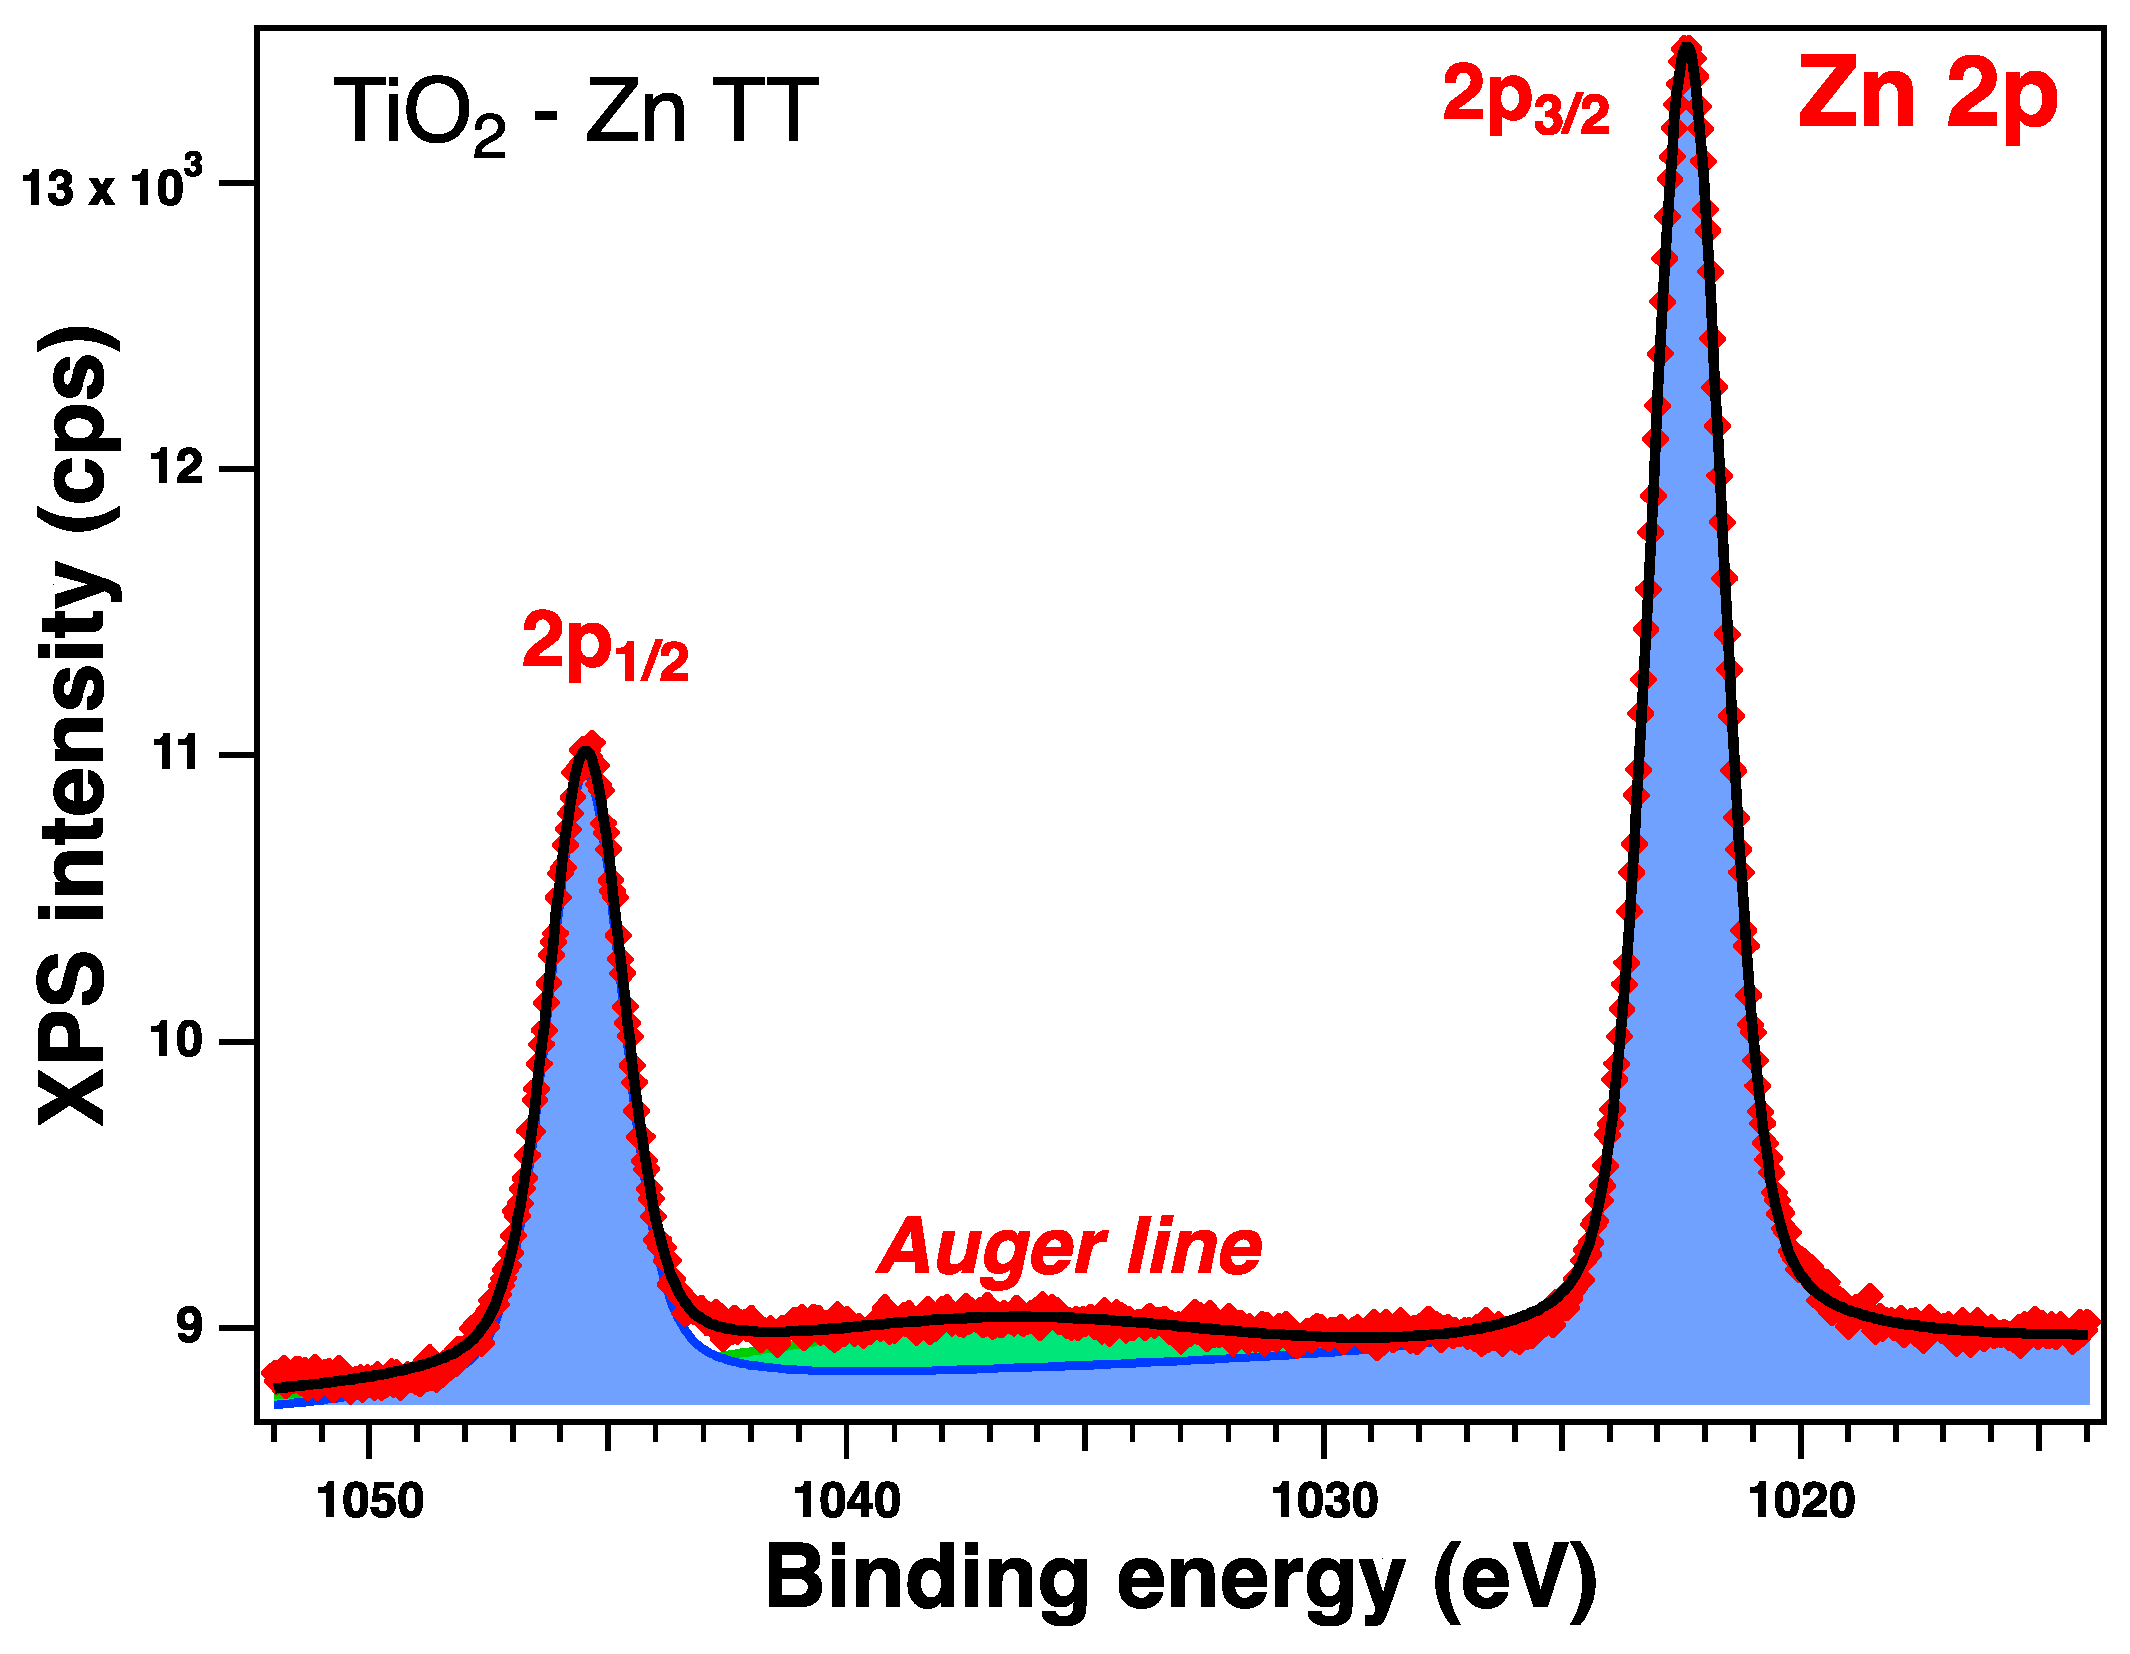
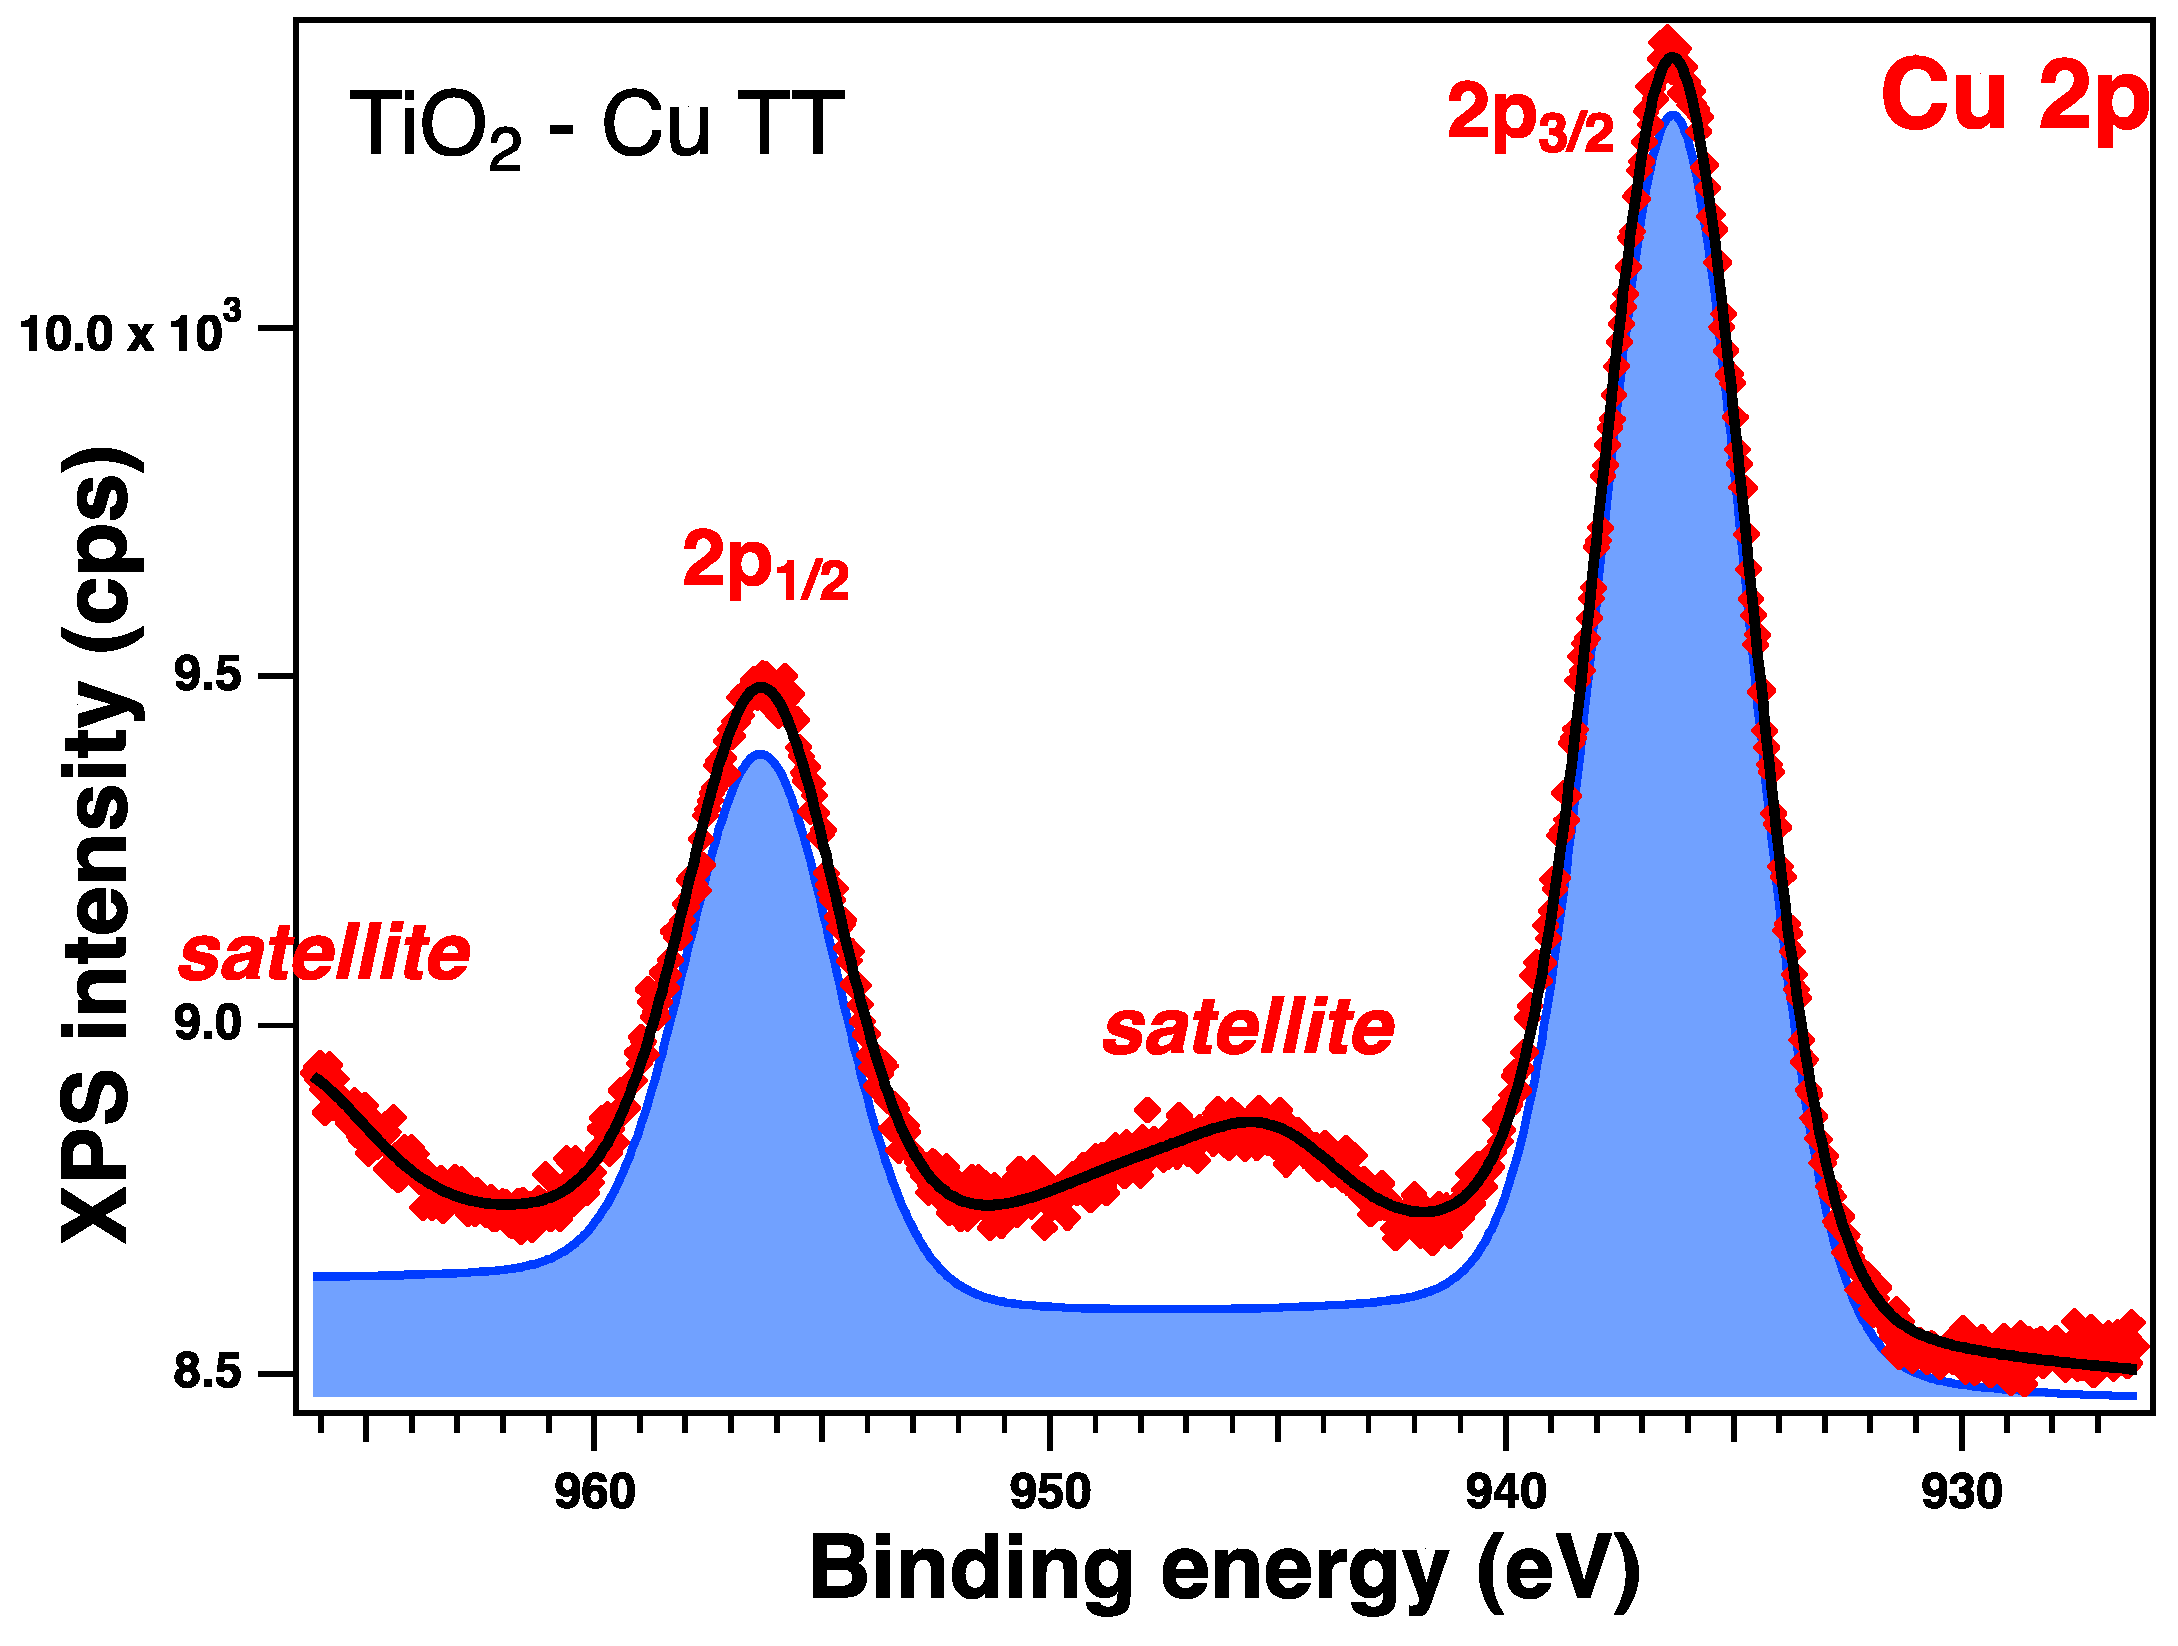
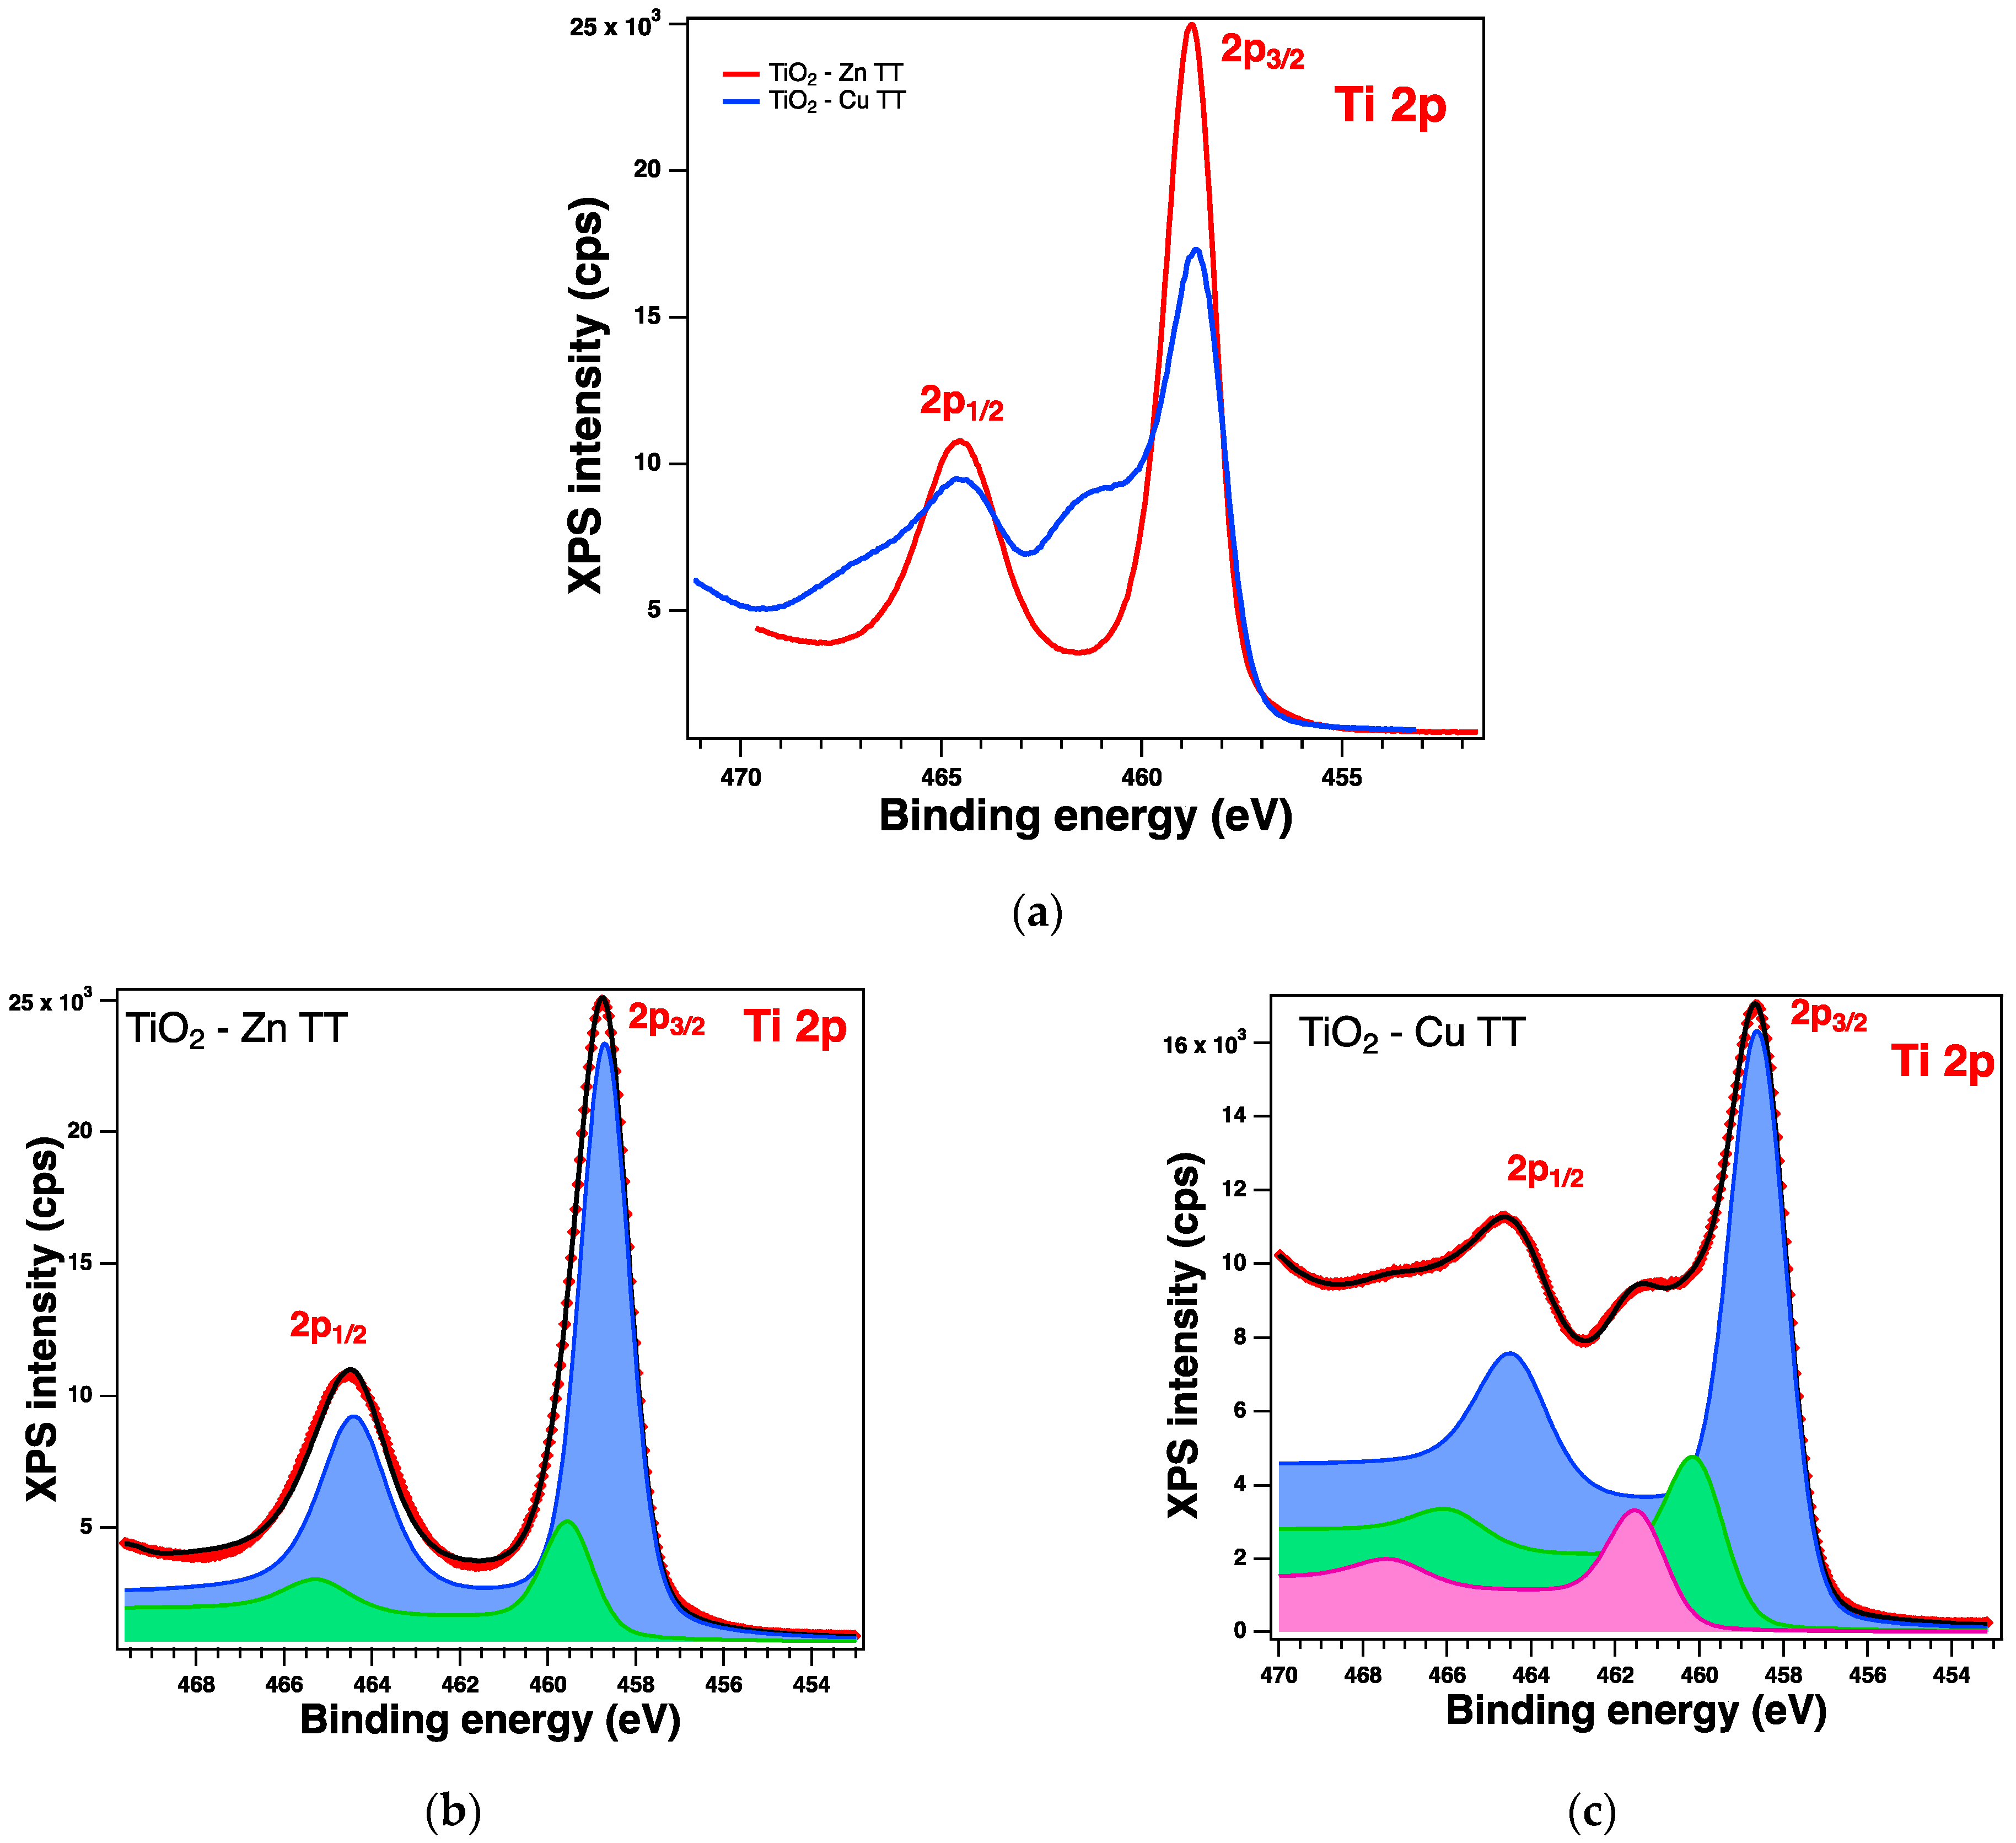
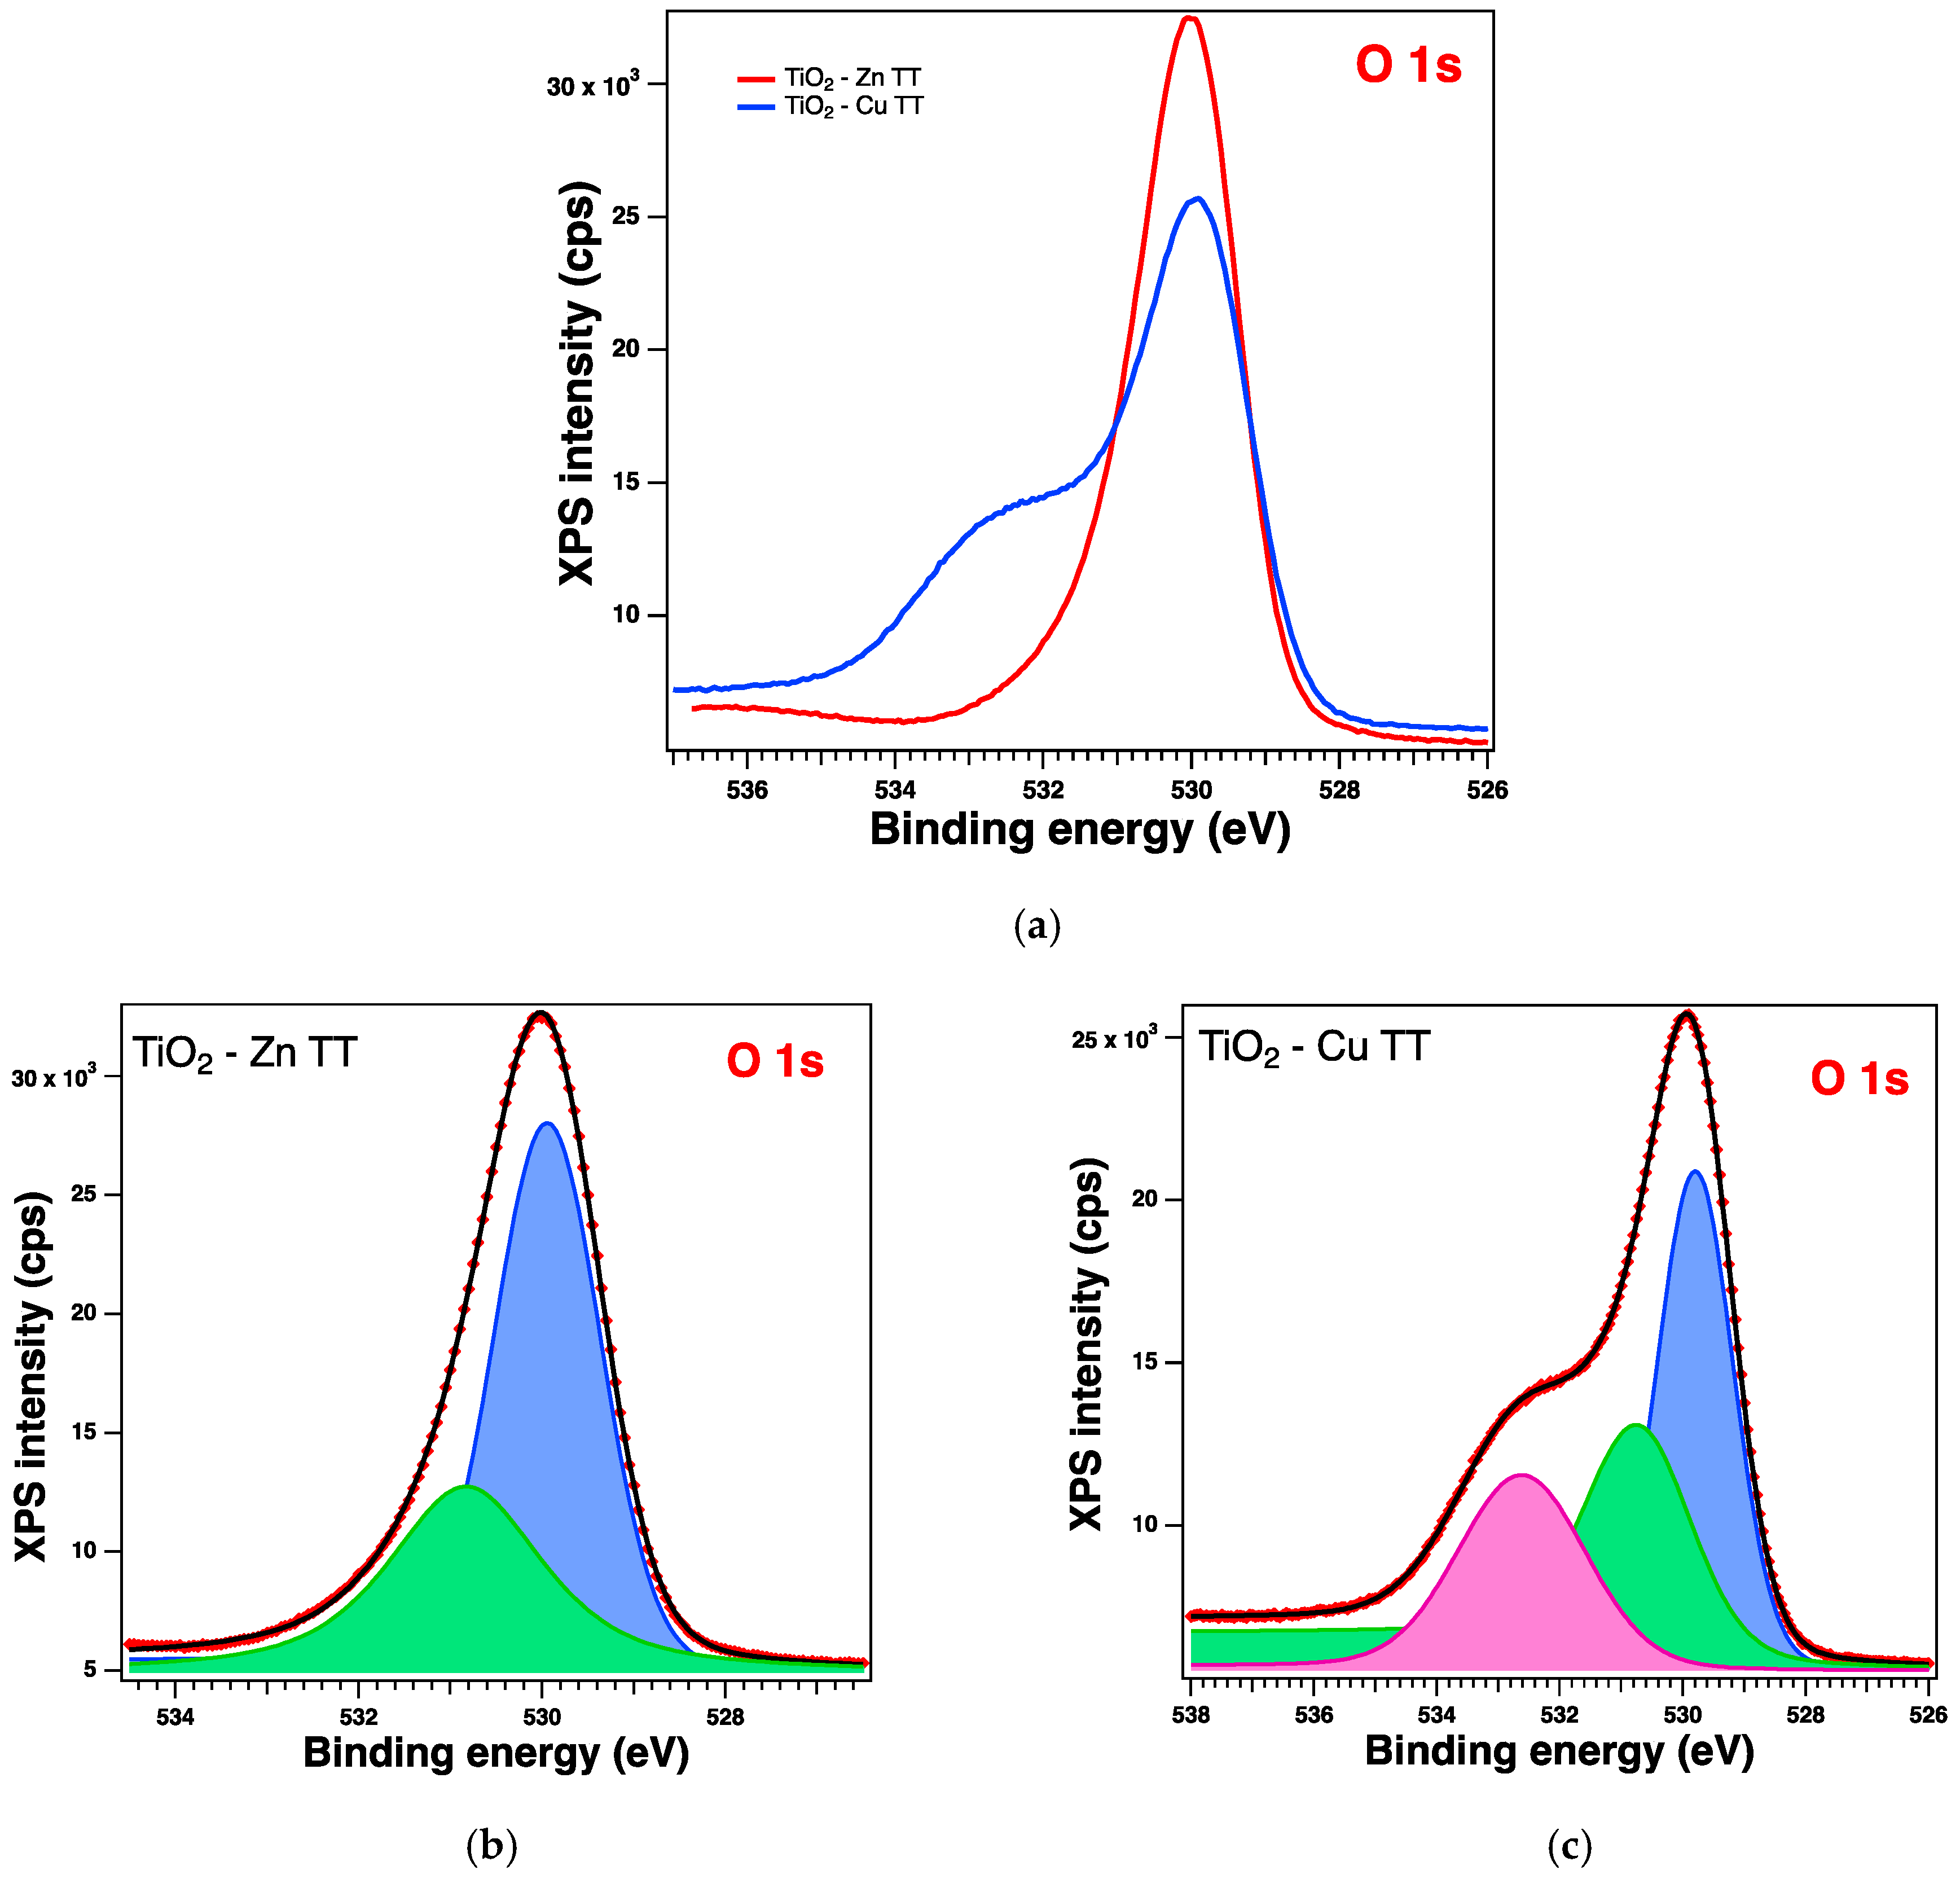
2.2.6. XPS on the Thermally Treated Samples
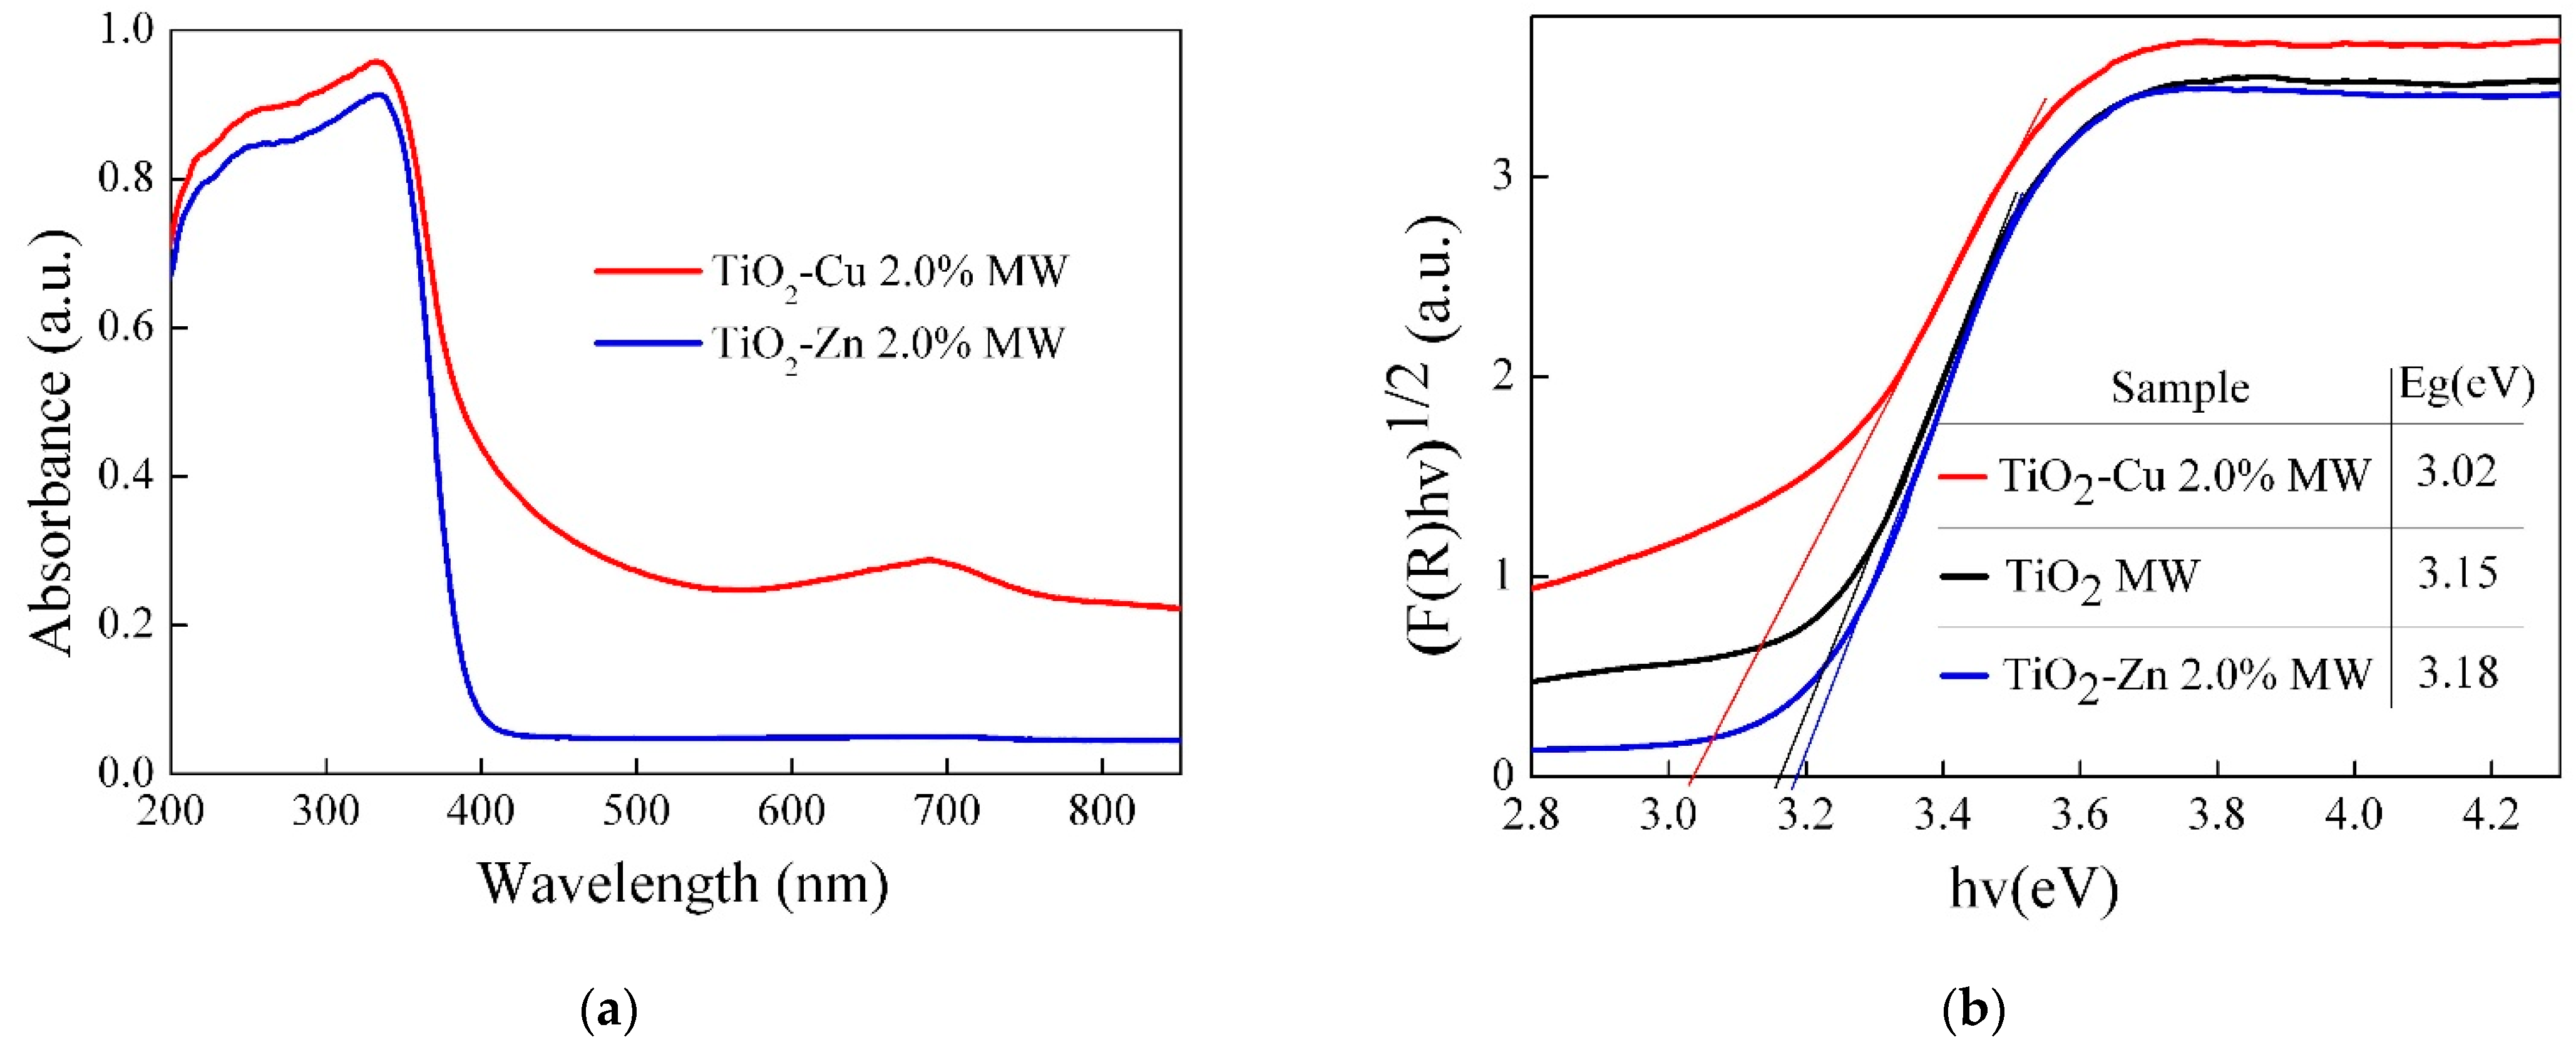
2.2.7. UV-Vis Absorption Spectra
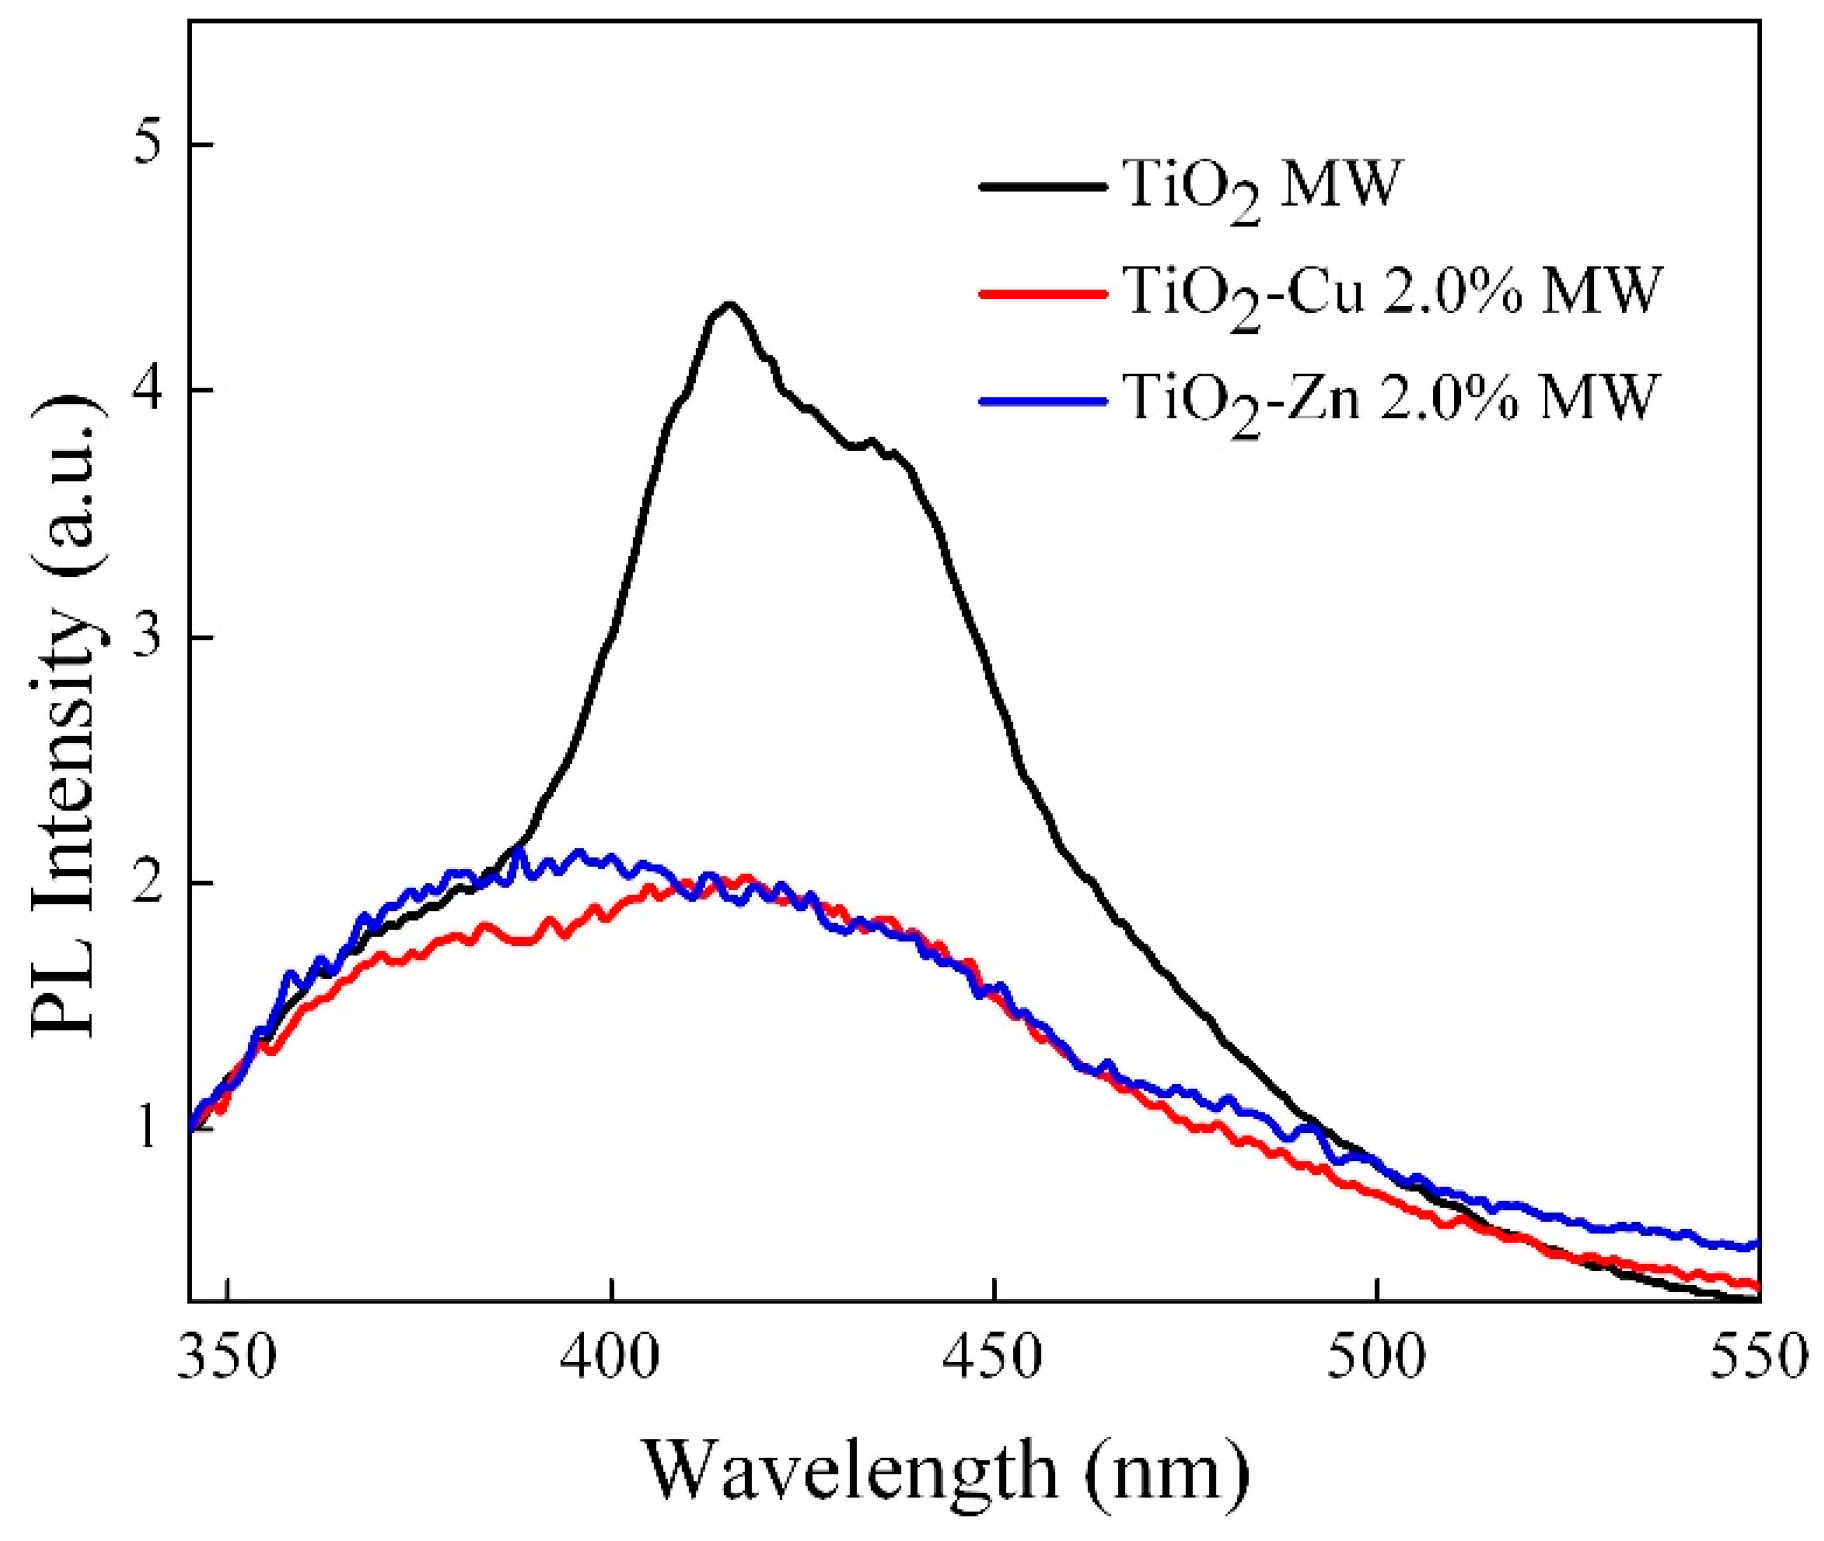
2.2.8. Photoluminescence Analysis
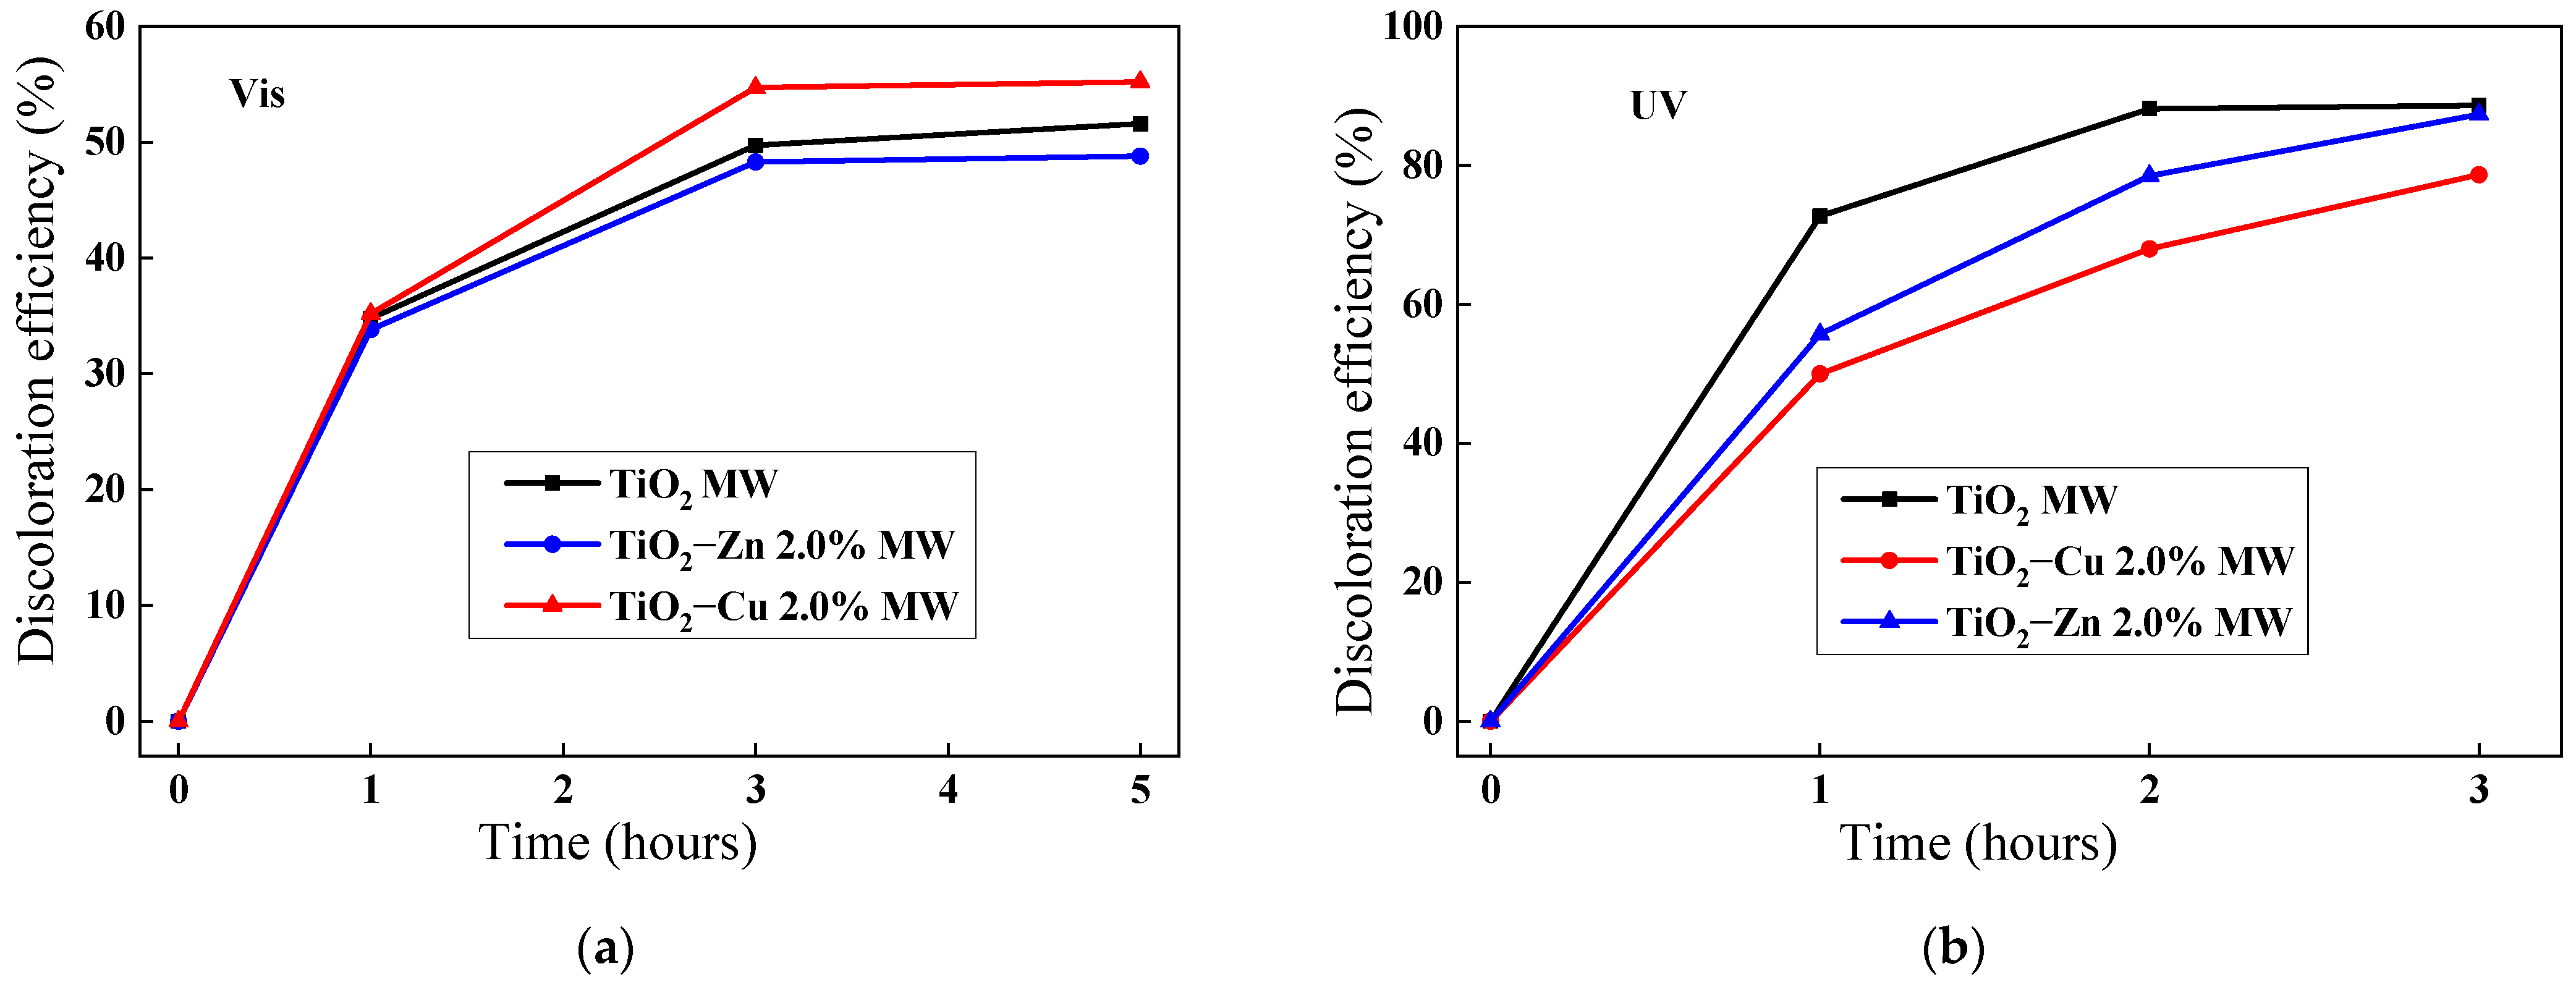
2.2.9. Photocatalysis Investigation
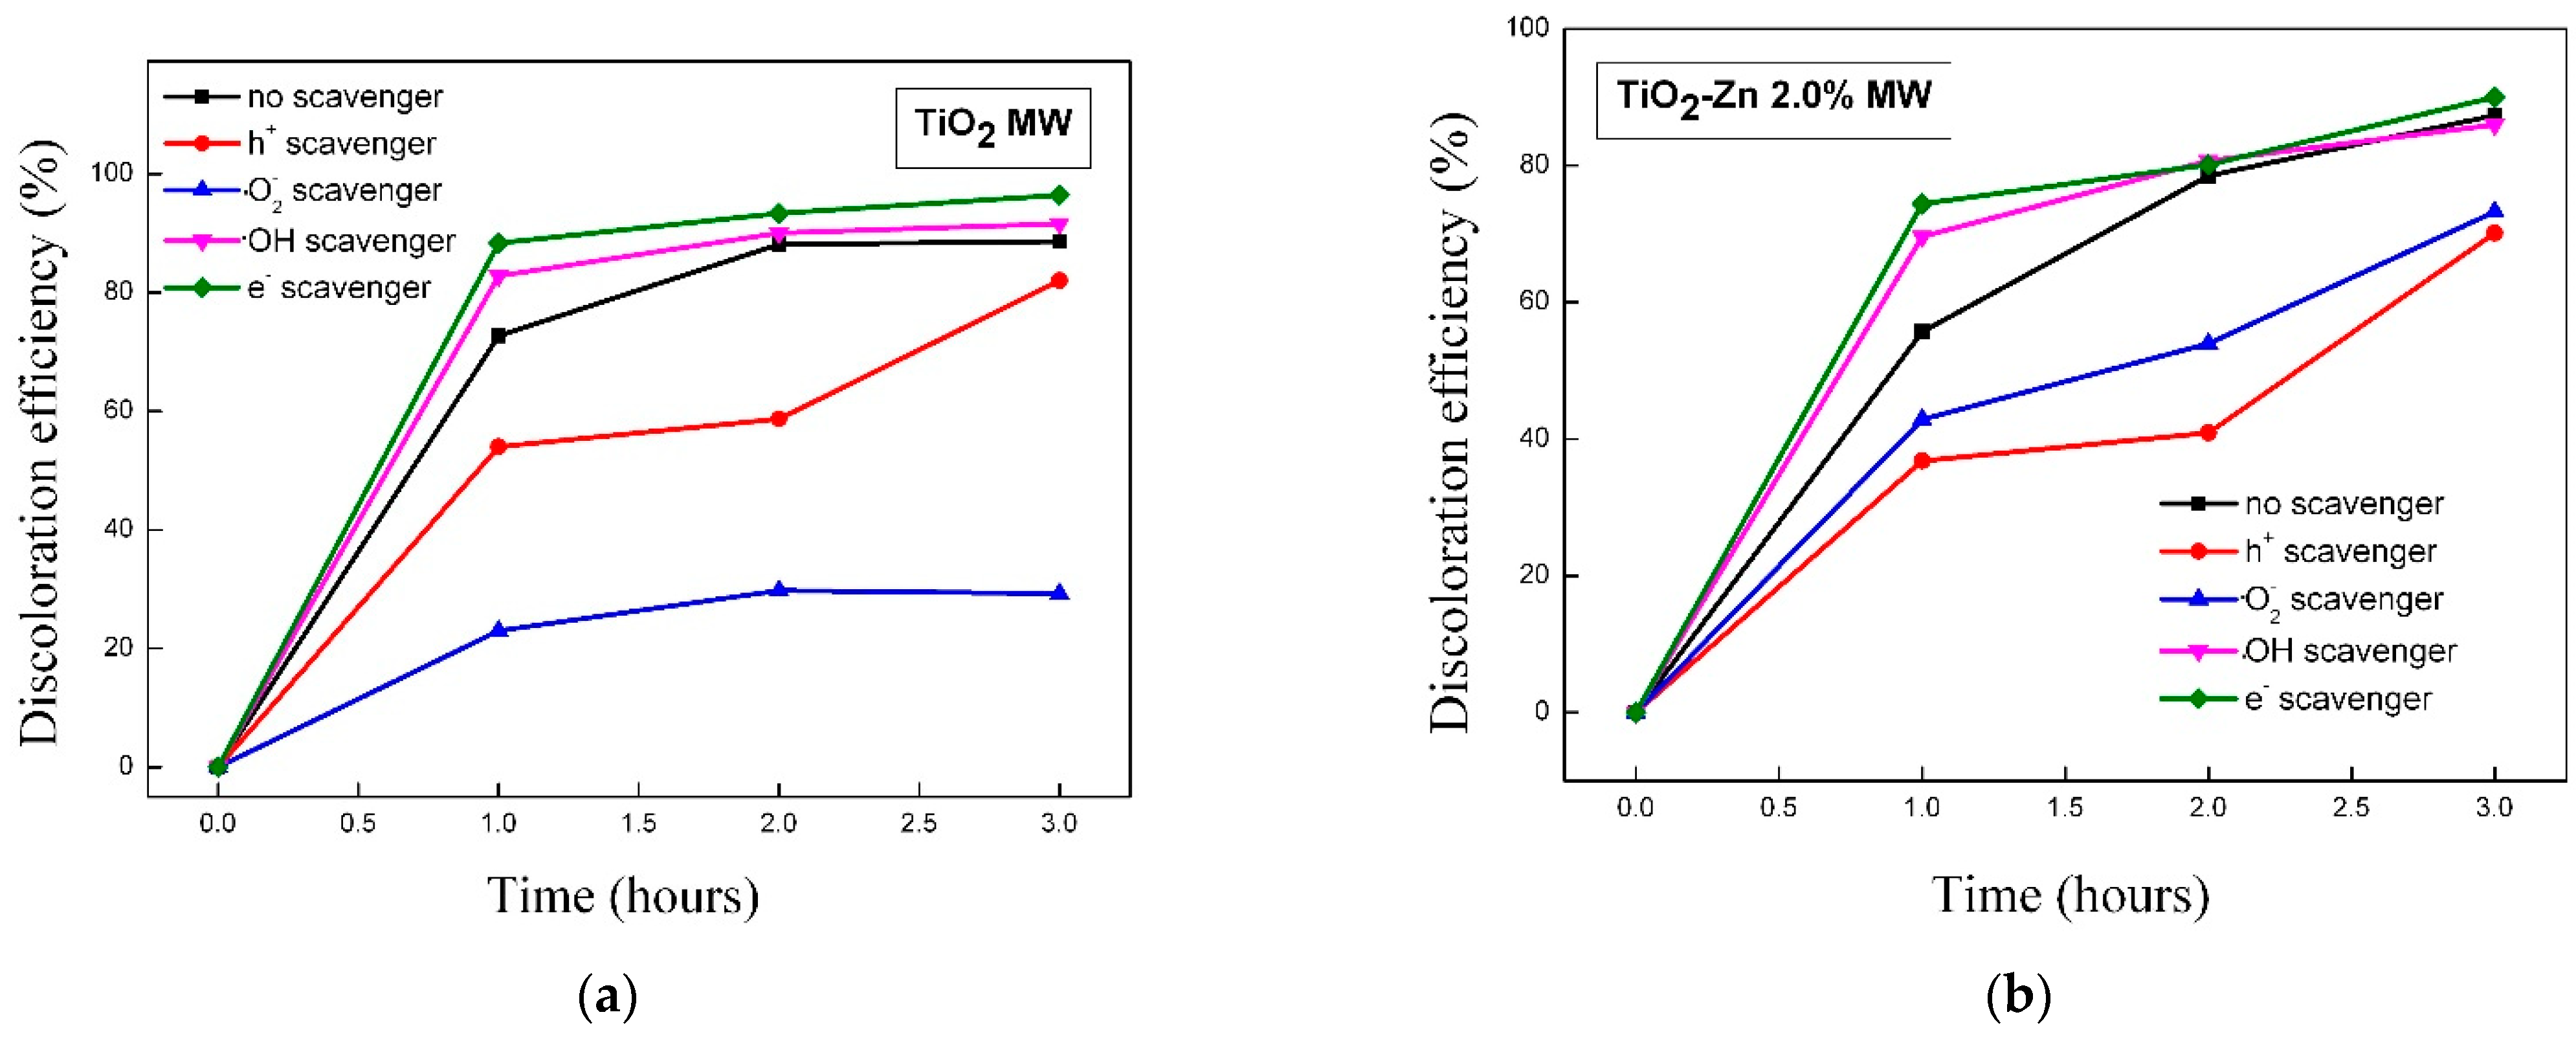
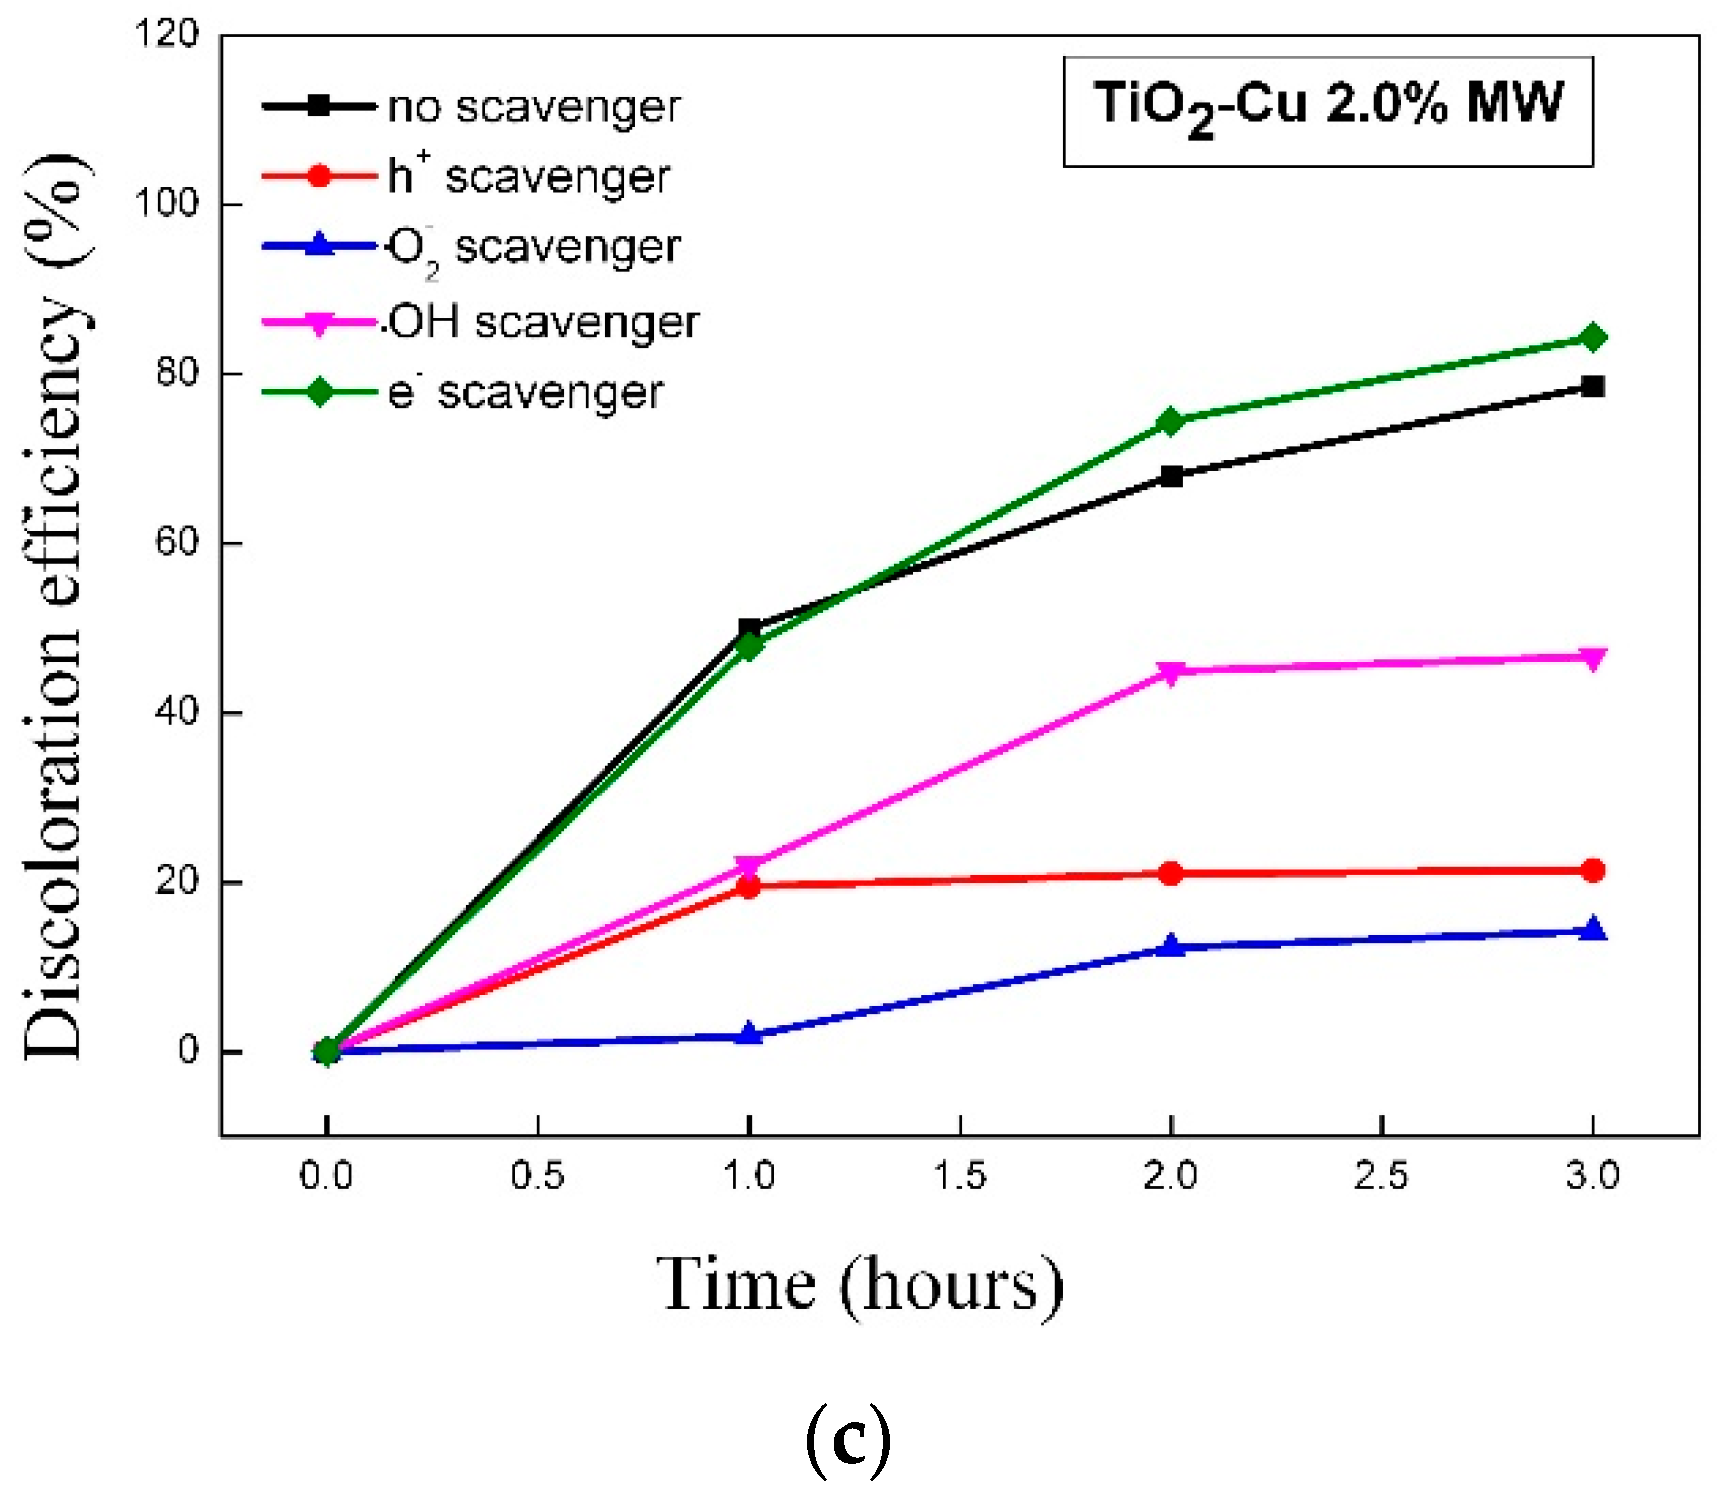
2.2.10. Identification of Reactive Species
3. Conclusions
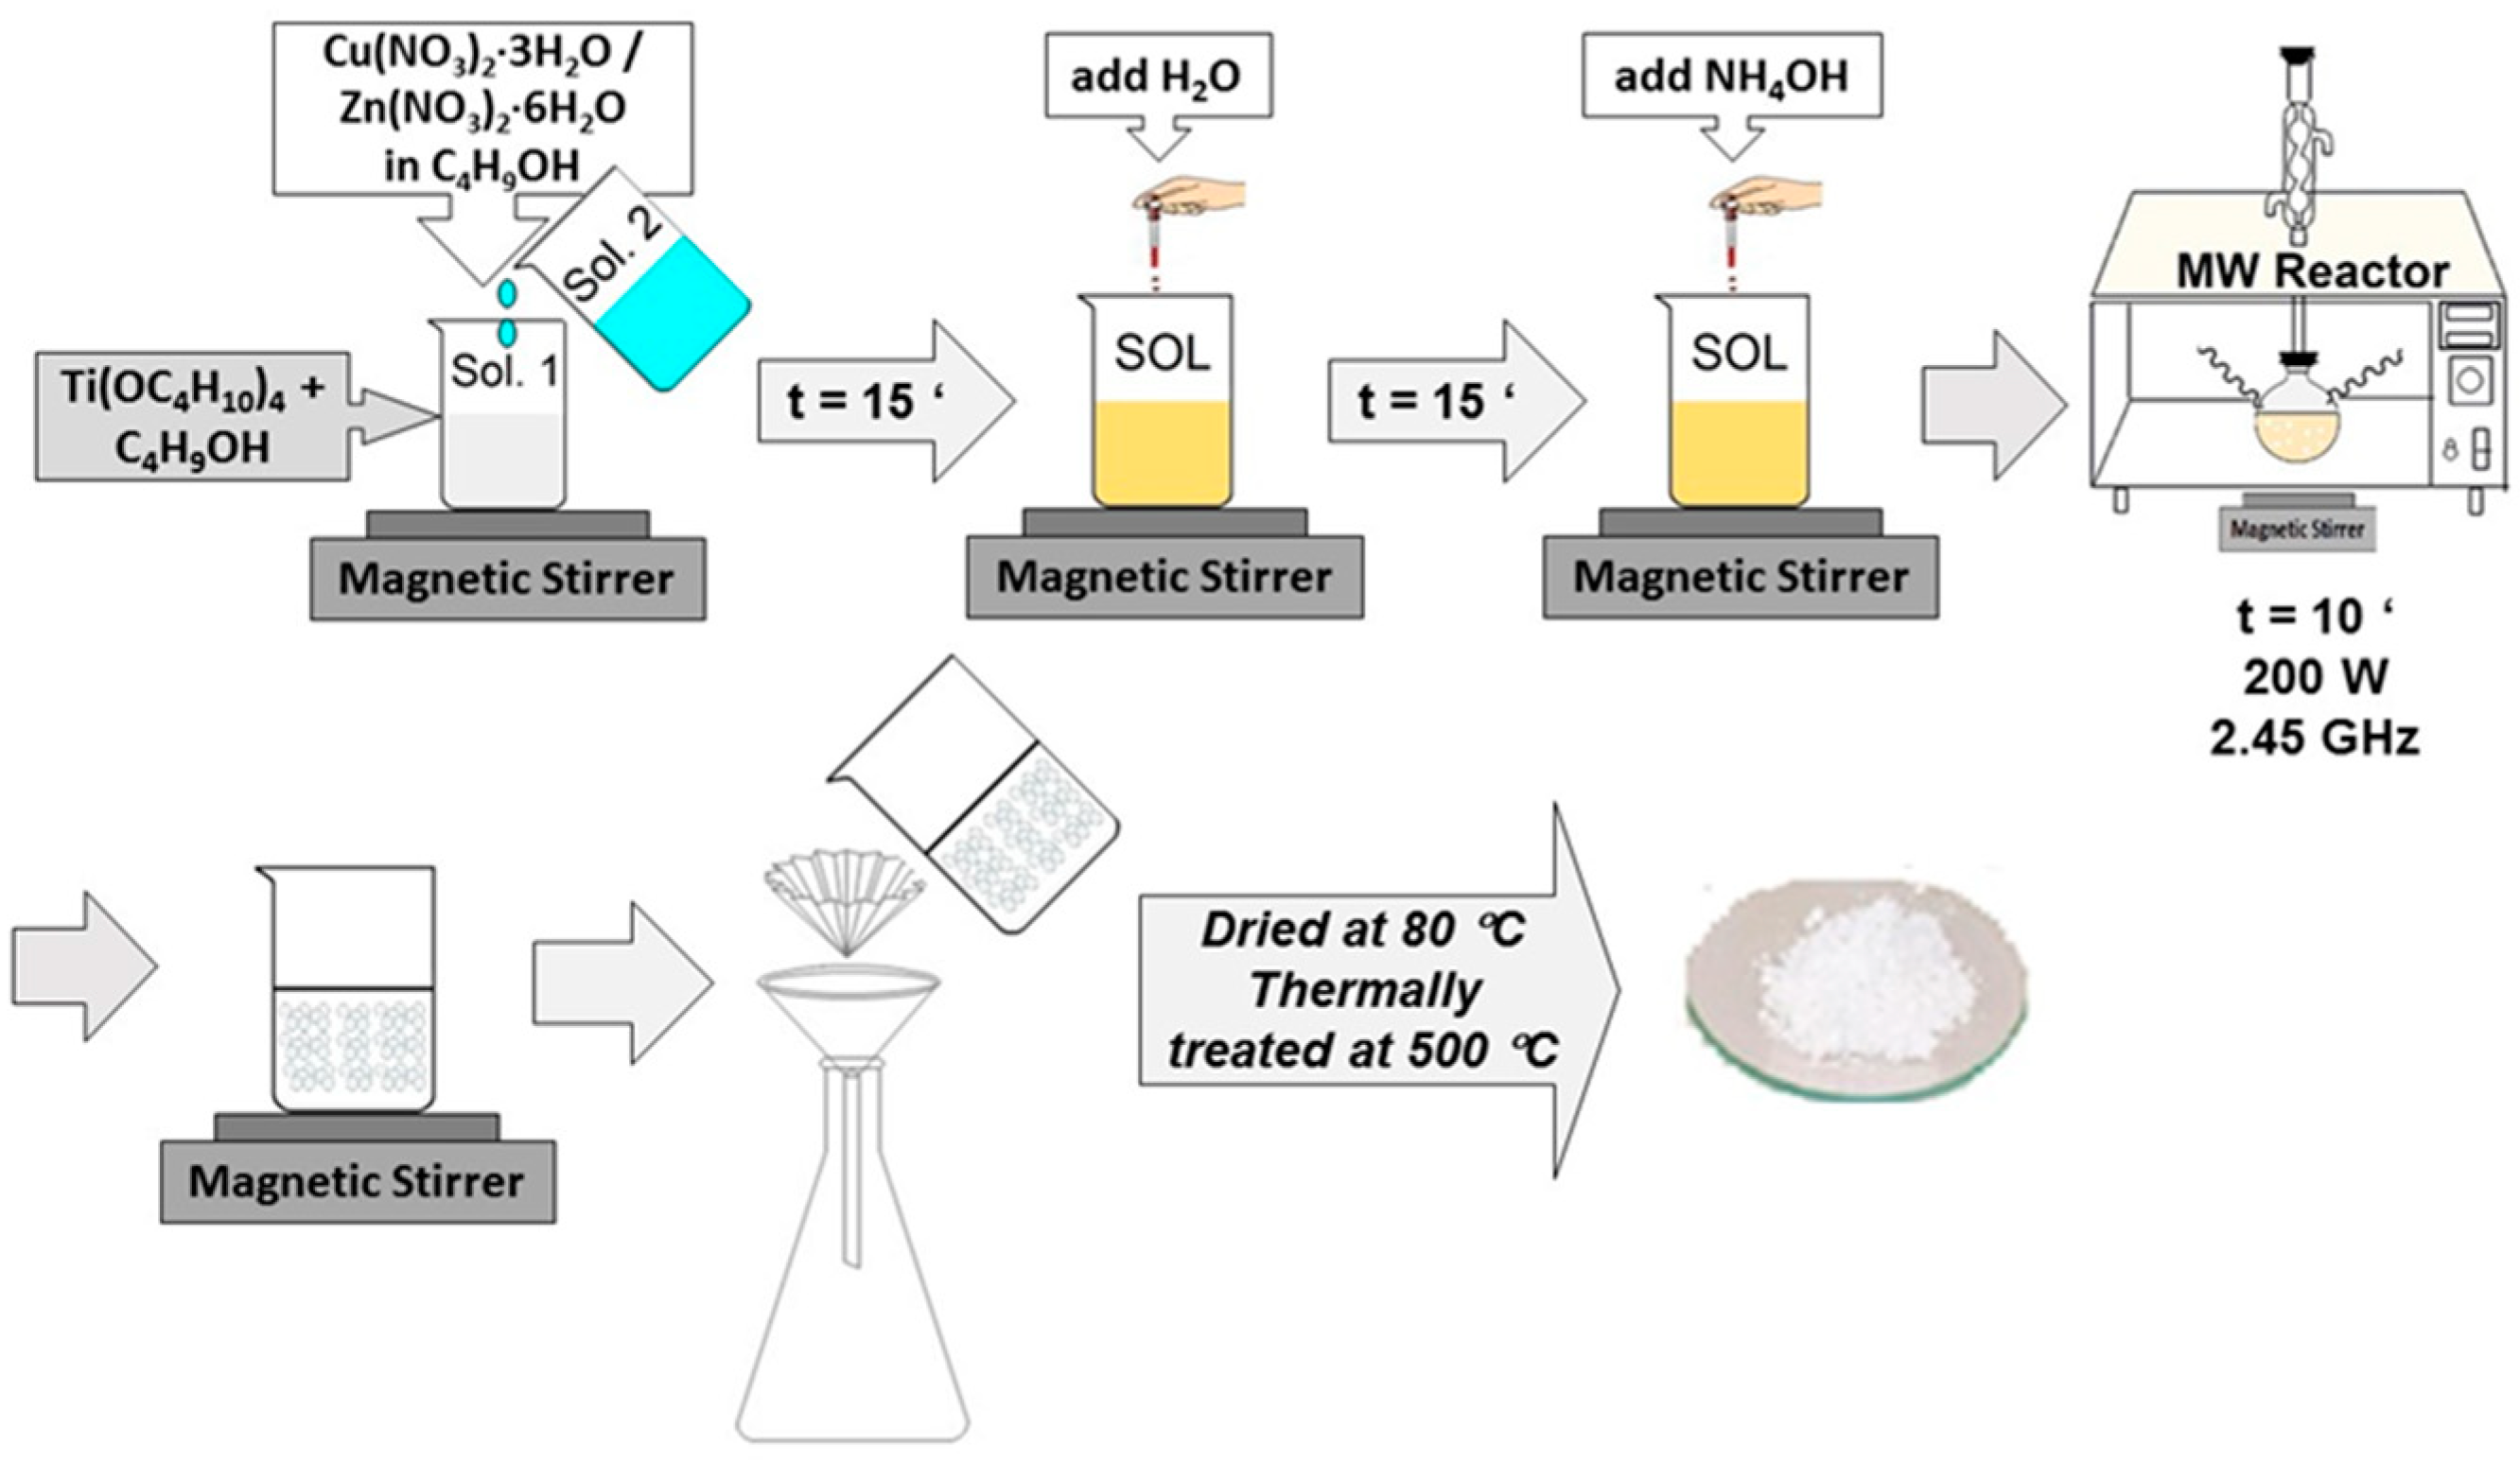
4. Materials and Methods
4.1. Materials
4.2. Methods
Author Contributions
Funding
Institutional Review Board Statement
Informed Consent Statement
Data Availability Statement
Acknowledgments
Conflicts of Interest
References
- Fujishima, A.; Rao, T.N.; Tryk, D.A. Titanium Dioxide Photocatalysis. J. Photochem. Photobiol. C Photochem. Rev. 2000, 1, 1–21. [Google Scholar] [CrossRef]
- Bizarro, M.; Tapia-Rodríguez, M.A.; Ojeda, M.L.; Alonso, J.C.; Ortiz, A. Photocatalytic Activity Enhancement of TiO2 Films by Micro and Nano-Structured Surface Modification. Appl. Surf. Sci. 2009, 255, 6274–6278. [Google Scholar] [CrossRef]
- Dikici, T.; Demirci, S.; Tünçay, M.M.; Yildirim, B.K.; Kaya, N. Effect of Heating Rate on Structure, Morphology and Photocatalytic Properties of TiO2 Particles: Thermal Kinetic and Thermodynamic Studies. J. Sol-Gel Sci. Technol. 2021, 97, 622–637. [Google Scholar] [CrossRef]
- Cauqui, M.A.; Rodríguez-Izquierdo, J.M. Application of the Sol-Gel Methods to Catalyst Preparation. J. Non-Cryst. Solids 1992, 147–148, 724–738. [Google Scholar] [CrossRef]
- Craciun, E.; Predoana, L.; Atkinson, I.; Jitaru, I.; Anghel, E.M.; Bratan, V.; Gifu, C.; Anastasescu, C.; Rusu, A.; Raditoiu, V.; et al. Fe3+-Doped TiO2 Nanopowders for Photocatalytic Mineralization of Oxalic Acid under Solar Light Irradiation. J. Photochem. Photobiol. Chem. 2018, 356, 18–28. [Google Scholar] [CrossRef]
- Sun, Q.; Li, H.; Niu, B.; Hu, X.; Xu, C.; Zheng, S. Nano-TiO2 Immobilized on Diatomite: Characterization and Photocatalytic Reactivity for Cu2+ Removal from Aqueous Solution. Procedia Eng. 2015, 102, 1935–1943. [Google Scholar] [CrossRef] [Green Version]
- Zaharescu, M.; Predoana, L.; Pandele-Cusu, J. Thermal Analysis on Gels, Glasses, and Powders. In Handbook of Sol-Gel Science and Technology: Processing, Characterization and Applications; Klein, L., Aparicio, M., Jitianu, A., Eds.; Springer International Publishing: Cham, Switzerland, 2018; pp. 1833–1867. ISBN 978-3-319-32101-1. [Google Scholar]
- Pandele-Cusu, J.; Petrescu, S.; Preda, S.; Petcu, G.; Ciobanu, M.; Predoana, L. Comparative Study of the TiO2 Nanopowders Prepared from Different Precursors and Chemical Methods for Heterogeneous Photocatalysis Application. J. Therm. Anal. Calorim. 2022, 147, 13111–13124. [Google Scholar] [CrossRef]
- Athar, T. Chapter 14—Metal Oxide Nanopowder. In Emerging Nanotechnologies for Manufacturing, 2nd ed.; Ahmed, W., Jackson, M.J., Eds.; Micro and Nano Technologies; William Andrew Publishing: Boston, MA, USA, 2015; pp. 343–401. ISBN 978-0-323-28990-0. [Google Scholar]
- Athar, T. Chapter 17—Smart Precursors for Smart Nanoparticles. In Emerging Nanotechnologies for Manufacturing, 2nd ed.; Ahmed, W., Jackson, M.J., Eds.; Micro and Nano Technologies; William Andrew Publishing: Boston, MA, USA, 2015; pp. 444–538. ISBN 978-0-323-28990-0. [Google Scholar]
- Chen, X.; Mao, S.S. Titanium Dioxide Nanomaterials: Synthesis, Properties, Modifications, and Applications. Chem. Rev. 2007, 107, 2891–2959. [Google Scholar] [CrossRef] [PubMed]
- Singh, R.; Dutta, S. Synthesis and Characterization of Solar Photoactive TiO2 Nanoparticles with Enhanced Structural and Optical Properties. Adv. Powder Technol. 2018, 29, 211–219. [Google Scholar] [CrossRef]
- Stanciu, I.; Predoana, L.; Pandele-Cusu, J.; Preda, S.; Anastasescu, M.; Vojisavljevic, K.; Malic, B.; Zaharescu, M. Thermal Behaviour of the TiO2-Based Gels Obtained by Microwave-Assisted Sol–Gel Method. J. Therm. Anal. Calorim. 2017, 130, 639–651. [Google Scholar] [CrossRef]
- Predoana, L.; Stanciu, I.; Anastasescu, M.; Calderon-Moreno, J.M.; Stoica, M.; Preda, S.; Gartner, M.; Zaharescu, M. Structure and Properties of the V-Doped TiO2 Thin Films Obtained by Sol–Gel and Microwave-Assisted Sol–Gel Method. J. Sol-Gel Sci. Technol. 2016, 78, 589–599. [Google Scholar] [CrossRef]
- Vinogradov, A.V.; Vinogradov, V.V. Low-Temperature Sol–Gel Synthesis of Crystalline Materials. RSC Adv. 2014, 4, 45903–45919. [Google Scholar] [CrossRef]
- Jongprateep, O.; Puranasamriddhi, R.; Palomas, J. Nanoparticulate Titanium Dioxide Synthesized by Sol–Gel and Solution Combustion Techniques. Ceram. Int. 2015, 41, S169–S173. [Google Scholar] [CrossRef]
- Mehraz, S.; Kongsong, P.; Taleb, A.; Dokhane, N.; Sikong, L. Large Scale and Facile Synthesis of Sn Doped TiO2 Aggregates Using Hydrothermal Synthesis. Sol. Energy Mater. Sol. Cells 2019, 189, 254–262. [Google Scholar] [CrossRef]
- Kumar, S.G.; Rao, K.S.R.K. Polymorphic Phase Transition among the Titania Crystal Structures Using a Solution-Based Approach: From Precursor Chemistry to Nucleation Process. Nanoscale 2014, 6, 11574–11632. [Google Scholar] [CrossRef]
- Fhoula, M.; Kallel, T.; Messaoud, M.; Dammak, M.; Cavalli, E. Morphological, Spectroscopic and Photocatalytic Properties of Eu3+:TiO2 Synthesized by Solid-State and Hydrothermal-Assisted Sol-Gel Processes. Ceram. Int. 2019, 45, 3675–3679. [Google Scholar] [CrossRef]
- Lu, C.-W.; Cao, Y.; Li, H.; Webb, C.; Pan, W.-P. Synthesis of TiO2 Based on Hydrothermal Methods Using Elevated Pressures and Microwave Conditions. J. Therm. Anal. Calorim. 2014, 116, 1241–1248. [Google Scholar] [CrossRef]
- Bregadiolli, B.A.; Fernandes, S.L.; Graeff, C.F.D.O. Easy and Fast Preparation of TiO2—Based Nanostructures Using Microwave Assisted Hydrothermal Synthesis. Mater. Res. 2017, 20, 912–919. [Google Scholar] [CrossRef] [Green Version]
- Wei, X.; Cai, H.; Feng, Q.; Liu, Z.; Ma, D.; Chen, K.; Huang, Y. Synthesis of Co-Existing Phases Sn-TiO2 Aerogel by Ultrasonic-Assisted Sol-Gel Method without Calcination. Mater. Lett. 2018, 228, 379–383. [Google Scholar] [CrossRef]
- Simonsen, M.E.; Li, Z.; Søgaard, E.G. Influence of the OH Groups on the Photocatalytic Activity and Photoinduced Hydrophilicity of Microwave Assisted Sol–Gel TiO2 Film. Appl. Surf. Sci. 2009, 255, 8054–8062. [Google Scholar] [CrossRef] [Green Version]
- Andrade-Guel, M.; Díaz-Jiménez, L.; Cortés-Hernández, D.; Cabello-Alvarado, C.; Ávila-Orta, C.; Bartolo-Pérez, P.; Gamero-Melo, P. Microwave Assisted Sol–Gel Synthesis of Titanium Dioxide Using Hydrochloric and Acetic Acid as Catalysts. Bol. Soc. Esp. Cerámica Vidr. 2019, 58, 171–177. [Google Scholar] [CrossRef]
- Reda, S.M.; Khairy, M.; Mousa, M.A. Photocatalytic Activity of Nitrogen and Copper Doped TiO2 Nanoparticles Prepared by Microwave-Assisted Sol-Gel Process. Arab. J. Chem. 2020, 13, 86–95. [Google Scholar] [CrossRef]
- Li, X.; Wang, L.; Lu, X. Preparation of Silver-Modified TiO2 via Microwave-Assisted Method and Its Photocatalytic Activity for Toluene Degradation. J. Hazard. Mater. 2010, 177, 639–647. [Google Scholar] [CrossRef] [PubMed]
- Tongon, W.; Chawengkijwanich, C.; Chiarakorn, S. Visible Light Responsive Ag/TiO2/MCM-41 Nanocomposite Films Synthesized by a Microwave Assisted Sol–Gel Technique. Superlattices Microstruct. 2014, 69, 108–121. [Google Scholar] [CrossRef]
- Baghbanzadeh, M.; Carbone, L.; Cozzoli, P.D.; Kappe, C.O. Microwave-Assisted Synthesis of Colloidal Inorganic Nanocrystals. Angew. Chem. Int. Ed. 2011, 50, 11312–11359. [Google Scholar] [CrossRef]
- Brinker, C.J.; Scherer, G.W. CHAPTER 2—Hydrolysis and Condensation I: Nonsilicates. In Sol-Gel Science; Brinker, C.J., Scherer, G.W., Eds.; Academic Press: San Diego, CA, USA, 1990; pp. 20–95. ISBN 978-0-08-057103-4. [Google Scholar]
- Basavarajappa, P.S.; Patil, S.B.; Ganganagappa, N.; Reddy, K.R.; Raghu, A.V.; Reddy, C.V. Recent Progress in Metal-Doped TiO2, Non-Metal Doped/Codoped TiO2 and TiO2 Nanostructured Hybrids for Enhanced Photocatalysis. Int. J. Hydrogen Energy 2020, 45, 7764–7778. [Google Scholar] [CrossRef]
- Nair, S.B.; John, K.A.; Joseph, J.A.; Babu, S.; Shinoj, V.K.; Remillard, S.K.; Shaji, S.; Philip, R.R. Fabrication and Characterization of Type-II Heterostructure n:In2O3/p:In-TiO2 for Enhanced Photocatalytic Activity. Phys. Status Solidi B 2021, 258, 2000441. [Google Scholar] [CrossRef]
- Bhanvase, B.A.; Shende, T.P.; Sonawane, S.H. A Review on Graphene–TiO2 and Doped Graphene–TiO2 Nanocomposite Photocatalyst for Water and Wastewater Treatment. Environ. Technol. Rev. 2017, 6, 1–14. [Google Scholar] [CrossRef]
- Lettieri, S.; Pavone, M.; Fioravanti, A.; Santamaria Amato, L.; Maddalena, P. Charge Carrier Processes and Optical Properties in TiO2 and TiO2-Based Heterojunction Photocatalysts: A Review. Materials 2021, 14, 1645. [Google Scholar] [CrossRef]
- Pham, T.-D.; Lee, B.-K. Cu Doped TiO2/GF for Photocatalytic Disinfection of Escherichia Coli in Bioaerosols under Visible Light Irradiation: Application and Mechanism. Appl. Surf. Sci. 2014, 296, 15–23. [Google Scholar] [CrossRef]
- Preda, S.; Pandele-Cușu, J.; Petrescu, S.V.; Ciobanu, E.M.; Petcu, G.; Culiță, D.C.; Apostol, N.G.; Costescu, R.M.; Raut, I.; Constantin, M.; et al. Photocatalytic and Antibacterial Properties of Doped TiO2 Nanopowders Synthesized by Sol-Gel Method. Gels 2022, 8, 673. [Google Scholar] [CrossRef] [PubMed]
- Bensouici, F.; Bououdina, M.; Dakhel, A.A.; Tala-Ighil, R.; Tounane, M.; Iratni, A.; Souier, T.; Liu, S.; Cai, W. Optical, Structural and Photocatalysis Properties of Cu-Doped TiO2 Thin Films. Appl. Surf. Sci. 2017, 395, 110–116. [Google Scholar] [CrossRef]
- Doustkhah, E.; Assadi, M.H.N.; Komaguchi, K.; Tsunoji, N.; Esmat, M.; Fukata, N.; Tomita, O.; Abe, R.; Ohtani, B.; Ide, Y. In Situ Blue Titania via Band Shape Engineering for Exceptional Solar H2 Production in Rutile TiO2. Appl. Catal. B Environ. 2021, 297, 120380. [Google Scholar] [CrossRef]
- Chettah, W.; Barama, S.; Medjram, M.-S.; Selmane, M.; Montero, D.; Davidson, A.; Védrine, J.C. Anatase Titania Activated by Cu(II) or Zn(II) Nanoparticles for the Photooxidation of Methanol Assisted by Rhodamine-B. Mater. Chem. Phys. 2021, 257, 123714. [Google Scholar] [CrossRef]
- Assadi, M.H.N.; Hanaor, D.A.H. The Effects of Copper Doping on Photocatalytic Activity at (101) Planes of Anatase TiO2: A Theoretical Study. Appl. Surf. Sci. 2016, 387, 682–689. [Google Scholar] [CrossRef] [Green Version]
- Maragatha, J.; Rajendran, S.; Endo, T.; Karuppuchamy, S. Microwave Synthesis of Metal Doped TiO2 for Photocatalytic Applications. J. Mater. Sci. Mater. Electron. 2017, 28, 5281–5287. [Google Scholar] [CrossRef]
- Garadkar, K.M.; Kadam, A.N.; Park, J. Microwave-Assisted Sol–Gel Synthesis Of Metal Oxide Nanomaterials. In Handbook of Sol-Gel Science and Technology; Klein, L., Aparicio, M., Jitianu, A., Eds.; Springer International Publishing: Cham, Switzerland, 2016; pp. 1–22. ISBN 978-3-319-19454-7. [Google Scholar]
- Zhang, H.; Wang, M.; Xu, F. Generating Oxygen Vacancies in Cu2+ -Doped TiO2 Hollow Spheres for Enhanced Photocatalytic Activity and Antimicrobial Activity. Micro Nano Lett. 2020, 15, 535–539. [Google Scholar] [CrossRef]
- Lu, G.; Liu, X.; Zhang, P.; Xu, S.; Gao, Y.; Yu, S. Preparation and Photocatalytic Studies on Nanocomposites of 4-Hydroxylphenyl-Substituted Corrole/TiO2 towards Methyl Orange Photodegradation. ChemistrySelect 2021, 6, 6841–6846. [Google Scholar] [CrossRef]
- Rani, N.; Dehiya, B.S. Magnetically Recyclable Copper Doped Core-Shell Fe3O4@TiO2@Cu Nanocomposites for Wastewater Remediation. Environ. Technol. 2022, 43, 4484–4492. [Google Scholar] [CrossRef] [PubMed]
- Kanakaraju, D.; Ya, M.H.B.; Lim, Y.-C.; Pace, A. Combined Adsorption/Photocatalytic Dye Removal by Copper-Titania-Fly Ash Composite. Surf. Interfaces 2020, 19, 100534. [Google Scholar] [CrossRef]
- Li, D.; Liang, Z.; Zhang, W.; Zhang, C. One-Step Synthesis of Cu/N Co-Doped TiO2 Nanocomposites with Enhanced Photocatalytic Activities under Visible-Light Irradiation. Micro Nano Lett. 2021, 16, 573–581. [Google Scholar] [CrossRef]
- Li, D.; Liang, Z.; Zhang, W.; Dai, S.; Zhang, C. Preparation and Photocatalytic Performance of TiO2-RGO-CuO/Fe2O3 Ternary Composite Photocatalyst by Solvothermal Method. Mater. Res. Express 2021, 8, 015025. [Google Scholar] [CrossRef]
- Kanakaraju, D.; Jasni, M.A.A.; Pace, A.; Ya, M.H. Enhanced Dye-Removal Performance of Cu-TiO2-Fly Ash Composite by Optimized Adsorption and Photocatalytic Activity under Visible Light Irradiation. Environ. Sci. Pollut. Res. 2021, 28, 68834–68845. [Google Scholar] [CrossRef]
- Xu, Q.; Li, E.; Zhao, R.; Liang, T.; Zhang, H.; Hu, W.; Zhang, N. Preparation of Organic Porous Materials-TiO2/Cu Composite with Excellent Photocatalytic Degradation Performances toward Degradation of Organic Pollutants in Wastewater. J. Polym. Res. 2020, 27, 186. [Google Scholar] [CrossRef]
- Hampel, B.; Pap, Z.; Sapi, A.; Szamosvolgyi, A.; Baia, L.; Hernadi, K. Application of TiO2-Cu Composites in Photocatalytic Degradation Different Pollutants and Hydrogen Production. Catalysts 2020, 10, 85. [Google Scholar] [CrossRef] [Green Version]
- Wu, M.-C.; Wu, P.-Y.; Lin, T.-H.; Lin, T.-F. Photocatalytic Performance of Cu-Doped TiO2 Nanofibers Treated by the Hydrothermal Synthesis and Air-Thermal Treatment. Appl. Surf. Sci. 2018, 430, 390–398. [Google Scholar] [CrossRef]
- Yang, M.; Huang, T.; Tang, N.; Ou, B.; Zhang, W. Structure and Catalytic Performance of Zn-Doped TiO2 Film. Pigment Resin Technol. 2019, 48, 508–514. [Google Scholar] [CrossRef]
- Tariq, M.K.; Riaz, A.; Khan, R.; Wajid, A.; Haq, H.; Javed, S.; Akram, M.A.; Islam, M. Comparative Study of Ag, Sn or Zn Doped TiO2 Thin Films for Photocatalytic Degradation of Methylene Blue and Methyl Orange. Mater. Res. Express 2019, 6, 106435. [Google Scholar] [CrossRef]
- Oladipo, G.O.; Akinlabi, A.K.; Alayande, S.O.; Msagati, T.A.M.; Nyoni, H.H.; Ogunyinka, O.O. Synthesis, Characterization, and Photocatalytic Activity of Silver and Zinc Co-Doped TiO2 Nanoparticle for Photodegradation of Methyl Orange Dye in Aqueous Solution. Can. J. Chem. 2019, 97, 642–650. [Google Scholar] [CrossRef]
- Wang, L.; Liu, S.; Wang, Z.; Zhou, Y.; Qin, Y.; Wang, Z.L. Piezotronic Effect Enhanced Photocatalysis in Strained Anisotropic ZnO/TiO2 Nanoplatelets via Thermal Stress. ACS Nano 2016, 10, 2636–2643. [Google Scholar] [CrossRef]
- Chen, C.; Wang, Z.; Ruan, S.; Zou, B.; Zhao, M.; Wu, F. Photocatalytic Degradation of C.I. Acid Orange 52 in the Presence of Zn-Doped TiO2 Prepared by a Stearic Acid Gel Method. Dyes Pigments 2008, 77, 204–209. [Google Scholar] [CrossRef]
- Xu, J.-C.; Shi, Y.-L.; Huang, J.-E.; Wang, B.; Li, H.-L. Doping Metal Ions Only onto the Catalyst Surface. J. Mol. Catal. Chem. 2004, 219, 351–355. [Google Scholar] [CrossRef]
- Xu, J.-C.; Lu, M.; Guo, X.-Y.; Li, H.-L. Zinc Ions Surface-Doped Titanium Dioxide Nanotubes and Its Photocatalysis Activity for Degradation of Methyl Orange in Water. J. Mol. Catal. Chem. 2005, 226, 123–127. [Google Scholar] [CrossRef]
- Golubko, N.V.; Yanovskaya, M.I.; Romm, I.P.; Ozerin, A.N. Hydrolysis of Titanium Alkoxides: Thermochemical, Electron Microscopy, Saxs Studies. J. Sol-Gel Sci. Technol. 2001, 20, 245–262. [Google Scholar] [CrossRef]
- Chen, J.; Gao, L.; Huang, J.; Yan, D. Preparation of Nanosized Titania Powder via the Controlled Hydrolysis of Titanium Alkoxide. J. Mater. Sci. 1996, 31, 3497–3500. [Google Scholar] [CrossRef]
- Siwińska-Stefańska, K.; Zdarta, J.; Paukszta, D.; Jesionowski, T. The Influence of Addition of a Catalyst and Chelating Agent on the Properties of Titanium Dioxide Synthesized via the Sol–Gel Method. J. Sol-Gel Sci. Technol. 2015, 75, 264–278. [Google Scholar] [CrossRef] [Green Version]
- Simonsen, M.E.; Søgaard, E.G. Sol–Gel Reactions of Titanium Alkoxides and Water: Influence of PH and Alkoxy Group on Cluster Formation and Properties of the Resulting Products. J. Sol-Gel Sci. Technol. 2010, 53, 485–497. [Google Scholar] [CrossRef] [Green Version]
- Zeng, M.; Uekawa, N.; Kojima, T.; Kakegawa, K. Synthesis of Titania Particles by Low-Temperature Hydrolysis Reaction of Titanium Alkoxide and Their Surface Properties. J. Ceram. Soc. Jpn. 2007, 115, 840–845. [Google Scholar] [CrossRef] [Green Version]
- Teodorescu, C.M.; Esteva, J.M.; Karnatak, R.C.; Afif, A.E. An Approximation of the Voigt I Profile for the Fitting of Experimental X-Ray Absorption Data. Nucl. Instrum. Methods Phys. Res. Sect. Accel. Spectrometers Detect. Assoc. Equip. 1994, 345, 141–147. [Google Scholar] [CrossRef]
- Wagner, C.D.; Davis, L.E.; Zeller, M.V.; Taylor, J.A.; Raymond, R.H.; Gale, L.H. Empirical Atomic Sensitivity Factors for Quantitative Analysis by Electron Spectroscopy for Chemical Analysis. Surf. Interface Anal. 1981, 3, 211–225. [Google Scholar] [CrossRef]
- Naumkin, A.V.; Kraut-Vass, A.; Gaarenstroom, S.W.; Powell, C.J. NIST X-ray Photoelectron Spectroscopy Database; NIST Standard Reference Database Number 20, Version 4.1, Last Update to Data Content: 2012, (Retrieved 9 February 2023); National Institute of Standards and Technology: Gaithersburg, MD, USA, 2000; p. 20899. [Google Scholar] [CrossRef]
- ThermoFisher Scientific XPS Database. Available online: https://www.Thermofisher.Com/Ro/En/Home/Materials-Science/Learning-Center/Periodic-Table/Transition-Metal/Copper.Html (accessed on 9 February 2023).
- ThermoFisher Scientific XPS Database. Available online: https://www.Thermofisher.Com/Ro/En/Home/Materials-Science/Learning-Center/Periodic-Table/Transition-Metal/Titanium.Html (accessed on 9 February 2023).
- Byrne, C.; Moran, L.; Hermosilla, D.; Merayo, N.; Blanco, Á.; Rhatigan, S.; Hinder, S.; Ganguly, P.; Nolan, M.; Pillai, S.C. Effect of Cu Doping on the Anatase-to-Rutile Phase Transition in TiO2 Photocatalysts: Theory and Experiments. Appl. Catal. B Environ. 2019, 246, 266–276. [Google Scholar] [CrossRef]
- Liao, Y.-T.; Huang, Y.-Y.; Chen, H.M.; Komaguchi, K.; Hou, C.-H.; Henzie, J.; Yamauchi, Y.; Ide, Y.; Wu, K.C.-W. Mesoporous TiO2 Embedded with a Uniform Distribution of CuO Exhibit Enhanced Charge Separation and Photocatalytic Efficiency. ACS Appl. Mater. Interfaces 2017, 9, 42425–42429. [Google Scholar] [CrossRef] [PubMed]
- Nawaz, R.; Kait, C.F.; Chia, H.Y.; Isa, M.H.; Huei, L.W. Glycerol-Mediated Facile Synthesis of Colored Titania Nanoparticles for Visible Light Photodegradation of Phenolic Compounds. Nanomaterials 2019, 9, 1586. [Google Scholar] [CrossRef] [PubMed] [Green Version]
- Akel, S.; Boughaled, R.; Dillert, R.; El Azzouzi, M.; Bahnemann, D.W. UV/Vis Light Induced Degradation of Oxytetracycline Hydrochloride Mediated by Co-TiO2 Nanoparticles. Molecules 2020, 25, 249. [Google Scholar] [CrossRef] [PubMed] [Green Version]
- Choudhury, B.; Dey, M.; Choudhury, A. Shallow and Deep Trap Emission and Luminescence Quenching of TiO2 Nanoparticles on Cu Doping. Appl. Nanosci. 2014, 4, 499–506. [Google Scholar] [CrossRef] [Green Version]
- Esmat, M.; Doustkhah, E.; Abdelbar, M.; Tahawy, R.; El-Hosainy, H.; Abdelhameed, M.; Ide, Y.; Fukata, N. Structural Conversion of Cu-Titanate into Photoactive Plasmonic Cu-TiO2 for H2 Generation in Visible Light. ACS Sustain. Chem. Eng. 2022, 10, 4143–4151. [Google Scholar] [CrossRef]
- Cui, T.; Su, Y.; Fu, X.; Zhu, Y.; Zhang, Y. The Key Role of Surface Hydroxyls on the Activity and Selectivity in Photocatalytic Degradation of Organic Pollutants and NO Removal. J. Alloys Compd. 2022, 921, 165931. [Google Scholar] [CrossRef]
- An, N.; Zhao, Y.; Mao, Z.; Agrawal, D.K.; Wang, D. Microwave Modification of Surface Hydroxyl Density for g-C3N4 with Enhanced Photocatalytic Activity. Mater. Res. Express 2018, 5, 035502. [Google Scholar] [CrossRef]


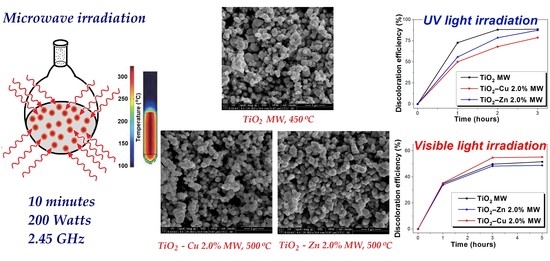
| Preparation Method | Dopant Content | Irradiation-Light Type | Methyl-Orange Concentration | Degradation Efficiency, [%] | Ref. |
|---|---|---|---|---|---|
| Cu-doped TiO2 | |||||
| sol–gel method | TiO2−Cu 2.0% | UV and visible light | 1 × 10⁻⁵ M | 97% UV 16% Vis | [35] |
| hydrothermal process (180 °C for 8 h) | 0, 2, 4, 6, 8, and 10% Cu-TiO2 | simulated sunlight irradiation (300 W Xe lamp) | 20 mg/L | 87.7% of MO (3 cycles, 6% Cu-TiO2) Photocatalytic degradation efficiencies of MO: 6% Cu-TiO2 > 4% Cu-TiO2 > 8% Cu-TiO2 > 2% Cu-TiO2 > 10% Cu-TiO2 > TiO2 | [42] |
| TiO2 by sol–gel method; [Cu(OHCor)]/TiO2 composite by reflux | [Cu(OHCor)]/TiO2 | visible white LED lamp of 30 W | 10 ppm | 31.0%@2.5 h for TiO2 79.5% for [Cu(OH-Cor)]/TiO2 Decrease by 5.7% ([Cu(OH-Cor)]/TiO2 after 3 cycles | [43] |
| hydrothermal method (220 °C for 24 h) | Fe3O4@TiO2 1 wt%, 2 wt% and 3 wt% Cu-Fe3O4@TiO2 | sunlight illumination | 20 mg/L | 85%@2.5 h for MO for Fe3O4@TiO2 85%@2.5 h for MO for 3 wt% Cu-Fe3O4@TiO2 | [44] |
| sol–gel method | TiO2 Cu/TiO2 rFA/Cu/TiO2 oxide Acid- FA/Cu/TiO2 Base- FA/Cu/TiO2 | UVA (λ = 365 nm); visible light (Opple, 4.5 W) | 10 ppm | 81.8% UV, 6.7% Vis for TiO2 37.4% UV, 15.3% Vis for Cu/TiO2 79% UV 58.8% Vis for rFA/Cu/TiO2 100% UV and 99.1%% Vis for Base-FA/Cu/TiO2 96.9% UV for Acid-FA/Cu/TiO2 | [45] |
| solvothermal method | TiO2 0.1 mol%Cu-TiO2 0.3 mol%Cu-TiO2 Cu/N-TiO2 0.5 mol%Cu-TiO2 1 mol%Cu-TiO2 | simulated visible light (250 W hydrogen lamp, 464 nm) | 20 mg/L | 94.3% after 8 cycles for Cu/N-TiO2 Cu/N-TiO2 is four times better than TiO2 (reaction rate constant 0.695 h−1) | [46] |
| one-step solvothermal synthesis method | TiO2-RGO TiO2-RGO-xCuO (x = 0.05, 0.075, 0.1, 0.3, 0.5%) | simulated visible light (250 W neon lamp, 464 nm) | 20 ppm | 94.8% after 8 cycles for TiO2-RGO-0.075%CuO | [47] |
| sol–gel method | TiO2 Cu/TiO2 (1:1 wt%) Cu/TiO2/FA | UVA (λ = 365 nm); visible light (Opple, 4.5 W) | 5, 15, 25, or 100 ppm | 54.32% for Cu/TiO2 (visible) 11.59% for TiO2 (visible) 89.53% for TiO2 (UV) 70.27% for Cu/TiO2 (UV) 96.78% for Cu/TiO2/FA (UV) 89.54% for Cu/TiO2/FA (Visible) | [48] |
| hydrothermal synthesis method (24 h at 200 °C) | TiO2 TiO2/Cu OPMTC (Organic porous materials-TiO2/Cu composite) | simulated sunlight (a); nature sunlight (b) | 100 mg/L | 55.8% (a), 49.1% (b) 91.8% (a), 86.5% (b) 96.3% (a), 92.6% (b) | [49] |
| in situ approach | AA AA-0.5Cu AA-1Cu AA-1.5Cu AA-5Cu AA-10Cu P25 P25-0.5Cu P25-1Cu P25-1.5Cu P25-5Cu P25-10Cu | UV-A (6 × 6 W fluorescence lamp, 365 nm) | 1 g L−1 | 75.6% 7.1% 6.6% 14.5% 17.4% 23.1% 82.8% 37.5% 38.1% 30.5% 24.9% 39.1% | [50] |
| hydrothermal | Cu | UV | 10 ppm | 90% in 150 min | [51] |
| Zn-doped TiO2 | |||||
| sol–gel method | TiO2−Zn 2.0% | UV and visible light | 1 × 10⁻⁵ M | 90% UV 30% Vis | [35] |
| Micro-arc oxidation, impregnation | MAO (TiO2) MAOZn (Zn-TiO2) | UV (250 W, 365 nm) | 5 mg·L−1, 10mg·L−1, 15mg·L−1 and 20 mg·L−1 | 94% MAOZn films 90% after 10 cycles | [52] |
| sol–gel reflux synthesis route | Zn (3 mol %)-TiO2 Zn (5 mol %)-TiO2 | UV-A (1.29 mW cm−2, 466 nm) | 1 mg of dye in 100 mL H2O | 95.6% for MO 99.6% for MO | [53] |
| sol–gel route | Ag,Zn-TiO2 | solar simulator (100 LCL Compact Xenon Light lamp) | 4 ppm | 58.5% at pH 11 84.4% at pH 2.1, 2 gL−1 catalyst dose 93.1% at pH 4.1, 2 gL−1 catalyst dose Complete mineralization at 8 gL−1 catalyst dose within 60 and 120 min for Ag–Zn-TiO2 | [54] |
| simple coprecipitation method | TZO-4 (ZnO/TiO2) | UV (500 W, λ max = 365 nm) | 20 mg/L | 99%/90 min | [55] |
| stearic-acid-gel method; sol–gel method | P25 (0, 0.05, 0.1, 0.3, 0.5, 1)ste Zn-TiO2 0.1sol Zn-TiO2 At 400, 450, 500 and 600 °C | mercury lamp (300 W) | 20 mg/l | 0.1% Zn/TiO2 ste—best photodegradation of the dye 0.1% Zn/TiO2 ste > 0.1% Zn/TiO2 sol > P25 For 0.1%Zn/TiO2 ste series 450 °C > 400 °C > 500 °C > 600 °C | [56] |
| ligand exchange reaction and with additional thermal treatment | Pure TiO2 metal oxide TiO2(-Zn) TiO2(-Zn)+HCl | UV light reactor (400 W high-pressure mercury lamp) | 20 mg/l | Residual MO 0.799 mg/L@1h, 0.637 mg/L@2h and 0.528 mg/L@3h for metal oxide TiO2(-Zn) 0.859 mg/L@1h, 0.748 mg/L@2h and 0.685 mg/L@3h for pure TiO2 0.742 mg/L@1h, 0.542 mg/L@2h and 0.403 mg/L@3h for TiO2(-Zn)+HCl | [57] |
| ligand exchange reaction and with additional thermal treatment | TiO2 nanotubes Zn(acac)2 assembled TiO2 nanotubes | UV light reactor (400 W high-pressure mercury lamp) | 20 mg/L | Residual MO in Zn(acac)2 assembled TiO2 nanotubes At 300 °C 19.72 mg/L@1h, 19.08 mg/L@2 h and 18.24 mg/L@3 h At 400 °C 13.82 mg/L@1 h, 9.44 mg/L@2h and 7.02 mg/L@3 h At 500 °C 15.32 mg/L@1 h, 12.70 mg/L@2 h and 10.82 mg/L@3 h Zn ions surface-doped TiO2 nanotubes > Pure TiO2 nanotubes > pure TiO2 nanoparticles | [58] |
| Element | BE (eV) | % at | Interpretation | ||
|---|---|---|---|---|---|
| TiO2-Zn 2.0% MW | Ti 2p | C1 | 457.15 | 0.25 | Ti(IV) vol. |
| C2 | 458.82 | 32.59 | Ti(IV) surf. | ||
| 32.84 | |||||
| O1s | C1 | 530.32 | 50.71 | Ti(IV) | |
| C2 | 531.49 | 15.9 | TiO2/TiOx + Zn(II) + cont | ||
| 66.61 | |||||
| Zn 2p3/2 | C1 | 1022.52 | 0.55 | Zn(II) | |
| TiO2.03—Zn 0.55% | |||||
| TiO2-Cu 2.0% MW | Ti 2p | C1 | 458.70 | 32.58 | Ti(IV) vol. |
| C2 | 459.71 | 1.26 | Ti(IV) surf. | ||
| 33.84 | |||||
| O1s | C1 | 530.28 | 51.02 | Ti(IV) | |
| C2 | 531.50 | 14.75 | TiO2/TiOx + Zn(II) + cont | ||
| 65.77 | |||||
| Cu 2p3/2 | C1 | 932.86 | 0.39 | Cu(I) | |
| TiO2—Cu 0.39% | |||||
| Sample | Lattice Parameters | Crystallite Size, [nm] | Microstrain, [%] | |
|---|---|---|---|---|
| a, [Å] | c, [Å] | |||
| TiO2 MW (450 °C) | 3.788359 ± 0.000278 | 9.508230 ± 0.000739 | 16 | 0.57 ± 0.16 |
| TiO2−Cu 2.0% MW | 3.788145 ± 0.000340 | 9.504234 ± 0.000896 | 14 | 0.65 ± 0.19 |
| TiO2−Zn 2.0% MW | 3.790948 ± 0.000383 | 9.500206 ± 0.001015 | 12 | 0.75 ± 0.22 |
| TiO2, anatase (ICDD 21-1272) | 3.7850 | 9.5140 | - | - |
| Sample | Composition | Values | U.M. | Line |
|---|---|---|---|---|
| TiO2−Zn 2.0% MW | Ti | 57.9936 | mass% | Ti−KA |
| Zn | 1.6021 | mass% | Zn−KA | |
| O | 39.0359 | mass% | O−KA | |
| C, S, Si, V (traces) | 1.6684 | mass% | ||
| TiO2 | 93.2240 | mass% | Ti−KA | |
| ZnO | 1.8994 | mass% | Zn−KA | |
| C, S, Si, V oxides (traces) | 4.8766 | mass% | ||
| TiO2−Cu 2.0% MW | Ti | 56.7392 | mass% | Ti−KA |
| Cu | 1.6454 | mass% | Cu−KA | |
| O | 40.3301 | mass% | O−KA | |
| C, Si, S (traces) | 1.2 | mass% | ||
| TiO2 | 93.3325 | mass% | Ti−KA | |
| CuO | 2.0222 | mass% | Cu−KA | |
| C, S, Si oxides (traces) | 4.6453 | mass% |
| Element | BE (eV) | % at | Interpretation | ||
|---|---|---|---|---|---|
| TiO2-Zn 2.0% TT (500 °C) | Ti 2p3/2 | C1 | 458.7 | 24.1 | Ti(IV) vol. |
| C2 | 459.53 | 4.5 | Ti(IV) surf. | ||
| 28.6 | |||||
| O 1s | C1 | 529.94 | 42.5 | Ti(IV) | |
| C2 | 530.83 | 27.1 | Ti(IV)+Zn(II)+cont | ||
| 69.6 | |||||
| Zn 2p3/2 | C1 | 1022.39 | 1.8 | Zn(II) | |
| TiO2,43—Zn 1.8% | |||||
| TiO2-Cu 2.0% TT (500 °C) | Ti 2p | C1 | 458.6 | 16.7 | Ti(IV) |
| C2 | 460 | 4.2 | TiOx | ||
| C3 | 461.4 | 3.1 | Ti | ||
| 24.0 | |||||
| O 1s | C1 | 529.79 | 31.5 | Ti(IV) | |
| C2 | 530.71 | 21.8 | TiOx+ organics | ||
| C3 | 532.61 | 20.8 | TiOx/OH groups [71] | ||
| 74,1 | |||||
| Cu 2p3/2 | C1 | 936.3 | 1,9 | Cu(II) | |
| TiO2,22—Cu 1.9% | |||||
| Sample | Precursors | Molar Ratio | pH Sol | Experimental Conditions | |||
|---|---|---|---|---|---|---|---|
| T (°C) | t (min) | ||||||
| TiO2−Cu 2.0% MW | Ti(OC4H10)4 + Cu(NO3)2·3H2O | 36.5 | 3 | 0.003 | 10 | 60 | 10 |
| TiO2−Zn 2.0% MW | Ti(OC4H10)4 + Zn(NO3)2·6H2O | 36.5 | 3 | 0.003 | 10 | 60 | 10 |
Disclaimer/Publisher’s Note: The statements, opinions and data contained in all publications are solely those of the individual author(s) and contributor(s) and not of MDPI and/or the editor(s). MDPI and/or the editor(s) disclaim responsibility for any injury to people or property resulting from any ideas, methods, instructions or products referred to in the content. |
© 2023 by the authors. Licensee MDPI, Basel, Switzerland. This article is an open access article distributed under the terms and conditions of the Creative Commons Attribution (CC BY) license (https://creativecommons.org/licenses/by/4.0/).
Share and Cite
Predoană, L.; Petcu, G.; Preda, S.; Pandele-Cușu, J.; Petrescu, S.V.; Băran, A.; Apostol, N.G.; Costescu, R.M.; Surdu, V.-A.; Vasile, B.Ş.; et al. Copper-/Zinc-Doped TiO2 Nanopowders Synthesized by Microwave-Assisted Sol–Gel Method. Gels 2023, 9, 267. https://doi.org/10.3390/gels9040267
Predoană L, Petcu G, Preda S, Pandele-Cușu J, Petrescu SV, Băran A, Apostol NG, Costescu RM, Surdu V-A, Vasile BŞ, et al. Copper-/Zinc-Doped TiO2 Nanopowders Synthesized by Microwave-Assisted Sol–Gel Method. Gels. 2023; 9(4):267. https://doi.org/10.3390/gels9040267
Chicago/Turabian StylePredoană, Luminița, Gabriela Petcu, Silviu Preda, Jeanina Pandele-Cușu, Simona Viorica Petrescu, Adriana Băran, Nicoleta G. Apostol, Ruxandra M. Costescu, Vasile-Adrian Surdu, Bogdan Ştefan Vasile, and et al. 2023. "Copper-/Zinc-Doped TiO2 Nanopowders Synthesized by Microwave-Assisted Sol–Gel Method" Gels 9, no. 4: 267. https://doi.org/10.3390/gels9040267