Comparative Study of Pine Reference Genomes Reveals Transposable Element Interconnected Gene Networks
by
 , , and
Angelika Voronova
1,* ,
,
Martha Rendón-Anaya
2,
Pär Ingvarsson
2 ,
,
Ruslan Kalendar
3 and
and
Dainis Ruņģis
1 1
Genetic Resource Centre, Latvian State Forest Research Institute “Silava”, LV2169 Salaspils, Latvia
2
Linnean Centre for Plant Biology, Department of Plant Biology, Swedish University of Agricultural Sciences, SE-750 07 Uppsala, Sweden
3
Department of Agricultural Sciences, University of Helsinki, FI-00014 Helsinki, Finland
*
Author to whom correspondence should be addressed.
Genes 2020, 11(10), 1216; https://doi.org/10.3390/genes11101216
Submission received: 23 July 2020
/
Revised: 11 October 2020
/
Accepted: 13 October 2020
/
Published: 16 October 2020
(This article belongs to the Special Issue Transposable Elements in Plant Genomes)
Abstract
:Sequencing the giga-genomes of several pine species has enabled comparative genomic analyses of these outcrossing tree species. Previous studies have revealed the wide distribution and extraordinary diversity of transposable elements (TEs) that occupy the large intergenic spaces in conifer genomes. In this study, we analyzed the distribution of TEs in gene regions of the assembled genomes of Pinus taeda and Pinus lambertiana using high-performance computing resources. The quality of draft genomes and the genome annotation have significant consequences for the investigation of TEs and these aspects are discussed. Several TE families frequently inserted into genes or their flanks were identified in both species’ genomes. Potentially important sequence motifs were identified in TEs that could bind additional regulatory factors, promoting gene network formation with faster or enhanced transcription initiation. Node genes that contain many TEs were observed in multiple potential transposable element-associated networks. This study demonstrated the increased accumulation of TEs in the introns of stress-responsive genes of pines and suggests the possibility of rewiring them into responsive networks and sub-networks interconnected with node genes containing multiple TEs. Many such regulatory influences could lead to the adaptive environmental response clines that are characteristic of naturally spread pine populations.
1. Introduction
The functional role of transposable element (TE) insertions distributed throughout plant genomes is less studied and phenotypic changes are less obvious compared with protein-coding regions [1,2,3]. Transposition of TEs is linked to stress conditions and evolutionary change [3,4,5,6,7,8,9,10,11,12], but these sequences are usually controlled by the host organism [13]. Progress in transcriptome sequencing has revealed multiple types of non-coding RNAs that originate from TE sequences, nested elements, and their relicts remaining after purifying selection [3,14,15,16]. Information from various plant species and genes where TE-derived insertions are linked to phenotype alterations is accumulating [17,18,19,20,21,22,23,24]. Reported influences of these insertions include gene interruption by transposition; alteration of gene expression levels via providing additional transcription initiation signals or downregulation by methylation; exon shuffling and alternate splicing; initiation of antisense transcription; non-coding RNA production or providing target sites; providing additional poly-A signals that change transcript stability and transport from the nucleus; multiple insertions of similar TEs that could establish dynamic gene networks [10,25,26,27,28,29,30].
TEs are organized into classes (retrotransposons and DNA transposons), superfamilies (Ty1-copia, Ty3-gypsy, etc.), families, and subfamilies. Up to 20% nucleotide sequence variation is permitted between family members [31]. The most prevalent TEs in plants are long terminal repeat (LTR) retrotransposons (RLXs), which are sequences that contain direct repeats that flank the internal sequence or body of the element. LTRs may contain transcription initiation (plant type II promoters) and termination signals (polyadenylation site), polypurine tracts, integrase-binding signals, tRNA primer binding sites (PBS), and cis-acting elements [32]. Several elements with extraordinarily short LTRs have been described for angiosperms (e.g., 85 bp, FRetro129 [33]), while the LTRs of other RLXs can be longer than 5 kb in length (Sukkula, [34,35], Grande, [36], and Ogre, [37]). However, these are exceptions and LTRs are typically 0.1–2 kb in length [38,39]. The internal region of autonomous RLXs contain gag- and polyprotein-coding domains that produce the proteins necessary for retrotransposition, namely, protease, reverse transcriptase, and integrase. Non-autonomous elements contain empty, partial, or disrupted polyprotein sequences and use proteins produced by autonomous elements, sometimes integrating more effectively than their autonomous partner [35,40,41,42]. Reverse transcription processes introduce mutations and can produce chimeric elements by template switching [43]. Non-homologous recombination often involves highly similar repeats and can result in deletions of portions of TEs or even neighboring genes [44]. Some genome regions contain multiple insertions of TEs into each other, forming nested repeat regions [45]. During transposition, RLXs proliferate via RNA transcript intermediates, but DNA transposons excise from their current location and migrate to a new genomic locus. Therefore, copy number proliferation is not as pronounced for DNA transposons. However, some non-autonomous DNA transposons have been found more frequently in plant gene regions, such as Miniature Inverted-repeat Transposable Elements (MITEs) [46,47,48]. Distributed TE families are broadly used as molecular markers in population genetic investigations and marker-assisted breeding [48,49,50,51,52,53,54,55,56,57].
Conifer genomes are greater than 15 Gbp in size and contain extended regions of non-coding DNA, much of which are derived from TEs. The genomes of pines represent one extreme in plants, with stable diploid genomes that are expanded by the proliferation of TEs, in contrast to frequent polyploidisation events in angiosperms [58,59,60]. TEs are rarely deleted via non-homologous recombination processes; therefore, the ratio of solo LTR to full-length elements is lower in conifers, and most TEs are represented as full-length elements [60]. The genome sequences of several gymnosperm species have been published [60,61,62,63]. However, data quality, coverage, and gene models are continually improving [64]. The loblolly pine (Pinus taeda) genome contains a high proportion of TEs; there are approximately 1500 families with the prevalence of LTR RLXs (42% of genome sequence [65,66]. In conifer genomes, TE sequences are highly diverged; however, some conserved families are found in Pinaceae and even in more distant gymnosperms [67,68]. Our previous studies on Scots pine (Pinus sylvestris) revealed a rapid expression of TE-containing sequences in response to stress conditions [69]. The composition of the studied RLXs was found to be specific to pine lineages, while family proportions and copy numbers showed variation between and within pine species [68]. The more frequent distribution of a particular RLX family in the pine genome does not lead to its higher expression rate, but expression levels of different RLXs were strongly correlated within individual seedlings [70]. Therefore, we hypothesized that stress-responsive genes or their surrounding regions could be enriched with particular TE families that are co-expressed with genes under unfavorable conditions. The aim of this study was to analyze genes containing TEs and the distribution of TEs in genomic sequences of genes and gene-flanking regions in the available pine reference genomes (P. taeda and P. lambertiana). We also explored the possibility of transferring this information to P. sylvestris genome studies. The obtained results were used to evaluate if the distribution of TEs in gene regions is random regarding different gene regions (e.g., flanks or introns), species or TE families; if genes containing similar TE families are involved in similar processes; and if the investigated TEs contain potential gene regulatory motifs.
2. Materials and Methods
2.1. Generation of Datasets
Reference genomes for P. taeda v.1.01 and v.2.0 and P. lambertiana v.1.01 were downloaded from https://treegenesdb.org. The PIER v.2.0 (Pine Interspersed Element Resource) [65] database was used for TE identification. The UPPMAX (Uppsala Multidisciplinary Center for Advanced Computational Science) resource was initially used for analyses of genomic sequences. The Riga Technical University High Performance Computing (HPC) Centre was used for further analyses in Latvia. The publicly available PIER 2.0 database contains conifer TEs and nested repeats that were recognized by automatic genome annotation from the P. taeda v.1.01 genome. A large portion of the database entries contain nested repeats with 2–4 pairs of direct LTRs rather than full-length TE sequences, which could negatively influence the analyses in this study. One TE insertion within a particular gene will have hits to hundreds of different database entries containing high sequence similarity to this TE; therefore, all full-length elements were clustered with CD-Hit v.4.6.4 [71] utilizing a sequence identity threshold of 0.8. This resulted in 15,622 unique TE representatives from the 19,700 entries originally found in the database. This was the full-length TE database used for analyses. A further problem was the high sequence diversity of conifer TEs that contain many insertion-deletion polymorphisms. It is possible to apply strict similarity search criteria, but then two genes containing insertions of the same TE family will be not recognized as members of the same network. In this case, potentially important carriers of similar transcription signals (e.g., LTR sequences) will not be recognized. Additionally, genome scaffolds are often truncated at repeat insertion loci, leaving numerous genes with only partial TE sequences unmasked. Therefore, all direct repeats were extracted from each defined mobile element in the PIER database, resulting in 24,591 repeats. The new data set of extracted repeats contained sequences from 79 bp to 13,295 bp in length, with an average length of 579 bp and a median length of 417 bp. The presence of nested repeats could lead to the extraction of direct repeats of the same TE family or sequences that represent a body of nested TEs. This was verified by individual sequence inspection and all-to-all alignment. To reduce such errors, extracted TE-derived repeats were CD-Hit clustered, resulting in 9659 entries. Sequences of only 0.1–2 kb in length were used for further analyses, resulting in a final database of 9107 entries (5.7% reduction). This was the TE-derived repeat database.
2.2. Extraction of Gene Introns and Flanking Regions
Bedtools v.2.27.1 [72] were used to extract sequences of all genes containing introns from the reference genomes. Full-length and TE-derived repeat similarity searches within the extracted gene regions for each reference genome were performed with basic local alignment search tool (BLAST) BLASTn v.2.2.26 [73]. Samtools [74] were used for matching gene sequence extraction. BEDOPS v.2.4.35 [75] used for extraction of gene-flanking regions, with 5-kb sequences from the 5′ and 3′ flanking regions of each gene extracted into separate databases. Flanking sequences were further divided into 1-kb fragments, resulting in 10 databases. If any of 1-kb region included a scaffold end, the shorter remaining sequence was included. Each flanking region was referenced to its gene ID and position. Sequences were compared using BLAST with the following parameters: percent identity ≥80%, alignment length ≥100 bp, Query Coverage Per High-scoring Segment Pair (HSP) ≥90%. For P. lambertiana analyses, the Query Coverage Per HSP parameter was lowered to ≥80% as the previous parameter set produced no hits. A t-test was calculated for the evaluation of TE enrichment with significance to flanking regions in the vicinity of genes compared with other regions. The standard deviation of the distribution of differences between independent sample means was estimated for each TE-derived repeat (for the equal variance t-test). Enrichment significance of p = 0.001 was considered if t was greater than 5.04 (df = 8) and p = 0.05 if t > 2.31 (df = 8).
To overcome inconsistencies found in genome files, P. taeda v.2.0 true genomic coordinates were evaluated for 15,534 transcripts annotated with any Gene Ontology term (from 36,730 entries annotated as genes). Correct genomic coordinates of transcripts were identified by running a computationally intense local NCBI short-blast algorithm with parameters of sequence identity >98% and 100% query coverage per HSP. The resulting genomic coordinates were further sorted and corrected as follows: scaffolds containing identical hits and gene coordinates were deleted, with genes larger than 20 kb manually verified and repetitions of partial exon structures or gene repeats on one scaffold deleted, leaving only one conventional structure with all exons present. Further gene transcripts were screened against the PIER database, and genes matching TEs with more than 50% query coverage and more than 80% sequence identity were filtered out. All extractions and analyses were repeated with the new gene set. After all steps, genes containing two or more types of repeats (filling less than 50% of template) were still present in the dataset and were later filtered from the results. Gene genomic sequences from the transcription start to termination site were extracted from the reference genomes into separate databases.
2.3. Analysis of LTR Structure and Transcription Factor Binding Sites (TFBS)
The database of LTR representatives was used for analysis of flanking and intron regions, which was generated by computational selection of any repeated region found in one RLX sequence defined by automated predictions. Then, 5-kb gene-flanking regions containing hypothetical distributed LTRs were extracted and full-length TE structures were identified if possible. Further, verified TE structures were repeatedly queried among all gene regions and the related information was updated. Hits with ≥1 kb query coverage and more than 80% nucleotide identity to full-length TEs were considered strong candidates. Consensus sequences were evaluated after multiple alignment of extracted TE sequences. Characteristic features of TEs were identified using an NCBI Conserved Domain search, the REPFIND repeat prediction tool [76], and Repbase [77]. Softberry tools (ScanWM-PL, TSSPlant, NSITE-PL, POLYAH, http://www.softberry.com; [78]), and PLACE v.30.0 [79] were used for the identification of TFBS, plant promoters, and poly-A sites in LTRs that were found frequently near exons. miRBase [80] and the RNAfold web server [81] were used for microRNA prediction.
2.4. Gene Networking and Gene Ontology Analysis
The Gene Ontology (GO) classification file was obtained from the Gene Ontology Consortium (http://www.geneontology.org/), and the P. taeda v.1.01 gene functional annotation was downloaded from PLAZA [82]. Gene functional annotation for P. taeda v.2.0 was generated by considering gene transcript homology to P. taeda v.1.01, which enabled comparison between differing numberings of genome versions. Fewer than 50% of the genes were categorized to any GO term for P. taeda v.2.0 (15,534 of 36,730). For P. lambertiana v.1.01, a functional annotation file was downloaded from the Treegenes data repository (https://treegenesdb.org/). In total, 8943 genes from 13,637 were assigned with any GO term for P. lambertiana v.1.01. Homology of the evaluated gene set in each network was tested by sequence comparison of transcripts (whole set) between two species (e-value < 0.001).
Gene networking analysis was performed only to assess potential functional significance of the evaluated gene groups. Each gene network was established by the presence of high-quality matches to similar TEs (members of one TE family), present in a particular location (5′ and 3′ 0–2 kb gene flanks or introns). High-quality sequence matches (>1 kb, >80% sequence identity to TEs; for short MITE elements > 200 bp matches; e-value < 0.01) were considered in the final networking analysis. BINGO v. 3.0.3 [83] was used for gene networking analysis using the custom annotation available, with Cytoscape v.3.3.0 [84] used for gene network visualization. Gene networks were formed from the annotated genes, as genes without annotation were automatically excluded by the software. Network edges represent connections of GO terms, but the node size depends on the gene count categorized to a particular term. A hypergeometric test with Bonferroni correction implemented in BINGO was used for the GO term overrepresentation test in one particular network compared to custom GO annotation of all pine genes. Comparative networks between two species or different TE locations (flanking regions or introns) were constructed using DyNet [85]. Further, for updating gene annotations, network-associated gene transcripts were extracted and additionally annotated, using a blastx search against the NCBI reference protein database with CLC Genomics Workbench Blast2GO analysis workflow tools. The GenAlEx 6.05 software package [86] was used for analysis of TE insertion patterns. Identified protein interactions were analyzed using STRING v.11 [87]. A graphic overview of the analysis workflow is provided in File S1.
3. Results
3.1. Quality of Assembled Genomes and TE Assay
The quality of reference genomes and the repeat database used (full-length vs. TE-derived repeats databases, see methods) play a major role when analyzing the presence of TEs in gene regions. Analysis of the first version of the P. taeda genome with the full-length TE element database identified more genes containing TE sequences in introns (the top-ranked TE had unique matches to 200 genes) than in the P. taeda v.2.0 genome assembly (the top-ranked TE had matches to only 39 genes). A similar situation was observed when analyzing the 5-kb flanking regions using the full-length TE database. However, when the TE-derived repeat database was used for the analyses, the number of genes with repeats in the introns or flanking regions was similar in both P. taeda genome versions. The main reason for these differences may be because the full-length TE elements identified from v.1.01 did not align over their entire length with the v.2.0 genomic sequence assembled from longer reads. Additionally, observation of particular gene introns with similarity to interspersed repeats revealed that incomplete TE sequences in v.2.0 were frequently present with masked sequences nearby. This suggests persistent problems with TE-containing read assembly and indicates the need for validation of observed matches to confirm the presence of full-length or partial TEs. Due to the diversity and repetitive nature of conifer TEs, the differentiation of full-length elements from partial, chimeric, or nested copies is often not possible without resequencing. The presence of any part of a TE could be indicative of the occurred insertion, and the partial or full-length structure could be further confirmed in additional experiments. Therefore, utilizing shorter repeats as representatives was more suitable at this point for evaluation of prevalent TEs in or near genes. For P. lambertiana, only one genome version is currently available, and using the full-length TE database, the most frequent families were found in the vicinity of 272 genes, which was comparable only with results from the P. taeda v.1.01 genome. However, utilizing the short TE-derived repeat database, approximately 500 matching genes were found for the most frequent TE family in both P. taeda v.1.01 and v.2.0, and 532 genes were identified in the P. lambertiana genome, which was comparable across all versions. Evaluated amounts of TEs are in accordance with whole-genome TE content data, where the larger genome size of the pine subgenus Strobus (P. lambertiana) correlates with a higher gene and repetitive element content [62].
Previously annotated pine RLXs were used to assess the quality of genome assembly in gene regions. The ratio of LTR to internal sequences of RLXs should reach a value of two if RLXs are present as full-length elements. However, incomplete sequences of the ancient and widely distributed IFG family were found in gene introns of P. lambertiana, with more internal sequences present than LTRs (File S2). In contrast, in the P. taeda v.2.0 genome, solo LTRs of IFG prevailed. More rapid degradation of LTR sequences is common for RLXs in plant genomes; however, according to previous studies, this process is relatively slow in conifers. Moderately distributed TE families, such as Pinewoods and Appalachian, were represented in both species’ genomes as full-length sequences (File S2). However, the low-copy-number RLX Angelina was overrepresented by solo LTRs in P. taeda introns, as only one complete internal sequence and 13 LTRs were found at a 90% similarity level. Generally, at 80% sequence similarity, more solo LTRs were identified, which could be a result of genome assembly from short-reads, fragmentation of RLX, structural differences, or degradation of some sequences in gene introns. These results indicate that the structural inconsistencies are present in the current assemblies, not only across the entire genome, but also in the functional regions of genes.
3.2. Topology of TEs in Gene Non-Coding Regions
An overview and comparison of the number of extracted gene-flanking regions and total number of hits to TE-derived repeats in 5′ and 3′ gene-flanking regions between the two pine species are presented in Table 1. The ratio of hit number to the number of extracted flanking regions was similar for all regions in the P. taeda v.2.0 genome (0.1–0.11, except for the 0–1 kb region with a ratio of 0.16–0.18). After in-depth analysis of the P. taeda v.2.0 genome, global errors in gene coordinates were revealed such that many protein-coding gene transcript coordinates were mapped to TE genomic coordinates without any sequence similarity. This increased the number of LTRs found in the 0–1 kb flanks of false genes. After creating our own genome annotation (see methods), similar tendencies were revealed in the TE distribution in all studied genomes, namely, an increase in hits to TE-derived repeats with increasing distance from genes.
The P. taeda v.2.0 genome currently has the best scaffold quality regarding TE location. To analyze the distribution of TEs relative to distance from genes, the 5-kb flanking regions of filtered P. taeda v.2.0 genes were divided into 1-kb regions (0–1; 1–2; 2–3; 3–4, and 4–5 kb from genes); the distance and the position (5′ or 3′) relative to each gene were therefore retained. For each repeat, t-statistics were calculated comparing average unique hit numbers to the gene-flanking regions. In total, 135 different TE-derived repeats were identified in gene-flanking regions. Significantly increased occupancy in the 0–1 kb gene-flanking regions was determined for nine (p = 0.001) and seven TEs (p = 0.05) compared to the 2–5 kb flanking regions (File S4). Of these enriched TE families, occupancies of two TEs (p = 0.001) was also significantly increased in the 0–2 kb flanking regions. The number of genes where a particular TE was enriched in the 5′ and 3′ 0–1 kb flanks ranged from 27 to 48 genes. False genes were identified and evaluated in subsequent detailed sequence analyses. These false gene sequences consisted of parts of several different TEs that were not present in databases and therefore could not be filtered out in previous stages. Therefore, fewer protein-coding genes actually contained TEs in their vicinity than initially identified, and all gene groups were repeatedly screened against the NCBI database using a blastx search to confirm that they were protein coding.
Analysis of enriched repeats in gene-flanking regions allowed identification of a MITE element in both species’ genomes, which we have named Plater and describe in further detail below. In addition, we identified evidence of the distribution of a Copia RLX RYX6 LTR family in the 0–2 kb flanks of P. taeda genes. This element had 91% similarity to the PpRT6 partial RNaseH-like gene (EF102091) previously reported for P. pinaster [88]. The full-length element (3367 bp) was present in only one gene flank while others contained solo LTRs; most sequences between LTRs were masked. The identified potential LTR was rich in AT-containing motifs (AT-1, ARR1AT, CAATBOX1, MYB1AT, CIACADIANLELHC, MYCCONSENSUSAT, ROOTMOTIFTAPOX1, P1BS, “TATCCA” element and others). The extracted 416-bp LTRs contained conventional 5′-TG-CA-3′dinucleotides, TATA box (S000203), and a polypurine tract. The absence of full-length coverage of RYX6 due to masked regions prevented determination of a consensus sequence and verification of the results, indicating that sequence scaffolding problems persist in the case of longer repetitive elements. Another enriched repeat identified belonged to the 5767-bp RLX Copia-2602 with 160-bp LTRs. After filtering of false-positives, the hit count to the newly identified RLX increased with distance from the gene. The relatively short LTR of this RLX contains three TATA box motifs and three CAAT boxes on the negative strand; therefore, insertion of this element could promote antisense transcription. Only two P. lambertiana genes possessed a Copia-2602 insertion in 0–1 kb flanks; these were a probable histone H2B.3 gene and a Piwi-like domain containing argonaute family protein-coding gene. In the P. taeda 2.0 genome, two gene flanks contained hits to Copia-2602 (serine/threonine protein kinase PEPKR2 and carnitine transporter 4). Insertions of the Copia-2602 LTRs into 3′ flanks of a TMV resistance protein N-like gene and one unknown gene were found. Copia-2602 was also identified in the 1-2 kb flanks of flavonoid 3′,5′-hydroxylase 2, probable disease resistance protein At4g33300, chitinase 2-like, and cytochrome P450 (CYP736A12) genes.
In conclusion, in the P. taeda and P. lambertiana genomes, all gene sets contained almost no highly frequent TE insertions in the 0–1 kb gene-flanking regions (with the exception of MITE). Therefore, nearby gene regions were characterized with moderate TE distribution and diverse TE insertions. Furthermore, the number of most TE-derived repeats gradually increased with distance from genes, suggesting a slight elimination of TEs from the gene vicinity. Most TE insertions accumulated in the gene introns (Figure 1). The patterns of the most widely distributed TEs in the gene introns of both species were compared (Figure 2, File S3). Far more short TE-derived repeats were evaluated in the gene introns of both species (File S3). Interspersed repeats that were identified as associated with genes in both the P. taeda and P. lambertiana genomes were manually reviewed to verify their full-length structure, and TEs with high-quality hits (>1 kb in length) were considered for further networking analyses (Figure 2).
Gene transcripts containing identical TEs in their genomic sequences were compared, but in most cases no homologous transcripts between P. taeda and P. lambertiana were found. TEs distributed in the gene non-coding regions of both species were analyzed in more detail and only the structurally most well defined and informative are described separately in the next sections. Evidence of the presence of other TEs in gene flanks and introns was also found; however, the fragmentation of the current genome assemblies does not allow these data to be confirmed conclusively.
3.3. Gene Ontology Analysis
To obtain an overview of the functions of genes with similar TE insertions in introns or flanks, Gene Ontology (GO) analysis was performed for the extracted gene groups. However, approximately 50% of all pine genes were not annotated to any GO category and therefore these genes were automatically excluded from the networking analysis.
For flanking regions, GO analysis was performed for genes with a statistically higher frequency of TE-derived repeats (File S4). Some members of the identified gene networks contained TE insertions in their vicinity with the highest t-significance of enrichment, but had few associated GO terms and were poorly annotated. TE-containing transcripts were annotated with GO terms such as DNA integration, RNA-dependent DNA biosynthesis, endopeptidase activity, or nucleic acid binding. Some gene groups contained only a few annotated genes, and their biological significance could not be established with certainty.
A higher diversity of TEs were identified within gene introns. Gene networks were built for genes having similar TE insertions in their introns without taking into account the exact location of TEs regarding intron number and position (File S5). GO categories from biological processes and molecular function were determined, and overall hits to unique genes and the GO-annotated gene count in category were indicated. In the DyNet comparative trees, common GO categories shared between the two species are indicated in white (File S5). Genes from the two species containing identical TEs were categorized into similar parental GO categories. However, no homologous genes were revealed in most of the analyzed networks between the two pine species. This demonstrates that gene regions of two distantly related pine species contain insertions of TEs in different genes involved in similar processes. The identified gene networks were often associated with defense and regulative responses, such as oxidation-reduction processes, transmembrane receptor biosynthesis, metal ion binding, hormone metabolic processes, and carbohydrate metabolic processes (Files S5 and S6).
3.4. MITE Plater Distribution in Gene Vicinity and Introns
A TE-derived repeat PtRXX_3321 was significantly enriched in the P. taeda v.1.01 gene flanks (0–2 kb) and was also frequently found in gene introns (Files S3 and S4). In-depth analysis of the sequences obtained from the P. taeda v.2.0 genome revealed a MITE element, subsequently named Plater, that was 259 bp in length and contained 24-bp terminal inverted repeats (TIRs). The stem sequence was flanked with 40-bp direct repeats which were identified in the first intron of the probable pectinesterase/pectinesterase inhibitor gene. A consensus sequence of the MITE transposon Plater was built for each species genome. Compared with P. taeda, the P. lambertiana Plater MITE contained a 10-bp insertion in the 3′ stem sequence and was 265 bp in length with 28-bp TIRs. The P. taeda Plater element (sharing more than 80% sequence similarity) was found in 74 gene introns, of which 58 unique gene introns contained Plater MITE insertions with 99–100% nucleotide identity (Figure 3). The P. lambertiana high-quality gene set contained 87 genes with Plater MITE within introns; however, the diversity of these sequences was higher (94–96% nucleotide similarity with the species consensus sequence). Plater MITE insertions were identified in the vicinity of 191 P. taeda genes and of 65 P. lambertiana genes (Figure 3A). Gene introns containing several Plater MITE insertions were analyzed. An unannotated P. taeda gene with a conserved phosphoglucosamine mutase family protein domain contained a maximum of seven Plater MITEs (Table 2).
GO categories common to both species included the regulation of gene expression, response to stress, and transmembrane transport. For example, genes carrying Plater MITE in introns share GO categories such as glycotransferase activity, where the P. lambertiana gene had 1.3-beta-D-glucan synthetase activity, but the P. taeda gene had xyloglycotransferase activity (File S5E). However, gene nucleotide sequence comparisons revealed no homologous genes between the evaluated P. taeda and P. lambertiana genes containing similar Plater insertions in genomic sequences. This, as well as the revealed species-specific structural differences, suggests that Plater MITE was found in a common ancestor, but expansion of this element occurred after the separation of species. A comparison of genes containing Plater MITE within introns with genes having identical MITE in their flanks did not reveal any common genes in either species, indicating that Plater was inserted into either introns or into the flanks of certain genes, but never in both sites of presumably transcriptionally active genes (Figure 3). Therefore, insertion of Plater MITE could not be explained only by random transposition into transcriptionally active chromatin.
Better-annotated P. taeda genes containing Plater MITE in introns or in flanks were compared (File S6B), revealing that genes containing Plater insertions in their flanks were involved in the regulation of developmental processes, such as regulation of cell division, pollination, negative regulation of macromolecule biosynthetic processes, nuclear division, and methylation. Genes containing Plater insertions in their introns were involved in innate immune response, positive regulation of defense responses (jasmonic acid-related responses), pigment metabolic processes, plastid organization, maturation of ribosomal proteins, potassium ion transmembrane transport, and proline biosynthetic processes (Figure 3A,B). Both networks contained GO terms related to ion homeostasis, glucan metabolic processes, proteolysis, regulation of gene expression, post-embryonic development, and oxidation–reduction processes (File S6B).
Plater MITE elements from P. lambertiana and P. taeda contain one TATABOX on the positive strand, 7–10 ARR1-binding elements, 2–4 CAAT boxes, 4–5 DOF TFBS, 3 GT-1 binding sites; these are all important regulative motifs found in the promoter regions of plant genes. The P. lambertiana Plater contained a 10-bp insertion (AGAGAAATTA) that disrupted a site (TTTGACC) identical to several WRKY TFBS, but gained a site identical to co-dependent regulatory elements responsible for pollen-specific activation (Figure 3 C). Differences in predicted TFBS presence in Plater could explain the depletion of this TE in the P. lambertiana 0–1 kb gene flanks and enhanced distribution in gene introns.
3.5. DNA Transposon Irbe Forms a Stress-Responsive Gene Network
An 820-bp TE-derived repeat, which further facilitated the identification of the DNA TE subsequently named Irbe, was initially found as moderately distributed within P. taeda v.1.01 gene introns, and many genes contained extended GO annotations belonging to defense responses (File S5A,B). One of the identified genes was Nonexpresser of Pathogenesis-related proteins-1 (NPR1), which is involved in plant systemic acquired resistance and the salicylic acid-mediated signaling pathway. NPR1 contained several TE-derived repeats in the second intron and all repeats were tested with additional searches, but only Irbe-related repeat was distributed and found in an additional 200 gene introns from the non-filtered P. taeda v.2.0 genes and formed a network of stress-responsive genes (Figure 4). In the entire P. taeda v.2.0 genome, only 251 copies of the Irbe DNA TE were found, indicating preferential distribution of this TE in genes. Other identified genes included a histone-binding PHD1 finger protein ALFIN-like 4 coding gene, a COPII-coated ER to Golgi transport vehicle SNARE-like 13 gene, eukaryotic translation initiation complex 2B, ribosome biogenesis protein RPF1, and other important genes (File S7A,B). Only a partial unmasked sequence of the repeat was present in the introns and therefore a full-length insertion was not confirmed for all genes.
A conserved domain search of the Irbe TE revealed transposase-like protein (pfam05699), hAT family C-terminal dimerization region (pfam05699), and BED zinc finger domain (pfam02892), indicating that this element belongs to the DNA TE class. The FindMiRNA tool (http://www.softberry.com/) predicted seven probable pre-microRNAs in the Irbe TE with free energies ranging from −53.75 to −45.82 kcal/mol. A search of MiRBase revealed homology to the mature microRNA sly-miR9472-3p from a drought-tolerant tomato line [89,90]. The P. lambertiana gene introns contained more hits to the newly isolated Irbe element; 143 genes contained hits longer than 1 kb with sequence identity >82%. Irbe consensus sequences from both species were compared, but no species-specific structural polymorphisms were identified, suggesting ancient transposition events and probable distribution in genes of other pine species. Gene transcripts from P. taeda and P. lambertiana containing the Irbe TE were compared and one homologous gene was identified with more than 95% sequence identity and 100% query coverage. This gene was annotated as 26S proteasome non-ATPase regulatory subunit 4. The Irbe DNA TE was not identified in the 0–1 kb gene flanks of both species.
3.6. Distribution of the Widespread IFG Gypsy RLX
The IFG RLX is a remarkable TE family, as it is highly distributed in conifer genomes and is far more ancient than other RLXs, but sequence homology is still maintained [67,68]. High-quality matches of IFG sequences to gene introns were considered in gene network analyses, resulting in 99 genes from the filtered P. taeda v.2.0 dataset and 317 genes from high quality (HQ) genes in P. lambertiana (File S7M,O). The following three homologous protein kinase genes with IFG insertions were identified: plastidial pyruvate kinase coding gene, PTI1-like tyrosine protein kinase gene, and putative receptor-like protein kinase gene. The P. lambertiana tyrosine protein kinase had an 85,239-bp second intron with one single IFG insertion (internal part with 3′ attached one matching LTR), and 7987 bp in total from intron II was masked. In the P. taeda v.2.0 tyrosine protein kinase gene, IFG was inserted into the first intron, which is 106,013 bp long, and only 1639 bp was masked. Both protein kinase genes shared an identical exon-intron structure and 97% cDNA similarity. While IFG LTRs were 82% similar, the IFG body was interrupted by sequence masking. A receptor-like protein kinase gene contained exon duplication events in both species, with both introns containing one full-length IFG insertion on the minus strand. These insertions were 87% similar in the IFG body and 79–83% similar in their LTRs. The P. taeda v.2.0 gene contained an additional IFG sequence with one attached LTR on the positive strand, two IFGs on the positive strand, and four nested LTRs with surrounding masked regions. The P. lambertiana receptor-like protein kinase gene contained one full-length IFG and one single LTR on the positive strand.
IFG insertions were also found in gene flanks (File S7N,P), but RLX frequency tended to increase with distance from genes in both genomes. The IFG LTR insertion was in close vicinity to 14 filtered P. taeda genes (0–1 kb) in the 5′ flanks. Genes encoding sugar transport protein 7 contained only the IFG body in the 5′ 0–1 kb flank; 12 genes’ 3′gene flanks contained IFG insertions (File S7N), but only two annotated genes contained IFG LTRs (abietadienol/abietadienal oxidase and protein DMR6-LIKE OXYGENASE 2-like). Similarly, in P. lambertiana, 18 genes contained IFG insertions in close vicinity to genes (File S7P). No genes were found that contained insertions of IFG in both the introns and flanking regions (5′and 3′ 0–2 kb) in the P. lambertiana or P. taeda v.2.0 genomes.
3.7. RLX Daugava Resides in Gene Introns and Flanks
A newly identified RLX Daugava was found frequently distributed within gene introns in the P. lambertiana and P. taeda genomes. The RLX isolated from a BAC clone was 6884 bp long with two large 1386 bp LTRs, with conventional TG and CA sites. The RLX internal region was weakly similar at the protein level to the Retrovirus-related Pol polyprotein from tobacco tnt1 (39% identity, 59% positives). The PPT (AAGAGGGAG) site was identical for elements from P. taeda and P. lambertiana. Some inserts in other locations probably have shorter LTRs, but due to multiple masked regions, it was not possible to extract more copies for the consensus structure. The P. lambertiana photosystem II stability/assembly factor HCF136-coding gene contained a Daugava RLX in the first intron in the positive orientation; the LTR was similar to an RLX from P. taeda with 34% query coverage and 82% sequence identity, and the RLX body was 89% similar with 62% coverage. However, some parts of this RLX were masked. The P. taeda Daugava LTR contained the following two AG-rich tracts: (AGNN)3(AG)3(NNAG)2 and (AGNN)2(AGN)4. The P. lambertiana Daugava LTR also contained polypurine-rich motifs 25 bp apart: AA(AGG)2A3(AGG)2GA3AGG and GAG(AGG)3AGA(AG)3. The P. taeda filtered gene set contained 80 strong hits to genes with Daugava RLX in the introns (File S7E). The P. lambertiana high-quality gene set contained 688 genes with similar hit parameters, 243 genes were not annotated, and 67 were uninformative. For the network analyses, we considered only >2 kb hits to Daugava RLX with strong hits to LTRs; 116 genes carrying such a combination of hits were found in P. lambertiana (File S7C). There were 19 P. lambertiana high-quality genes containing the Daugava-related insertion in their flanks (File S7D). Only the following two P. taeda genes contained Daugava repeats in 0–1 kb flanks: cytochrome P45078A7-like and secreted RxLR effector protein 161-like.
High TE diversity within gene introns was observed in both pine species, and the presence of intronic TE insertions could form gene networks with similar expression and response patterns. If each interspersed repeat introduced additional gene regulation signals in gene introns, then genes containing a single interspersed repeat might show specificity regarding their function or expression pattern. To test this assumption, genes that contained an insertion of the Daugava RLX family (and a lack of other TE insertions) were analyzed (File S8). Five of 19 P. lambertiana proteins were found to have homologs in the A. thaliana genome based on STRING software and were connected to mitotic spindle assembly checkpoint (co-expressed, found interacting and mentioned together in other publications).
The evaluated Daugava RLX network genes were further analyzed regarding combinations of all identified intronic TE insertions to determine if genes with specific TE combinations had similar functions. The presence of unique, short TE-derived repeats (95 loci) and unique >1 kb hits (22 loci) were used to form TE insertion patterns present in introns (File S7C,E). The presence of both Daugava RLX and Irbe DNA TE was found within introns of seven P. lambertiana genes (Pattern type I, File S7C). Products of these genes are involved in protein folding in ER (oxidation), positive regulation of RNA export from the nucleus, protein heterodimerization, and production of stress responsive protein. Several genes with the TE pattern type P (a combination of three RLX) are involved in pH regulation in Golgi, tethering of vesicles to Golgi membranes, nuclear protein import, and intracellular protein transport. TE pattern type Y (4 RLX) was found in the following two genes: insulinase (involved in protein targeting to mitochondrion) and histone deacetylase 15 (tag for epigenetic repression). One specific intron pattern (type C) was revealed for three P. lambertiana genes, which are involved in pre-mRNA maturation and splicing, and are co-expressed (score 0.168, according to the STRING database). While these analyses provide some initial clues about the formation of gene networks characterized by specific patterns of insertions of multiple TEs, further investigations are required using improved genomic sequences, gene annotations, and expression data for pine species.
The GC content was calculated for pine TEs (File S9). The TE-associated GC content for each gene involved in the Daugava RLX network was evaluated (File S7C,E). However, the GC content for full-length introns could be biased due to masked TE parts in the gene introns and flanks. Therefore, patterns of identified TEs were considered, and the GC content of each full-length TE was counted for each gene intron. The overall average GC content for introns was 39% for P. taeda and 41% for P. lambertiana, which were even lower if only short hits to LTRs were considered (27% and 36%, respectively). This could be explained by the lower GC content of LTRs of some RLXs distributed in the gene introns. The mean GC content of the gene transcripts (involved in the Daugava RLX network) was 44% for P. lambertiana and P. taeda, which was higher than any average estimate for introns and published estimates for whole BAC clones and whole genome sequences of gymnosperms (38%, [91,92]).
3.8. Genes Appearing in Many TE-Associated Networks
Genes with broad GO annotations were frequently found across many predicted TE networks, which could be related to the number of different TEs found within introns of both species. Therefore, genes containing multiple TEs in their introns were isolated and analyzed. In the P. taeda v.2.0 genome, 75 genes were identified containing more than eight different unique TE-derived repeats in their introns, with the two-pore potassium channel coding gene containing the maximum of 65 different repeats. According to the PLAZA Gymnosperm database, P. taeda contains 14 members of the two-pore potassium channel gene family, which contains 659 co-occurring terms, indicating the involvement of these gene products in many plant-cell processes [93]. Other repeat-rich genes identified in P. taeda v.2.0 were chloroplastic/amyloplastic 1,4-alpha-glucan-branching enzyme coding gene, GTP binding protein Der, S-formylglutathione hydrolase, cytochrome P450, B3 domain-containing transcription repressor VAL2, serine/threonine protein kinase GRIK1, ribosome production factor 1, jasmonic acid-amido synthetase JAR1, COP9 signalosome complex subunit, chaperone protein ClpB3, and others (File S10A).
In the P. lambertiana HQ gene set, 59 genes containing 18 to 34 different unique TE-derived repeats were analyzed. The gene that contained the maximum of 34 interspersed repeats in introns was not annotated, but could be characterized as having SpoT (COG0317i) and ubiquitin-like fold (cl28922) conserved domains. A search of the Uniprot database (The UniProt Consortium, 2019) with this gene identified an HD domain-containing protein with 63% identity and 75% positives (e-value 0.0) that is involved in guanosine tetraphosphate metabolic processes (GO:0015969) with 107 co-occurring terms. A gene containing the second largest number of TEs in P. lambertiana was also an unknown protein containing the AMN1 domain (cl2816) and F-box domain (pfam12937), annotated only with the parent term “protein binding”. Other genes with a high amount of TEs in P. lambertiana were DNA repair helicase XPD, mitochondrial substrate carrier family protein, translation initiation factor elF-2B, syntaxin-81, ADB-ribosylation factor, acyl-CoA dehydrogenase IBR3, and others (File S10B).
Interestingly, eight homologous genes were identified in both P. taeda and P. lambertiana (Table 3), from which the following two genes that share significant similarity based on their transcripts were found: plastidial pyruvate kinase 2 and phospholipid:diacylglycerol acyltransferase genes. Pyruvate kinase is involved in carbohydrate degradation and is associated with 26 GO terms. P. taeda and P. lambertiana introns contain seven common TE-derived repeats in pyruvate kinase homologous genes; O-acyltransferase activity (GO:0008374) contains 329 co-occurring terms, and 12 TEs were similar in gene homologs. SrmB conserved domains were present in ATP-dependent RNA helicases, but these gene transcripts were not identical. ATP-dependent helicase activity (GO:0003724) contained 929 co-occurring terms. A similar situation was found with proteins containing conserved domains of chromosome segregation protein SMC (cl37069) from nuclear pore complex protein NUP62, WD40 domain from protein WRAP73, RAE1 and actin-related proteins (found in a number of eukaryotic proteins that cover a wide variety of functions), alpha-tubulin suppressor (ATS1) domain-containing proteins (cl34932), and mitochondrial carrier protein domain (pfam14560, involved in localization, transmembrane transport, amide biosynthetic process and translation).
4. Discussion
Automated TE detection relies on several strategies, such as searches for sequences with homology to known elements, de novo evaluation of repeated elements, analysis of the presence of specific structural features, and combined techniques [94]. In the genome assembly process, repeated and highly similar sequences such as TEs are source of errors and gaps [95,96]. Other properties of plant genomes, such as multiple gene families, pseudogenes, and chromosomal and plastid genome duplications, further complicate the process of genome assembly and annotation [97,98]. Typically, gymnosperms are characterized by large genomes with proliferated TEs, high levels of heterozygosity, a constant chromosome number, and very rare polyploidy events [58,99]. Several conifer genomes have been sequenced using short-read assembly methods [60,62,66,100]; the P. taeda v.2.0 genome currently has the highest quality conifer genome regarding scaffold length. Version 2.0 was improved by merging small contigs; while the first version of the P. taeda genome contained 16.5 million contigs, the second version contains only 2.9 million [63]. However, the average PacBio read length used to reconstruct genome v.2.0 was 9665 bp with 12x coverage, which is shorter than many RLXs. The mean TE length in the PIER database is 6273 bp (median 5383 bp) but 3046 TEs are longer than 10 kb with the availability of better quality or longer-read genome assemblies, TE identification should be repeated de novo. Genome annotation of conifers is an ongoing process. Indeed, our study revealed errors in annotation files and datasets, where gene IDs of transcripts did not coincide with genomic sequences bearing identical gene IDs, and genes had noticeably varying intron lengths in different genome versions. Some additional errors involve automated annotation, nested repeat annotation, pools of identical reverse transcriptase domains defined as different genes, and intense masking of ambiguous regions, which are not discussed sufficiently in associated publications. Consequently, comparison of genomes assembled with different approaches and of varying quality should be performed with caution to avoid errors when interpreting the results. Additionally, widespread gene capture by TEs has often been described for large plant genomes [42,101,102,103] and this phenomenon could introduce additional errors in short-read genome assemblies [103]. Considering the high copy number and the structural and functional differences from protein-coding genes, it is advisable to annotate TE-associated sequences in separate data sets even though many TE families bear open reading frames. Despite the fact that many conifer TEs only show weak similarity to annotated TE domains, complexity was effectively reduced in the P. lambertiana high-quality gene set [64]. Evaluation of the only prevalent MITE element in the flanking regions of initial genome versions demonstrates the importance of read length in assembly and the association of TEs to particular genome locations.
Diverse conifer RLXs sharing high partial sequence similarities may not be classified in one family by full-length alignments used in bioinformatic studies, resulting in inflated family counts [66]. Due to the high diversity of conifer TE sequences and patchy distribution within short read assemblies, we found that identification of short repeated regions could overcome these problems and more efficiently identify prevalent TE families. The use of clustered TE-derived repeats extracted from automatically predicted nested regions allowed not only for the identification of RLXs but also internal regions of other TEs. The use of TE-derived repeats allowed simple statistical tests of distribution relative to distance from genes. RLXs are the most widely distributed TE class in plants and gymnosperm genomes [32,60,66,104]. LTRs contain important regulatory signals that can influence gene expression even if the body of the element is deleted [22,25,105]. The PIER v.2. database entries contain nested TEs that are derived from automated predictions, including repeated internal regions of different TEs. Chimeric TEs that could evolve from two RLXs by template switching [43] and display signals of independent transposition have been identified in other plant genomes, e.g., Veju [106] and BARE-2 [107]. TE structures with several LTRs are found in plant genomes, for example, 13 Cassandra elements in pear contain three LTRs [108]. Considering the large conifer genome sizes, such chimeric structures may also be found in conifer genomes. Therefore, each high-frequency repeat should be verified, and the true full-length structure and target site duplications should be identified. Unfortunately, the pine genomes contain many low-copy-number TEs, and if all copies are masked, full-length structures or transposition sites cannot be resolved. Additionally, similarity to known proteins and GO annotations are available for only approximately half of all pine genes, but species-specific genes could be more important in the adaptation of species. Therefore, the data evaluated and the results obtained from this study could be expanded with improvement of genome quality, annotation, or other associated information.
In the current study, we identified several TE families that unite many pine stress-responsive genes and contain potentially important gene regulatory signals. The Irbe DNA TE could provide microRNA target sites or produce microRNA, or both. However, further analysis is required to determine if these sequences represent microRNA precursors or, alternatively target sites [109]. This DNA TE insertion was found in the second intron of the P. taeda NPR1 gene, a key regulator of systemic acquired resistance [110], the PSMD4 gene coding for the 26S proteasome (involved in the ATP-dependent degradation of ubiquitinated proteins), ubiquitin thioesterase OTU1 (plays an important regulatory role at the level of protein turnover by preventing degradation), S-formylglutathione hydrolase (detoxifies formaldehyde), a PHD finger protein ALFIN-LIKE 4 (a histone-binding component that recognizes H3K4me3), and other important genes. Based on the presence of Irbe-related repeats, approximately 200 genes could be involved in this network in the P. taeda genome. In P. lambertiana, insertions of Irbe TE within 143 high-quality gene introns were found, many of which are important genes coding for transcription factors, chromatin modification enzymes, protein kinases, and receptors. The short Plater MITE family identified in proximal gene-flanking regions and introns could provide TATA boxes and several ARR1, DOF, W-box, GT, and MYB-binding sites, which are important signals in plant transcription activation and stress-response regulation [111,112,113]. Ten different ARR1 binding sites (seven on the positive and three on the negative strand) were present in the consensus sequence of the P. taeda Plater element. The transcription factor-type response regulator ARR1 directs transcriptional activation of the ARR6 gene, which responds to cytokinins without de novo protein synthesis [114]. Cytokinins are an important class of phytohormones that are involved in developmental processes and growth [115,116,117], as well as in defense responses [118]. The (AG)4A motif is one of the most common TFBS for plant promoters [119] that regulate light-responsive phototransduction processes in plants [120]. The LTR RLX Daugava identified in this study contains longer AG-rich tracts; this RLX family is distributed in pine gene introns and several flanks and might form an important responsive gene network. Genome-wide approaches in mammalian genomes demonstrate that TEs contribute to rewiring and selection of gene networks [121,122]. Approximately one-sixth of rice genes are associated with TEs [123]. Comparative analysis of three inbred maize lines revealed that the expression of 33% of stress-responsive genes could be attributed to regulation by TEs [124]. Various maize TEs contain approximately 25% of all DNase I hypersensitivity sites within the genome, which are associated with open chromatin and cis-acting elements and are therefore essential transcriptional regulators [125]. In contrast to mammals, plant genes more commonly contain longer introns, which are expressed at higher levels [126,127]. However, in recent studies, expression in different tissues or expression breadth has also been considered, and plant genes expressed across a wide range of tissues or conditions were found to have a higher intron density [128,129]. In P. taeda and P. lambertiana, extensive transcriptome data are not currently available; therefore, the role of TE insertions within introns in regulation of gene expression requires additional investigations. Using the Daugava RLX gene network identified in this study, the formation of specific patterns or intronic genotypes was tested. TE patterns could influence gene availability, responsiveness, stability, or higher order organization structures in the nucleus. Several revealed genes with unique Daugava RLX insertions are involved in the process of pre-mRNA maturation and splicing, while other genes with identical combinations of TE insertions are linked to protein metabolic processes and Golgi body homeostasis, which are related processes. Further investigation will enable more thorough analyses of relevance. The function of genes where multiple TEs were identified within introns (e.g., potassium channel coding genes and other receptors, protein kinases, cytochrome genes) suggests involvement in the maintenance of cell homeostasis under stress conditions. These genes were found to have many co-occurring GO terms, indicating that gene products are involved in many cellular processes and these genes may be expressed or retain stability under a broad range of conditions. We suggest that genes with many different types of TEs could act as node genes that are functional or stable across a range of conditions and could be important in early defense responses and rapid metabolome switching. This is also supported by the discovery of several homologous genes with large introns in both pine species. Cases of independent transpositions of different RLX families into homologous genes in varieties of differing origin resulting in similar phenotypes have been reported [22]. Additionally, the TE insertion patterns in the investigated pine introns were found to have a lower average GC content (39%) than nearby transcripts. The GC content of gene transcripts in the studied genes in P. taeda and P. lambertiana was comparable (44%) and higher than the reported genome average of 38% [91,92]. Similarly, a lower GC content in plant gene introns has been reported for other plant species [130,131], indicating that intron sequences may have a more relaxed DNA conformation and are more accessible to transcription and other regulatory factors [132,133].
It remains unclear if TE sequences have insertional preferences, but it has been reported that a relaxed chromatin configuration promotes TE insertions and leads to an increased mutation probability in tissue- and stage-specific genes [134,135]. In this aspect, TEs should be randomly distributed in different stress-responsive gene non-coding regions (flanks and introns). The non-autonomous Plater MITE element insertions were statistically significantly overrepresented in the proximity of pine genes (0–2 kb), a distance over which linkage equilibrium extends in conifers [136]. MITEs are preferentially located within gene regions of many plants and could influence gene expression [46,47,137,138,139]. There is evidence that some MITE insertions located close to gene promoters could also downregulate gene expression [140]. Plater was also frequently inserted in the introns of genes of the studied pine species. However, in this study, no genes with several Plater insertions in different non-coding regions (e.g., flanks and introns) were identified. This distribution suggests the formation of differentially regulated gene sub-networks, depending on the location of MITE insertions. For example, it was determined that many genes containing Plater in flanking regions are involved in the regulation of developmental processes and cell division, but genes having Plater in their introns are associated with immune responses and cell-wall biosynthesis, among other activities. Therefore, we could hypothesize about the mechanisms of action of gene-TE associated networks. If Plater cis-acting elements in the more accessible introns help to activate a specific network of stress-responsive genes, then non-coding RNA products of splicing from these genes could be involved in feedback loop mechanisms for blocking transcription of genes with flanking Plater insertions, near genes involved in developmental processes. In this example, identical TEs initiate transcription of defense genes under unfavorable conditions, while at the same time have a down-regulatory effect on developmental gene transcription, switching to an energy-saving mode. Similar strategies could be highly advantageous for the rapid activation of defense responses and switching of metabolic functions. However, it is only one explanation among the other possibilities and this could be a subject of further studies. Additionally, in the current study, Plater MITE insertions were found in both analyzed pine species, belonging to separate subgenera, suggesting similar distributions also in other pine species. Therefore, Plater could be a useful molecular marker for genotyping of pine species, as shown for MITEs in other plant species [48,141,142].
TE distribution is linked with speciation [143,144]. In pines, transposition activity accounts for the period following the divergence of the pine subgenera Strobus (P. lambertiana) and Pinus (P. taeda) and speciation [62,65,67,68,145]. Only a few homologous genes in both pine species were found with similar TE insertions, indicating that differences in TE family distribution between species are also found in more conservative gene regions. Insertion of the Irbe DNA TE in homologous genes of both species was found in PSMD4, a 26S proteasome non-ATPase regulatory subunit gene (40% query coverage, 98% sequence identity of transcripts). Insertion of the ancient LTR RLX IFG [67] was found in three homologous P. taeda and P. lambertiana gene pairs, surprisingly, all encoding different protein kinases. However, some of the IFG insertions were located in different introns of kinase genes and therefore could also represent independent transpositions. Analyzed IFG sequences contained masked regions and therefore the age of the insertions was not evaluated. Notably, insertions of other TEs were also frequently found in different receptor-like protein kinases and tyrosine protein kinases in our study. Protein kinase genes belong to one of the most proliferated gene superfamilies in plants, whose members are linked with a range of key metabolic and various plant-specific adaptation processes [146,147,148,149].
In conclusion, the source of TE sequences expressed in response to stress conditions could be the transcription of introns of many stress-responsive genes, which could explain the observed highly correlated expression levels of RLX families within individuals [70]. Transfer of information about TE insertions in gene regions to non-model pine species is complicated, as common TE families were revealed, but they are generally located in non-homologous genes. This highlights the need for additional studies and sequencing of species of interest to investigate TE-associated polymorphisms, such as in P. sylvestris, which is an important species in northern Europe. In the two analyzed pine species, TE insertions were more often found in gene introns but less commonly in gene-flanking regions, similar to other plant species [150,151,152,153]. Insertions of TEs in gene regions are associated with various epigenetic mechanisms, but it remains unknown how some actively transcribed plant genes cope with large introns [140]. Cultivation and plant breeding reduce genetic diversity and fitness to environmental stresses [154]. A recent whole-genome comparison of wild and cultivated rice species revealed depletion of intronic TE insertions in cultivated species [155]. Gymnosperms are outcrossing species that produce large quantities of pollen and seeds, generating a genetically diverse germplasm pool for subsequent natural selection of highly adaptable seedlings. Pine species are known for their strong adaptation to local growing conditions [156,157,158,159]. This study demonstrated the increased accumulation of TE sequences in stress-responsive gene introns, and suggested the rewiring of them into responsive networks interconnected with node genes containing multiple TEs. However, this hypothesis requires further investigations. Preferential TE insertion in open chromatin has been reported for tissue-specific genes [134], hence similar mechanisms followed by sustained natural selection could drive the accumulation of adaptive TEs in gene non-coding sequences of plants. The inclusion or exclusion of genes from TE-mediated networks is an efficient means of effecting dynamic changes in response to various environmental factors, including changing host–pathogen interactions and multifactorial processes in plants such as communication and signaling organization. Many such regulatory influences could lead to the adaptive environmental response clines that are characteristic of widely distributed pine populations [160,161,162,163].
Supplementary Materials
The following are available online at https://www.mdpi.com/2073-4425/11/10/1216/s1. File S1. Graphical overview of analysis workflow. File S2. Ratio of LTR count to the internal sequence count of annotated RLXs. File S3. Comparison of TE-derived repeat (>0.2 kb) distribution in PITA (P. taeda v.2.0, annotated filtered gene set) and PILA (P. lambertiana v.1.01, high quality gene set) gene introns. File S4. GO annotation of genes with significantly enriched TE-derived repeats in their vicinity. p = 0.001 was considered if t > 5.04 (df = 8); p = 0.05 if t > 2.31 (df = 8). File S5 A–T. Comparison of P. taeda and P. lambertiana gene networks formed by similar TE insertions in gene introns. File S6 A–E. Comparison of P. taeda and P. lambertiana gene networks formed by similar TE insertions in gene flanks. File S7 A–Z. P. taeda and P. lambertiana gene lists containing TEs of one family in gene flanks (0–1 kb) or gene introns. File S8. Genes containing only one repeat RLC-Daugava insertion in their introns. File S9. Nucleotide composition (GC content) of analyzed TEs and repeats. File S10 A–B. Repeat-rich node genes in P. taeda (A); Repeat-rich node genes in P. lambertiana (B).
Author Contributions
Conceptualization, A.V.; methodology, A.V. and P.I.; software, M.R.A.; validation, R.K.; formal analysis, A.V. and M.R.A.; investigation, A.V.; resources, P.I.; data curation, A.V.; writing—original draft preparation, A.V.; writing—review and editing, A.V., M.R.A., P.I., R.K. and D.R.; visualization, A.V.; supervision, D.R.; project administration, A.V.; funding acquisition, A.V. All authors have read and agreed to the published version of the manuscript.
Funding
This study was supported by the European Regional Development Fund Postdoctoral research aid 1.1.1.2/VIAA/1/16/094.
Conflicts of Interest
The authors declare no conflict of interest.
References
- Zhou, H.; Liu, Q.; Li, J.; Jiang, D.; Zhou, L.; Wu, P.; Lu, S.; Li, F.; Zhu, L.; Liu, Z.; et al. Photoperiod-and thermo-sensitive genic male sterility in rice are caused by a point mutation in a novel noncoding RNA that produces a small RNA. Cell Res. 2012, 22, 649–660. [Google Scholar] [CrossRef] [Green Version]
- Zhao, X.; Li, J.; Lian, B.; Gu, H.; Li, Y.; Qi, Y. Global identification of Arabidopsis lncRNAs reveals the regulation of MAF4 by a natural antisense RNA. Nat. Commun. 2018, 9, 5056. [Google Scholar] [CrossRef] [PubMed] [Green Version]
- Lee, H.; Zhang, Z.; Krause, H.M. Long Noncoding RNAs and Repetitive Elements: Junk or Intimate Evolutionary Partners? Trends Genet. 2019, 35, 892–902. [Google Scholar] [CrossRef] [PubMed] [Green Version]
- McClintock, B. The significance of responses of the genome to challenge. Science 1984, 226, 792–801. [Google Scholar] [CrossRef] [PubMed] [Green Version]
- Wessler, S.R. Plant retrotransposons: Turned on by stress. Curr. Biol. 1996, 6, 959–961. [Google Scholar] [CrossRef] [Green Version]
- Capy, P.; Gasperi, G.; Biémont, C.; Bazin, C. Stress and transposable elements: Co-evolution or useful parasites? Heredity (Edinb) 2000, 85, 101–106. [Google Scholar] [CrossRef] [PubMed]
- Kalendar, R.; Tanskanen, J.; Immonen, S.; Nevo, E.; Schulman, A.H. Genome evolution of wild barley (Hordeum spontaneum) by BARE-1 retrotransposon dynamics in response to sharp microclimatic divergence. Proc. Natl. Acad. Sci. USA 2000, 97, 6603–6607. [Google Scholar] [CrossRef] [Green Version]
- Kazazian, H.H. Mobile Elements: Drivers of Genome Evolution. Science 2004, 303, 1626–1632. [Google Scholar] [CrossRef] [Green Version]
- Wendel, J.F.; Greilhuber, J.; Doležel, J.; Leitch, I.J. Plant genome diversity volume 1: Plant genomes, their residents, and their evolutionary dynamics. In Plant Genome Divers Vol 1 Plant Genomes, Their Residents, and Their Evolutionary Dynamics; Springer: Berlin, Germany, 2012; pp. 1–279. [Google Scholar]
- Grandbastien, M.A. LTR retrotransposons, handy hitchhikers of plant regulation and stress response. Biochim. Biophys. Acta-Gene Regul. Mech. 2015, 1849, 403–416. [Google Scholar] [CrossRef]
- Baluska, F.; Gagliano, M.; Witzany, G. Memory and Learning in Plants; Springer: Cham, Germany, 2018. [Google Scholar] [CrossRef]
- Beguiristain, T.; Grandbastien, M.A.; Puigdomènech, P.; Casacuberta, J.M. Three Tnt1 subfamilies show different stress-associated patterns of expression in tobacco. Consequences for retrotransposon control and evolution in plants. Plant Physiol. 2001, 127, 212–221. [Google Scholar] [CrossRef] [Green Version]
- Slotkin, R.K.; Martienssen, R. Transposable elements and the epigenetic regulation of the genome. Nat. Rev. Genet. 2007, 8, 272–285. [Google Scholar] [CrossRef] [PubMed]
- Wang, Z.; Gerstein, M.; Snyder, M. RNA-Seq: A revolutionary tool for transcriptomics. Nat. Rev. Genet. 2009, 10, 57–63. [Google Scholar] [CrossRef]
- Hadjiargyrou, M.; Delihas, N. The intertwining of transposable elements and non-coding RNAs. Int. J. Mol. Sci. 2013, 14, 13307–13328. [Google Scholar] [CrossRef] [PubMed] [Green Version]
- Qin, S.; Jin, P.; Zhou, X.; Chen, L.; Ma, F. The Role of Transposable Elements in the Origin and Evolution of MicroRNAs in Human. PLoS ONE 2015, 10, e0131365. [Google Scholar] [CrossRef]
- Fray, R.G.; Grierson, D. Identification and genetic analysis of normal and mutant phytoene synthase genes of tomato by sequencing, complementation and co-suppression. Plant Mol. Biol. 1993, 22, 589–602. [Google Scholar] [CrossRef]
- Kashkush, K.; Feldman, M.; Levy, A.A. Transcriptional activation of retrotransposons alters the expression of adjacent genes in wheat. Nat. Genet. 2003, 33, 102–106. [Google Scholar] [CrossRef]
- Kobayashi, S.; Goto-Yamamoto, N.; Hirochika, H. Retrotransposon-Induced Mutations in Grape Skin Color. Science 2004, 304, 982. [Google Scholar] [CrossRef]
- Chu, C.-G.; Tan, C.T.; Yu, G.-T.; Zhong, S.; Xu, S.S.; Yan, L. A Novel Retrotransposon Inserted in the Dominant Vrn-B1 Allele Confers Spring Growth Habit in Tetraploid Wheat (Triticum turgidum L.). G3 (Bethesda) 2011, 1, 637–645. [Google Scholar] [CrossRef] [Green Version]
- Studer, A.; Zhao, Q.; Ross-Ibarra, J.; Doebley, J. Identification of a functional transposon insertion in the maize domestication gene tb1. Nat. Genet. 2011, 43, 1160–1163. [Google Scholar] [CrossRef] [PubMed] [Green Version]
- Butelli, E.; Licciardello, C.; Zhang, Y.; Liu, J.; Mackay, S.; Bailey, P.; Reforgiato-Recupero, G.; Martin, C. Retrotransposons Control Fruit-Specific, Cold-Dependent Accumulation of Anthocyanins in Blood Oranges. Plant Cell 2012, 24, 1242–1255. [Google Scholar] [CrossRef] [PubMed] [Green Version]
- Tsuchiya, T.; Eulgem, T. An alternative polyadenylation mechanism coopted to the Arabidopsis RPP7 gene through intronic retrotransposon domestication. Proc. Natl. Acad. Sci. USA 2013, 110, E3535–E3543. [Google Scholar] [CrossRef] [PubMed] [Green Version]
- Lai, Y.; Cuzick, A.; Lu, X.M.; Wang, J.; Katiyar, N.; Tsuchiya, T.; Le Roch, K.; McDowell, J.M.; Holub, E.; Eulgem, T. The Arabidopsis RRM domain protein EDM 3 mediates race-specific disease resistance by controlling H3K9me2-dependent alternative polyadenylation of RPP 7 immune receptor transcripts. Plant J. 2019, 97, 646–660. [Google Scholar] [CrossRef] [Green Version]
- Takeda, S.; Sugimoto, K.; Otsuki, H.; Hirochika, H. A 13-bp cis-regulatory element in the LTR promoter of the tobacco retrotransposon Tto1 is involved in responsiveness to tissue culture, wounding, methyl jasmonate and fungal elicitors. Plant J. 1999, 18, 383–393. [Google Scholar] [CrossRef] [PubMed]
- Varagona, M.J.; Purugganan, M.; Wessler, S.R. Alternative splicing induced by insertion of retrotransposons into the maize waxy gene. Plant Cell 1992, 4, 811–820. [Google Scholar]
- Feschotte, C. Transposable elements and the evolution of regulatory networks. Nat. Rev. Genet. 2008, 9, 397–405. [Google Scholar] [CrossRef] [PubMed] [Green Version]
- Xiao, H.; Jiang, N.; Schaffner, E.; Stockinger, E.J.; van der Knaap, E. A Retrotransposon-Mediated Gene Duplication Underlies Morphological Variation of Tomato Fruit. Science 2008, 319, 1527–1530. [Google Scholar] [CrossRef]
- Rebollo, R.; Romanish, M.T.; Mager, D.L. Transposable Elements: An Abundant and Natural Source of Regulatory Sequences for Host Genes. Annu. Rev. Genet. 2012, 46, 21–42. [Google Scholar] [CrossRef]
- Mita, P.; Boeke, J.D. How retrotransposons shape genome regulation. Curr. Opin. Genet. Dev. 2016, 37, 90–100. [Google Scholar] [CrossRef] [Green Version]
- Wicker, T.; Sabot, F.; Hua-Van, A.; Bennetzen, J.L.; Capy, P.; Chalhoub, B.; Flavell, A.; Leroy, P.; Morgante, M.; Panaud, O.; et al. A unified classification system for eukaryotic transposable elements. Nat. Rev. Genet. 2007, 8, 973–982. [Google Scholar] [CrossRef]
- Kumar, A.; Bennetzen, J.L. Plant Retrotransposons. Annu. Rev. Genet. 1999, 33, 479–532. [Google Scholar] [CrossRef] [Green Version]
- Gao, D.; Jimenez-Lopez, J.C.; Iwata, A.; Gill, N.; Jackson, S.A. Functional and Structural Divergence of an Unusual LTR Retrotransposon Family in Plants. PLoS ONE 2012, 7, 1–12. [Google Scholar] [CrossRef] [PubMed] [Green Version]
- Shirasu, K.; Schulman, A.H.; Lahaye, T.; Schulze-Lefert, P. A contiguous 66-kb barley DNA sequence provides evidence for reversible genome expansion. Genome Res. 2000, 10, 908–915. [Google Scholar] [CrossRef] [PubMed] [Green Version]
- Kalendar, R.; Vicient, C.M.; Peleg, O.; Anamthawat-Jonsson, K.; Bolshoy, A.; Schulman, A.H. Large Retrotransposon Derivatives: Abundant, Conserved but Nonautonomous Retroelements of Barley and Related Genomes. Genetics 2004, 166, 1437–1450. [Google Scholar] [CrossRef] [PubMed] [Green Version]
- Garcia-Martinez, J.; Martínez-Izquierdo, J.A. Study on the Evolution of the Grande Retrotransposon in the Zea Genus. Mol. Biol. Evol. 2003, 20, 831–841. [Google Scholar] [CrossRef] [PubMed] [Green Version]
- Macas, J.; Neumann, P. Ogre elements—A distinct group of plant Ty3/gypsy-like retrotransposons. Gene 2007, 390, 108–116. [Google Scholar] [CrossRef]
- Rho, M.; Choi, J.-H.H.; Kim, S.; Lynch, M.; Tang, H. De novo identification of LTR retrotransposons in eukaryotic genomes. BMC Genom. 2007, 8, 1–16. [Google Scholar] [CrossRef] [Green Version]
- You, F.M.; Cloutier, S.; Shan, Y.; Ragupathy, R. LTR Annotator: Automated Identification and Annotation of LTR Retrotransposons in Plant Genomes. Int. J. Biosci. Biochem. Bioinform. 2015, 5, 165–174. [Google Scholar] [CrossRef] [Green Version]
- Brierley, C.; Flavell, A.J. The retrotransposon Copia controls the relative levels of its gene products post-transcriptionally be differential expression from its two major mRNAs. Nucleic Acids Res. 1990, 18, 2947–2951. [Google Scholar] [CrossRef] [Green Version]
- Schulman AH (2013) Retrotransposon replication in plants. Curr. Opin. Virol. 1990, 3, 604–614.
- Kalendar, R.; Raskina, O.; Belyayev, A.; Schulman, A.H. Long tandem arrays of Cassandra retroelements and their role in genome dynamics in plants. Int. J. Mol. Sci. 2020, 21, 2931. [Google Scholar] [CrossRef]
- Sabot, F.; Schulman, A.H. Template switching can create complex LTR retrotransposon insertions in Triticeae genomes. BMC Genom. 2007, 8, 5–9. [Google Scholar] [CrossRef] [PubMed]
- Shang, Y.; Yang, F.; Schulman, A.H.; Zhu, J.; Jia, Y.; Wang, J.; Zhang, X.-Q.; Jia, Q.; Hua, W.; Yang, J.; et al. Gene Deletion in Barley Mediated by LTR-retrotransposon BARE. Sci. Rep. 2017, 7, 43766. [Google Scholar] [CrossRef] [Green Version]
- SanMiguel, P.; Tikhonov, A.; Jin, Y.-K.; Motchoulskaia, N.; Zakharov, D.; Melake-Berhan, A.; Springer, P.S.; Edwards, K.J.; Lee, M.; Avramova, Z.; et al. Nested Retrotransposons in the Intergenic Regions of the Maize Genome. Science 1996, 274, 765–768. [Google Scholar] [CrossRef] [Green Version]
- Bureau, T.E.; Wessler, S.R. Stowaway: A new family of inverted repeat elements associated with the genes of both monocotyledonous and dicotyledonous plants. Plant Cell 1994, 6, 907–916. [Google Scholar] [PubMed] [Green Version]
- Wessler, S.R.; Bureau, T.E.; White, S.E. LTR-retrotransposons and MITEs: Important players in the evolution of plant genomes. Curr. Opin. Genet. Dev. 1995, 5, 814–821. [Google Scholar] [CrossRef]
- Casa, A.M.; Brouwer, C.; Nagel, A.; Wang, L.; Zhang, Q.; Kresovich, S.; Wessler, S.R. The MITE family Heartbreaker (Hbr): Molecular markers in maize. Proc. Natl. Acad. Sci. USA 2000, 97, 10083–10089. [Google Scholar] [CrossRef] [PubMed] [Green Version]
- Purugganan, M.D.; Wessler, S.R. Transposon signatures: Species-specific molecular markers that utilize a class of multiple-copy nuclear DNA. Mol. Ecol. 1995, 4, 265–270. [Google Scholar] [CrossRef]
- Waugh, R.; McLean, K.; Flavell, A.J.; Pearce, S.R.; Kumar, A.; Thomas, B.B.T.; Powell, W. Genetic distribution of Bare-1-like retrotransposable elements in the barley genome revealed by sequence-specific amplification polymorphisms (S-SAP). Mol. Genet. Genom. 1997, 253, 687–694. [Google Scholar] [CrossRef]
- Flavell, A.J.; Knox, M.R.; Pearce, S.R.; Ellis, T.H.N. Retrotransposon-based insertion polymorphisms (RBIP) for high throughput marker analysis. Plant J. 1998, 16, 643–650. [Google Scholar] [CrossRef]
- Kentner, E.K.; Arnold, M.L.; Wessler, S.R. Characterization of high-copy-number retrotransposons from the large genomes of the Louisiana iris species and their use as molecular markers. Genetics 2003, 164, 685–697. [Google Scholar] [PubMed]
- Kalendar, R.; Schulman, A.H. IRAP and REMAP for retrotransposon-based genotyping and fingerprinting. Nat. Protoc. 2006, 1, 2478–2484. [Google Scholar] [CrossRef]
- Kalendar, R.; Flavell, A.J.; Ellis, T.H.N.; Sjakste, T.; Moisy, C.; Schulman, A.H. Analysis of plant diversity with retrotransposon-based molecular markers. Heredity (Edinb) 2011, 106, 520–530. [Google Scholar] [CrossRef] [Green Version]
- Kalendar, R.; Amenov, A.; Daniyarov, A. Use of retrotransposon-derived genetic markers to analyse genomic variability in plants. Funct. Plant Biol. 2019, 46, 15–29. [Google Scholar] [CrossRef] [PubMed]
- Monden, Y.; Tahara, M. Plant Transposable Elements and Their Application to Genetic Analysis via High-throughput Sequencing Platform. Hortic. J. 2015, 84, 283–294. [Google Scholar] [CrossRef] [Green Version]
- Venkatesh; Nandini, B. Miniature inverted-repeat transposable elements (MITEs), derived insertional polymorphism as a tool of marker systems for molecular plant breeding. Mol. Biol. Rep. 2020. [Google Scholar] [CrossRef] [PubMed]
- Morse, A.M.; Peterson, D.G.; Islam-Faridi, M.N.; Smith, K.E.; Magbanua, Z.; Garcia, S.A.; Kubisiak, T.L.; Amerson, H.V.; Carlson, J.E.; Nelson, C.D.; et al. Evolution of genome size and complexity in Pinus. PLoS ONE 2009, 4, 1–11. [Google Scholar] [CrossRef] [Green Version]
- Kovach, A.; Wegrzyn, J.L.; Parra, G.; Holt, C.; Bruening, G.E.; Loopstra, C.A.; Hartigan, J.; Yandell, M.; Langley, C.H.; Korf, I.; et al. The Pinus taeda genome is characterized by diverse and highly diverged repetitive sequences. BMC Genom. 2010, 11, 420. [Google Scholar] [CrossRef] [PubMed] [Green Version]
- Nystedt, B.; Street, N.R.; Wetterbom, A.; Zuccolo, A.; Lin, Y.-C.; Scofield, D.G.; Vezzi, F.; Delhomme, N.; Giacomello, S.; Alexeyenko, A.; et al. The Norway spruce genome sequence and conifer genome evolution. Nature 2013, 497, 579. [Google Scholar] [CrossRef] [Green Version]
- Zimin, A.; Stevens, K.A.; Crepeau, M.W.; Holtz-Morris, A.; Koriabine, M.; Marçais, G.; Puiu, D.; Roberts, M.; Wegrzyn, J.L.; De Jong, P.J.; et al. Sequencing and assembly of the 22-gb loblolly pine genome. Genetics 2014, 196, 875–890. [Google Scholar] [CrossRef] [Green Version]
- Stevens, K.A.; Wegrzyn, J.L.; Zimin, A.; Puiu, D.; Crepeau, M.; Cardeno, C.; Paul, R.; Gonzalez-Ibeas, D.; Koriabine, M.; Holtz-Morris, A.E.; et al. Sequence of the Sugar Pine Megagenome. Genetics 2016, 204, 1613–1626. [Google Scholar] [CrossRef]
- Zimin, A.V.; Stevens, K.A.; Crepeau, M.W.; Puiu, D.; Wegrzyn, J.L.; Yorke, J.A.; Langley, C.H.; Neale, D.B.; Salzberg, S.L. An improved assembly of the loblolly pine mega-genome using long-read single-molecule sequencing. Gigascience 2017, 6, 1–4. [Google Scholar]
- Crepeau, M.W.; Langley, C.H.; Stevens, K.A. From Pine Cones to Read Clouds: Rescaffolding the Megagenome of Sugar Pine (Pinus lambertiana). G3 2017, 7, 1563–1568. [Google Scholar] [CrossRef] [Green Version]
- Neale, D.B.; Wegrzyn, J.L.; Stevens, K.A.; Zimin, A.V.; Puiu, D.; Crepeau, M.W.; Cardeno, C.; Koriabine, M.; Holtz-Morris, A.E.; Liechty, J.D.; et al. Decoding the massive genome of loblolly pine using haploid DNA and novel assembly strategies. Genome Biol. 2014. [Google Scholar] [CrossRef] [Green Version]
- Wegrzyn, J.L.; Liechty, J.D.; Stevens, K.A.; Wu, L.-S.; Loopstra, C.A.; Vasquez-Gross, H.A.; Dougherty, W.M.; Lin, B.Y.; Zieve, J.J.; Martínez-García, P.J.; et al. Unique features of the loblolly pine (Pinus taeda L.) megagenome revealed through sequence annotation. Genetics 2014, 196, 891–909. [Google Scholar] [CrossRef] [Green Version]
- Kossack, D.S.; Kinlaw, C.S. IFG, a gypsy-like retrotransposon in Pinus (Pinaceae), has an extensive history in pines. Plant Mol. Biol. 1999, 39, 417–426. [Google Scholar] [CrossRef] [PubMed]
- Voronova, A.; Belevich, V.; Korica, A.; Rungis, D. Retrotransposon distribution and copy number variation in gymnosperm genomes. Tree Genet. Genom. 2017. [Google Scholar] [CrossRef]
- Voronova, A.; Belevich, V.; Jansons, A.; Rungis, D. Stress-induced transcriptional activation of retrotransposon-like sequences in the Scots pine (Pinus sylvestris L.) genome. Tree Genet Genom. 2014, 10, 937–951. [Google Scholar] [CrossRef]
- Voronova, A. Retrotransposon expression in response to in vitro inoculation with two fungal pathogens of Scots pine (Pinus sylvestris L.). BMC Res. Notes 2019, 12, 243. [Google Scholar] [CrossRef] [PubMed]
- Fu, L.; Niu, B.; Zhu, Z.; Wu, S.; Li, W. CD-HIT: Accelerated for clustering the next-generation sequencing data. Bioinformatics 2012, 28, 3150–3152. [Google Scholar] [CrossRef]
- Quinlan, A.R.; Hall, I.M. BEDTools: A flexible suite of utilities for comparing genomic features. Bioinformatics 2010, 26, 841–842. [Google Scholar] [CrossRef] [Green Version]
- Altschul, S.F.; Gish, W.; Miller, W.; Myers, E.W.; Lipman, D.J. Basic local alignment search tool. J. Mol. Biol. 1990, 215, 403–410. [Google Scholar] [CrossRef]
- Li, H.; Handsaker, B.; Wysoker, A.; Fennell, T.; Ruan, J.; Homer, N.; Marth, G.; Abecasis, G.; Durbin, R.; 1000 Genome Project Data Processing Subgroup. The Sequence Alignment/Map format and SAMtools. Bioinformatics 2009, 25, 2078–2079. [Google Scholar] [CrossRef] [PubMed] [Green Version]
- Neph, S.; Kuehn, M.S.; Reynolds, A.P.; Haugen, E.; Thurman, R.E.; Johnson, A.K.; Rynes, E.; Maurano, M.T.; Vierstra, J.; Thomas, S.; et al. BEDOPS: High-performance genomic feature operations. Bioinformatics 2012, 28, 1919–1920. [Google Scholar] [CrossRef] [PubMed] [Green Version]
- Betley, J.N.; Frith, M.C.; Graber, J.H.; Choo, S.; Deshler, J.O. A ubiquitous and conserved signal for RNA localization in chordates. Curr. Biol. 2002, 12, 1756–1761. [Google Scholar] [CrossRef] [Green Version]
- Bao, W.; Kojima, K.K.; Kohany, O. Repbase Update, a database of repetitive elements in eukaryotic genomes. Mob. DNA 2015, 6, 11. [Google Scholar] [CrossRef] [Green Version]
- Solovyev, V.V.; Shahmuradov, I.A.; Salamov, A.A. Identification of Promoter Regions and Regulatory Sites. Methods Mol. Biol. 2010, 674, 57–83. [Google Scholar]
- Higo, K.; Ugawa, Y.; Iwamoto, M.; Korenaga, T. Plant cis-acting regulatory DNA elements (PLACE) database: 1999. Nucleic Acids Res. 1999, 27, 297–300. [Google Scholar] [CrossRef] [Green Version]
- Kozomara, A.; Birgaoanu, M.; Griffiths-Jones, S. miRBase: From microRNA sequences to function. Nucleic Acids Res. 2019, 47, D155–D162. [Google Scholar] [CrossRef]
- Gruber, A.R.; Lorenz, R.; Bernhart, S.H.; Neuböck, R.; Hofacker, I.L. The Vienna RNA websuite. Nucleic Acids Res. 2008. [Google Scholar] [CrossRef] [Green Version]
- Van Bel, M.; Proost, S.; Wischnitzki, E.; Movahedi, S.; Scheerlinck, C.; Van de Peer, Y.; Vandepoele, K. Dissecting Plant Genomes with the PLAZA Comparative Genomics Platform. Plant Physiol. 2012, 158, 590–600. [Google Scholar] [CrossRef] [Green Version]
- Maere, S.; Heymans, K.; Kuiper, M. BiNGO: A Cytoscape plugin to assess overrepresentation of Gene Ontology categories in Biological Networks. Bioinformatics 2005, 21, 3448–3449. [Google Scholar] [CrossRef] [Green Version]
- Smoot, M.E.; Ono, K.; Ruscheinski, J.; Wang, P.-L.; Ideker, T. Cytoscape 2.8: New features for data integration and network visualization. Bioinformatics 2011, 27, 431–432. [Google Scholar] [CrossRef] [PubMed] [Green Version]
- Goenawan, I.H.; Bryan, K.; Lynn, D.J. DyNet: Visualization and analysis of dynamic molecular interaction networks. Bioinformatics 2016, 32, 2713–2715. [Google Scholar] [CrossRef] [PubMed] [Green Version]
- Peakall, R.; Smouse, P.E. GenAlEx 6.5: Genetic analysis in Excel. Population genetic software for teaching and research--an update. Bioinformatics 2012, 28, 2537–2539. [Google Scholar] [CrossRef] [PubMed] [Green Version]
- Szklarczyk, D.; Gable, A.L.; Lyon, D.; Junge, A.; Wyder, S.; Huerta-Cepas, J.; Simonovic, M.; Doncheva, N.T.; Morris, J.H.; Bork, P.; et al. STRING v11: Protein-protein association networks with increased coverage, supporting functional discovery in genome-wide experimental datasets. Nucleic Acids Res. 2019, 47, D607–D613. [Google Scholar] [CrossRef] [Green Version]
- Miguel, C.; Simões, M.; Oliveira, M.M.; Rocheta, M. Envelope-like retrotransposons in the plant kingdom: Evidence of their presence in gymnosperms (Pinus pinaster). J. Mol. Evol. 2008, 67, 517–525. [Google Scholar]
- Candar-Cakir, B.; Arican, E.; Zhang, B. Small RNA and degradome deep sequencing reveals drought-and tissue-specific microRNAs and their important roles in drought-sensitive and drought-tolerant tomato genotypes. Plant Biotechnol. J. 2016, 14, 1727–1746. [Google Scholar] [CrossRef] [Green Version]
- Liu, M.; Yu, H.; Zhao, G.; Huang, Q.; Lu, Y.; Ouyang, B. Profiling of drought-responsive microRNA and mRNA in tomato using high-throughput sequencing. BMC Genom. 2017, 18, 1–18. [Google Scholar] [CrossRef] [PubMed]
- Gonzalez-Ibeas, D.; Martinez-Garcia, P.J.; Famula, R.A.; Delfino-Mix, A.; Stevens, K.A.; Loopstra, C.A.; Langley, C.H.; Neale, D.B.; Wegrzyn, J.L. Assessing the Gene Content of the Megagenome: Sugar Pine (Pinus lambertiana). G3 2016, 6, 3787–3802. [Google Scholar] [CrossRef] [Green Version]
- Perera, D.; Magbanua, Z.V.; Thummasuwan, S.; Mukherjee, D.; ArickII, M.; Chouvarine, P.; Nairn, C.J.; Schmutz, J.; Jenkins, J.; Dean, J.F.D.; et al. Exploring the loblolly pine (Pinus taeda L.) genome by BAC sequencing and Cot analysis. Gene 2018, 663, 165–177. [Google Scholar] [CrossRef]
- Huntley, R.P.; Binns, D.; Dimmer, E.; Barrell, D.; O’Donovan, C.; Apweiler, R. QuickGO: A user tutorial for the web-based Gene Ontology browser. Database 2009, 2009, bap010. [Google Scholar] [CrossRef]
- Bergman, C.M.; Quesneville, H. Discovering and detecting transposable elements in genome sequences. Brief. Bioinform. 2007, 8, 382–392. [Google Scholar] [CrossRef] [PubMed] [Green Version]
- Treangen, T.J.; Salzberg, S.L. Repetitive DNA and next-generation sequencing: Computational challenges and solutions. Nat. Rev. Genet. 2011, 13, 36–46. [Google Scholar] [CrossRef]
- Tørresen, O.K.; Star, B.; Mier, P.; Andrade-Navarro, M.A.; Bateman, A.; Jarnot, P.; Gruca, A.; Grynberg, M.; Kajava, A.; Promponas, V.; et al. Tandem repeats lead to sequence assembly errors and impose multi-level challenges for genome and protein databases. Nucleic Acids Res. 2019. [Google Scholar] [CrossRef] [PubMed]
- Claros, M.G.; Bautista, R.; Guerrero-Fernández, D.; Benzerki, H.; Seoane, P.; Fernández-Pozo, N. Why assembling plant genome sequences is so challenging. Biology (Basel) 2012, 1, 439–459. [Google Scholar] [CrossRef] [Green Version]
- Goodwin, S.; McPherson, J.D.; McCombie, W.R. Coming of age: Ten years of next-generation sequencing technologies. Nat. Rev. Genet. 2016, 17, 333–351. [Google Scholar] [CrossRef]
- Pellicer, J.; Hidalgo, O.; Dodsworth, S.; Leitch, I.J. Genome Size Diversity and Its Impact on the Evolution of Land Plants. Genes (Basel) 2018, 9, 88. [Google Scholar] [CrossRef] [PubMed] [Green Version]
- Guan, R.; Zhao, Y.; Zhang, H.; Fan, G.; Liu, X.; Zhou, W.; Shi, C.; Wang, J.; Liu, W.; Liang, X.; et al. Draft genome of the living fossil Ginkgo biloba. Gigascience 2016, 5, 49. [Google Scholar] [CrossRef] [Green Version]
- Takahashi, S.; Inagaki, Y.; Satoh, H.; Hoshino, A.; Iida, S. Capture of a genomic HMG domain sequence by the En/Spm -related transposable element Tpn1 in the Japanese morning glory. Mol. Genet. Genom. 1999, 261, 447–451. [Google Scholar] [CrossRef]
- Zabala, G.; Vodkin, L.O. The wp mutation of Glycine max carries a gene-fragment-rich transposon of the CACTA superfamily. Plant Cell 2005, 17, 2619–2632. [Google Scholar] [CrossRef] [Green Version]
- Wei, F.; Stein, J.C.; Liang, C.; Zhang, J.; Fulton, R.S.; Baucom, R.S.; De Paoli, E.; Zhou, S.; Yang, L.; Han, Y.; et al. Detailed analysis of a contiguous 22-Mb region of the maize genome. PLoS Genet. 2009, 5, e1000728. [Google Scholar] [CrossRef] [Green Version]
- Galindo-González, L.; Mhiri, C.; Deyholos, M.K.; Grandbastien, M.A. LTR-retrotransposons in plants: Engines of evolution. Gene 2017, 626, 14–25. [Google Scholar] [CrossRef] [PubMed]
- Casacuberta, J.M.; Grandbastien, M.A. Characterisation of LTR sequences involved in the protoplast specific expression of the tobacco Tnt1 retrotransposon. Nucleic Acids Res. 1993, 21, 2087–2093. [Google Scholar] [CrossRef] [PubMed] [Green Version]
- Sabot, F.; Sourdille, P.; Bernard, M. Advent of a new retrotransposon structure: The long form of the Veju elements. Genetica 2005, 125, 325–332. [Google Scholar] [CrossRef] [PubMed]
- Vicient, C.M.; Kalendar, R.; Schulman, A.H. Variability, recombination, and mosaic evolution of the barley BARE-1 retrotransposon. J. Mol. Evol. 2005, 61, 275–291. [Google Scholar] [CrossRef] [Green Version]
- Yin, H.; Liu, J.; Xu, Y.; Liu, X.; Zhang, S.; Ma, J.; Du, J. TARE1, a Mutated Copia-Like LTR Retrotransposon Followed by Recent Massive Amplification in Tomato. PLoS ONE 2013. [Google Scholar] [CrossRef] [Green Version]
- Ambros, V.R.; Bartel, B.; Bartel, D.P.; Burge, C.B.; Carrington, J.C.; Chen, X.; Dreyfuss, G.; Eddy, S.R.; Griffiths-Jones, S.; Marshall, M.; et al. A uniform system for microRNA annotation. RNA 2003, 9, 277–279. [Google Scholar] [CrossRef] [Green Version]
- Maier, F.; Zwicker, S.; Hückelhoven, A.; Meissner, M.; Funk, J.; Pfitzner, A.J.P.; Pfitzner, U.M. Nonexpressor of Pathogenesis-Related Proteins1 (NPR1) and some NPR1-related proteins are sensitive to salicylic acid. Mol. Plant Pathol. 2011, 12, 73–91. [Google Scholar] [CrossRef]
- Yanagisawa, S. Dof Domain Proteins: Plant-Specific Transcription Factors Associated with Diverse Phenomena Unique to Plants. Plant Cell Physiol. 2004, 45, 386–391. [Google Scholar] [CrossRef] [Green Version]
- Eulgem, T.; Somssich, I.E. Networks of WRKY transcription factors in defense signaling. Curr. Opin. Plant Biol. 2007, 10, 366–371. [Google Scholar] [CrossRef] [Green Version]
- Taniguchi, M.; Sasaki, N.; Tsuge, T.; Aoyama, T.; Oka, A. ARR1 Directly Activates Cytokinin Response Genes that Encode Proteins with Diverse Regulatory Functions. Plant Cell Physiol. 2007, 48, 263–277. [Google Scholar] [CrossRef] [PubMed]
- Sakai, H.; Honma, T.; Takashi, A.; Sato, S.; Kato, T.; Tabata, S.; Oka, A. ARR1, a transcription factor for genes immediately responsive to cytokinins. Science 2001, 294, 1519–1521. [Google Scholar] [CrossRef] [PubMed] [Green Version]
- Mok, M.C.; Martin, R.C.; Mok, D.W.S. Cytokinins: Biosynthesis, metabolism and perception. Vitr. Cell. Dev. Biol.-Plant 2000, 36, 102–107. [Google Scholar] [CrossRef]
- Hwang, I.; Sheen, J.; Müller, B. Cytokinin Signaling Networks. Annu. Rev. Plant Biol. 2012, 63, 353–380. [Google Scholar] [CrossRef] [PubMed] [Green Version]
- Mok, M.C. Cytokinin and Plant Development—An Overview. In Cytokinins Chemistry, Activity, and Function; Mok, D.W.S., Mok, M.C., Eds.; CRC Press: Ann Arbor, MI, USA, 1994; pp. 155–166. [Google Scholar]
- Argueso, C.T.; Ferreira, F.J.; Epple, P.; To, J.P.C.; Hutchison, C.E.; Schaller, G.E.; Dangl, J.L.; Kieber, J.J. Two-component elements mediate interactions between cytokinin and salicylic acid in plant immunity. PLoS Genet. 2012. [Google Scholar] [CrossRef] [Green Version]
- Liu, Y.; Yin, J.; Xiao, M.; Mason, A.S.; Gao, C.; Liu, H.; Li, J.; Fu, D. Characterization of Structure, Divergence and Regulation Patterns of Plant Promoters. J. Mol. Biol. Res. 2013, 3, 23–36. [Google Scholar] [CrossRef] [Green Version]
- Parida, S.K.; Dalal, V.; Singh, A.K.; Singh, N.K.; Mohapatra, T. Genic non-coding microsatellites in the rice genome: Characterization, marker design and use in assessing genetic and evolutionary relationships among domesticated groups. BMC Genom. 2009, 10, 140. [Google Scholar] [CrossRef] [PubMed] [Green Version]
- Feschotte, C.; Jiang, N.; Wessler, S.R. Plant transposable elements: Where genetics meets genomics. Nat. Rev. Genet. 2002, 3, 329–341. [Google Scholar] [CrossRef] [PubMed]
- Sundaram, V.; Cheng, Y.; Ma, Z.; Li, D.; Xing, X.; Edge, P.; Snyder, M.P.; Wang, T. Widespread contribution of transposable elements to the innovation of gene regulatory networks. Genome Res. 2014, 24, 1963–1976. [Google Scholar] [CrossRef] [PubMed] [Green Version]
- Krom, N.; Recla, J.; Ramakrishna, W. Analysis of genes associated with retrotransposons in the rice genome. Genetica 2008, 134, 297–310. [Google Scholar] [CrossRef]
- Makarevitch, I.; Waters, A.J.; West, P.T.; Stitzer, M.; Hirsch, C.N.; Ross-Ibarra, J.; Springer, N.M. Transposable Elements Contribute to Activation of Maize Genes in Response to Abiotic Stress. PLoS Genet. 2015. [Google Scholar] [CrossRef] [Green Version]
- Zhao, H.; Zhang, W.; Chen, L.; Wang, L.; Marand, A.P.; Wu, Y.; Jiang, J. Proliferation of regulatory DNA elements derived from transposable elements in the maize genome. Plant Physiol. 2018, 176, 2789–2803. [Google Scholar] [CrossRef] [Green Version]
- Ren, X.Y.; Vorst, O.; Fiers, M.W.E.J.; Stiekema, W.J.; Nap, J.P. In plants, highly expressed genes are the least compact. Trends Genet. 2006, 22, 528–532. [Google Scholar] [CrossRef] [PubMed]
- Colinas, J.; Schmidler, S.C.; Bohrer, G.; Iordanov, B.; Benfey, P.N. Intergenic and genic sequence lengths have opposite relationships with respect to gene expression. PLoS ONE 2008. [Google Scholar] [CrossRef] [PubMed]
- Camiolo, S.; Rau, D.; Porceddu, A. Mutational biases and selective forces shaping the structure of Arabidopsis genes. PLoS ONE 2009. [Google Scholar] [CrossRef] [Green Version]
- Das, S.; Bansal, M. Variation of gene expression in plants is influenced by gene architecture and structural properties of promoters. PLoS ONE 2019. [Google Scholar] [CrossRef]
- Mizuno, M.; Kanehisa, M. Distribution profiles of GC content around the translation initiation site in different species. FEBS Lett. 1994, 352, 7–10. [Google Scholar] [CrossRef] [Green Version]
- Singh, R.; Ming, R.; Yu, Q. Comparative Analysis of GC Content Variations in Plant Genomes. Trop. Plant Biol. 2016, 9, 136–149. [Google Scholar] [CrossRef]
- Schwartz, S.; Meshorer, E.; Ast, G. Chromatin organization marks exon-intron structure. Nat. Struct. Mol. Biol. 2009, 16, 990–995. [Google Scholar] [CrossRef] [PubMed]
- Gelfman, S.; Ast, G. When epigenetics meets alternative splicing: The roles of DNA methylation and GC architecture. Epigenomics 2013, 5, 351–353. [Google Scholar] [CrossRef] [Green Version]
- Muotri, A.R.; Chu, V.T.; Marchetto, M.C.N.; Deng, W.; Moran, J.V.; Gage, F.H. Somatic mosaicism in neuronal precursor cells mediated by L1 retrotransposition. Nature 2005, 435, 903–910. [Google Scholar] [CrossRef] [Green Version]
- Singer, T.; McConnell, M.J.; Marchetto, M.C.N.; Coufal, N.G.; Gage, F.H. LINE-1 retrotransposons: Mediators of somatic variation in neuronal genomes? Trends Neurosci. 2010, 33, 345–354. [Google Scholar] [CrossRef] [PubMed] [Green Version]
- Brown, G.R.; Gill, G.P.; Kuntz, R.J.; Langley, C.H.; Neale, D.B. Nucleotide diversity and linkage disequilibrium in loblolly pine. Proc. Natl. Acad. Sci. USA 2004, 101, 15255–15260. [Google Scholar] [CrossRef] [Green Version]
- Casacuberta, J.M.; Santiago, N. Plant LTR-retrotransposons and MITEs: Control of transposition and impact on the evolution of plant genes and genomes. Gene 2003, 311, 1–11. [Google Scholar] [CrossRef]
- Liu, B.; Shan, X.H.; Liu, Z.L.; Dong, Z.Y.; Wang, Y.M.; Chen, Y.; Lin, X.Y.; Long, L.K.; Han, F.P.; Dong, Y.S. Mobilization of the active MITE transposons mPing and Pong in rice by introgression from wild rice (Zizania latifolia Griseb.). Mol. Biol. Evol. 2005, 22, 976–990. [Google Scholar]
- Lu, C.; Chen, J.; Zhang, Y.; Hu, Q.; Su, W.; Kuang, H. Miniature Inverted-Repeat Transposable Elements (MITEs) Have Been Accumulated through Amplification Bursts and Play Important Roles in Gene Expression and Species Diversity in Oryza sativa. Mol. Biol. Evol. 2012, 29, 1005–1017. [Google Scholar] [CrossRef] [Green Version]
- To, T.K.; Saze, H.; Kakutani, T. DNA Methylation within Transcribed Regions. Plant Physiol. 2015, 168, 1219–1225. [Google Scholar] [CrossRef] [PubMed] [Green Version]
- Singh, S.; Nandha, P.S.; Singh, J. Transposon-based genetic diversity assessment in wild and cultivated barley. Crop. J. 2017, 5, 296–304. [Google Scholar] [CrossRef]
- Stelmach, K.; Macko-Podgórni, A.; Machaj, G.; Grzebelus, D. Miniature Inverted Repeat Transposable Element Insertions Provide a Source of Intron Length Polymorphism Markers in the Carrot (Daucus carota L.). Front. Plant Sci. 2017, 8, 725. [Google Scholar] [CrossRef] [PubMed] [Green Version]
- Jurka, J.; Bao, W.; Kojima, K.K. Families of transposable elements, population structure and the origin of species. Biol. Direct 2011, 6, 44. [Google Scholar] [CrossRef] [PubMed] [Green Version]
- Serrato-Capuchina, A.; Matute, D.R. The Role of Transposable Elements in Speciation. Genes (Basel) 2018, 9, 254. [Google Scholar] [CrossRef] [Green Version]
- Friesen, N.; Brandes, A.; Heslop-Harrison, J.S. Diversity, origin, and distribution of retrotransposons (gypsy and copia) in conifers. Mol. Biol. Evol. 2001, 18, 1176–1188. [Google Scholar] [CrossRef]
- Stone, J.M.; Walker, J.C. Plant protein kinase families and signal transduction. Plant Physiol. 1995, 108, 451–457. [Google Scholar] [CrossRef] [PubMed] [Green Version]
- Lehti-Shiu, M.D.; Zou, C.; Hanada, K.; Shiu, S.-H. Evolutionary history and stress regulation of plant receptor-like kinase/pelle genes. Plant Physiol. 2009, 150, 12–26. [Google Scholar] [CrossRef] [PubMed] [Green Version]
- Lehti-Shiu, M.D.; Shiu, S.-H. Diversity, classification and function of the plant protein kinase superfamily. Philos. Trans. R. Soc. Lond. B Biol. Sci. 2012, 367, 2619–2639. [Google Scholar] [CrossRef] [Green Version]
- White-Gloria, C.; Johnson, J.J.; Marritt, K.; Kataya, A.; Vahab, A.; Moorhead, G.B. Protein Kinases and Phosphatases of the Plastid and Their Potential Role in Starch Metabolism. Front. Plant Sci. 2018, 9, 1032. [Google Scholar] [CrossRef]
- West, P.T.; Li, Q.; Ji, L.; Eichten, S.R.; Song, J.; Vaughn, M.W.; Schmitz, R.J.; Springer, N.M. Genomic Distribution of H3K9me2 and DNA Methylation in a Maize Genome. PLoS ONE 2014, 9, e105267. [Google Scholar] [CrossRef] [PubMed]
- Le, T.N.; Miyazaki, Y.; Takuno, S.; Saze, H. Epigenetic regulation of intragenic transposable elements impacts gene transcription in Arabidopsis thaliana. Nucleic Acids Res. 2015, 43, 3911–3921. [Google Scholar] [CrossRef] [PubMed] [Green Version]
- Li, S.F.; Su, T.; Cheng, G.Q.; Wang, B.X.; Li, X.; Deng, C.L.; Gao, W.J. Chromosome evolution in connection with repetitive sequences and epigenetics in plants. Genes (Basel) 2017, 8, 290. [Google Scholar] [CrossRef] [PubMed] [Green Version]
- Ma, B.; Xin, Y.; Kuang, L.; He, N. Distribution and Characteristics of Transposable Elements in the Mulberry Genome. Plant Genome 2019, 12, 180094. [Google Scholar] [CrossRef] [Green Version]
- Roger, F.; Godhe, A.; Gamfeldt, L. Genetic Diversity and Ecosystem Functioning in the Face of Multiple Stressors. PLoS ONE 2012. [Google Scholar] [CrossRef]
- Li, X.; Guo, K.; Zhu, X.; Chen, P.; Li, Y.; Xie, G.; Wang, L.; Wang, Y.; Persson, S.; Peng, L. Domestication of rice has reduced the occurrence of transposable elements within gene coding regions. BMC Genom. 2017, 18, 55. [Google Scholar] [CrossRef] [PubMed] [Green Version]
- Savolainen, O.; Pyhäjärvi, T.; Knürr, T. Gene Flow and Local Adaptation in Trees. Annu. Rev. Ecol. Evol. Syst. 2007, 38, 595–619. [Google Scholar] [CrossRef]
- Eriksson, G. Pinus Sylvestris Recent Genetic Research; Swedish University of Agricultural Science: Uppsala, Sweden, 2008. [Google Scholar]
- Neale, D.B.; Ingvarsson, P.K. Population, quantitative and comparative genomics of adaptation in forest trees. Curr. Opin. Plant Biol. 2008, 11, 149–155. [Google Scholar] [CrossRef] [PubMed]
- Prunier, J.; Verta, J.-P.; MacKay, J.J. Conifer genomics and adaptation: At the crossroads of genetic diversity and genome function. New Phytol. 2016, 209, 44–62. [Google Scholar] [CrossRef] [PubMed] [Green Version]
- Eckert, A.J.; van Heerwaarden, J.; Wegrzyn, J.L.; Nelson, C.D.; Ross-Ibarra, J.; González-Martínez, S.C.; Neale, D.B. Patterns of Population Structure and Environmental Associations to Aridity Across the Range of Loblolly Pine (Pinus taeda L., Pinaceae). Genetics 2010, 185, 969–982. [Google Scholar] [CrossRef] [Green Version]
- Cumbie, W.P.; Eckert, A.; Wegrzyn, J.; Whetten, R.; Neale, D.; Goldfarb, B. Association genetics of carbon isotope discrimination, height and foliar nitrogen in a natural population of Pinus taeda L. Heredity (Edinb) 2011, 107, 105–114. [Google Scholar] [CrossRef] [Green Version]
- Chhatre, V.E.; Byram, T.D.; Neale, D.B.; Wegrzyn, J.L.; Krutovsky, K.V. Genetic structure and association mapping of adaptive and selective traits in the east Texas loblolly pine (Pinus taeda L.) breeding populations. Tree Genet. Genomes 2013, 9, 1161–1178. [Google Scholar] [CrossRef]
- Lu, M.; Krutovsky, K.V.; Nelson, C.D.; Koralewski, T.E.; Byram, T.D.; Loopstra, C.A. Exome genotyping, linkage disequilibrium and population structure in loblolly pine (Pinus taeda L.). BMC Genom. 2016, 17, 730. [Google Scholar] [CrossRef] [Green Version]
Figure 1.
Comparison of TE distribution in gene non-coding regions of high-quality genes of the P. lambertiana genome v.1.01 (PILA) and filtered annotated gene set of P. taeda v.2.0 (PITA).
Figure 1.
Comparison of TE distribution in gene non-coding regions of high-quality genes of the P. lambertiana genome v.1.01 (PILA) and filtered annotated gene set of P. taeda v.2.0 (PITA).

Figure 2.
Distribution of >1 kb hits to TEs in gene introns of filtered P. taeda (PITA) genes and high-quality P. lambertiana (PILA) genes.
Figure 2.
Distribution of >1 kb hits to TEs in gene introns of filtered P. taeda (PITA) genes and high-quality P. lambertiana (PILA) genes.

Figure 3.
(A) Distribution of Plater MITE insertions across P. taeda (PITA) and P. lambertiana (PILA) gene-flanking regions. (B) Distribution of Plater MITE insertions across P. taeda (PITA) and P. lambertiana (PILA) gene introns. World cloud generated from biological process GO terms of P. taeda genes involved in the networks using the online tool https://wordart.com/. (C) Alignment of P. taeda (PITA) and P. lambertiana (PILA) consensus sequences with predicted plant cis-acting regulatory elements.

Figure 4.
Gene network formed by Irbe DNA TE presence in the gene introns of P. taeda v.2.0.


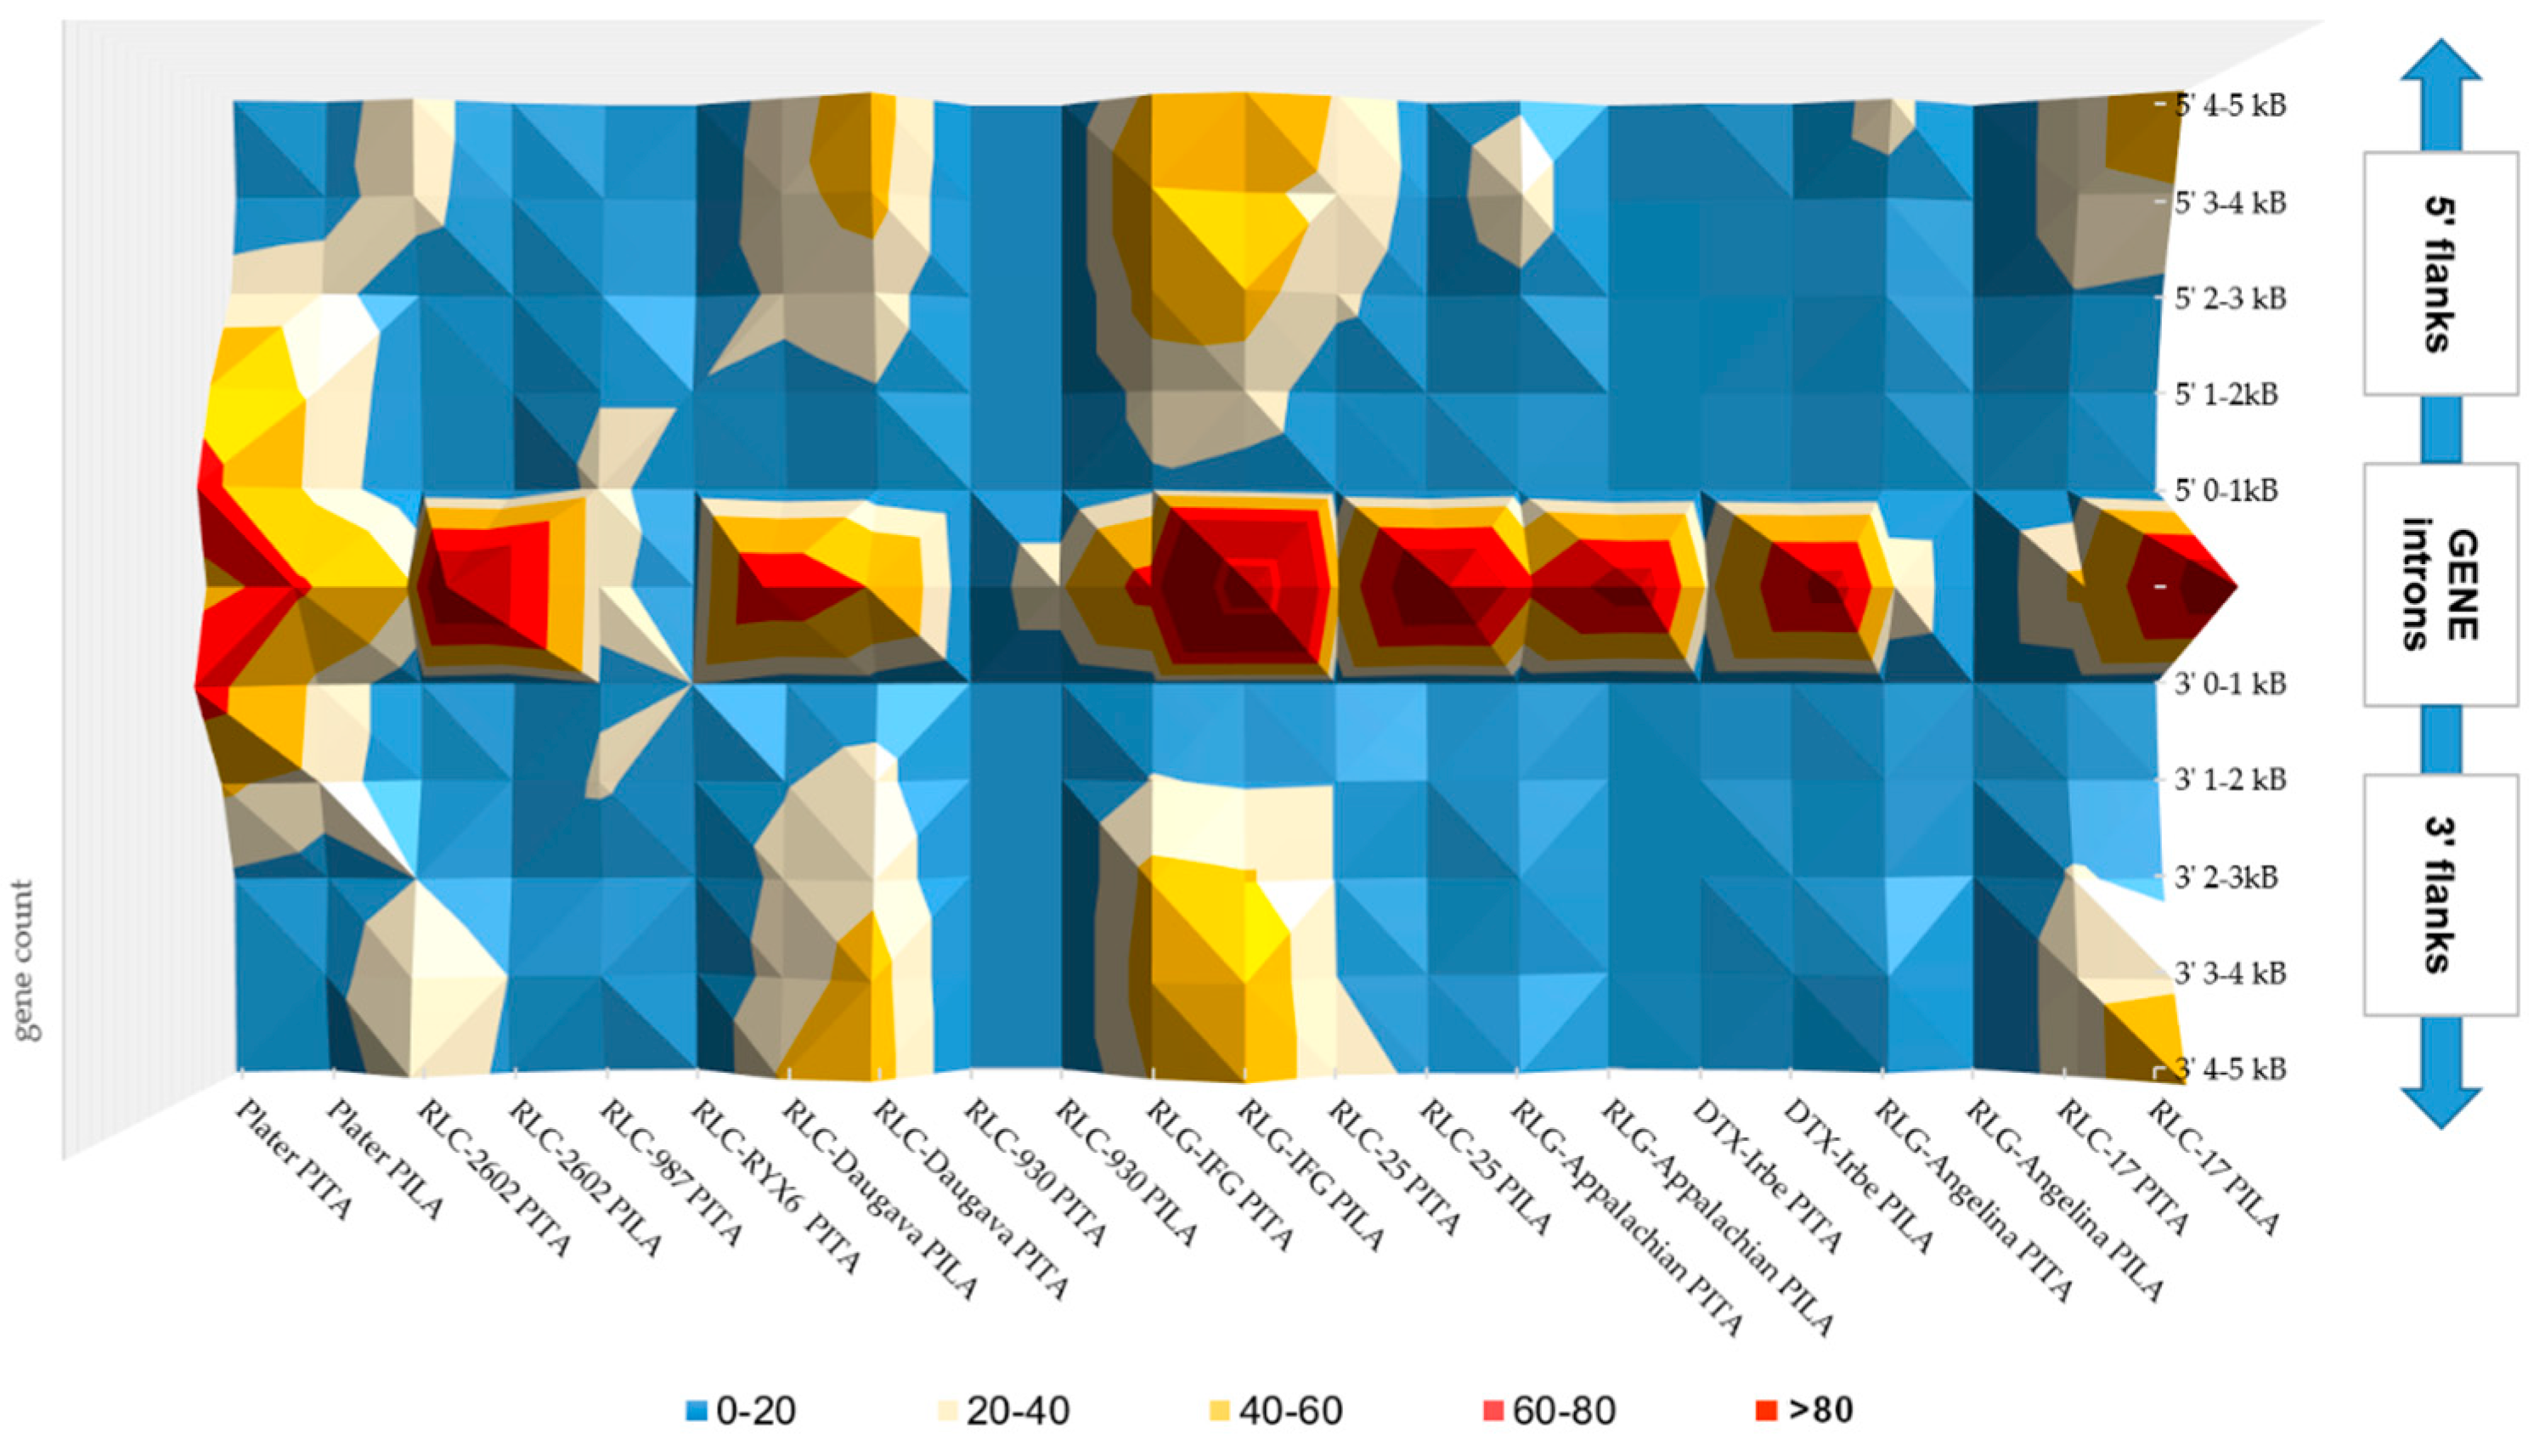
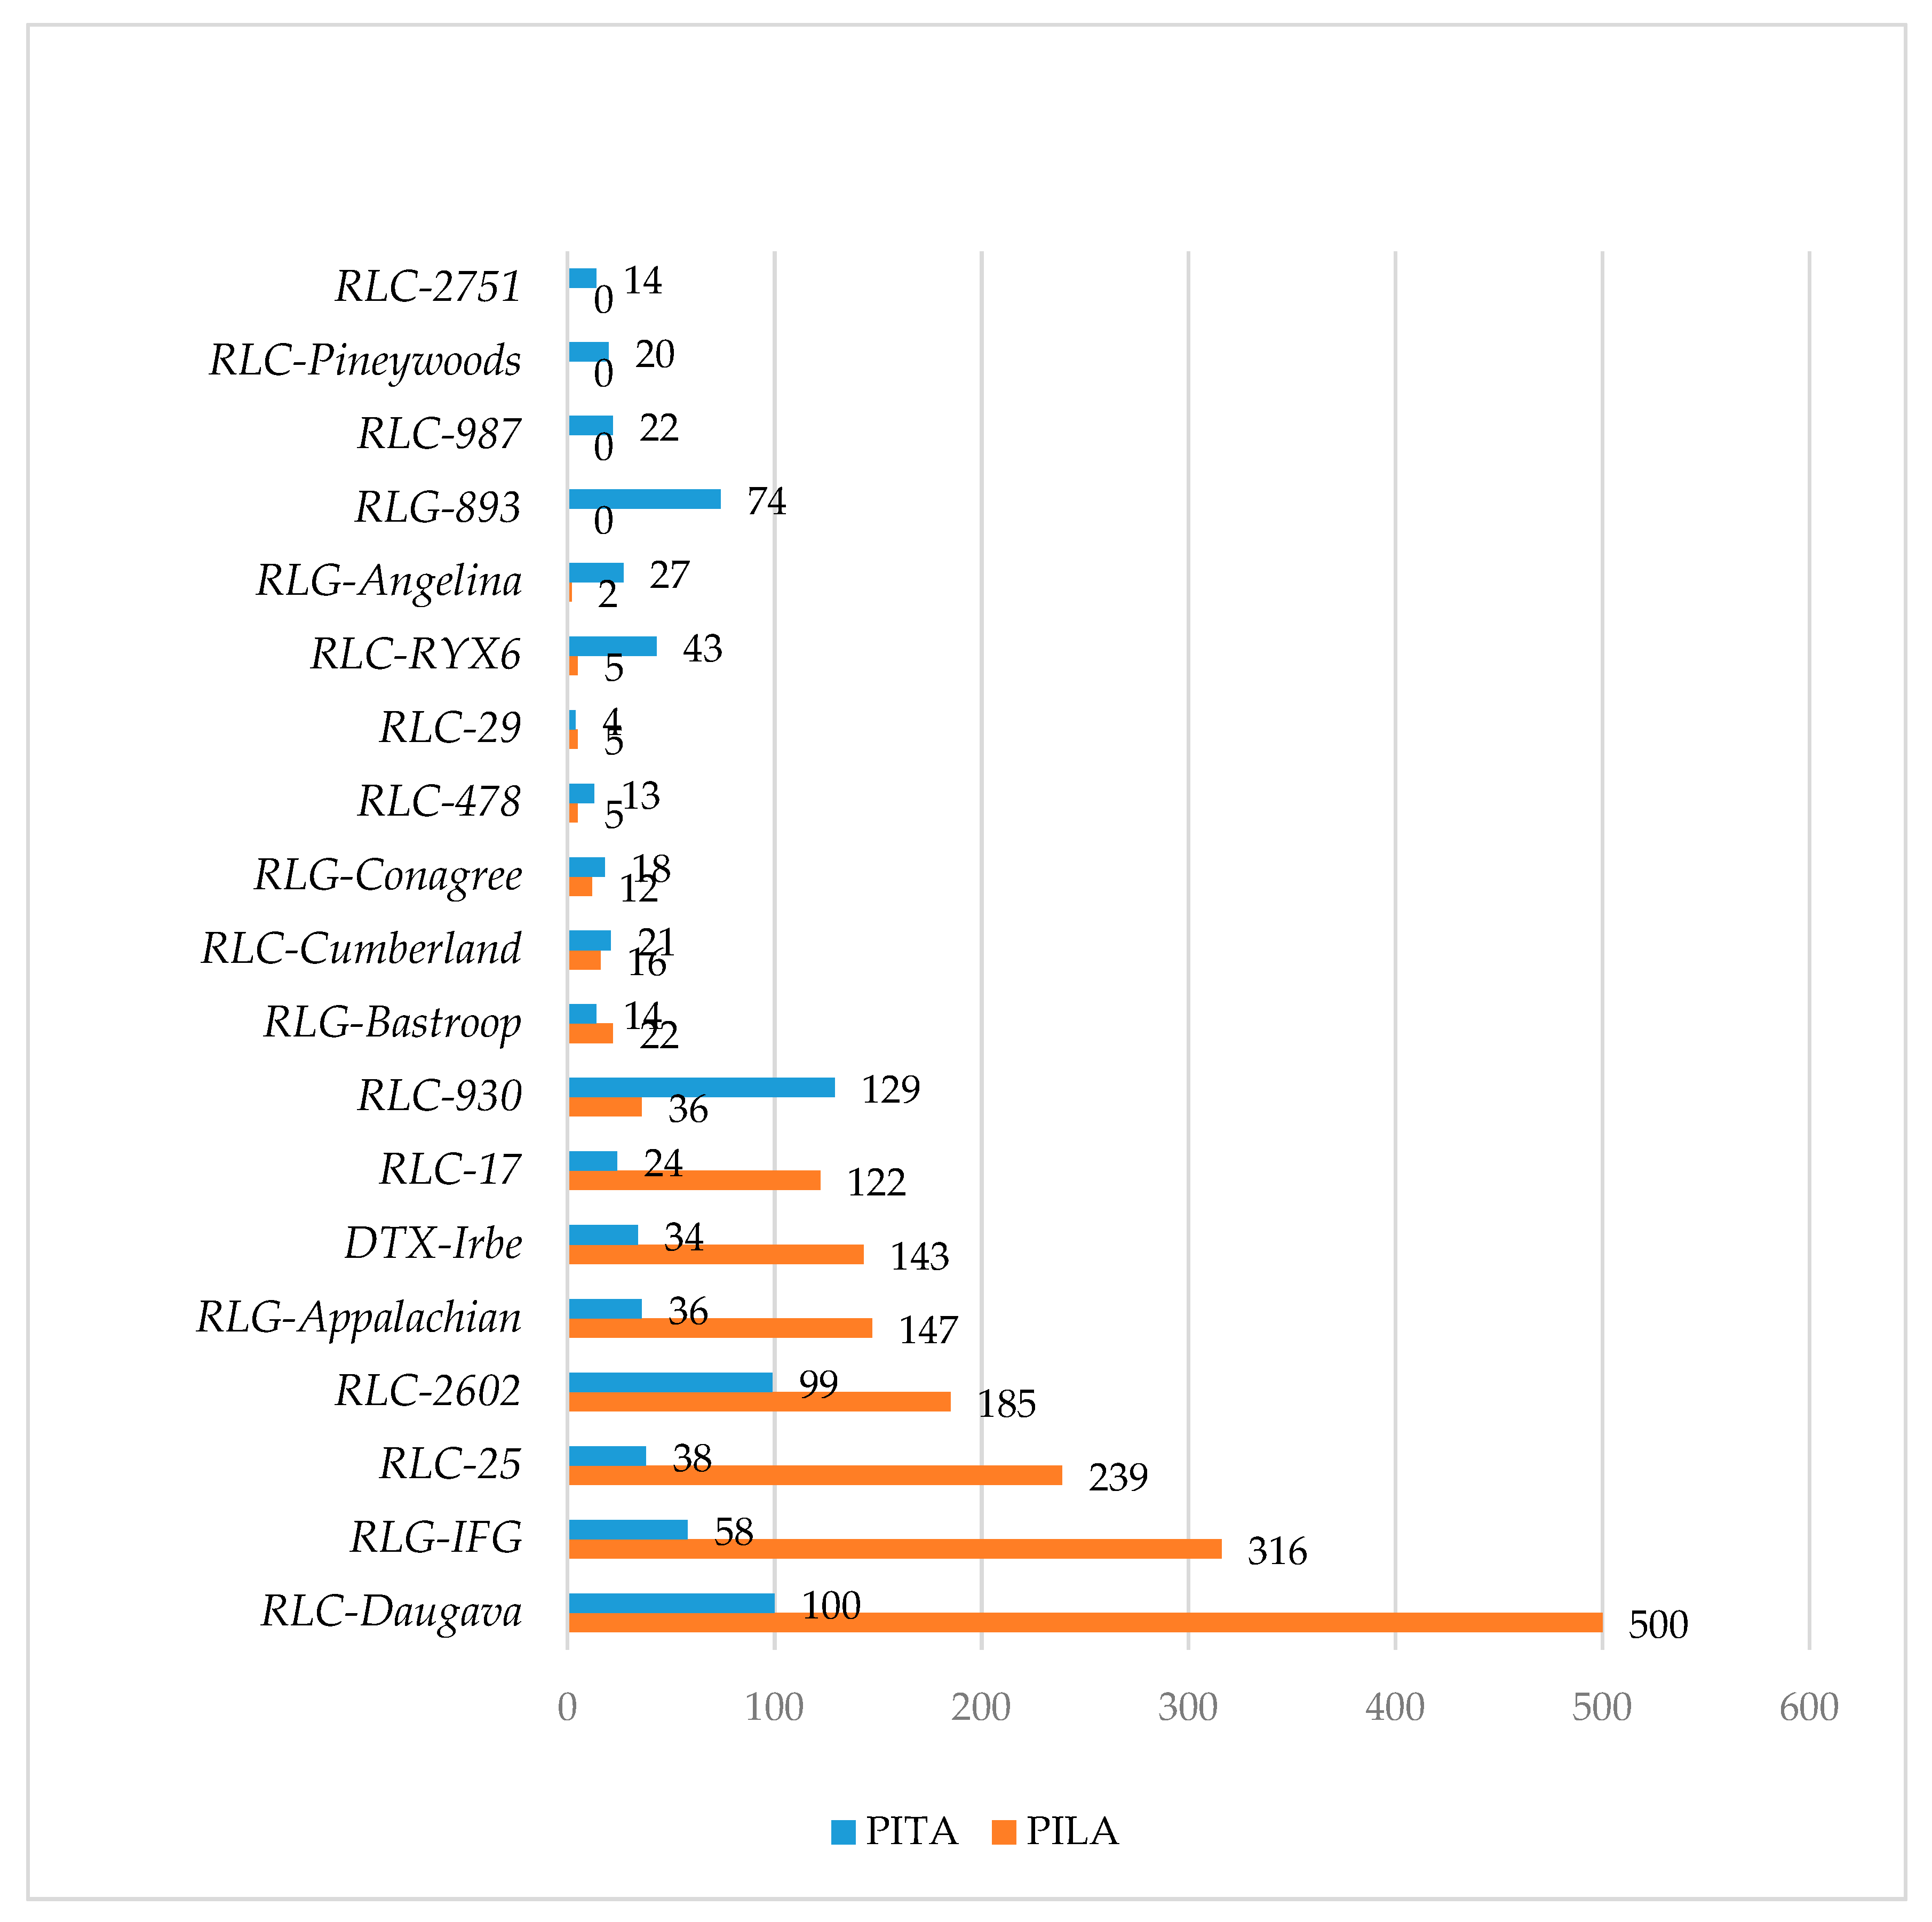
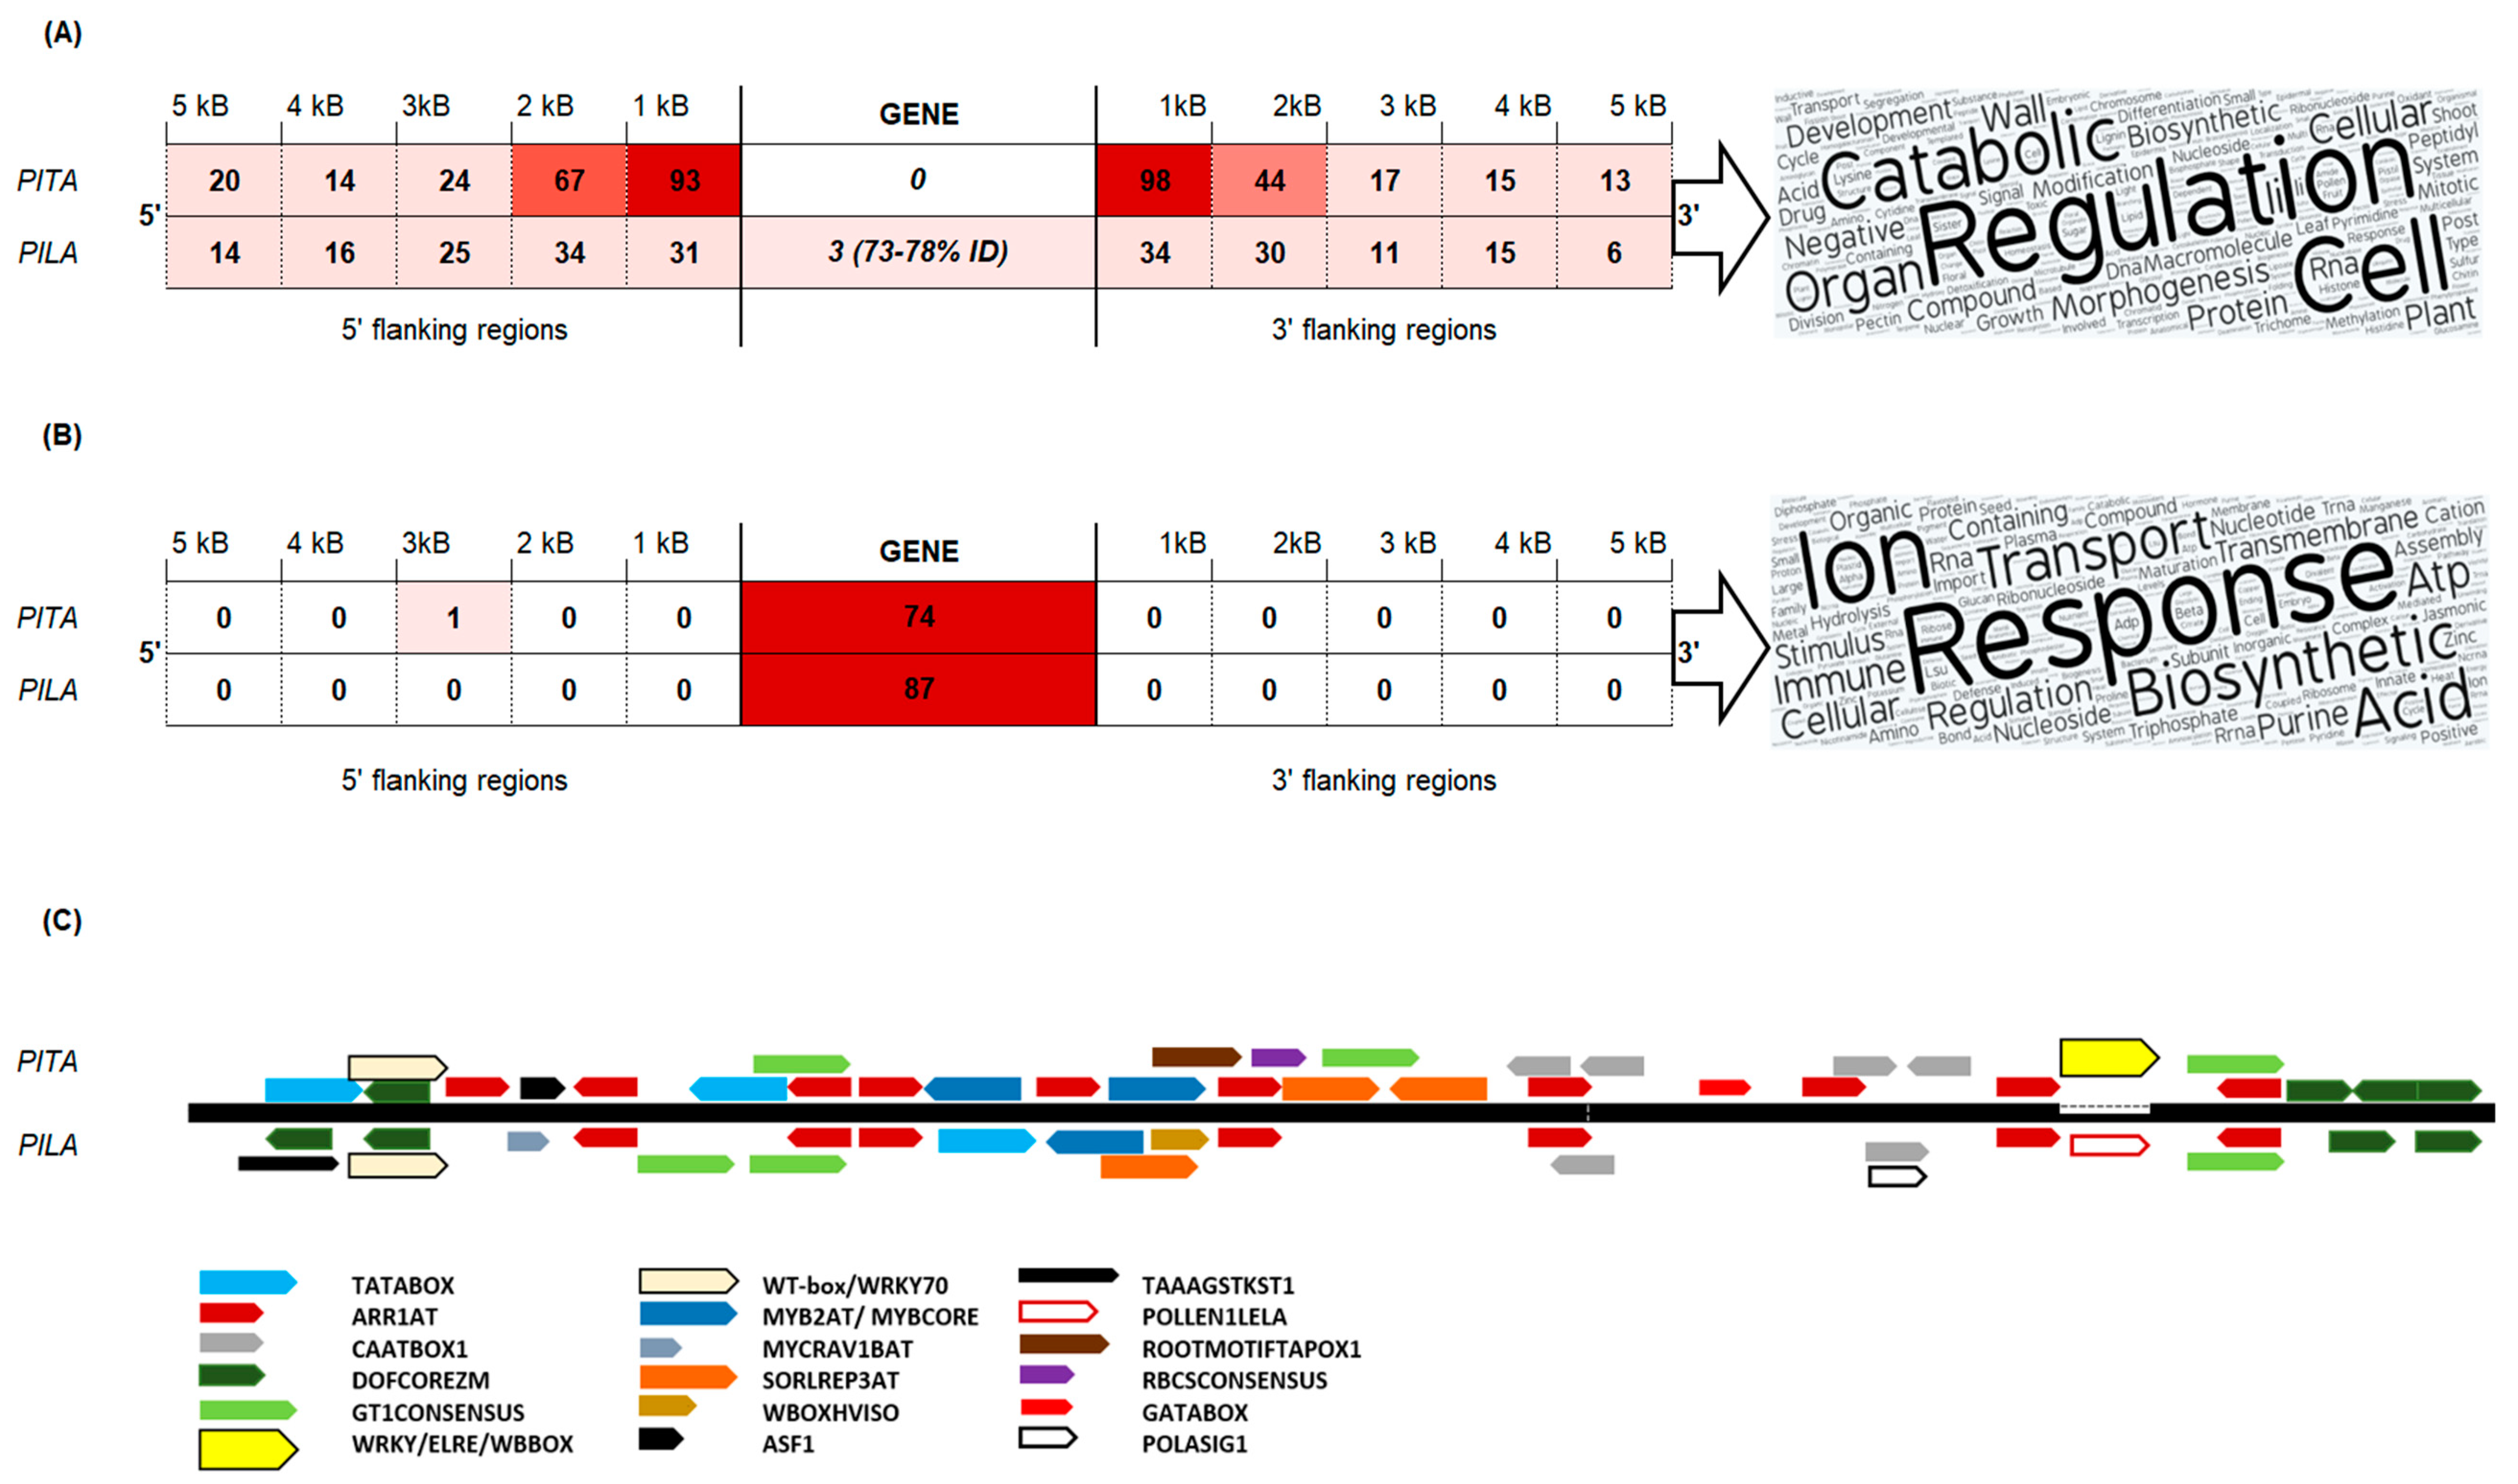
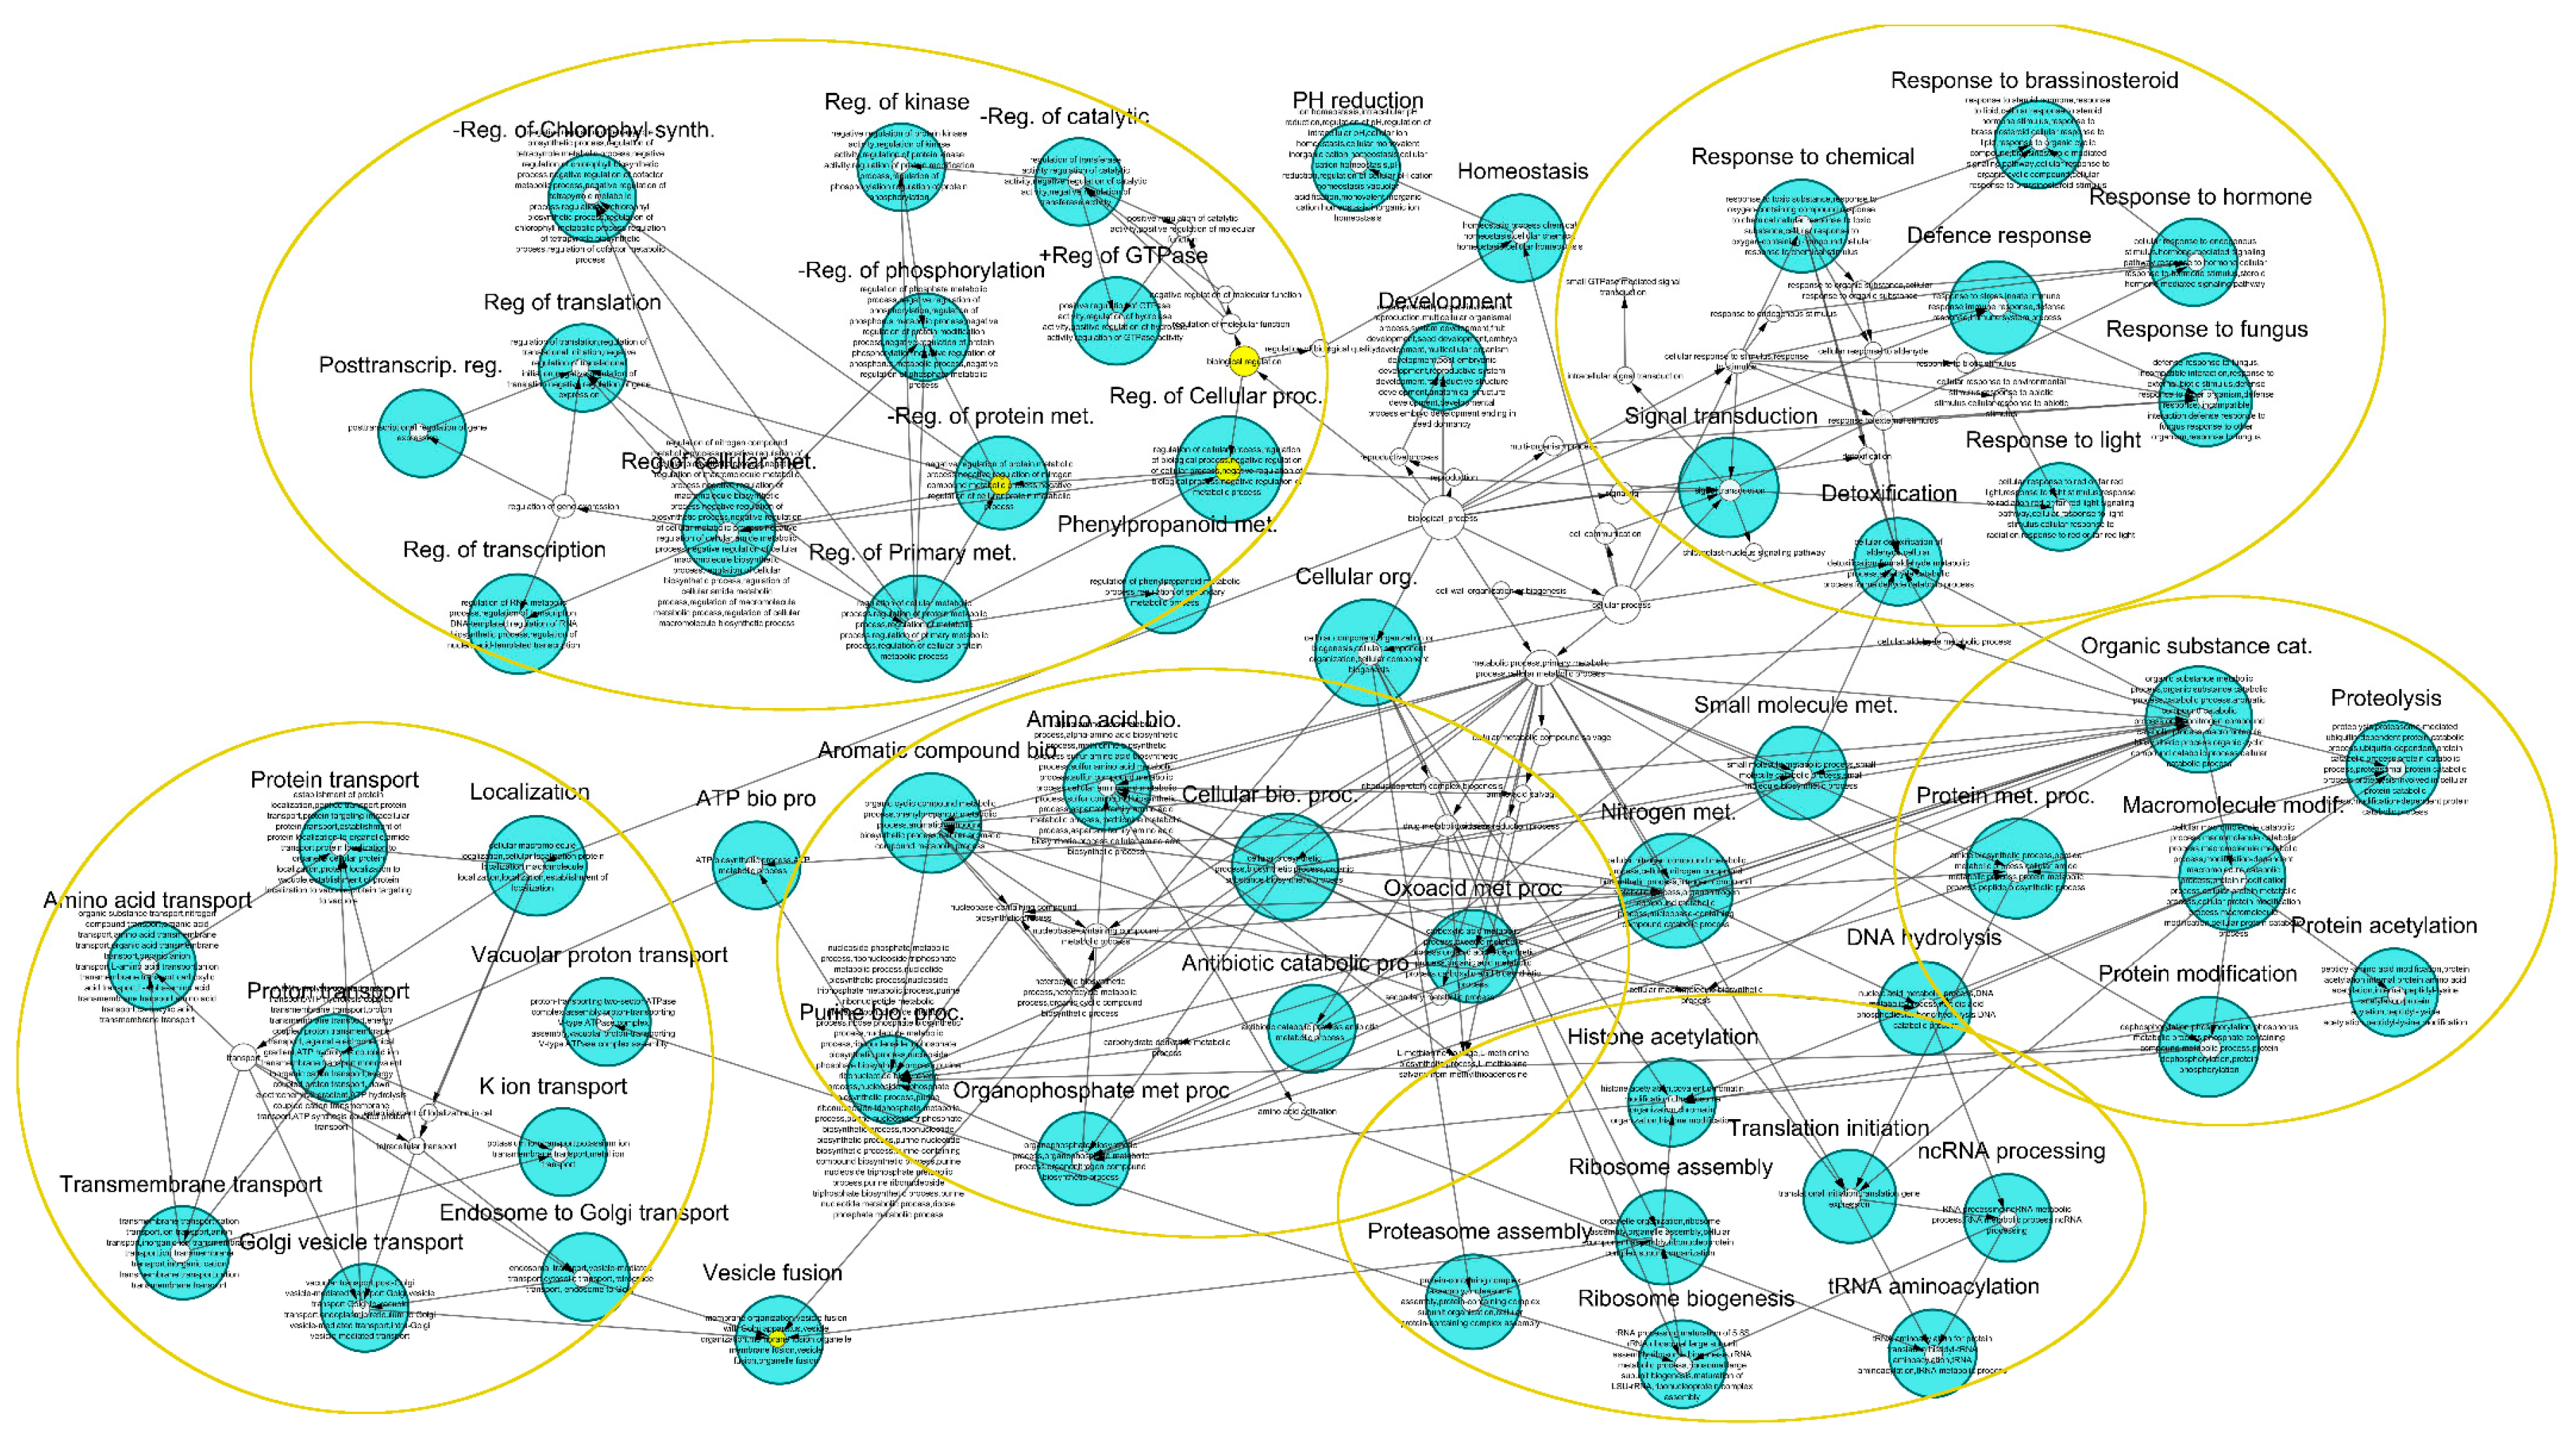
Table 1.
Comparison of extracted gene-flanking regions in genome data sets.
| Genome/ Gene Set | Flanking Region from the Gene Start/End Coordinates | ||||||||||
|---|---|---|---|---|---|---|---|---|---|---|---|
| 5′ | 3′ | 5′ | 3′ | 5′ | 3′ | 5′ | 3′ | 5′ | 3′ | ||
| 0–1 kb | 0–1 kb | 1–2 kb | 1–2 kb | 2–3 kb | 2–3 kb | 3–4 kb | 3–4 kb | 4–5 kb | 4–5 kb | ||
| P. taeda v.2.0. all genes | Nb of extr.seq. | 36,726 | 36,728 | 34,711 | 34,063 | 33,184 | 32,310 | 31,767 | 30,838 | 30,349 | 29,479 |
| Nb of hqh to TE-dr | 5851 | 6450 | 4362 | 3901 | 3750 | 3628 | 3310 | 3069 | 3202 | 2924 | |
| ratio |  | ||||||||||
| >50 | 17 | 22 | 10 | 10 | 4 | 2 | 1 | 0 | 0 | 0 | |
| >100 | 8 | 9 | 1 | 0 | 0 | 0 | 0 | 0 | 0 | 0 | |
| P. taeda v.2.0. annotated genes | Nb of extr.seq. | 15,084 | 15,057 | 14,114 | 13,793 | 13,371 | 12,912 | 12,713 | 12,192 | 11,985 | 11,569 |
| Nb of hqh to TE-dr | 816 | 773 | 800 | 732 | 875 | 968 | 1161 | 991 | 901 | 1000 | |
| ratio |  | ||||||||||
| >50 | 0 | 0 | 0 | 0 | 0 | 0 | 0 | 0 | 0 | 0 | |
| >100 | 0 | 0 | 0 | 0 | 0 | 0 | 0 | 0 | 0 | 0 | |
| P. taeda v.1.01. HQ genes | Nb of extr.seq. | 4298 | 4239 | 4177 | 4128 | 4130 | 4091 | 4081 | 4028 | 4023 | 3967 |
| Nb of hqh to TE-dr | 784 | 779 | 2258 | 1890 | 3151 | 2693 | 3593 | 3222 | 3816 | 3539 | |
| ratio |  | ||||||||||
| >50 | 1 | 1 | 1 | 0 | 0 | 0 | 0 | 0 | 0 | 0 | |
| >100 | 0 | 0 | 0 | 0 | 0 | 0 | 0 | 0 | 0 | 0 | |
| P. taeda v.1.01. LQ genes | Nb of extr.seq. | 75,425 | 75,459 | 72,840 | 72,797 | 71,554 | 71,470 | 70,002 | 69,836 | 68,237 | 68,017 |
| Nb of hqh to TE-dr | 2317 | 2540 | 4188 | 4243 | 4979 | 5070 | 5256 | 5387 | 5645 | 5382 | |
| ratio |  | ||||||||||
| >50 | 2 | 2 | 5 | 5 | 6 | 5 | 4 | 7 | 7 | 6 | |
| >100 | 1 | 1 | 3 | 4 | 1 | 1 | 0 | 1 | 0 | 0 | |
| P. lambertiana v.1.01 HQ genes | Nb of extr.seq. | 8779 | 8778 | 8746 | 8742 | 8719 | 8708 | 8692 | 8673 | 8660 | 8640 |
| Nb of hqh to TE-dr | 71 | 55 | 163 | 187 | 278 | 277 | 315 | 296 | 355 | 357 | |
| ratio |  | ||||||||||
| >50 | 0 | 0 | 0 | 0 | 0 | 0 | 0 | 0 | 0 | 0 | |
| >100 | 0 | 0 | 0 | 0 | 0 | 0 | 0 | 0 | 0 | 0 | |
| P. lambertiana v.1.01 LQ | Nb of extr.seq. | 71,162 | 71,157 | 70,386 | 70,475 | 69,773 | 69,909 | 69,217 | 69,344 | 68,660 | 68,836 |
| Nb of hqh to TE-dr | 470 | 466 | 1063 | 1011 | 1556 | 1508 | 1789 | 1368 | 2038 | 1999 | |
| ratio |  | ||||||||||
| >50 | 0 | 0 | 1 | 0 | 4 | 3 | 6 | 1 | 7 | 7 | |
| >100 | 0 | 0 | 0 | 0 | 0 | 0 | 0 | 0 | 0 | 0 | |
>—indicates count of TE families that hits greater than 50 or greater than 100 gene flanking regions; hqh—high quality hits; TE-dr—TE-derived repeats; HQ—high quality gene set; LQ—low quality gene set; extr.seq.—extracted gene flanking sequences.
Table 2.
P. taeda v.2.0 and P. lambertiana v.1.01 genes carrying several Plater MITE insertions. qc- query coverage.
Table 2.
P. taeda v.2.0 and P. lambertiana v.1.01 genes carrying several Plater MITE insertions. qc- query coverage.
| Species | Genes ID with Multiple Plater MITEs | Nb of Plater Insertions | Description | qc, % | e-Value | ID, % | Accession |
|---|---|---|---|---|---|---|---|
| P. taeda v.2.0. | PITA_12742 | 7 | uncharacterized protein with domain of phosphoglucosamine mutase family protein | 88 | 0.00 × 100 | 65 | PLN02371 |
| PITA_21987 | 4 | subtilisin-like protease SBT5.3 | 96 | 0.0 | 47 | XP_012083905.1 | |
| PITA_00114 | 3 | metal tolerance protein 11 | 99 | 0.0 | 72 | XP_006857671.1 | |
| PITA_24114 | 2 | probable xyloglucan endotransglucosylase/hydrolase protein B | 93 | 3.00 × 10−153 | 72 | XP_030961064.1 | |
| PITA_21327 | 2 | 60S ribosomal protein L8-1-like | 95 | 2.00 × 10−169 | 90 | XP_022936671.1 | |
| PITA_17959 | 2 | TMV resistance protein N-like | 93 | 8.00 × 10−165 | 31 | XP_023886681.1 | |
| PITA_34859 | 2 | 3-oxoacyl-[acyl-carrier-protein] synthase I, chloroplastic-like isoform X1 | 95 | 0.0 | 74 | XP_028101593.1 | |
| PITA_28894 | 2 | L-gulonolactone oxidase 2 isoform X2 | 95 | 0.0 | 54 | XP_011621860.1 | |
| PITA_00539 | 2 | probable potassium transporter 11 | 99 | 0.0 | 67 | XP_006830082.1 | |
| PITA_33316 | 2 | plasma membrane intrinsic protein 2;8 | 95 | 5.00 × 10−141 | 74 | NP_179277.1 | |
| PITA_09881 | 2 | cytokinin hydroxylase | 93 | 0.0 | 52 | XP_011099558.1 | |
| P. lambertiana v.1.01. HQ genes | S/hiseq/c38458_g1_i1|m.23006 | 2 | bifunctional phosphatase IMPL2, chloroplastic | 75 | 7.00 × 10−147 | 73 | XP_011088446.1 |
| PILAhq_048992 | 2 | putative clathrin assembly protein At4g40080 | 80 | 2.00 × 10−40 | 36 | XP_027337607.1 | |
| PILAhm_002002 | 2 | histone deacetylase 15 isoform X3 | 69 | 4.00 × 10−179 | 63.89 | XP_010265267.1 |
HQ—high quality genes; qc—query coverage; ID—identity; Nb—number.
Table 3.
Node genes containing several TE insertions and found to be homologous or carrying identical domains between P. taeda (PITA) and P. lambertiana (PILA).
Table 3.
Node genes containing several TE insertions and found to be homologous or carrying identical domains between P. taeda (PITA) and P. lambertiana (PILA).
| TE-dr Nb. Pita | TE-dr Nb. Pila | Description | Accession | Conserved Domain Name | Accession | GO Terms |
|---|---|---|---|---|---|---|
| 24 | 19 | plastidial pyruvate kinase 2 | XP_006843356.1 h | PLN02623 | PLN02623 | reproduction; ATP generation from ADP; seed maturation; |
| 23 | 26 | DEAD-box ATP-dependent RNA helicase 20 isoform X2/helicase 58, chloroplastic isoform X3 | XP_025888827.1 | SrmB | COG0513 | RNA secondary structure unwinding |
| 21 | 21 | phospholipid:diacylglycerol acyltransferase 1 | XP_006849611.1 h | PLN02517 | PLN02517 | acylglycerol biosynthetic process |
| 18 | 20 | nuclear pore complex protein NUP62-like/GPCR-type G protein 1 isoform X2 | XP_024396806.1 | SMC_prok_B super family | cl37069 | RNA export from nucleus; protein import/export into/from nucleus; nucleocytoplasmic transport, localization |
| 13 | 23 | WD repeat-containing protein WRAP73 | XP_008798782.1 | WD40 super family | COG2319 | - |
| - | 19 | protein RAE1 | XP_028076289.1 | cl29593 | ||
| - | 24 | actin-related protein 2/3 complex subunit 1A | XP_011627051.1 | cl29593 | ||
| 12 | 19 | uncharacterized protein LOC109715170/probable E3 ubiquitin-protein ligase HERC4 isoform X1 | XP_020095639.1 | ATS1 super family | cl34932 | - |
| 11 | 31 | peroxisomal adenine nucleotide carrier 1/mitochondrial substrate carrier family protein C-like | XP_006841423.1 | Mito_carr | pfam00153 | Establishment of localization; transmembrane transport; amide biosynthetic process; translation; nitrogen compound metabolic process. |
TE-dr Nb—Number of unique TE-derived repeats; h—genes with similar transcripts (>90% nucleotide identity).
Publisher’s Note: MDPI stays neutral with regard to jurisdictional claims in published maps and institutional affiliations. |
© 2020 by the authors. Licensee MDPI, Basel, Switzerland. This article is an open access article distributed under the terms and conditions of the Creative Commons Attribution (CC BY) license (http://creativecommons.org/licenses/by/4.0/).
Share and Cite
MDPI and ACS Style
Voronova, A.; Rendón-Anaya, M.; Ingvarsson, P.; Kalendar, R.; Ruņģis, D. Comparative Study of Pine Reference Genomes Reveals Transposable Element Interconnected Gene Networks. Genes 2020, 11, 1216. https://doi.org/10.3390/genes11101216
AMA Style
Voronova A, Rendón-Anaya M, Ingvarsson P, Kalendar R, Ruņģis D. Comparative Study of Pine Reference Genomes Reveals Transposable Element Interconnected Gene Networks. Genes. 2020; 11(10):1216. https://doi.org/10.3390/genes11101216
Chicago/Turabian StyleVoronova, Angelika, Martha Rendón-Anaya, Pär Ingvarsson, Ruslan Kalendar, and Dainis Ruņģis. 2020. "Comparative Study of Pine Reference Genomes Reveals Transposable Element Interconnected Gene Networks" Genes 11, no. 10: 1216. https://doi.org/10.3390/genes11101216
Note that from the first issue of 2016, this journal uses article numbers instead of page numbers. See further details here.