
How Physical and Molecular Anthropology Interplay in the Creation of Biological Profiles of Unidentified Migrants

 , , and
Abstract
:1. Introduction
2. Materials and Methods
2.1. Anthropological Methods
Morphometric Ancestry and Sex Estimation

| Ancestry Estimation | Sex Estimation | ||||||||
|---|---|---|---|---|---|---|---|---|---|
| ID | Mandible | Tooth Stage [19] | HefneR [24] | OSSA Score [23] | Craniometrics [25] | South African White [11] | South African Black [11] | Walker [7] | Craniometrics [25] |
| 003 | G | African (0.85) | Black | West Africa (0.67) | F/M | M | M | M (0.93) | |
| 028 | F | European (0.87) | White | Somali (0.97) | F/M | F | F/M | F (0.95) | |
| 058 A1 | X | Adult | European (0.51) | White | Somali (0.58) | F/M | M | M | M (0.72) |
| 062 | X | G | African (0.99) | Black | West Africa (0.91) | M | M | M | M (0.82) |
| 095 | Adult | African (0.80) | White | Portuguese (0.86) | F | M | M | M (0.77) | |
| 099 | Adult | European (0.99) | White | West Africa (0.41) | F | M | M | M (0.69) | |
| 100-1 | X | Adult | European (0.95) | White | Somali (0.96) | F | F | F | F (0.98) |
| 100-2 | X | Adult | European (0.96) | White | Hainan (0.41) | M/F | M | M | M (0.97) |
| 104-1 | Adult | African (0.98) | Black | West Africa (0.73) | F/M | M | M/F | M/F (0.51) | |
| 104-5 | F | African (0.59) | Black | Somali (0.92) | F | F | F | F (0.91) | |
| 105-2 | X | F | African (0.65) | White | West Africa (0.32) | M | M | M | M (0.99) |
| 125 | Adult | European (0.47) | White | Somali (0.38) | F/M | M | M | F/M (0.51) | |
| 131 | X | Adult | European (0.69) | White | Zulu (0.24) | M/F | M/F | M/F | M (0.75) |
| 137 | X | Adult | European (0.84) | White | Somali (0.98) | F/M | M | M | M (0.74) |
| 146 | Adult | European (0.84) | White | West Africa (0.33) | M | M | M | M (0.93) | |
| 149-1 | X | G | European (0.99) | White | Euro-American (0.31) | M/F | M/F | M | M (0.99) |
| 154-1 | X | F | African (0.95) | Black | Somali (0.48) | F/M | M/F | M | F (0.76) |
| 154-2 | X | Adult | African (0.99) | Black | Somali (0.70) | M | M | M | M (0.99) |
| 178-1 | X | Adult | Asian (0.34) | Black | Somali (0.42) | M/F | M | M | M (0.75) |
| 178-2 | Adult | Asian (0.49) | White | West Africa (0.42) | M | M | M | F (0.99) | |
| 178-3 | Adult | Asian (0.73) | White | Somali (0.47) | F | F | F | F (0.59) | |
2.2. Molecular Methods
2.2.1. Sample Preparation, DNA Extraction, Whole-Genome Library Preparation, and Sequencing
2.2.2. Postsequencing Data Processing
2.2.3. Sex Determination
2.2.4. Genotype Calling and Principal Component Analysis for Ancestry Inference
2.2.5. Haplogroup Assignment of Uniparental Markers
3. Results and Discussion
3.1. Physical Data
Skeletal Ancestry and Sex Estimation
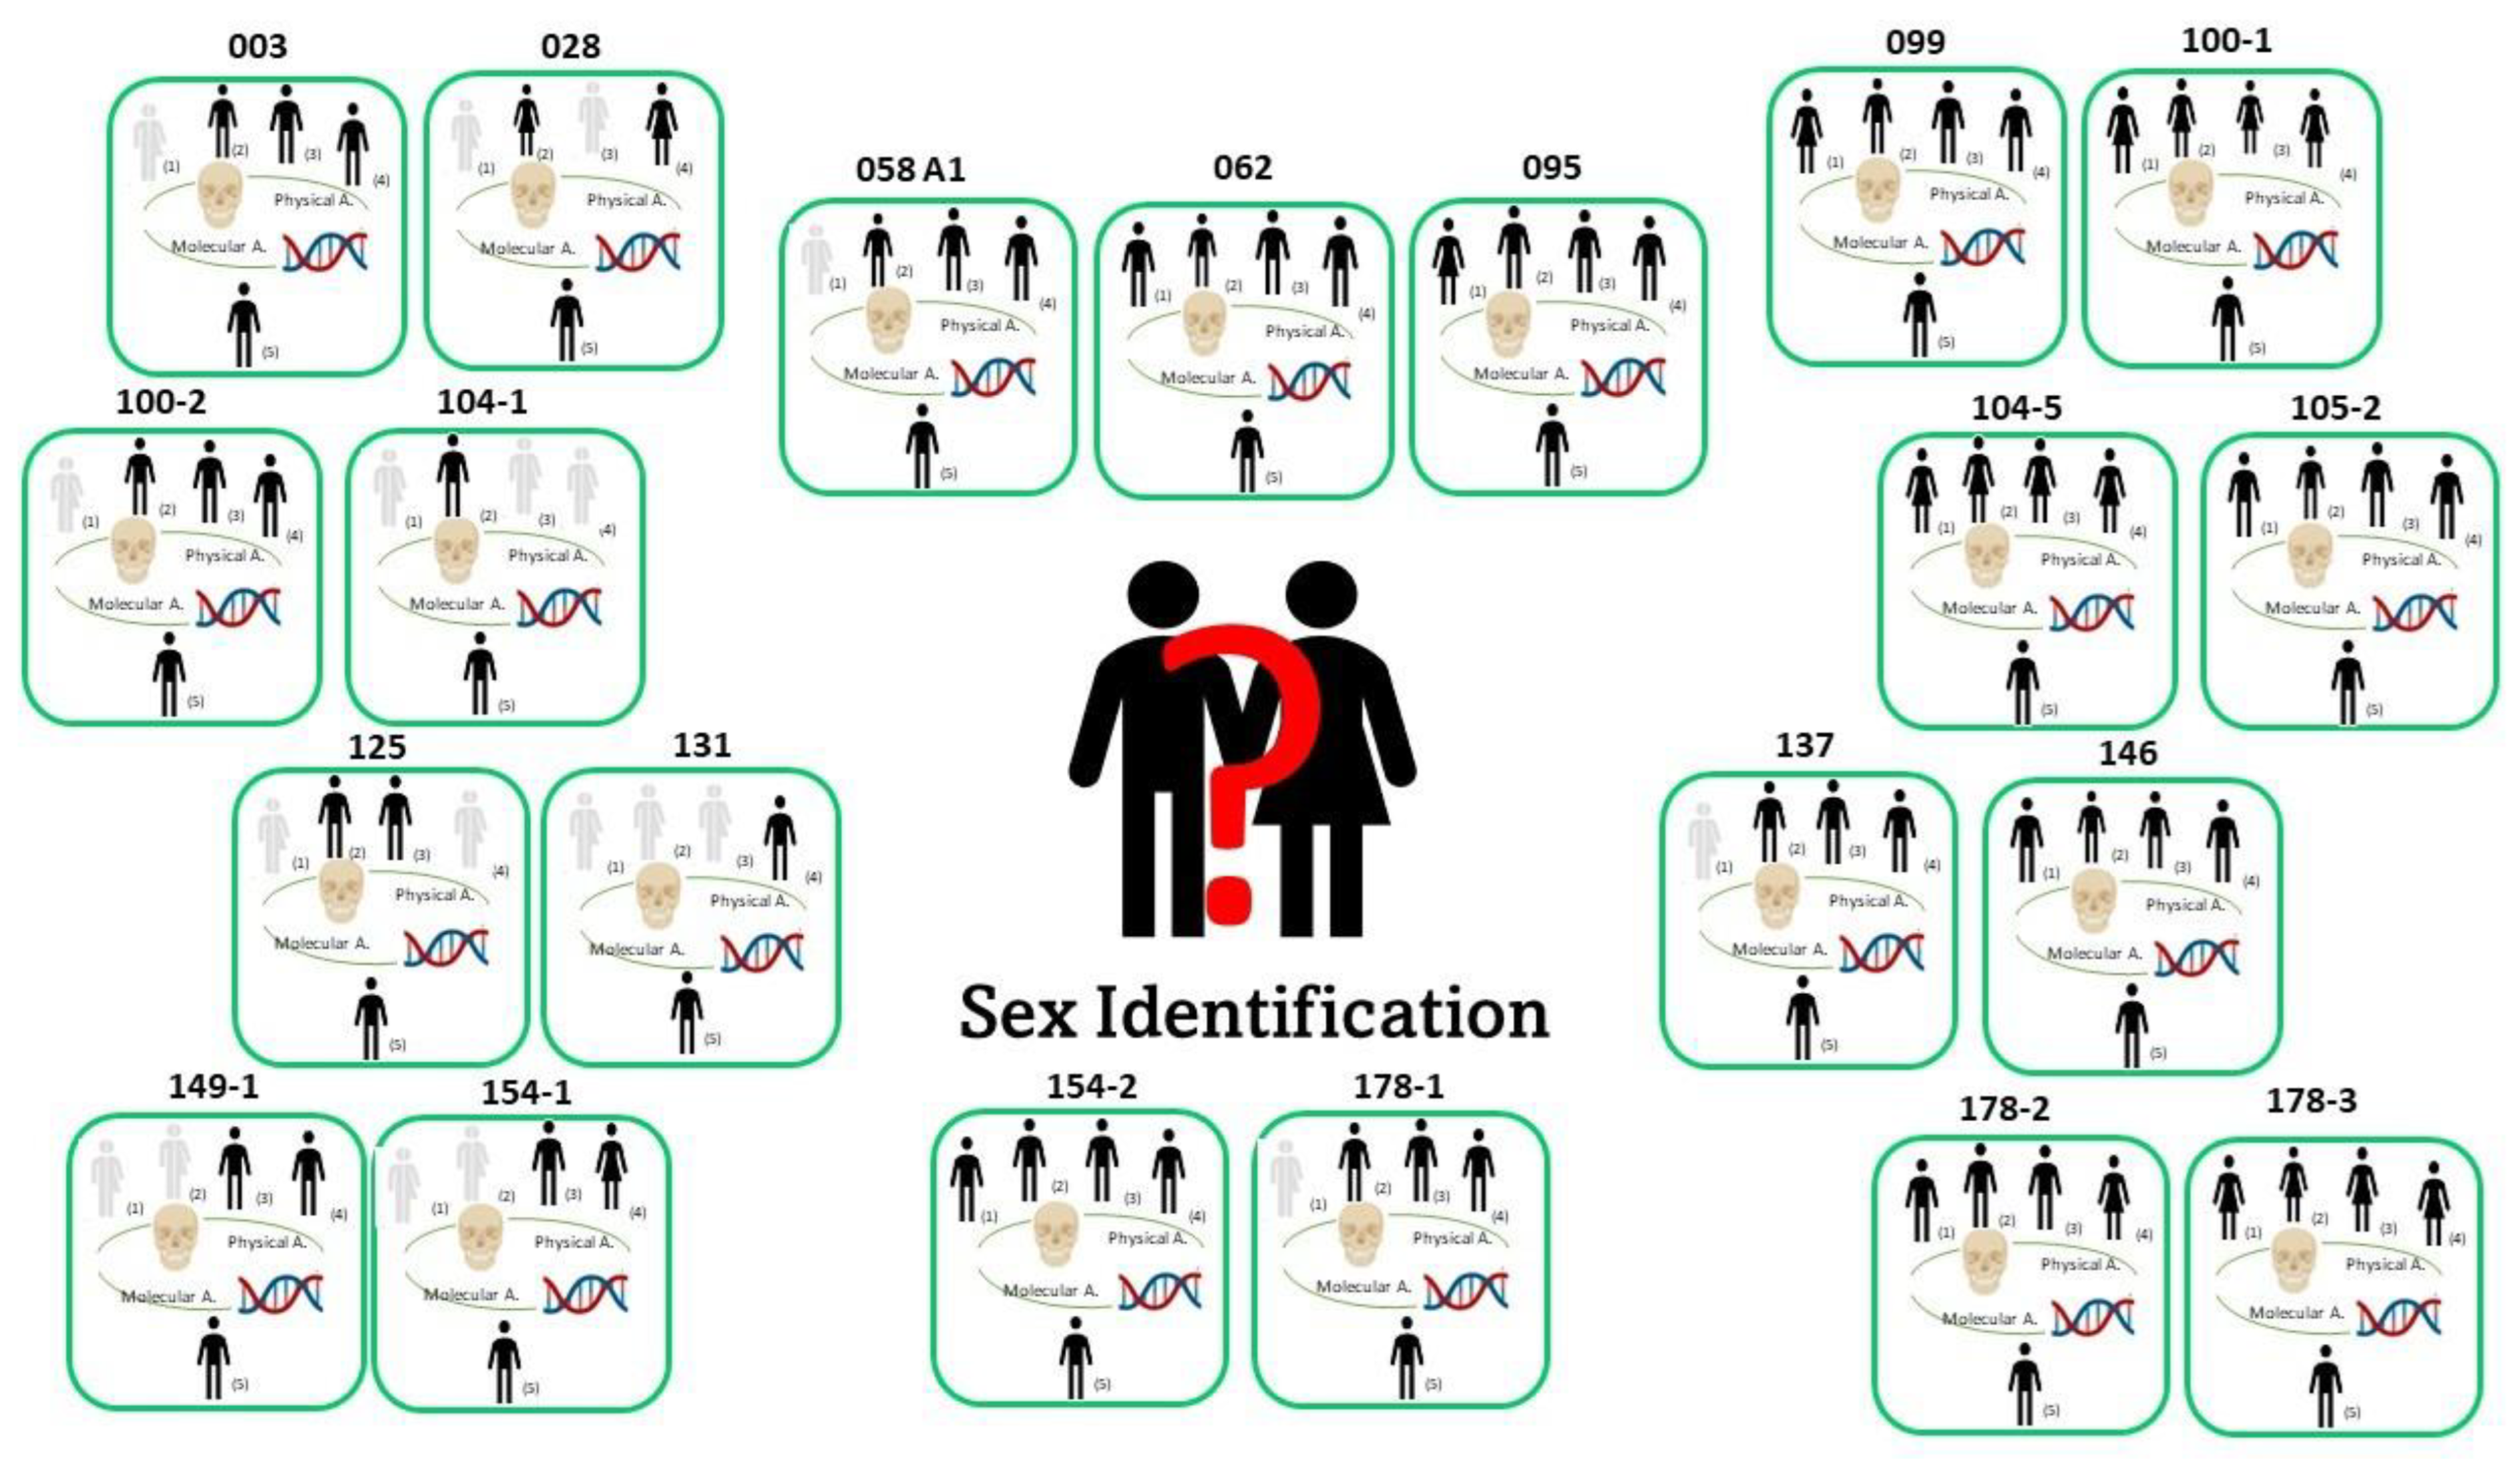
- Determined: When the morphoscopic methods agreed on the classification group (e.g., European and White), the sex classification followed the ancestry estimation, and therefore, the appropriate equations by Krüger et al. [11] for South African Black or South African White were applied. Eight crania belonged to this group: five crania displayed the highest probability to be classified as male for all the traits considered, whereas three crania were classified as female.
- Uncertain: When the morphoscopic ancestry estimation provided consistent results between methods, but the cranium presented mixed traits and therefore mixed probabilities according to the equations for sex estimation. For eight crania, a definitive judgment could not be expressed, as the coexistence of feminine and masculine traits produced mixed probabilities from the equations: four crania were F/M and four were M/F.
- Undetermined: When the morphoscopic ancestry estimation classified the cranium into different population groups, it was not possible to choose the appropriate re-calibrated equation by Krüger et al. [11]. Therefore, the result was based on Walker [7], since the method pools White and Black individuals. Five crania belonged to this group; the sex estimation based on Walker [7] classified two crania as female and three crania as male.
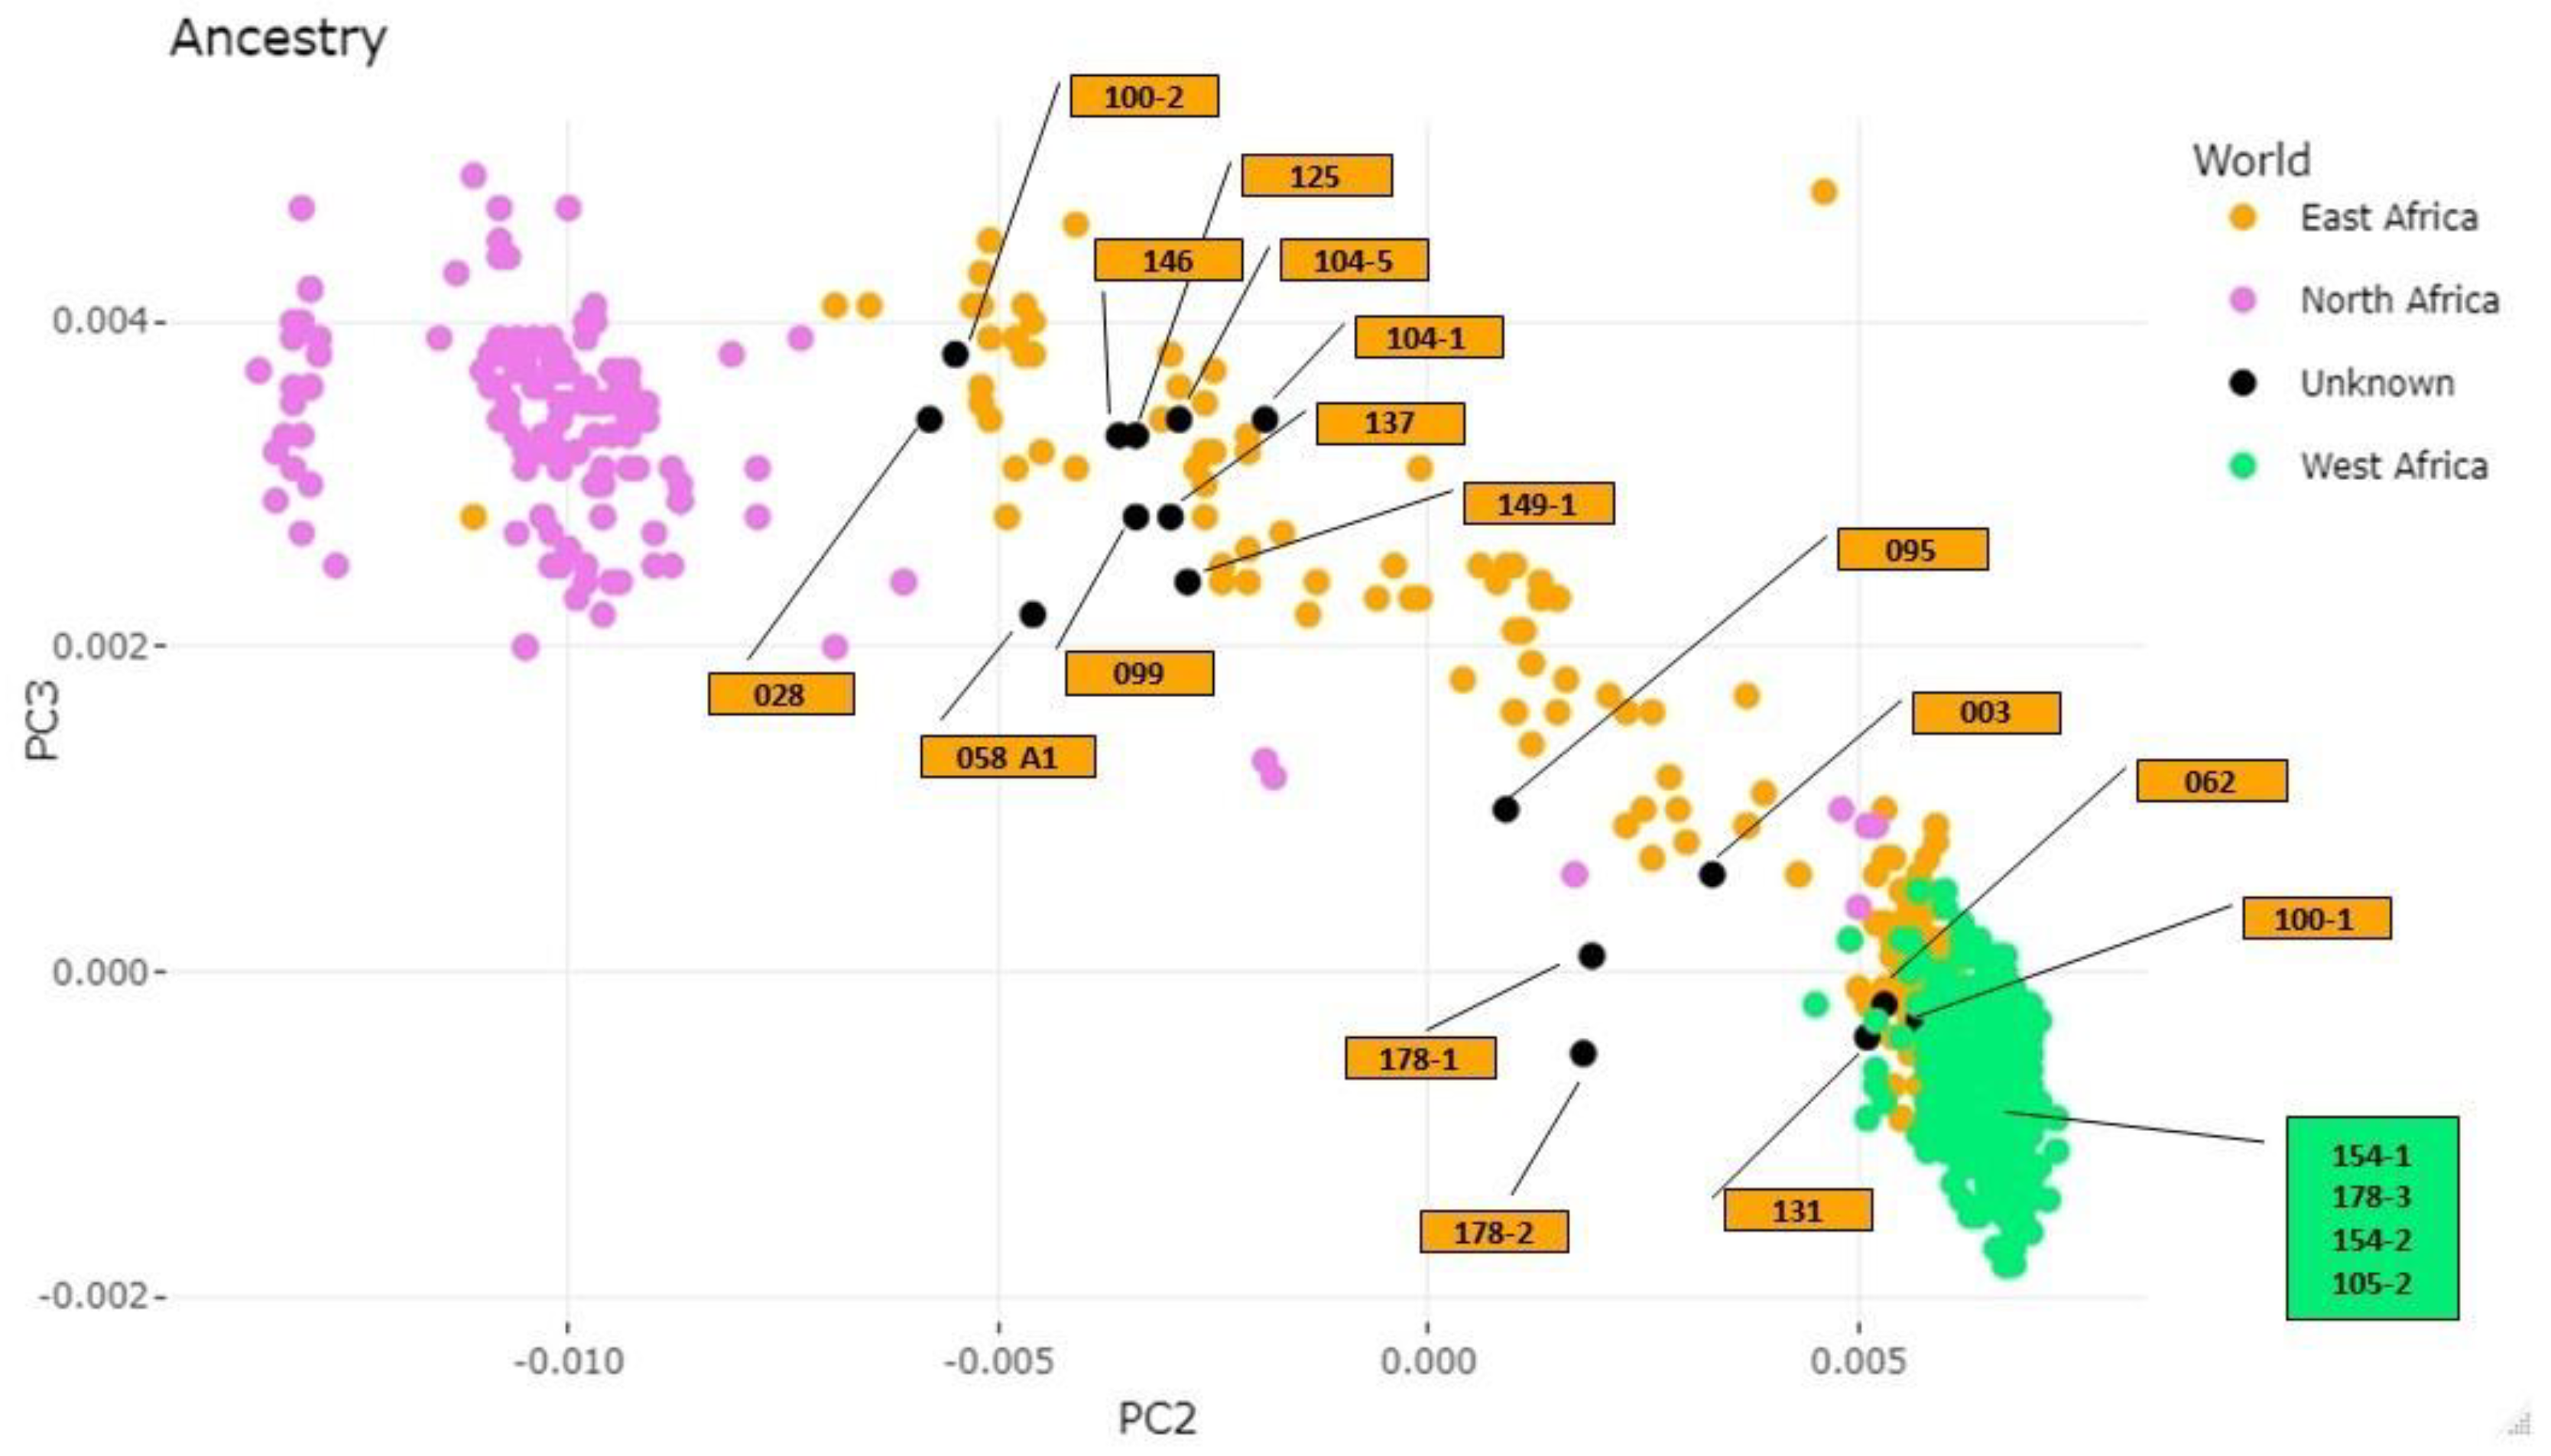
3.2. Molecular Data
Sex Estimation and Skeletal Ancestry
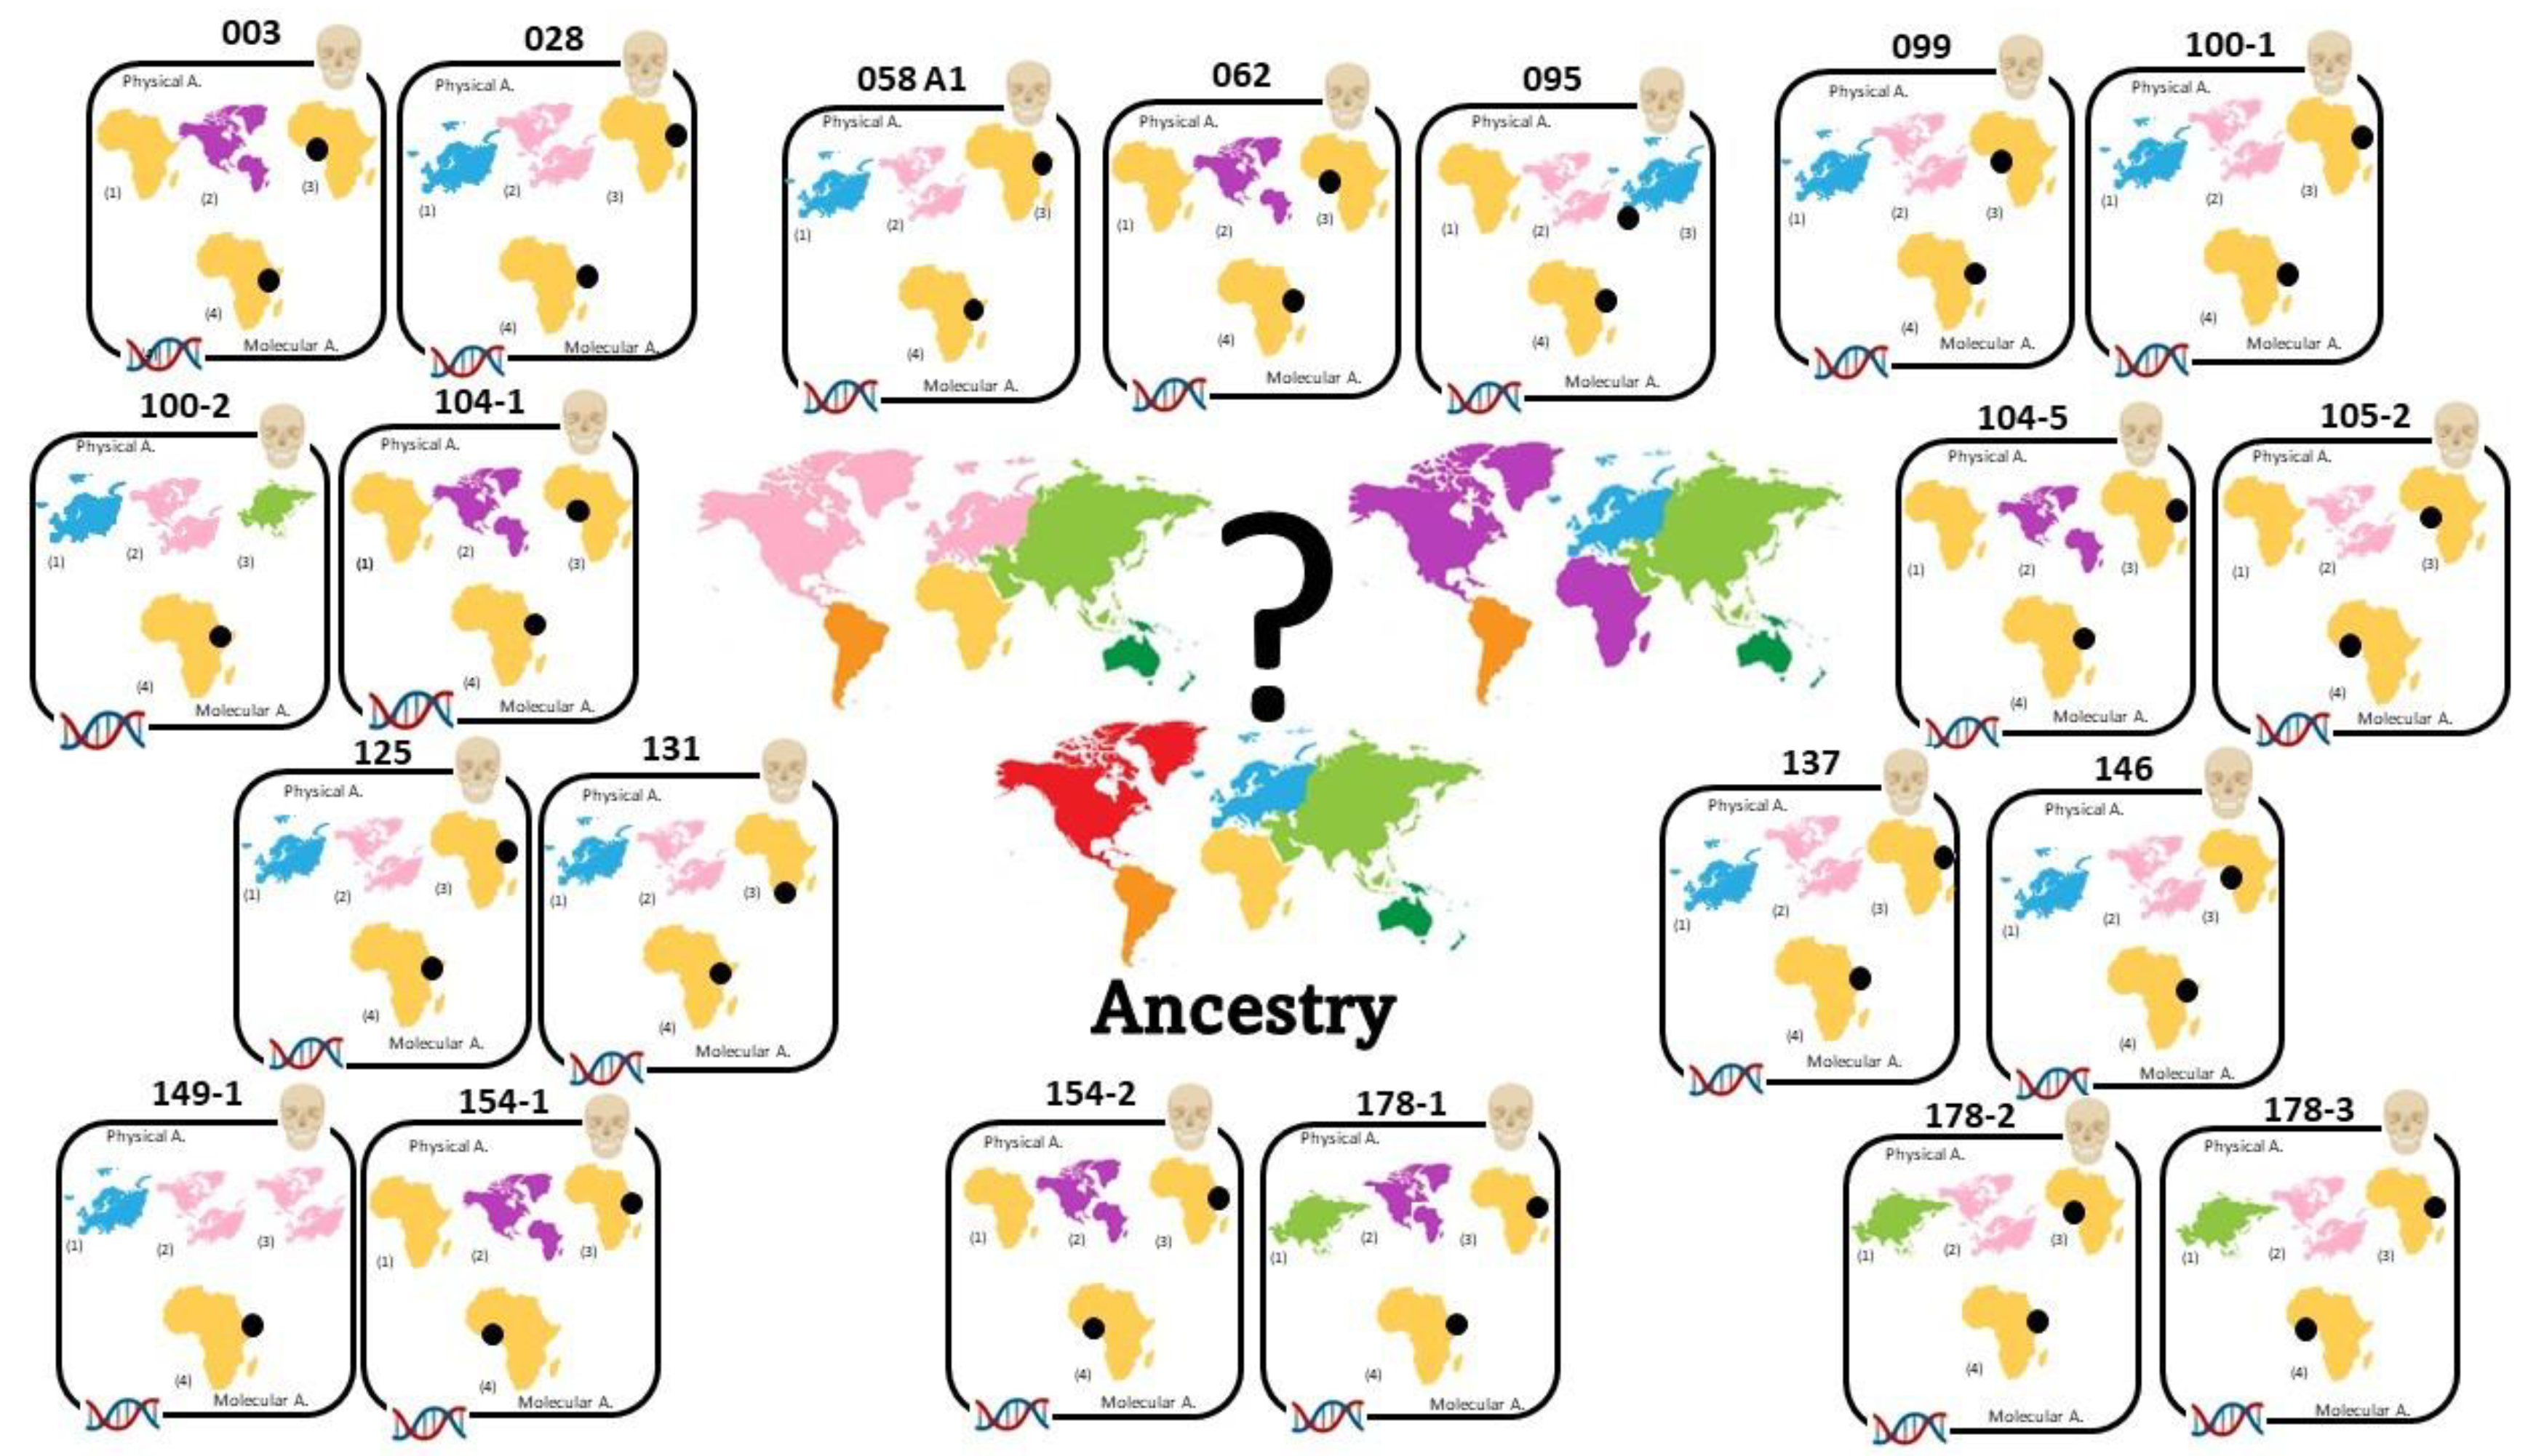
3.3. Comparison of Physical and Molecular Data
4. Conclusions
Supplementary Materials
Author Contributions
Funding
Institutional Review Board Statement
Informed Consent Statement
Data Availability Statement
Acknowledgments
Conflicts of Interest
References
- UNHCR—Global Trends Report 2021. Available online: https://www.unhcr.org/62a9d1494/global-trends-report-2021 (accessed on 17 November 2022).
- Cattaneo, C.; Tidball Binz, M.; Penados, L.; Prieto, J.; Finegan, O.; Grandi, M. The Forgotten Tragedy of Unidentified Dead in the Mediterranean. Forensic Sci. Int. 2015, 250, e1–e2. [Google Scholar] [CrossRef] [PubMed]
- International Organization for Migration (IOM). Available online: https://missingmigrants.iom.int/report-missing (accessed on 30 January 2023).
- Cattaneo, C.; De Angelis, D.; Mazzarelli, D.; Porta, D.; Poppa, P.; Caccia, G.; D’Amico, M.E.; Siccardi, C.; Previderè, C.; Bertoglio, B.; et al. The Rights of Migrants to the Identification of Their Dead: An Attempt at an Identification Strategy from Italy. Int. J. Legal Med. 2022, 137, 146–156. [Google Scholar] [CrossRef] [PubMed]
- Spradley, M.K. Use of Craniometric Data to Facilitate Migrant Identifications at the United States/Mexico Border. Am. J. Phys. Anthropol. 2021, 175, 486–496. [Google Scholar] [CrossRef] [PubMed]
- Manthey, L.; Jantz, R.L.; Bohnert, M.; Jellinghaus, K. Secular Change of Sexually Dimorphic Cranial Variables in Euro-Americans and Germans. Int. J. Legal Med. 2017, 131, 1113–1118. [Google Scholar] [CrossRef] [PubMed]
- Walker, P.L. Sexing Skulls Using Discriminant Function Analysis of Visually Assessed Traits. Am. J. Phys. Anthropol. 2008, 136, 39–50. [Google Scholar] [CrossRef] [PubMed]
- Ousley, S.; Jantz, R.; Freid, D. Understanding Race and Human Variation: Why Forensic Anthropologists Are Good at Identifying Race. Am. J. Phys. Anthropol. 2009, 139, 68–76. [Google Scholar] [CrossRef] [PubMed]
- Hefner, J.T. Cranial Nonmetric Variation and Estimating Ancestry. J. Forensic Sci. 2009, 54, 985–995. [Google Scholar] [CrossRef]
- Buikstra, J.E.; Ubelaker, D.H. Standards for Data Collection from Human Skeletal Remains; Research Series No. 44; Arkansas Archeological Survey: Fayetteville, AR, USA, 1994. [Google Scholar]
- Krüger, G.C.; L’Abbé, E.N.; Stull, K.E.; Kenyhercz, M.W. Sexual Dimorphism in Cranial Morphology among Modern South Africans. Int. J. Legal Med. 2015, 129, 869–875. [Google Scholar] [CrossRef] [Green Version]
- Cappella, A.; Bertoglio, B.; Di Maso, M.; Mazzarelli, D.; Affatato, L.; Stacchiotti, A.; Sforza, C.; Cattaneo, C. Sexual Dimorphism of Cranial Morphological Traits in an Italian Sample: A Population-Specific Logistic Regression Model for Predicting Sex. Biology 2022, 11, 1202. [Google Scholar] [CrossRef]
- Manthey, L.; Jantz, R.L.; Vitale, A.; Cattaneo, C. Population Specific Data Improves Fordisc®’s Performance in Italians. Forensic Sci. Int. 2018, 292, 263.e1–263.e7. [Google Scholar] [CrossRef]
- Boles, T.C.; Snow, C.C.; Stover, E. Forensic DNA Testing on Skeletal Remains from Mass Graves: A Pilot Project in Guatemala. J. Forensic Sci. 1995, 40, 349–355. [Google Scholar] [CrossRef] [PubMed]
- Klonowski, E.; Ferllini, R.E.; Thomas, C.C. Forensic Anthropology in Bosnia and Herzegovina. In Forensic Archaeology and Human Rights Violations; Springer: Berlin/Heidelberg, Germany, 2007. [Google Scholar]
- Mundorff, A.Z.; Shaler, R.; Bieschke, E.; Mar-Cash, E. Marrying Anthropology and DNA: Essential for Solving Complex Commingling Problems in Cases of Extreme Fragmentation. In Recovery, Analysis, and Identification of Commingled Human Remains; Humana Press: Totowa, NJ, USA, 2008; pp. 285–299. [Google Scholar]
- Mundorff, A.Z.; Bartelink, E.J.; Mar-Cash, E. DNA Preservation in Skeletal Elements from the World Trade Center Disaster: Recommendations for Mass Fatality Management. J. Forensic Sci. 2009, 54, 739–745. [Google Scholar] [CrossRef]
- Pilli, E.; Boccone, S.; Agostino, A.; Virgili, A.; D’Errico, G.; Lari, M.; Rapone, C.; Barni, F.; Moggi Cecchi, J.; Berti, A.; et al. From Unknown to Known: Identification of the Remains at the Mausoleum of Fosse Ardeatine. Sci. Justice 2018, 58, 469–478. [Google Scholar] [CrossRef] [PubMed]
- Mincer, H.H.; Harris, E.F.; Berryman, H.E. The A.B.F.O. Study of Third Molar Development and Its Use as an Estimator of Chronological Age. J. Forensic Sci. 1993, 38, 379–390. [Google Scholar] [CrossRef] [Green Version]
- Gamba, C.; Jones, E.R.; Teasdale, M.D.; McLaughlin, R.L.; Gonzalez-Fortes, G.; Mattiangeli, V.; Domboróczki, L.; Kővári, I.; Pap, I.; Anders, A.; et al. Genome Flux and Stasis in a Five Millennium Transect of European Prehistory. Nat. Commun. 2014, 5, 5257. [Google Scholar] [CrossRef] [PubMed] [Green Version]
- Pinhasi, R.; Fernandes, D.; Sirak, K.; Novak, M.; Connell, S.; Alpaslan-Roodenberg, S.; Gerritsen, F.; Moiseyev, V.; Gromov, A.; Raczky, P.; et al. Optimal Ancient DNA Yields from the Inner Ear Part of the Human Petrous Bone. PLoS ONE 2015, 10, e0129102. [Google Scholar] [CrossRef] [PubMed] [Green Version]
- Pilli, E.; Vai, S.; Caruso, M.G.; D’Errico, G.; Berti, A.; Caramelli, D. Neither Femur nor Tooth: Petrous Bone for Identifying Archaeological Bone Samples via Forensic Approach. Forensic Sci. Int. 2018, 283, 144–149. [Google Scholar] [CrossRef]
- Hefner, J.T.; Ousley, S.D. Statistical Classification Methods for Estimating Ancestry Using Morphoscopic Traits. J. Forensic Sci. 2014, 59, 883–890. [Google Scholar] [CrossRef]
- d’Oliveira Coelho, J.; Curate, F.; Navega, D. Osteomics: Decision Support Systems for Forensic Anthropologists. In Statistics and Probability in Forensic Anthropology; Elsevier: Amsterdam, The Netherlands, 2020; pp. 259–273. [Google Scholar]
- Ousley 3skull [Computer Program], Windows Version 2.0.77. 2004. Available online: https://www.statsmachine.net/software/3Skull/videos/ (accessed on 30 January 2023).
- Howells, W.W. Skull Shapes and the Map; Peabody Museum of Archaeology and Ethnology, Harvard University: Cambridge, MA, USA, 1989. [Google Scholar]
- Spradley, K.; Jantz, R. What Are We Really Estimating in Forensic Anthropological Practice, Population Affinity or Ancestry? Forensic Anthropol. 2022, 4, 309–318. [Google Scholar] [CrossRef]
- Weiner, J.S.; Huizinga, J. (Eds.) Gower Measures of Taxonomic Distance and Their Analysis. In The Assessment of Population Affinities in Man; Oxford Clarenden Press: Oxford, UK, 1972; pp. 1–24. [Google Scholar]
- Sirak, K.A.; Fernandes, D.M.; Cheronet, O.; Novak, M.; Gamarra, B.; Balassa, T.; Bernert, Z.; Cséki, A.; Dani, J.; Gallina, J.Z.; et al. A Minimally-Invasive Method for Sampling Human Petrous Bones from the Cranial Base for Ancient DNA Analysis. Biotechniques 2017, 62, 283–289. [Google Scholar] [CrossRef] [Green Version]
- Dabney, J.; Knapp, M.; Glocke, I.; Gansauge, M.-T.; Weihmann, A.; Nickel, B.; Valdiosera, C.; García, N.; Pääbo, S.; Arsuaga, J.-L.; et al. Complete Mitochondrial Genome Sequence of a Middle Pleistocene Cave Bear Reconstructed from Ultrashort DNA Fragments. Proc. Natl. Acad. Sci. USA 2013, 110, 15758–15763. [Google Scholar] [CrossRef] [PubMed] [Green Version]
- Meyer, M.; Kircher, M. Illumina Sequencing Library Preparation for Highly Multiplexed Target Capture and Sequencing. Cold Spring Harb. Protoc. 2010, 2010, pdb.prot5448. [Google Scholar] [CrossRef] [PubMed]
- Kircher, M.; Sawyer, S.; Meyer, M. Double Indexing Overcomes Inaccuracies in Multiplex Sequencing on the Illumina Platform. Nucleic Acids Res. 2012, 40, e3. [Google Scholar] [CrossRef] [PubMed] [Green Version]
- Rohland, N.; Harney, E.; Mallick, S.; Nordenfelt, S.; Reich, D. Partial Uracil–DNA–Glycosylase Treatment for Screening of Ancient DNA. Philos. Trans. R. Soc. B Biol. Sci. 2015, 370, 20130624. [Google Scholar] [CrossRef]
- Peltzer, A.; Jäger, G.; Herbig, A.; Seitz, A.; Kniep, C.; Krause, J.; Nieselt, K. EAGER: Efficient Ancient Genome Reconstruction. Genome Biol. 2016, 17, 60. [Google Scholar] [CrossRef] [Green Version]
- Li, H.; Durbin, R. Fast and Accurate Short Read Alignment with Burrows-Wheeler Transform. Bioinformatics 2009, 25, 1754–1760. [Google Scholar] [CrossRef] [PubMed] [Green Version]
- Jónsson, H.; Ginolhac, A.; Schubert, M.; Johnson, P.L.F.; Orlando, L. MapDamage2.0: Fast Approximate Bayesian Estimates of Ancient DNA Damage Parameters. Bioinformatics 2013, 29, 1682–1684. [Google Scholar] [CrossRef] [PubMed]
- Skoglund, P.; Storå, J.; Götherström, A.; Jakobsson, M. Accurate Sex Identification of Ancient Human Remains Using DNA Shotgun Sequencing. J. Archaeol. Sci. 2013, 40, 4477–4482. [Google Scholar] [CrossRef]
- Patterson, N.; Price, A.L.; Reich, D. Population Structure and Eigenanalysis. PLoS Genet. 2006, 2, e190. [Google Scholar] [CrossRef]
- Li, H.; Handsaker, B.; Wysoker, A.; Fennell, T.; Ruan, J.; Homer, N.; Marth, G.; Abecasis, G.; Durbin, R. The Sequence Alignment/Map Format and SAMtools. Bioinformatics 2009, 25, 2078–2079. [Google Scholar] [CrossRef] [Green Version]
- Brandon, M.C.; Ruiz-Pesini, E.; Mishmar, D.; Procaccio, V.; Lott, M.T.; Nguyen, K.C.; Spolim, S.; Patil, U.; Baldi, P.; Wallace, D.C. MITOMASTER: A Bioinformatics Tool for the Analysis of Mitochondrial DNA Sequences. Hum. Mutat. 2009, 30, 1–6. [Google Scholar] [CrossRef] [PubMed] [Green Version]
- Ruiz-Pesini, E.; Lott, M.T.; Procaccio, V.; Poole, J.C.; Brandon, M.C.; Mishmar, D.; Yi, C.; Kreuziger, J.; Baldi, P.; Wallace, D.C. An Enhanced MITOMAP with a Global MtDNA Mutational Phylogeny. Nucleic Acids Res. 2007, 35, D823–D828. [Google Scholar] [CrossRef] [PubMed] [Green Version]
- Parson, W.; Dür, A. EMPOP—A Forensic MtDNA Database. Forensic Sci. Int. Genet. 2007, 1, 88–92. [Google Scholar] [CrossRef]
- Ralf, A.; Montiel González, D.; Zhong, K.; Kayser, M. Yleaf: Software for Human Y-Chromosomal Haplogroup Inference from Next-Generation Sequencing Data. Mol. Biol. Evol. 2018, 35, 1291–1294. [Google Scholar] [CrossRef] [PubMed]
- Klales, A.R.; Cole, S.J. Improving Nonmetric Sex Classification for Hispanic Individuals. J. Forensic Sci. 2017, 62, 975–980. [Google Scholar] [CrossRef] [PubMed]
- Underhill, P.A.; Shen, P.; Lin, A.A.; Jin, L.; Passarino, G.; Yang, W.H.; Kauffman, E.; Bonné-Tamir, B.; Bertranpetit, J.; Francalacci, P.; et al. Y Chromosome Sequence Variation and the History of Human Populations. Nat. Genet. 2000, 26, 358–361. [Google Scholar] [CrossRef] [PubMed]
- Wood, E.T.; Stover, D.A.; Ehret, C.; Destro-Bisol, G.; Spedini, G.; McLeod, H.; Louie, L.; Bamshad, M.; Strassmann, B.I.; Soodyall, H.; et al. Contrasting Patterns of Y Chromosome and MtDNA Variation in Africa: Evidence for Sex-Biased Demographic Processes. Eur. J. Hum. Genet. 2005, 13, 867–876. [Google Scholar] [CrossRef]
- Naidoo, T.; Schlebusch, C.M.; Makkan, H.; Patel, P.; Mahabeer, R.; Erasmus, J.C.; Soodyall, H. Development of a Single Base Extension Method to Resolve Y Chromosome Haplogroups in Sub-Saharan African Populations. Investig. Genet. 2010, 1, 6. [Google Scholar] [CrossRef] [Green Version]
- Hallast, P.; Agdzhoyan, A.; Balanovsky, O.; Xue, Y.; Tyler-Smith, C. A Southeast Asian Origin for Present-Day Non-African Human Y Chromosomes. Hum. Genet. 2021, 140, 299–307. [Google Scholar] [CrossRef]
- Sahakyan, H.; Margaryan, A.; Saag, L.; Karmin, M.; Flores, R.; Haber, M.; Kushniarevich, A.; Khachatryan, Z.; Bahmanimehr, A.; Parik, J.; et al. Origin and Diffusion of Human Y Chromosome Haplogroup J1-M267. Sci. Rep. 2021, 11, 6659. [Google Scholar] [CrossRef]
- van Oven, M.; Kayser, M. Updated Comprehensive Phylogenetic Tree of Global Human Mitochondrial DNA Variation. Hum. Mutat. 2009, 30, E386–E394. [Google Scholar] [CrossRef] [PubMed]
- Maier, P.A.; Runfeldt, G.; Estes, R.J.; Vilar, M.G. African Mitochondrial Haplogroup L7: A 100,000-Year-Old Maternal Human Lineage Discovered through Reassessment and New Sequencing. Sci. Rep. 2022, 12, 10747. [Google Scholar] [CrossRef] [PubMed]
- Pala, M.; Olivieri, A.; Achilli, A.; Accetturo, M.; Metspalu, E.; Reidla, M.; Tamm, E.; Karmin, M.; Reisberg, T.; Kashani, B.H.; et al. Mitochondrial DNA Signals of Late Glacial Recolonization of Europe from Near Eastern Refugia. Am. J. Hum. Genet. 2012, 90, 915–924. [Google Scholar] [CrossRef] [PubMed] [Green Version]
- Poznik, G.D.; Henn, B.M.; Yee, M.-C.; Sliwerska, E.; Euskirchen, G.M.; Lin, A.A.; Snyder, M.; Quintana-Murci, L.; Kidd, J.M.; Underhill, P.A.; et al. Sequencing Y Chromosomes Resolves Discrepancy in Time to Common Ancestor of Males Versus Females. Science 2013, 341, 562–565. [Google Scholar] [CrossRef] [PubMed] [Green Version]
- Malyarchuk, B.; Derenko, M.; Perkova, M.; Vanecek, T. Mitochondrial Haplogroup U2d Phylogeny and Distribution. Hum. Biol. 2008, 80, 565–571. [Google Scholar] [CrossRef]
- Kivisild, T.; Reidla, M.; Metspalu, E.; Rosa, A.; Brehm, A.; Pennarun, E.; Parik, J.; Geberhiwot, T.; Usanga, E.; Villems, R. Ethiopian Mitochondrial DNA Heritage: Tracking Gene Flow Across and Around the Gate of Tears. Am. J. Hum. Genet. 2004, 75, 752–770. [Google Scholar] [CrossRef] [Green Version]
- Thomas, R.M.; Parks, C.L.; Richard, A.H. Accuracy Rates of Sex Estimation by Forensic Anthropologists through Comparison with DNA Typing Results in Forensic Casework. J. Forensic Sci. 2016, 61, 1307–1310. [Google Scholar] [CrossRef]
- Thomas, R.M.; Parks, C.L.; Richard, A.H. Accuracy Rates of Ancestry Estimation by Forensic Anthropologists Using Identified Forensic Cases. J. Forensic Sci. 2017, 62, 971–974. [Google Scholar] [CrossRef]
- Rösing, F.W.; Graw, M.; Marré, B.; Ritz-Timme, S.; Rothschild, M.A.; Rötzscher, K.; Schmeling, A.; Schröder, I.; Geserick, G. Recommendations for the Forensic Diagnosis of Sex and Age from Skeletons. HOMO 2007, 58, 75–89. [Google Scholar] [CrossRef]
- Christensen, A.; Passalacqua, N.V.; Bartelink, E.J. Forensic Anthropology: Current Methods and Practice, 2nd ed.; Academic Press: New York, NY, USA, 2019. [Google Scholar]
- Thomas, R.M. Sex Determination Using DNA and Its Impact on Biological Anthropology. In Sex Estimation of the Human Skeleton; Elsevier: Amsterdam, The Netherlands, 2020. [Google Scholar]
- Komar, D.A.; Grivas, C. Manufactured Populations: What Do Contemporary Reference Skeletal Collections Represent? A Comparative Study Using the Maxwell Museum Documented Collection. Am. J. Phys. Anthropol. 2008, 137, 224–233. [Google Scholar] [CrossRef]
- Alladio, E.; Poggiali, B.; Cosenza, G.; Pilli, E. Multivariate Statistical Approach and Machine Learning for the Evaluation of Biogeographical Ancestry Inference in the Forensic Field. Sci. Rep. 2022, 12, 8974. [Google Scholar] [CrossRef] [PubMed]
- Pilli, E.; Morelli, S.; Poggiali, B.; Alladio, E. Biogeographical Ancestry, Variable Selection, and PLS-DA Method: A New Panel to Assess Ancestry in Forensic Samples via MPS Technology. Forensic Sci. Int. Genet. 2023, 62, 102806. [Google Scholar] [CrossRef] [PubMed]


 , male/female and female/male;
  , male;
  , female.
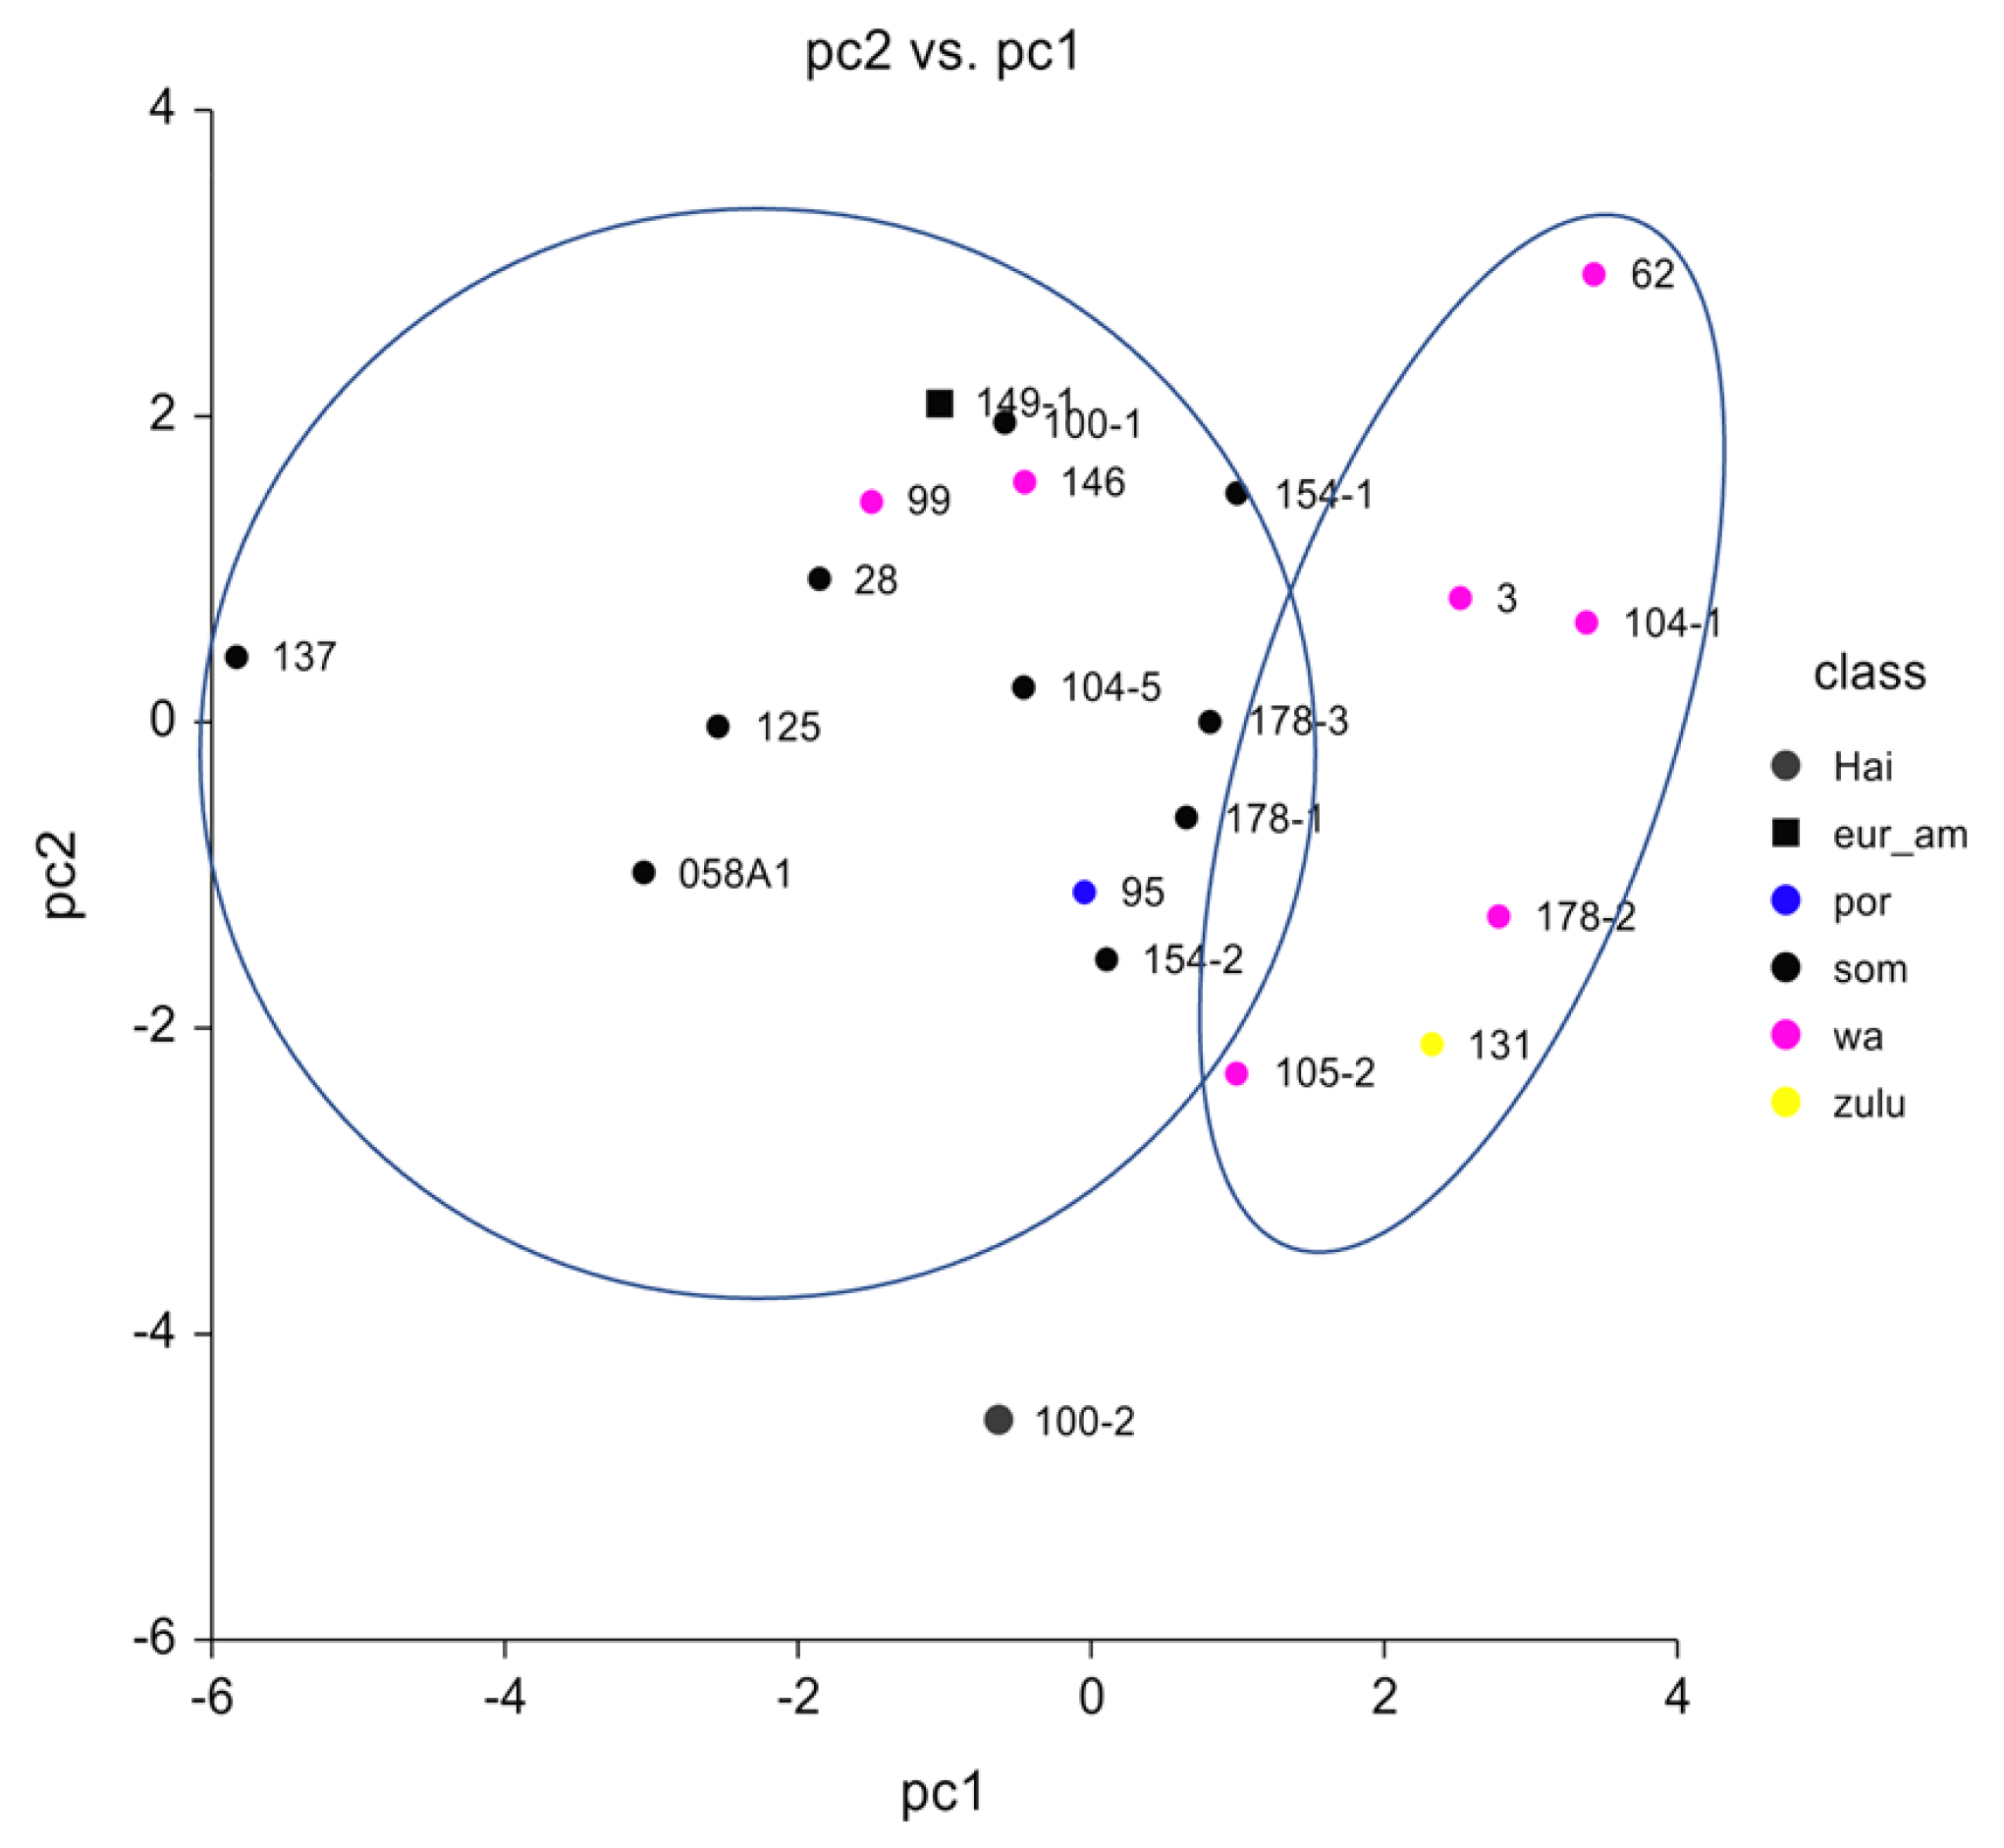
 , African;
  , West African;
  , Zulu;
  , Somali;
  , Portuguese;
  , Euro-American;
  , Hainan (Asia);
  , Afro-American.
, African; , West African; , Zulu; , Somali; , Portuguese; , Euro-American; , Hainan (Asia); , Afro-American.
, Afro-American.
, African; , West African; , Zulu; , Somali; , Portuguese; , Euro-American; , Hainan (Asia); , Afro-American.
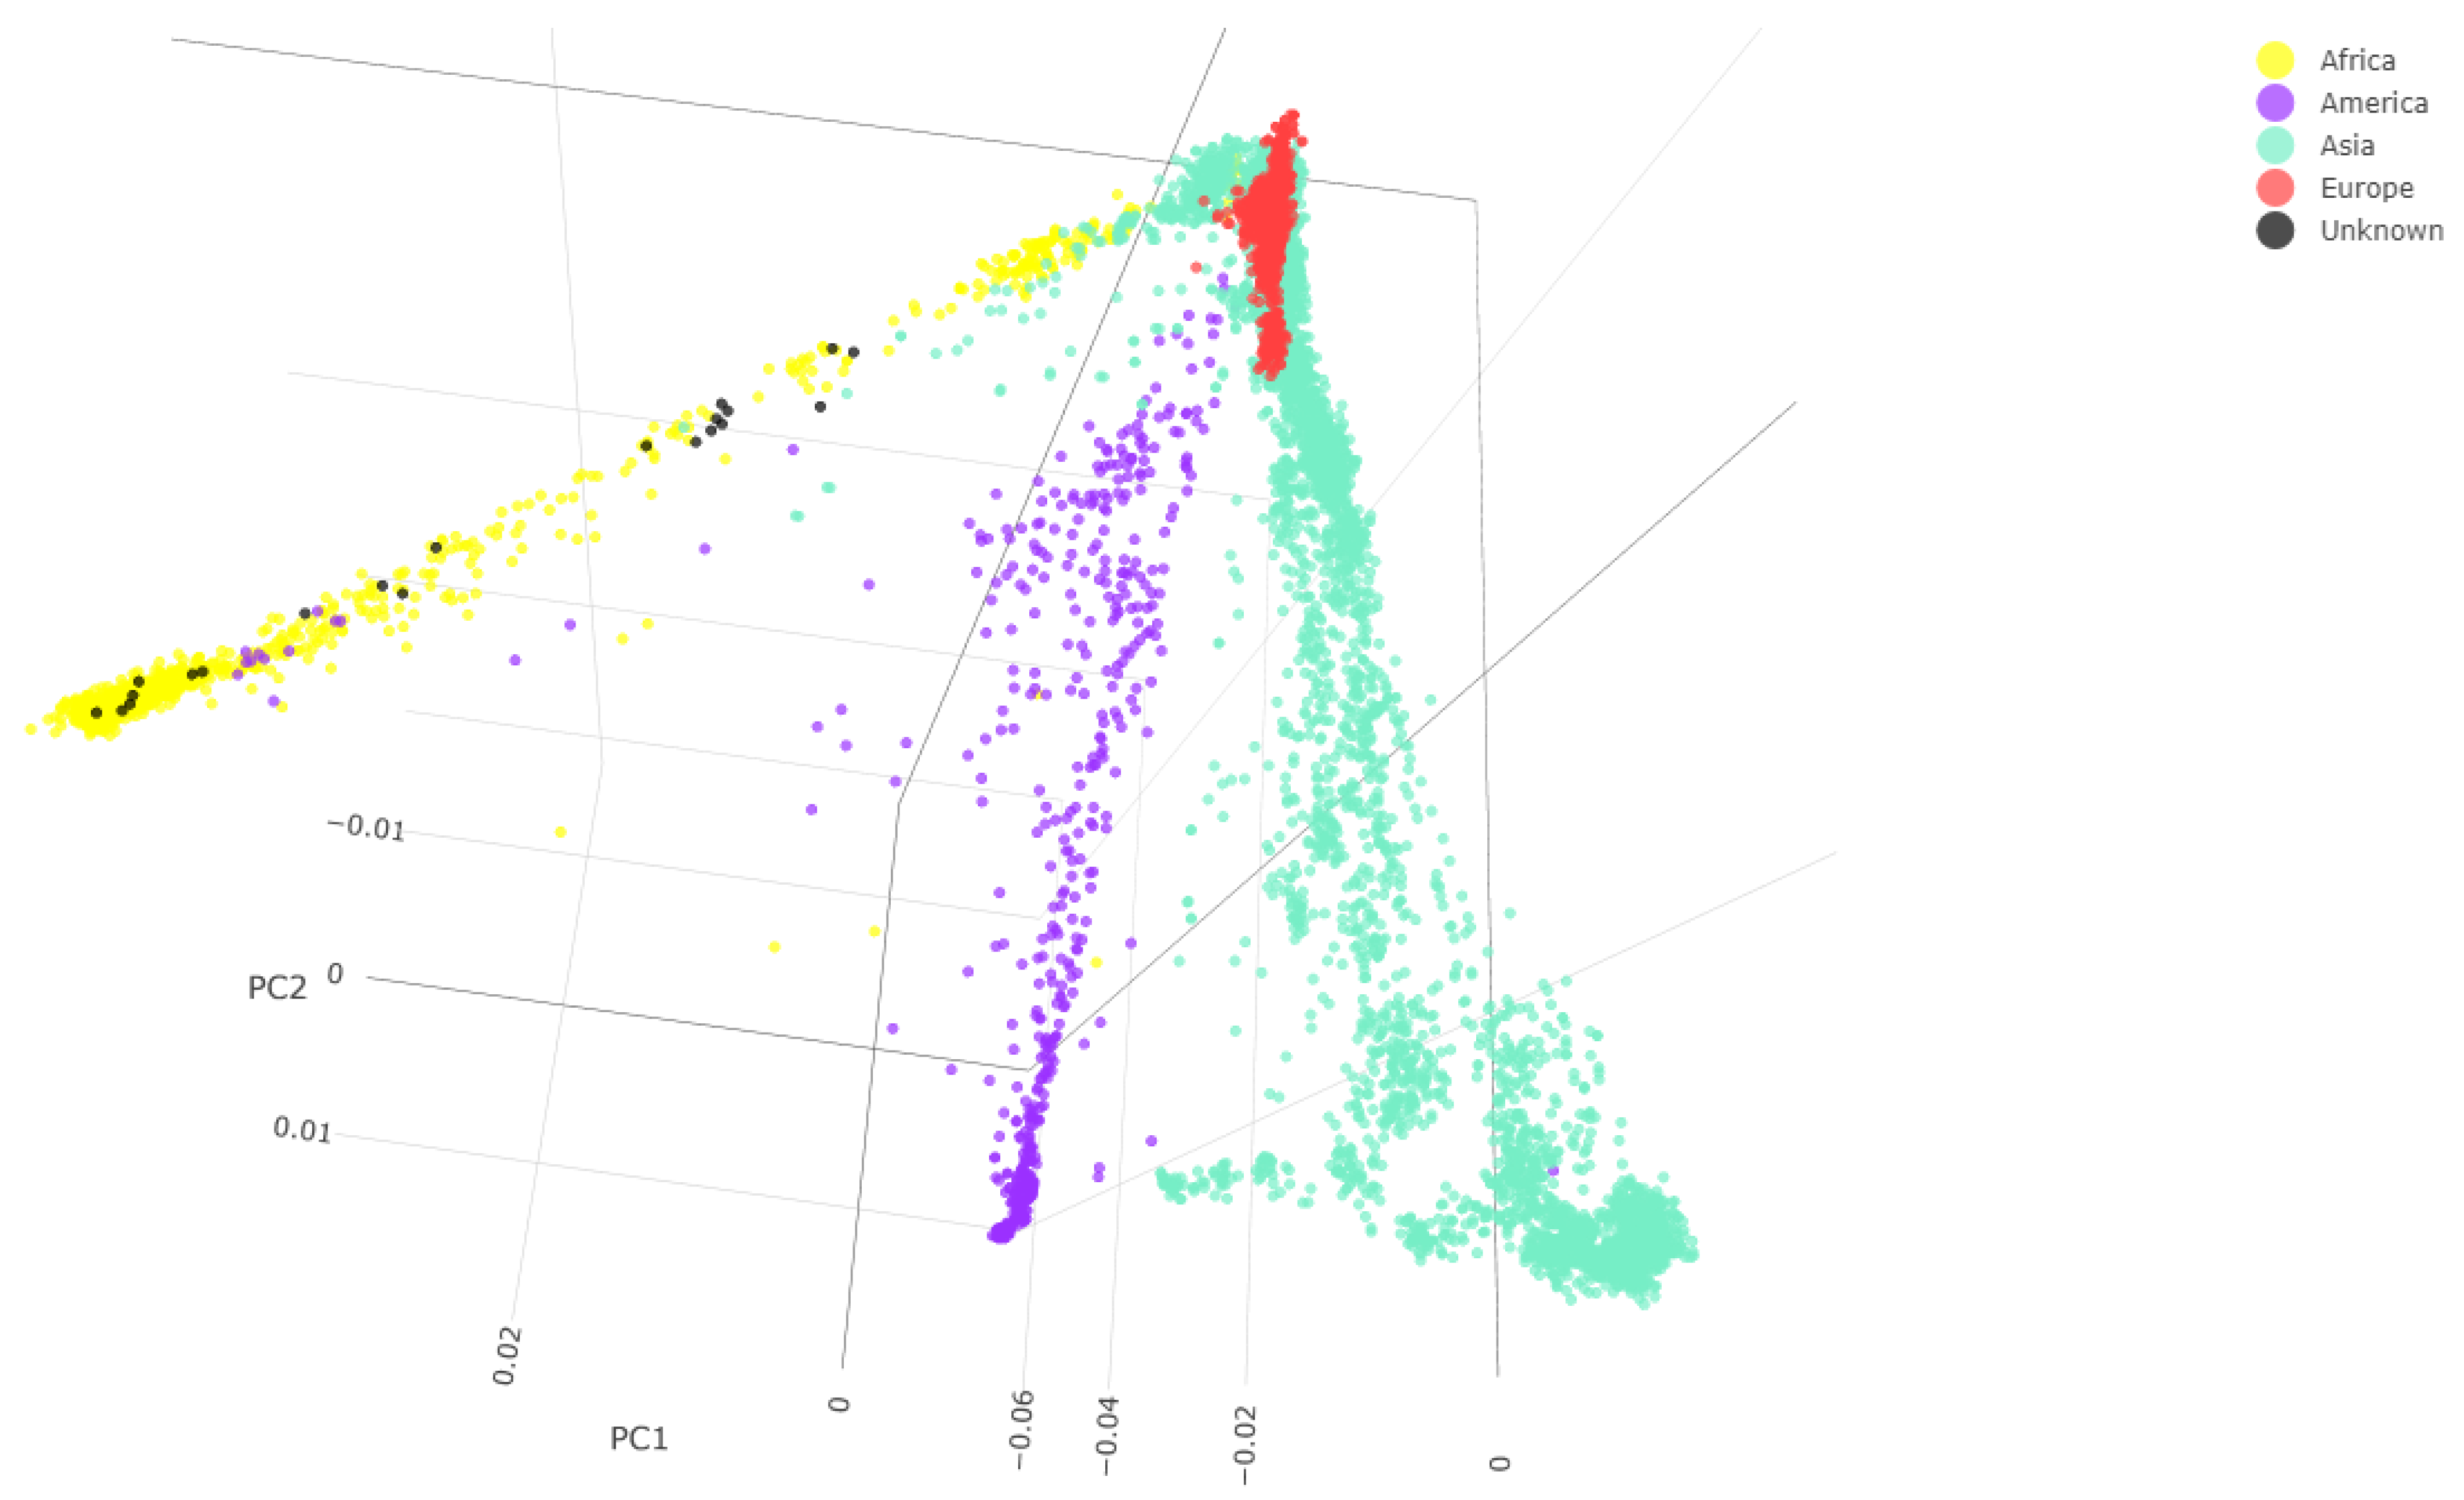
| ID Samples | ASNPs 597573 | PCA Result |
|---|---|---|
| 003 | 51,100 | Africa |
| 028 | 30,842 | Africa |
| 058 A1 | 163,213 | Africa |
| 062 | 406,751 | Africa |
| 095 | 128,947 | Africa |
| 099 | 197,047 | Africa |
| 100-1 | 184,076 | Africa |
| 100-2 | 124,672 | Africa |
| 104-1 | 140,034 | Africa |
| 104-5 | 89,217 | Africa |
| 105-2 | 205,032 | Africa |
| 125 | 177,666 | Africa |
| 131 | 561,124 | Africa |
| 137 | 147,779 | Africa |
| 146 | 224,868 | Africa |
| 149-1 | 580,917 | Africa |
| 154-1 | 139,467 | Africa |
| 154-2 | 164,138 | Africa |
| 178-1 | 165,037 | Africa |
| 178-2 | 66,289 | Africa |
| 178-3 | 188,702 | Africa |
| ID Sample | Number of Reads (ChrY) | SNP (Yleaf) | Haplogroup (Yleaf) | QC Scores |
|---|---|---|---|---|
| 003 | 15,483 | 2498 | B2a1a1a1 | 1.0 |
| 028 | 9467 | 1363 | J1a2a1a | 1.0 |
| 058 A1 | 581,646 | 9380 | E1b1b1b2a1a1a1a | 0.0 |
| 062 | 672,312 | 26,382 | E1a2a | 0.846 |
| 095 | 38,448 | 5903 | E1b1b1b1b1a | 1.0 |
| 099 | 47,585 | 9922 | A1b1b2b2~ | 0.0 |
| 100-1 | 54,206 | 8700 | E1b1a1a1a1c2c3a1b | 0.0 |
| 100-2 | 33,706 | 5793 | E1b1b1a1a1b1a | 0.99 |
| 104-1 | 40,152 | 6489 | J1a2a1a2d2b2b2c4d2a2a5a1c | 0.992 |
| 104-5 | 21,882 | 3849 | A1b1b2b~ | 0.0 |
| 105-2 | 62,940 | 9998 | E1b1a1a1a1c1b2a | 1.0 |
| 125 | 51,004 | 8626 | J1a2a1a1a | 1.0 |
| 131 | 1,458,353 | 46,817 | E1b1a1a1a1c2~ | 0.956 |
| 137 | 39,324 | 7032 | E1b1b1b2a1a1a1a1a~ | 1.0 |
| 146 | 68,090 | 11,144 | J1a2a1a2d2b2b2c4d1a1a1 | 0.971 |
| 149-1 | 2,013,574 | 52,816 | E1b1b1a1a1b1 | 0.991 |
| 154-1 | 38,776 | 6300 | E1b1a1a1a1c2c3a2a | 1.0 |
| 154-2 | 47,774 | 7709 | E1b1a1a1a1c1b | 1.0 |
| 178-1 | 49,253 | 7946 | E1a2b1a2 | 0.815 |
| 178-2 | 36,180 | 3093 | E1a2b1a2 | 0.95 |
| 178-3 | 55,083 | 8982 | E1b1a1a1a1c2 | 1.0 |
| World Distribution of Y Full Heatmap | ||||
|---|---|---|---|---|
| ID Sample | Haplogroup Yfull | Purple Zone | Orange Zone | Light Yellow Zone |
| 003 | B-M5844 | Saudi Arabia | Kuwait | United States; Jordan; Israel; Qatar; United Arab Emirates; Egypt; Sudan; Chad; Central African Rep.; Cameroon; Kenya; South African |
| 028 | J1 | Saudi Arabia | Most of America, Asia and Europe; North-East Africa and Oceania | |
| 058 A1 | E-P147 | Saudi Arabia | United States; Yemen; Algeria; Gambia; Nigeria; Italy; Kuwait; United Arab Emirates; Albania; United Kingdom | Asia; Europe; Most of Africa; Canada; Most of Latin America |
| 062 | E-CTS736 | Nigeria; Saudi Arabia | ||
| 095 | E-Y141678 | Morocco | Jordan | Mali |
| 099 | A-Y24713 | Saudi Arabia | Ethiopia | Yemen |
| 100-1 | E-Z6015 | Gambia | Spain | Morocco; Sierra Leone |
| 100-2 | E-CTS2294 | Somalia | Chad; Ethiopia; Kenya | Cameroon; Sudan; Egypt; Libya; Eritrea; Yemen; Iraq; Jordan |
| 104-1 | J-P56 | Saudi Arabia | Yemen; Ethiopia | Eritrea; Egypt; Iran; Kuwait; Bahrain; United Arab Emirates |
| 104-5 | A-Y23655 | Saudi Arabia | Ethiopia | Yemen; Sudan |
| 105-2 | E-FT212537 | Saudi Arabia | ||
| 125 | J-P56 | Saudi Arabia | Yemen; Ethiopia | Eritrea; Egypt; Iran; Kuwait; Bahrain; United Arab Emirates |
| 131 | E-CTS9883 | Gambia | Sierra Leone; Senegal | Guinea; Algeria; Morocco; Egypt; Saudi Arabia; Spain |
| 137 | E-Y160200 | Yemen | Egypt; Saudi Arabia; Oman | |
| 146 | J-Z18257 | Yemen | Saudi Arabia | Algeria |
| 149-1 | E-Y205079 | Saudi Arabia; Ethiopia | ||
| 154-1 | E-Z6018 | Gambia | ||
| 154-2 | E-L515 | United States; Sierra Leone | Nigeria; Saudi Arabia | Morocco; Niger; Burkina Faso; Ghana; Cameroon; United Kingdom |
| 178-1 | E-Z5987 | Gambia | ||
| 178-2 | E-Z5987 | Gambia | ||
| 178-3 | E-CTS9883 | Gambia | Sierra Leone | United States; Mexico; Senegal; Guinea; Morocco; Algeria; Egypt; Saudi Arabia; Spain |
| ID Sample | Number of Reads (MT) | Haplogroup (Mitomaster) |
|---|---|---|
| 003 | 5054 | L3e (L3b1b) |
| 028 | 4167 | L2a (L2a1+143+16189 (16192)) |
| 058 A1 | 51,729 | T1a |
| 062 | 171,521 | L3b (L3b1a+@16124) |
| 095 | 12,327 | L2c (L2c) |
| 099 | 11,837 | L3i |
| 100-1 | 12,939 | L3b (L3b1a) |
| 100-2 | 10,057 | L0a (L0a1a+200) |
| 104-1 | 15,459 | L5b (L5b1) |
| 104-5 | 9498 | U2d (U2d) |
| 105-2 | 14,120 | L3e (L3e2a) |
| 125 | 14,930 | L3i (L3i2) |
| 131 | 285,062 | L2a (L2a1c) |
| 137 | 9793 | L2a (L2a1j) |
| 146 | 19,302 | L2a (L2a1c) |
| 149-1 | 492,088 | L3x (L3 × 1b) |
| 154-1 | 11,931 | L2a (L2a1c) |
| 154-2 | 15,427 | L3f (L3f1b4a) |
| 178-1 | 11,802 | L3b (L3b1a+@16124) |
| 178-2 | 7010 | L3b (L3b1a+@16124) |
| 178-3 | 13,914 | L2a1a1 |
| World Distribution of EMPOP Heatmap | |||||
|---|---|---|---|---|---|
| ID Sample | Haplogroup EMPOP | Red Zone | Orange Zone | Yellow Zone | Blue Zone |
| 003 | L3b1b | Morocco | United States | ||
| 028 | La2a1+143+16189 (16192) | Somalia | United States | Morocco; Senegal; Gambia; Sierra Leone; Liberia; Burkina Faso; Ghana; Togo; Benin | United States |
| 058 A1 | T1a | Europe | Middle East | United States | United States |
| 062 | (L3b1a+@16124) | United States; Spain; Portugal | Morocco; Ghana; Togo; Benin | Middle East; Egypt; Brazil; Venezuela | |
| 095 | L2c | United States; Spain; Portugal; Senegal; Gambia | Morocco; Guinea; Sierra Leone; Cote d’Ivoire; Ghana; Togo | Brazil | United States |
| 099 | L3i1a | Somalia; Uganda; Middle East; | |||
| 100-1 | L3b | United States; Spain; Portugal; Morocco; Cote d’Ivoire; Burkina Faso; Ghana; Togo; Kenya; Uganda | Senegal; Gambia; Guinea | Cuba; Brazil | United Stated; Middle East; Egypt |
| 100-2 | (L0a1a+200) | United States (Los Angeles) | Most of United States; Egypt; Senegal; Gambia; Somalia; Kenya | Part of the United States; Brazil; Nigeria; Cameroon; Gabon; Middle East | |
| 104-1 | (L5b1) | Uganda | Egypt | ||
| 104-5 | (U2d) | Portugal; Spain; Southern Europe; Turkey; Syria | Middle East; United States; Argentina; Uruguay | ||
| 105-2 | L3e2 | United States; Brazil; Portugal; Spain; Cote d’Ivoire; Ghana; Togo; Benin | Middle East; Kenya; Uganda; Nigeria; Cameroon; Gabon | ||
| 125 | (L3i2) | Somalia | United States; Middle East; Uganda; Kenya | ||
| 131 | L2a1+143 | United States; Cote d’Ivoire; Ghana; Togo; Benin; Somalia | Portugal; Spain; Morocco | Brazil; Uganda; Little part of the Middle East | Egypt; Middle East; Southern Europe |
| 137 | L2a1+144 | United States; Cote d’Ivoire; Ghana; Togo; Benin; Somalia | Portugal; Spain; Morocco; Senegal; Gambia; | Brazil; Uganda; Little part of the Middle East; Brazil | Egypt; Middle East; Southern Europe |
| 146 | L2a1 | United States; Cote d’Ivoire; Ghana; Togo; Benin; Portugal; Spain | Brazil | Senegal; Gambia; Guinea; Little part of the Middle East; Somalia | Egypt; Middle East; Tunisia; Uganda; Kenya; Southern Europe |
| 149-1 | L3x (L3x1b) | Somalia | Saudi Arabia | Little part of the Middle East | |
| 154-1 | L2a1+143 | United States; Cote d’Ivoire; Ghana; Togo; Benin; Somalia | Portugal; Spain; Morocco; | Senegal; Gambia; Guinea; Brazil; Uganda; Little part of the Middle East; Brazil | Middle East; Southern Europe; Egypt |
| 154-2 | L3f1b4 | Brazil | United States; Portugal; Spain | Gabon | Cameroon; Nigeria; Cote d’Ivoire; Burkina Faso; Ghana; Togo; Benin; Uganda; Kenya; United Arab Emirates; Little Part of Europe |
| 178-1 | (L3b1a+@16124) | United States; Portugal; Spain | Ghana; Togo; Benin; Morocco | Brazil; Nigeria; Egypt; Middle East | |
| 178-2 | (L3b1a+@16124) | United States; Portugal; Spain | Ghana; Togo; Benin; Morocco | Brazil; Nigeria; Egypt; Middle East | |
| 178-3 | L2a1a2 | United States | Portugal | Gabon | Cameroon; Nigeria; Cote d’Ivoire; Burkina Faso; Ghana; Togo; Benin; Uganda; Kenya; |
Disclaimer/Publisher’s Note: The statements, opinions and data contained in all publications are solely those of the individual author(s) and contributor(s) and not of MDPI and/or the editor(s). MDPI and/or the editor(s) disclaim responsibility for any injury to people or property resulting from any ideas, methods, instructions or products referred to in the content. |
© 2023 by the authors. Licensee MDPI, Basel, Switzerland. This article is an open access article distributed under the terms and conditions of the Creative Commons Attribution (CC BY) license (https://creativecommons.org/licenses/by/4.0/).
Share and Cite
Pilli, E.; Palamenghi, A.; Morelli, S.; Mazzarelli, D.; De Angelis, D.; Jantz, R.L.; Cattaneo, C. How Physical and Molecular Anthropology Interplay in the Creation of Biological Profiles of Unidentified Migrants. Genes 2023, 14, 706. https://doi.org/10.3390/genes14030706
Pilli E, Palamenghi A, Morelli S, Mazzarelli D, De Angelis D, Jantz RL, Cattaneo C. How Physical and Molecular Anthropology Interplay in the Creation of Biological Profiles of Unidentified Migrants. Genes. 2023; 14(3):706. https://doi.org/10.3390/genes14030706
Chicago/Turabian StylePilli, Elena, Andrea Palamenghi, Stefania Morelli, Debora Mazzarelli, Danilo De Angelis, Richard L. Jantz, and Cristina Cattaneo. 2023. "How Physical and Molecular Anthropology Interplay in the Creation of Biological Profiles of Unidentified Migrants" Genes 14, no. 3: 706. https://doi.org/10.3390/genes14030706