
Field Determination of Unsaturated Permeability and Flow Properties through Subgrade Instrumentation


1
College of Engineering, SUNY Polytechnic Institute, Utica, NY 13502, USA
2
Department of Civil Engineering, University of Texas at Arlington, Arlington, TX 76010, USA
*
Author to whom correspondence should be addressed.
Geosciences 2022, 12(2), 95; https://doi.org/10.3390/geosciences12020095
Submission received: 29 January 2022
/
Revised: 10 February 2022
/
Accepted: 16 February 2022
/
Published: 18 February 2022
(This article belongs to the Special Issue Slope Stability Analyses and Remedial Measure of Failed Slopes)
Abstract
:Due to the representation of a particular field condition of soil rather than the real time scenario from laboratory experiments, the selection of unsaturated permeability and flow parameters becomes challenging when conducting numerical modeling. Keeping this in mind, the objective of the study was to determine the permeability in both directions along with the unsaturated flow parameters from field data. Although it is conventional to determine the flow parameters from the curve fitting of laboratory results, a novel approach was carried out during the course of study, wherein field soil water characteristic curves were used to determine the unsaturated flow parameters. Two two-lane roads in Kaufman County and Ellis County, Texas were selected for data acquisition and monitoring in this study. For the investigation of in situ moisture content and matric suction, soil moisture and suction sensors were installed at up to a depth of 4.5 m into the ground, while the precipitation was recorded using rain gauges installed at the sites. Field determination yielded hydraulic conductivity values in the range of 10−4 to 10−5 m/s, representing the rapid flow of water due to desiccation cracks on expansive soil. Field-generated unsaturated flow parameters also indicated variability while constructing the SWCC. Finally, PLAXIS 2D was used for the transient flow analysis. The close agreement of the FE results with the direct field measurements validated the estimated flow parameters. The approach described in the study can be used for determining permeability and unsaturated flow parameter values from field data, which offers a dynamic situation in contrast to the static laboratory condition.
1. Introduction
Expansive soils, which are usually clayey in nature, have a tendency of undergoing shrinkage and swelling due to moisture variation. The stresses developed during the process result in cracking and settlement in the pavement [1,2] as the moisture content variation alters the geotechnical properties of soil. Eventually, the service life of the pavement is shortened. The cost of the damage caused by expansive clay ranges between USD 9 to USD 15 billion as reported by previous studies [3,4]. In addition, 25% of the annual maintenance and repair budget of the Texas Department of Transportation is invested in the repair and maintenance of damaged pavements due to expansive soil [5]. As such, severe pavement cracking can result in maintenance costs higher than the cost of construction [6]. With the identification of moisture variation as one of the major causes of pavement distresses [7,8], in situ permeability can be considered an important indicator for a proper understanding of moisture-flow dynamics beneath the pavement. Many researchers [9,10] have carried out field-based analyses to correlate subgrade characteristics and environmental factors in order to incorporate the variation in moisture into the design. Numerical modeling has appeared as a recent development in the process of providing additional information on volumetric deformation. Based on infinite slab and other idealized assumptions, the finite element method (FEM) can be used to analyze the effect of many practical conditions, which are more realistic than theoretical solutions [11]. Hedayati (2014) studied both unsaturated moisture diffusion and volume change in the expansive subgrade [12]. Hasem et al., (2013) simulated the behavior of flexible pavement construction on expansive soil using numerical modeling by PLAXIS 2D software [13]. Djellali et al., (2012) concluded that the combined Mohr–Coulomb model and Soft Soil Model showed the majority of displacements in the pavement of Algeria to have taken place in the shoulder side of the pavement after a numerical modeling analysis [2]. Generally, there is a trend to use laboratory tested values in numerical modeling since the field-based values are difficult to access. However, the use of such soil parameters considers just the specific condition at which the laboratory testing is conducted. As such, it does not take into consideration the external factors, such as climatic factors. Consequently, there is less chance of fully understanding the actual behavior of the pavement built on expansive soil. Therefore, the use of field-based soil parameters in numerical modeling is a necessity as well as a challenge. The current study is based on field instrumentation and a numerical analysis for examining the moisture and matric suction variation of expansive soil two highways in North Texas designated as SH 342 and FM 2757, for which moisture and suction sensors were installed at different depths. The objective of the study is to determine the flow parameters and permeability for numerical modeling. Field data, unsaturated flow parameters and unsaturated soil permeability were used for FEM analysis in the PLAXIS 2D environment in the flow mode. Finally, the results from FE were compared with the field data. The approach undertaken in the study can be applicable for unsaturated flow parameters and permeability determination in various geotechnical applications, i.e., slope stability and subgrade moisture modeling.
2. Background of the Study
Field-based parameters, capturing the actual condition of the field, are required for numerical modeling. However, laboratory tested values are used instead due to the difficulty in accessing the field parameters. For instance, Hedayati et al., (2014) used the saturated permeability value of 3.54 × 10⁻⁶ m/s for the numerical modeling [14] of expansive subgrades even though the pavement subgrade remained unsaturated most of the time [15]. The laboratory specimens were tested in specific conditions and thus the seasonal variation that the soil may undergo in real field was not taken into account. The seasonal swelling and shrinking of expansive soil results in a change in hydraulic conductivity and the flow parameters of soil, which is further elucidated in the section below.
2.1. Unsaturated Hydraulic Conductivity
Permeability is the ease with which water can pass through the soil and with which it is affected by the interconnected void space [16]. With the formation of desiccation cracks, the permeability of expansive soil changes [17]. Previous research indicated that the flow mechanism of clayey soil changed due to cracks. Hossain (2012) used the laboratory saturated hydraulic conductivity value of 3.5 × 10⁻⁹ m/s for both the horizontal and vertical permeability and found differences between the field and a numerical analysis [18]. The vertical and horizontal permeability, in fact, may not be the same in the field. Zhan et al., (2007) increased the infiltration rate in open cracks based on an infiltrometer test [19] and stated that values of permeability are reduced at the crest of the slope. The test result of Favre et al., (1997) indicated that there was a change in saturation level after rainfall [20]. As such, the laboratory test did not take into account those issues and provided the values in a controlled condition. However, Hossain (2012) obtained better results with the reduced values at the crest of the slope; however, they were not in full agreement with the field condition. Eventually, he performed the analysis with three different permeability values of 3.54 × 10⁻⁶ m/s, 3.54 × 10⁻⁷ m/s, and 3.54 × 10⁻⁸ m/s in the top 3 m of soil for higher permeability. Khan et al., (2017) conducted a flow analysis on a cracked highway slope [21], during which the authors related the wetting and drying cycle of expansive soil to the wetting and drying test performed by Albrecht and Benson (2001). Albrecht and Benson (2001) reported that the flow can increase up to 500 times after drying clayey soil with a change in permeability [22]. As cracks open up in drying weather, new flow channels are formed, which increase the flow of water. Omidi et al., (1996) also reported a higher value of hydraulic conductivity after the formation of desiccation cracks and used the same vertical to horizontal permeability ratio as in 22 [23]. Both of these studies [22,23] were conducted in laboratory environments and were affected by boundary conditions. In addition, researchers also obtained permeability values using analytical methods by performing a calibration procedure. For example, Troncone et al., (2021) predicted landslide probability by adopting such a method [24]. Moreover, Montrasio et al., (2012) modeled a shallow landslide forecast using discharge capability, which is similar to soil permeability, for which the authors adopted analytical methods for soil permeability [25]. Since no attempts at using the field-based hydraulic conductivity value for numerical modeling have been made, the current study aims at determining the hydraulic conductivity value in both the vertical and horizontal direction in the field.
2.2. Determination of Unsaturated Flow Parameters
Any soil can be characterized based on its soil water characteristics curve [SWCC], which is a unique property of different soil. SWCC depends on particle-size distribution and pore space present in the soil. Currently practiced methods of determining SWCC i.e., pressure plate, Tempe cell and filter-paper techniques are time and labor consuming and highly dependent on the operator as well [26]. Zapata (2000) stated that there are limited number of geotechnical laboratories that performs suction-based tests [27]. In fact, researchers have been using statistical analyses, physical tests, Artificial Neural Network (ANN) and genetic Programming (GP) to determine SWCC [14].
The current study was carried out using a WP4C Dewpoint Potentiometer manufactured by Decagon Devices Inc., the chilled mirror hygrometer technique and by measuring the matric suction in a relatively short period of time The device takes several readings until the pre-determined tolerance is reached under ‘precious’ mode. A total of 15–20 min is required to record a value and obtain a complete SWCC. The specimens were prepared with de-aired/distilled water because the sole purpose of this test was to obtain the matric suction only and limit the effect of osmotic suction. There are several non-linear least square techniques, among which the Fredlund and Xing [28] and van Genuchten [29] equations are the most popular. The study used both equations for the determination of the unsaturated flow parameters. However, only the van Genuchten parameters were used in this work.
Fredlund and Xing equation:
where, θw is the volumetric water content; θs is the saturated water content; ψ is the matric suction; and ψr, α, n, and m are fitting parameters.
Van Genuchten equation:
where, ψ = soil suction (tensiometer data), θ = volumetric moisture content (moisture sensor data). α and n are the shape parameters and m = 1 − n−1.
2.3. SWCC Parameter Values
Schaap et al., (2000) evaluated the unsaturated flow parameters of 12 textural classes of soil of the USDA textural triangle [30]. Tuller et al., (2004) determined the same parameters for some classes from the Unsaturated Soil Hydraulic Database [UNSODA] [31]. The residual water content (θr), saturated water content (θs), α, and n for clay samples were tabulated as 0.098, 0.459, 0.015 and 1.25, respectively, by the former, whereas the same parameters were reported to be 0.102, 0.51, 0.021 and 1.20, respectively, by the latter.
However, researchers did not attempt to take into account both the laboratory and field-based SWCC parameters. Alam et al., (2017) studied both field and lab scale SWCC parameters [32] and carried out a percolation analysis in vegetated lysimeter in top cover soil of landfill. The values of α, n and m were stated as 0.0031, 1.6 and 0.375, respectively, from the laboratory testing using Tempe cell and dewpoint potentiometer while the values were 0.02, 1.52 and 0.3421, respectively, as obtained from FSWCC. The values obtained from two curves varied considerably as can be seen from the value of α as stated above. Therefore, an attempt was made to obtain the field values.
3. Project Background
3.1. Description of Site
The study was carried out for State Highway 342 (SH 342) in Lancaster, Ellis County and FM 2757 in Kaufman County as provided by the TxDOT, where the cracks could be clearly seen. These sites are at a distance from the utility lines and are easily accessible. The collected samples from the site revealed the soil to be high plastic (CH) clay, based on a sieve analysis and Atterberg limits. More than 85% of the soil passed through the 200 No. sieve and the Liquid Limit (LL) varied between 50 and 64, while the plasticity index (PI) ranged between 28 and 42.
3.2. Sensor Selection and Installation
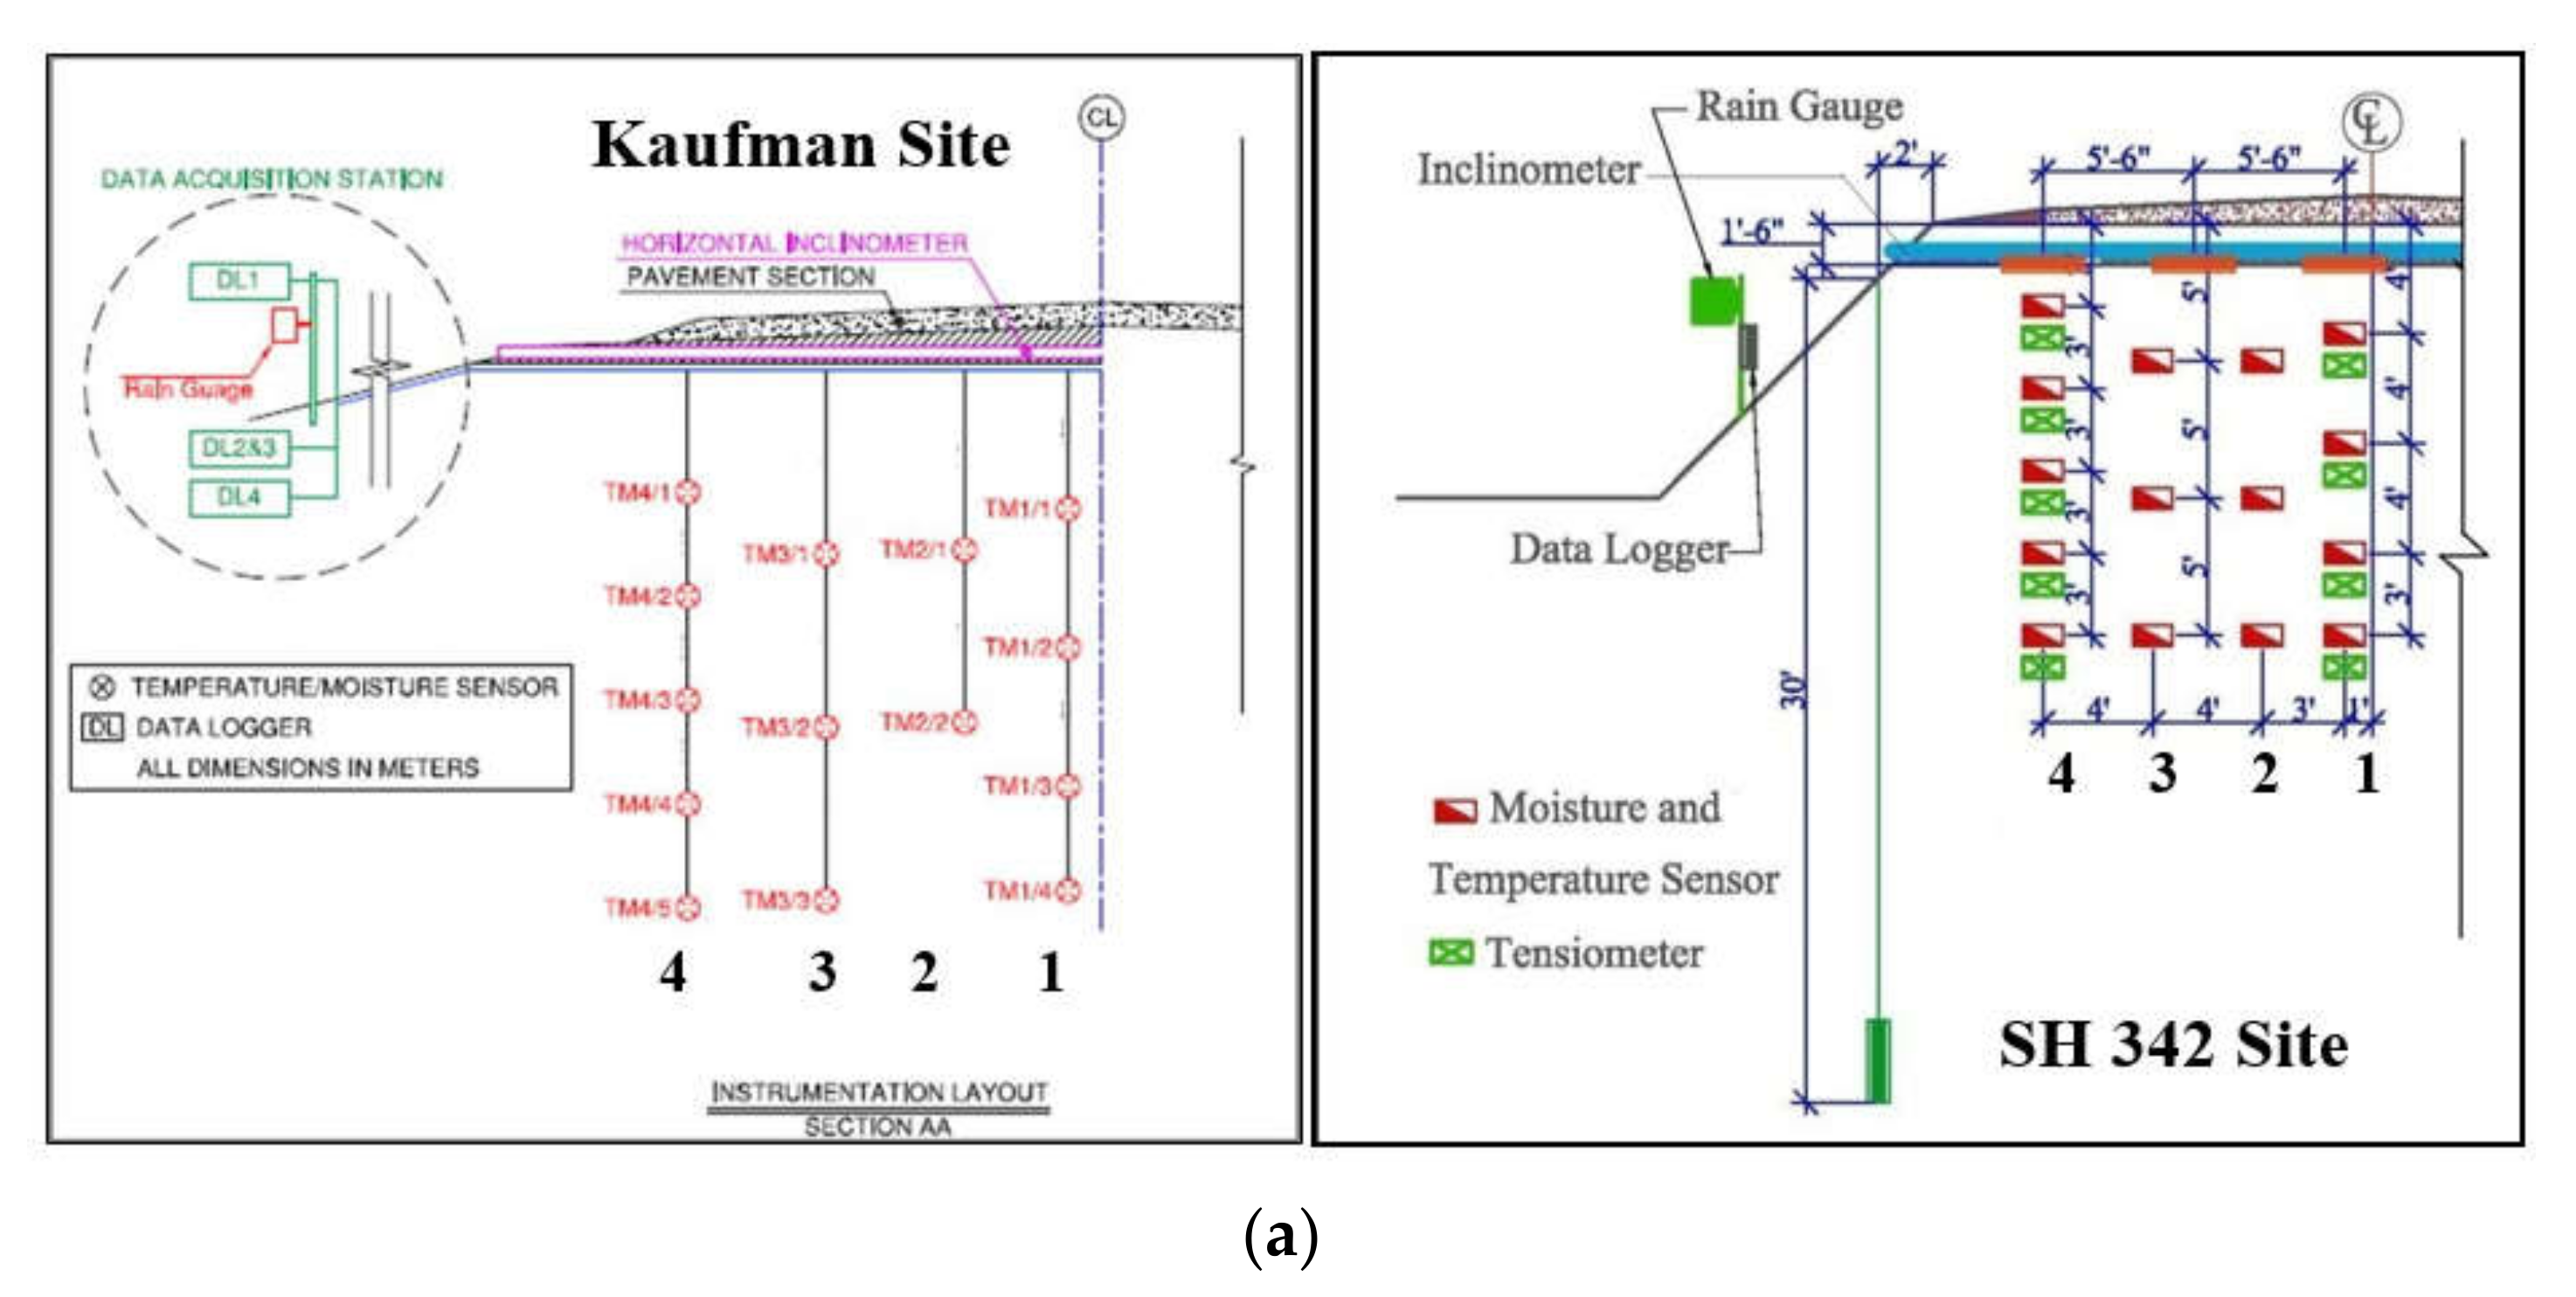
Moisture sensors were installed at both the sites based on a detailed field instrumentation layout, prepared prior to installation, to monitor the moisture variation in the subgrade soil (Figure 1a). Furthermore, in addition to the moisture sensors, suction sensors were also installed in SH342 site. Decagon 5TM moisture sensors were installed at the site to measure the volumetric water content while for the suction data, the Decagon WPS-2 water potential probe was used. Similarly, for the rainfall events, an ECRN-100 high resolution rain gauge was installed in the field. The data from the sensors and the rain gauge were collected via an EM50 data logger positioned at the shoulder of the pavement. The sensors were installed from the center towards the edge below the northbound lane at both sites (Figure 1b).
4. Methodology
4.1. Determination of Vertical Permeability
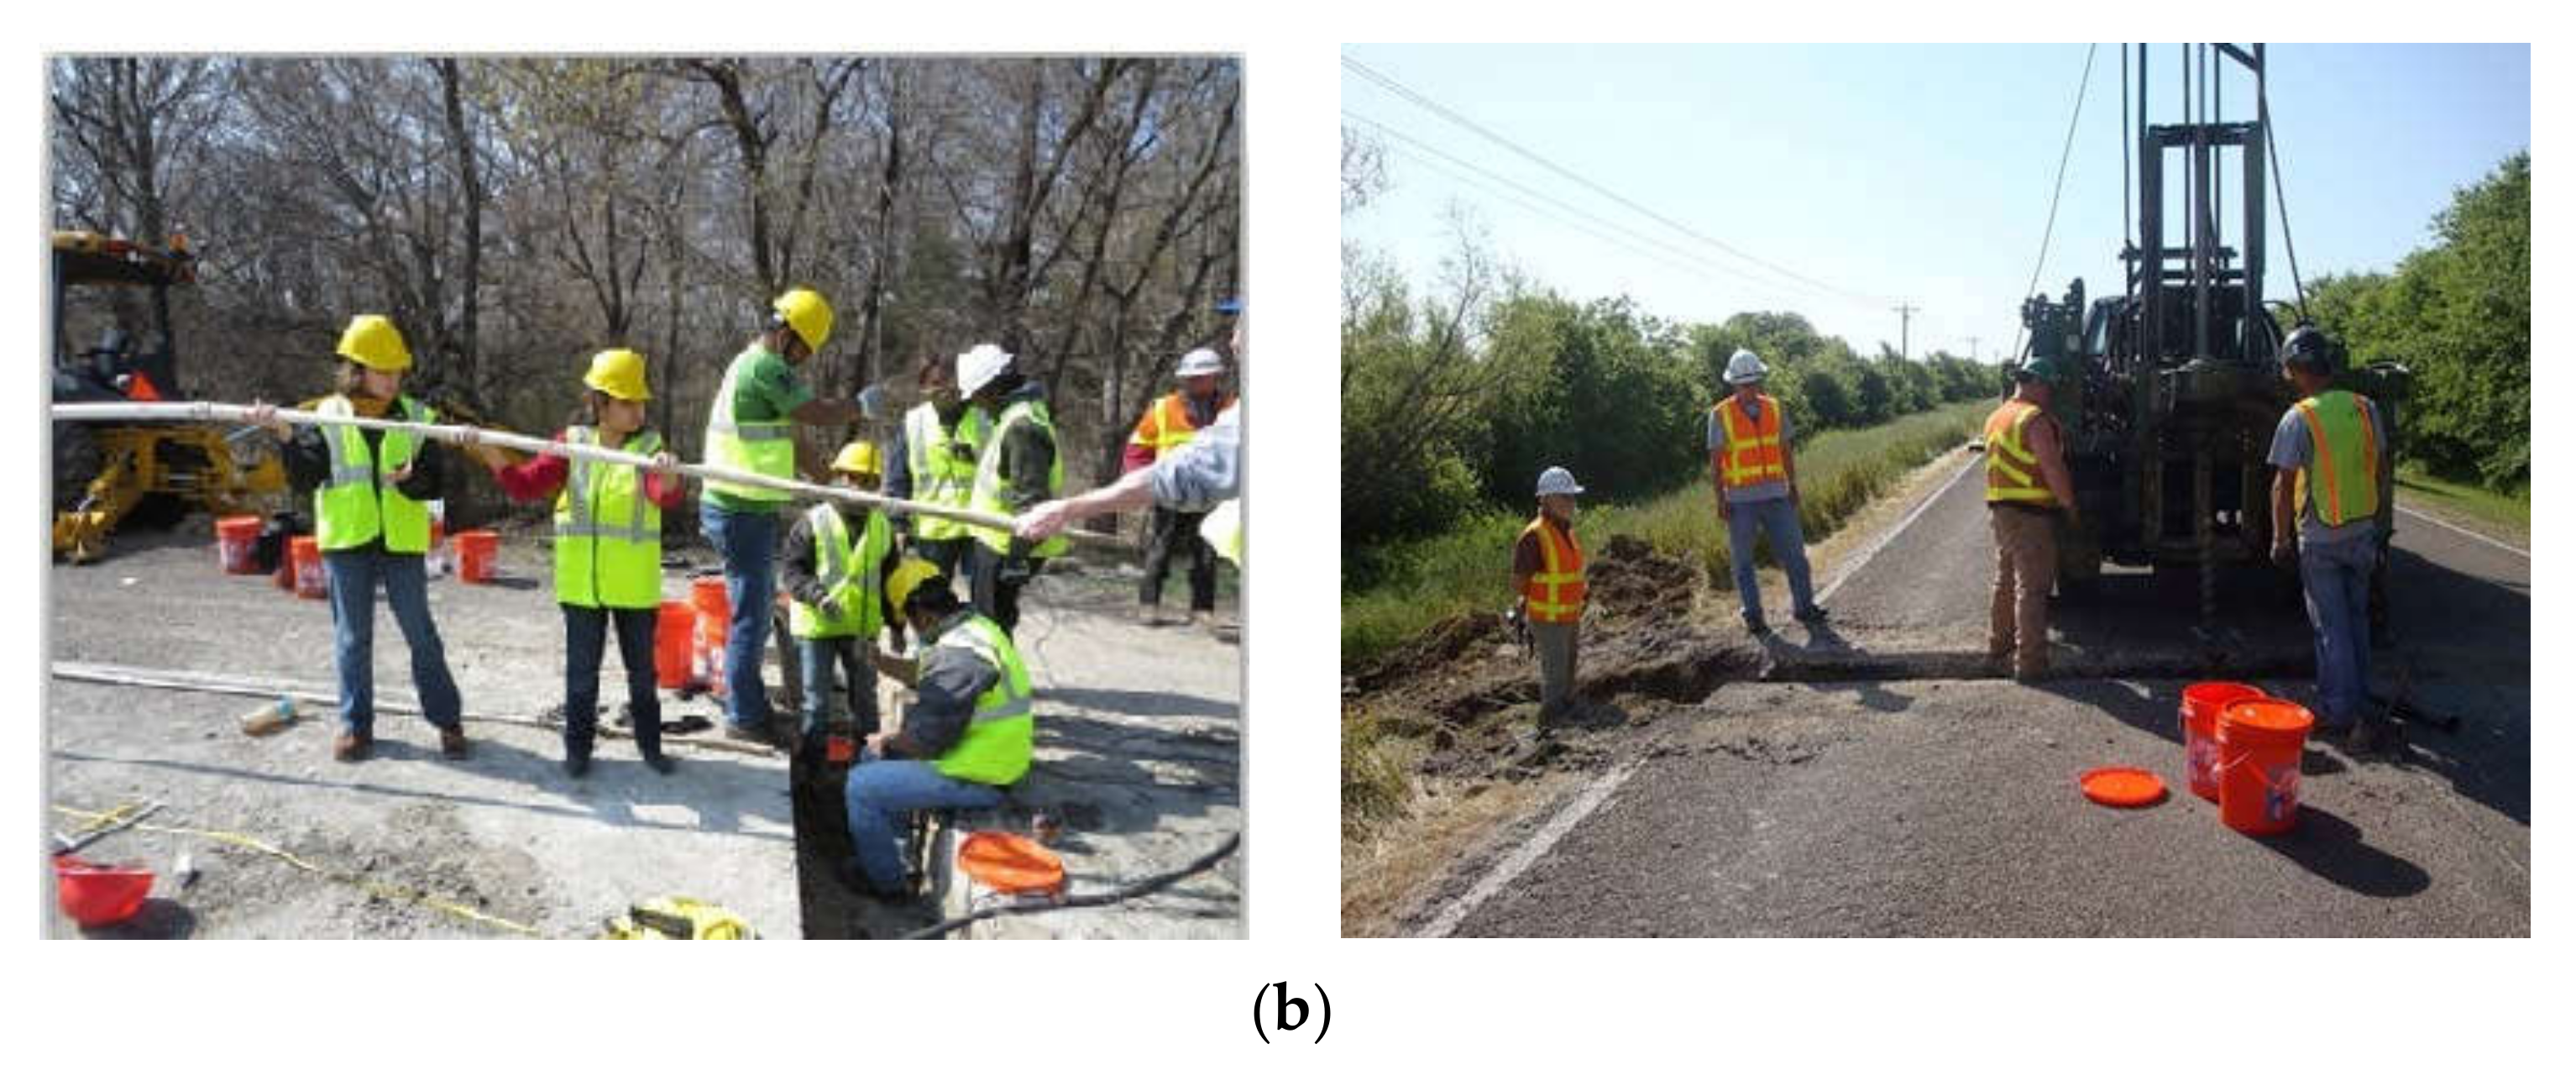
The moisture variation was monitored based on the daily averages computed from the data collected hourly at the pavement of SH 342. Figure 2a shows the moisture variation across center borehole at depths of 4 ft. (1.2 m), 8 ft. (2.4 m), 12 ft. (3.7 m) and 15 ft. [4.5 m] where the sensors were installed. Based on the previous studies [1,7], the highest active zone depth in the North Texas has been reported to be around 4.5 m (15 ft.). As such, the instrumentation was carried out to up to 4.5 m. Additionally, TM-4 in the figure denotes the Temperature and Moisture sensor installed at 4 ft. [1.2 m] depth. The sensors at the shallow depth showed more variation in moisture content than the sensors at a greater depth. For instance, there was no significant change in moisture content observed in the sensor located at 15 ft. below the ground surface. The sensors provide the value in volumetric moisture content. By adopting a weight–volume relationship, the volumetric moisture content was converted to gravimetric moisture content. The average gravimetric moisture content at this depth was found to be 19% and this point is considered as the point of saturation at that depth. The stabilized value of gravimetric moisture content is considered as the equilibrium moisture content at each depth. The equilibrium moisture contents for TM 4, TM 8 and TM 12 were 11%, 6% and 15%, respectively. It is interesting to note that the equilibrium moisture content is different for various depths. From 4 ft. to 8 ft., the value decreased and then again increased at depths 12 and 15 ft. Therefore, the 8 ft. moisture content exhibited a lower value. The natural moisture content of the depths before installation can explain this phenomenon. The soil at 8 ft. was mixed with solid limestone which cannot absorb water, whereas clayey particles can absorb more water. As the water travels down vertically, the moisture content increased from 4 ft. to 12 ft. followed by more increase at the bottom depth.
With each rainfall event, there was a peak in the moisture content as recorded in the sensors. The highest increase in moisture content was recorded from February 2015 to May 2015 due to continuous rainfall events which prevented the dissipation of moisture for a long time. Sensors close to the ground surface experienced a greater rise in moisture content. For example, the moisture content experienced by TM 8 was higher than TM 12. The rise in moisture contents was from 1% to 15% in amplitude which was limited to the temporary saturation point at each respective depth. There was a decrease in moisture content as soon as the rainfall ceased. This variation in moisture content for a short period of time can induce volumetric deformation in expansive soil, which makes it crucial to know the temporary rise in moisture content. It should be mentioned that the moisture logger went off reading due to a malfunction in the particular sensor port in the data logger. That is why the TM-4 and TM-12 data cycle are not complete and did not respond after the sensor port malfunction.
The vertical permeability was determined from the real time moisture data of two different rainfall events, as shown in Table 1. Peaks in moisture content were observed at different depths and different times based on the rainfall intensity. Furthermore, Table 2 shows the moisture variation at two different depths, of 1.2 m and 2.4 m, with time. The rainfall event of 17 July 2014 increased the moisture content in sensors at 1.2 m at 2 p.m. while sensors at 2.4 m experienced the increase at 4 p.m., with a time lag of two hours. The vertical field permeability was computed by finding the ratio of the vertical distance traveled by the water to the time required to travel that distance. Therefore, a 2 h of time lag for the water to travel 1.22 m between the sensors at the same borehole resulted in a vertical permeability of 1.69 × 10⁻⁴ m/s.
During 23 November 2014, a similar trend was seen in the same borehole for another rainfall event, where a sensor at 1.2 m experienced an increase in moisture at 2 a.m. while the sensor at 2.4 m recorded the increase at 8 a.m. (bold lines in Table 2). Given a time lag of 6 h (21,600 s), the vertical permeability value was computed as 5.65 × 10⁻⁵ m/s with a recorded time delay of 6 h for the moisture to move through a vertical distance from 1.2 m to 2.4 m. The vertical permeability value obtained from the first rainfall was found to be three times higher than the second rainfall event which is noteworthy.
4.2. Effect of Rainfall Duration and Intensity on Vertical Permeability
The difference in rainfall duration and intensity must have resulted in two different values of vertical permeability, as presented in table. The cumulative rainfall in July 14 was 7.1 mm in six hours, whereas for November 23, it was 8 mm in thirteen hours. As such, there was an additional 1.2 mm of rainfall after a cumulative rainfall of 3.7 mm, which led to an increase in the moisture content at a depth of 4 ft. on 17 July 2014. The volumetric moisture content was found to increase by up to 0.217 m3/m3 from 0.174 m3/m3. However, the sensors at 8 ft. experienced an increase in the moisture content with a lag time of two hours from when the sensor at 4 ft. experienced the increase in moisture. The increment was from 0.366 m3/m3 to 0.461 m3/m3. A similar phenomenon was witnessed in the month of November 2014 as well. The computed value of the vertical permeability for two different rainfall events suggests that for an equal amount of rainfall, a shorter period of rainfall resulted in higher permeability through the soil, while the longer period resulted in lower permeability with respect to the intensity of rainfall. However, for the numerical modeling later in the manuscript, an average value of 1.13 × 10⁻⁴ m/s was used.
4.3. Determination of Horizontal Permeability
The horizontal permeability was determined by adopting a similar approach as that applied for vertical permeability. The time lag between the moisture readings in two boreholes at the FM 2757 Kaufman site was utilized for finding horizontal permeability. Furthermore, Figure 2b reveals the moisture distribution in response to rainfall in the edge and center borehole. The reason behind adopting such an approach is the edge crack of the expansive subgrade pavement. Due to the continuous wetting and drying of the expansive soil, a desiccation crack occurs at the edge of the pavement which acts as a passage for water intrusion beneath the pavement [3,7]. The water then travels towards the center of the pavement and causes swelling at the center. For this phenomenon of moisture intrusion from the edge travelling towards the center, the time difference between the edge and center sensor moisture peak was used to calculate the horizontal permeability.
A similar response to the rainfall was found to occur for both the sensors at the edge and center. The increased moisture content value due to rainfall declined as the rainfall ceased, thereby stabilizing in its equilibrium value. The center borehole experienced a 3–4% increase in moisture content after rainfall, where the equilibrium moisture was around 15–16%. An identical trend was observed in the borehole at the edge; however, the average moisture content was higher at the edge than at the center, probably due to the moisture intrusion from the side slope. An increase in moisture content depends on the saturation status of the soil too. If the soil is near saturated, the increase might not be significant after heavy rainfall. Again, the sensors provide point reading, not continuous reading. For these reasons, the increase in moisture might be delayed. As can be seen in Figure 2b, the moisture content of the sensors did not increase instantly after heavy rainfall in June 2012. Before this heavy rainfall, there were some small rainfall events which brought the soil near saturation. Once the soil pore was available after draining the water to lower depths, an increase in moisture was observed. In order to determine the horizontal permeability, two different rainfall events were considered (Table 3). A time lag of five hours and an additional rainfall of 26.8 mm was observed between moisture content increases at the edge and center sensors installed at the same depth, i.e., 1.2 m for August 18 rainfall event (bold lines in Table 3). The moisture content at the edge sensor reached the highest value at 1 a.m., whereas the sensor at the center experienced its peak value at 6 a.m. The water travelling to a distance of 3.29 m in five hours resulted in a horizontal field permeability of 1.83 × 10⁻⁴ m/s.
Likewise, a horizontal permeability of 1.02 × 10⁻⁴ m/s was obtained due to a time lag of nine hours and 13.5 mm of rainfall between the sensors at the edge and center boreholes on 29 September 2012 (Table 3), yet again showing that higher rainfall intensity results in higher field permeability. A rainfall event on 18 August 2012 with 39.6 mm of rain in 9 h exhibited a higher permeability value than that of 29 September 2012 with 27.3 mm in 15 h. The permeability increased 1.8 times, with an increased rainfall intensity from 1.82 mm/h to 4.4 mm/h. However, an average value of 1.43 × 10⁻⁴ m/s was used for numerical modeling.
4.4. Field Soil Water Characteristic Curve (FSWCC)
The saturated volumetric moisture content (θs) was found to be 0.46 based on laboratory investigation. Additionally, using the van Genuchten equation, the values of shape parameters, α (=0.06) and n (=1.8) were determined.
Since the laboratory-determined parameters cannot address all kinds of heterogeneity present in the field, FSWCCs were used based on the field instrumented moisture sensors and tensiometer to obtain more realistic values. A similar approach to that adopted by Alam et al., (2017) was used in the current study [32]. The author determined three curves in total with the help of field-based SWCC in vegetated lysimeter, for the upper bound, lower bound and the average. Furthermore, Figure 3 shows the FSWCC curve obtained from the instrumented pavement and the data from each of these curves were fitted with van Genuchten’s equation [29].
Based on FWSCC, the saturated VMC (θs) and residual VMC (θr) were found to be 0.46 and 0.11, respectively. The shape parameters were determined using the average curve in Figure 3 and the values, after being fitted with the van Genuchten equation were α (=0.089), n (=3.8) and m (=0.74).
There exists a distinct variation between the fitting parameters determined from field and laboratory SWCC. As discussed earlier, the laboratory results do not take into account the heterogeneity and some of the undetermined factors present in the field. Hence, field SWCC was considered for numerical modeling and accordingly, the fitted parameters were used for the analysis.
5. Numerical Modeling Results
The following paragraphs present the instrumented results, numerical flow analysis, model calibration, and a comparison of the FEM output to the field measurements. Although the validation section is only presented for suction data, the results section discusses both the moisture and suction data.
5.1. Instrument Results
The recorded moisture content and corresponding suction values show significant variations at shallower depths (1.2 m) which become stable at a deeper depth (4.5 m) as shown in Figure 4. The moisture values that were recorded on a volumetric basis were converted into gravimetric values. These moisture content values at shallower depths were constant at 6%, followed by periodic increases up to 10% due to precipitation. Conversely, constant moisture content values of 20% were recorded at a 4.5 m depth. The corresponding suction values showed a similar trend with fluctuations at shallower depths and constant values with a negligible response to environmental loading at deeper depths. It must be noted that the suction sensors used in the study have a lower limit of −10 kPa, and do not provide a lower reading value than this. The instrumented clearly indicated the instantaneous rise of moisture and a fall of the suction value in response to a rainfall event. For example, before the rainfall of 14 November 2014 the moisture content at a 1.2 m depth was 6%, whereas the suction value was −15 kPa. Shortly after the rainfall, the moisture content increased to 10% followed by a decrease in suction to −10 kPa.
5.2. Model Details and Calibration
The recent development of the specified geotechnical software (i.e., PLAXIS 2D) has made numerical modeling quicker and more precise. In comparison to the other FEM software such as ABAQUS and ANSYS, PLAXIS offers the easy modeling of complicated geometries along with discontinuities. Therefore, PLAXIS was used for this analysis in which the soil was considered homogeneous. A plain strain model was selected for the analysis as it is used for geometries with a cross section that us more or less uniform. Soil model was selected as elastic-perfectly plastic Mohr-Coulomb model. As the study did not consider the displacement of the pavement subgrade, other complicated models were not considered. The 15-node triangular elements were considered for the model, with standard fixities applied at the edges of the geometry as boundary conditions. Horizontal displacement was restrained on the lateral sides. At the top of the soil body, both horizontal and vertical displacement were applied. The top of the symmetric model was considered as a free surface where rainfall was applied. The bottom boundary was modeled as a fixed boundary. In case of meshing, the 15-node triangular element was adopted.
Based on the collected soil, it was classified as high plastic clay (CH). There was no groundwater table observed. The bulk density of the soil was 19.9 kN/m3 and the void ratio was 0.54 at a 1.2 m depth. Additionally, the saturated hydraulic conductivity from laboratory testing was 3.53 × 10⁻⁷ m/s. It must be mentioned that while all other soil properties described were used as input parameter, for permeability, the abovementioned saturated value was not used. The horizontal and vertical permeability obtained from the previous sections were used during numerical modeling. In addition, the following fitting parameters obtained from FSWCC were used in the analysis:
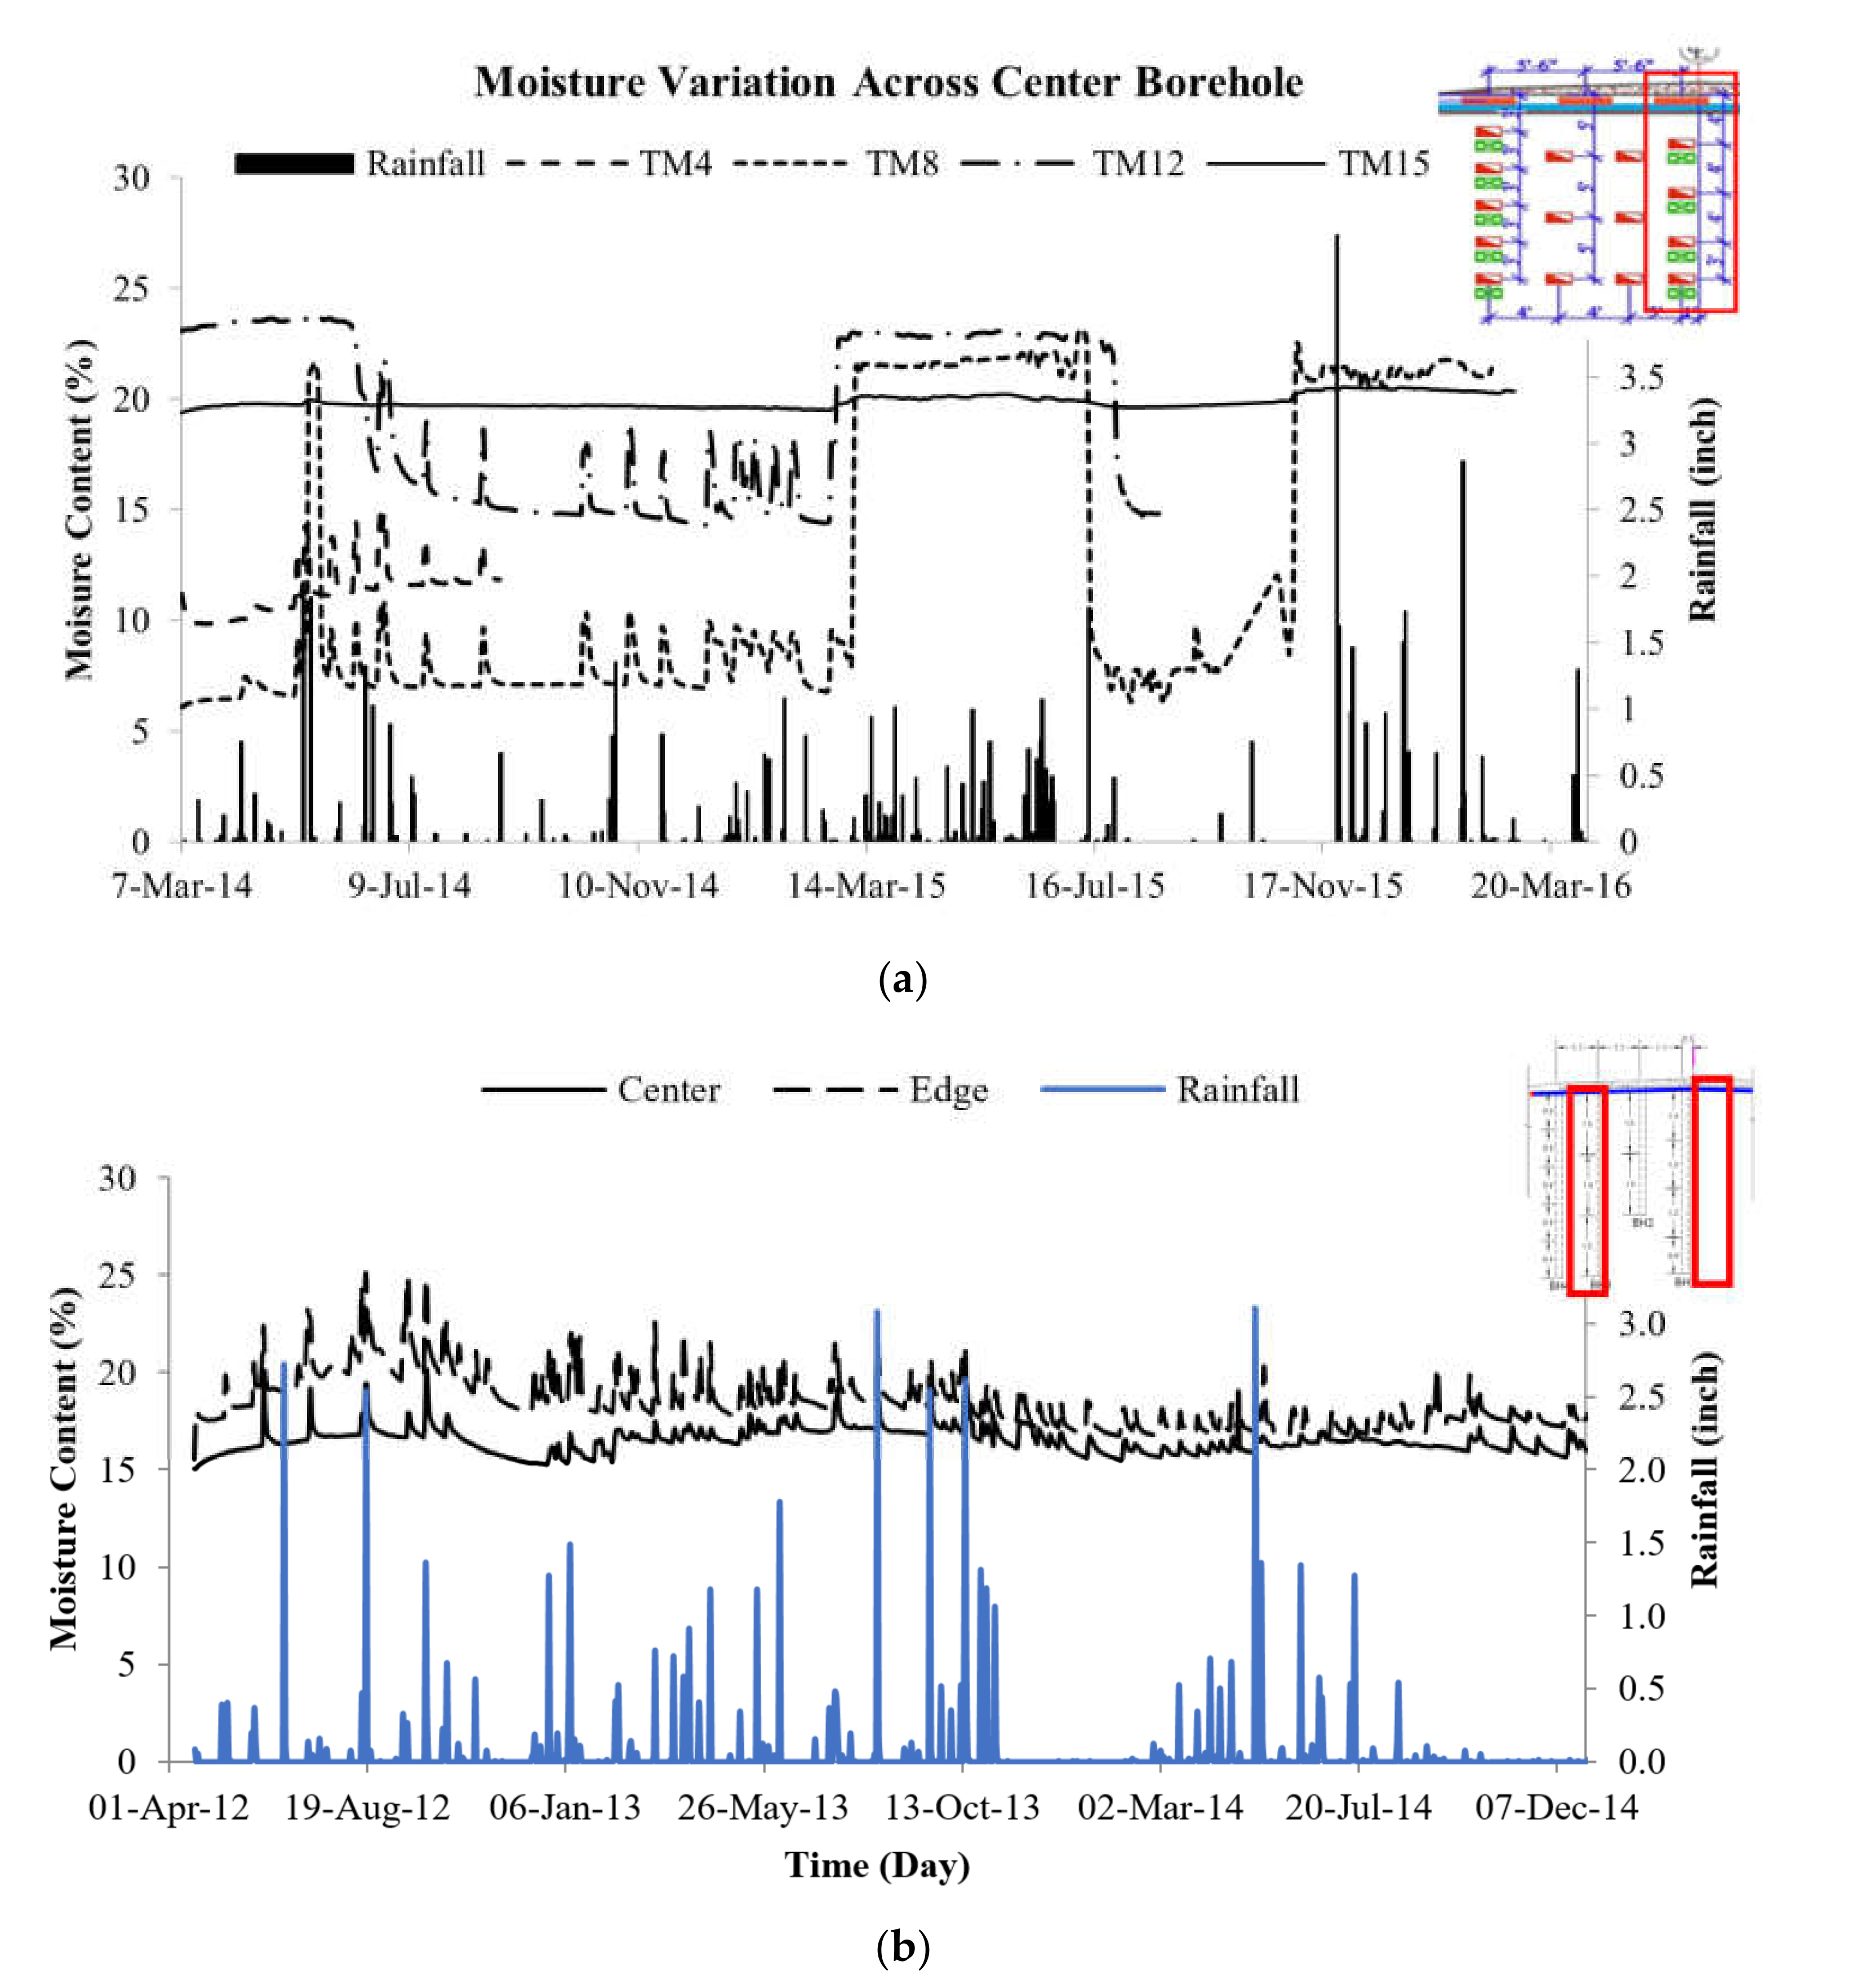
After carefully investigating the moisture and suction results, attempts were undertaken to calibrate the results in the numerical environment. The rainfall and suction value of 12 August 2014 to 12 September 2014 was used for the calibration of the model. Parameters from the field SWCC (Table 4) were used for flow analysis in PLAXIS to integrate the unsaturated flow state. This is the main difference between this numerical model and others. Where the other study used laboratory-generated permeability and unsaturated flow parameters, this study incorporated the field horizontal and vertical permeability along with the unsaturated flow parameters from FSWCC. A triangular element with 15 nodes and 12 stress points was used, whereby the standard fixities were applied as a boundary condition. Due to the symmetrical nature of the pavement, only half of the geometry was used for modeling. Numerous trials were performed until good agreement was found between the observed suction values and sensor recordings. When building the initial model in the PLAXIS environment, the model exhibited some moisture and suction values before running the model, by applying rainfall based on the input parameter. For example, the model might show a moisture content of 31% before applying the rainfall, whereas the field moisture content was 6% before applying the rainfall, which is why there needs to be some change in the pressure head in the input parameter. Once good agreement was found between the field and model data, rainfall was applied. The variations in saturation and suction values before and after rainfall are demonstrated in for the typical model outputs (Figure 5).
As can be seen in Figure 5, the variation of suction and moisture was captured from the color change responding to a rainfall event. In the first two images (Figure 5a,b), the saturation level was recorded as 30% before rainfall, which jumped to 70% following the rainfall after 4 days. Similarly, in the suction figures (Figure 5c,d), the red zone showed highest suction before rainfall, whereas the blueish zone exhibited a lower suction value. The reason for the instant rise in the saturation and drop in suction is the moisture infiltration. The moment rainfall enters into the subgrade soil, the soil reaches near saturation values and the suction values drop immediately. Furthermore, Figure 5 shows the qualitative output. In order to better compare the results, a quantitative evaluation is required, which is presented in the next section.
5.3. Finite Element Results
The numerous rainfall events occurring between 21 October 2014 and 17 December 2014 were reflected by the corresponding moisture and suction changes in the subgrade moisture sensors. Less variation at a greater depth was seen from both the FE results and the sensors. A comparison between the numerical model and field data is shown in Figure 6.
Although there were very little discrepancies between the suction values from the model and field observation, the suction change pattern was analogous, signifying the similarity of the model behavior with the field data. Since there was no variation in the suction values recorded by the sensors located at a 4.5 m depth, only the data from the sensors at 1.2 m were used for comparison. The plots between October-November and November-December (Figure 6) clearly show that the suction values increased in the absence of a rainfall event, and then dropped immediately after the rainfall event, which was seen in the numerical modeling as well.
Both of the cases had minor differences in the change in suction values. This might be due to the exclusion of the effect of evaporation and lack of heterogeneity in the soil in the numerical environment. Regardless, the numerical model was successful in capturing the variation of suction with changing rainfall events. However, it must be stated that the comparison data presented here are only for 1 month for each case. Moreover, the spatial variability of the hydraulic properties and evaporation were not considered during the numerical modeling. That might be another reason for the agreement between the field and model data for a shorter duration. Long term comparison, i.e., six months to one year comparison that includes the spatial variability and evaporation, could capture a greater variation in the subgrade moisture and suction, thereby resulting in a more comprehensive numerical model. The specific aim of this manuscript was to present a new technique to determine the field permeability in both directions along with field unsaturated flow parameters. As such, extensive numerical modeling was outside the scope of the study.
6. Limitations of the Study
While determining the field soil water characteristic curve (FSWCC), the hysteresis phenomenon was not fully considered. Hysteresis is a very well-known but poorly understood phenomenon in unsaturated soil mechanics. The most typical example of hysteresis is exhibited by the wetting and drying curve of the SWCC curve. There is no unique equilibrium between moisture content and soil suction to describe the hysteresis behavior. Instead, soil tends to retain a higher water content during the drying process (i.e., evaporation, gravity drainage) than for the same magnitude of suction during wetting process (i.e., infiltration, capillary rise). As can be seen (Figure 3), there is an upper bound and lower bound curve in the FSWCC. Albright and Benson (2002) labelled this kind of upper bound and lower bound curve as a wetting and drying curve of SWCC [33]. Zhai et al., (2020, 2021) determined the wetting hydraulic conductivity for unsaturated sandy soil in their study, in which they discussed the hysteresis phenomenon [34,35]. Hedayati et al., (2020) also discussed one method for observing the hysteresis effect using field data [36]. However, as there is no agreed methodology on capturing hysteresis from field data, its effect was not included in the study. In addition, a comparison between the effect of the lab- and field-generated SWCC values on moisture and suction output was also not carried out in the study. A comparison between lab- and field-generated data coupled with the verification data could yield more interpretable and distinguishable field values.
7. Conclusions
Monitoring of moisture and suction change through field instrumentation and modeling in numerical environment was conducted in the subgrade of a two-lane state highway. The site instrumentation comprised of moisture and suction sensors along with a rain gauge for hourly rainfall data. The rainfall response of the moisture sensors was used for the evaluation of both horizontal and vertical permeability. While both field data and laboratory testing were utilized for the determination of SWCC of the soil, SWCC parameters based on field data were used for numerical modeling due to its resemblance to the actual site condition. Although the numerical modeling exhibited similarities with the field data for a specific rainfall event, a further performance-monitoring study that considers a continuous period of time is required. The major outcomes from this study are as follows:
- The vertical permeability from the field was a function of rainfall intensity and duration. The two values of vertical permeability obtained from the field data were 1.69 × 10⁻⁴ m/s and 5.65 × 10⁻⁵ m/s. This is a clear distinction from the laboratory-generated saturated permeability in the order of 10−7 m/s.
- A similar observation was found for horizontal permeability from instrumentation data. The two values calculated for field horizontal permeability were 1.83 × 10⁻⁴ m/s and 1.02 × 10⁻⁴ m/s. Horizontal value exhibited less variation than the vertical permeability values due to desiccation crack, which affects the vertical movement of water considerably.
- There were differences recorded between the values obtained from the laboratory testing and field SWCC. The van Genuchten parameters were α (=0.089 kPa−1), n (=3.8) and m (=0.74) from the field, whereas these were 0.06 kPa−1, 1.8, and 0.45, respectively, from laboratory determination.
- Field-rainfall data were used to calibrate the numerical model. It showed a similar suction variation value captured from field data. However, the comparison was for a one month period. Long term comparisons and further validation is required to achieve a comprehensive numerical model.
Author Contributions
Conceptualization, A.A.; methodology, A.A.; software, A.A.; validation, A.A.; formal analysis, A.A.; investigation, A.A. and S.H.; resources, A.A. and S.H.; data curation, A.A.; writing—original draft preparation, A.A.; writing—review and editing, A.A. and S.H.; visualization, A.A.; supervision, S.H.; project administration, S.H. All authors have read and agreed to the published version of the manuscript.
Funding
The case studies presented here were funded by Texas Department of Transportation under contract no. IAC 18-OXXIA001.
Institutional Review Board Statement
Not applicable.
Informed Consent Statement
Not applicable.
Data Availability Statement
The data presented in this study can be available upon contact with the authors.
Acknowledgments
The authors express their sincere appreciation to Boon Thian, District Pavement Engineer during the funding period for careful guidance and suggestions.
Conflicts of Interest
The authors declare no conflict of interest. The funders had no role in the design of the study; in the collection, analyses, or interpretation of data; in the writing of the manuscript, or in the decision to publish the results.
References
- Hossain, S.; Ahmed, A.; Khan, M.; Aramoon, A.; Thian, B. Expansive subgrade behavior on a state highway in North Texas. In Proceedings of the Geotechnical and Structural Engineering Congress, ASCE, Phoenix, AZ, USA, 14–17 February 2016; pp. 1186–1197. [Google Scholar]
- Djellali, A.; Ounis, A.; Saghafi, B. Behavior of flexible pavements on expansive soils. Int. J. Transp. Eng. 2012, 1, 1–14. [Google Scholar]
- Nelson, J.; Miller, J.D. Expansive Soils: Problems and Practice in Foundation and Pavement Engineering; John Wiley & Sons, Inc.: New York, NY, USA, 1992. [Google Scholar]
- Jones, L.D.; Jefferson, I. Expansive Soils, ICE Manual of Geotechnical Engineering; ICE Publishing: London, UK, 2012; pp. 413–441. [Google Scholar]
- Sebesta, S. Investigation of Maintenance Base Repairs over Expansive Soils: Year 1 Report; Report No. FHWA/TX-03/0-4395-1; Texas Transportation Institute, Texas A&M University: College Station, TX, USA, 2002. [Google Scholar]
- Puppala, A.J.; Manosuthkij, T.; Nazarian, S.; Hoyos, L.R.; Chittoori, B. In situ matric suction and moisture content measurements in expansive clay during seasonal fluctuations. Geotech. Test. J. 2012, 35, 74–82. [Google Scholar]
- Hedayati, M.; Hossain, S. Data based model to estimate subgrade moisture variation case study: Low volume pavement in North Texas. Transp. Geotech. 2015, 3, 48–57. [Google Scholar] [CrossRef]
- Ahmed, A.; Hossain, S.; Khan, M.S.; Shishani, A. Data-based real-time moisture modeling in unsaturated expansive subgrade in Texas. Transp. Res. Rec. 2018, 2672, 86–95. [Google Scholar] [CrossRef]
- Bayomy, F.; Salem, H. Monitoring and Modeling Subgrade Soil Moisture for Pavement Design and Rehabilitation in Idaho: Phase III: Data Collection and Analysis; National Institute for Advanced Transportation Technology, University of Idaho: Moscow, ID, USA, 2004. [Google Scholar]
- Heydinger, A.G. Evaluation of seasonal effects on subgrade soils. In Transportation Research Board; No. 1821; Transportation Research Board of the National Academies: Washington, DC, USA, 2003; pp. 47–55. [Google Scholar]
- Kuo, C.; Huang, C. Three-dimensional pavement analysis with nonlinear subgrade materials. J. Mater. Civ. Eng. 2006, 18, 537–544. [Google Scholar] [CrossRef]
- Hedayati, M. Rainfall Induced Distress in Low Volume Pavements. Ph.D. Thesis, University of Texas at Arlington, Arlington, TX, USA, 2014. [Google Scholar]
- Hashem, M.D.; Abu-Baker, a.m. Numerical modeling of flexible pavement constructed on expansive soils. Eur. Int. J. Sci. Technol. 2013, 2, 19–34. [Google Scholar]
- Hedayati, M.; Hossain, M.S.; Mehdibeigi, A.; Thian, B. Real-time modeling of moisture distribution in subgrade soils. In Proceedings of the Geo-Congress 2014: Geo-Characterization and Modeling for Sustainability, Atlanta, GA, USA, 23–26 February 2014; Geo-Institute of ASCE: Atlanta, GA, USA, 2014; pp. 3015–3024. [Google Scholar]
- Ruttanaporamakul, P. Resilient Moduli Properties of Compacted Unsaturated Subgrade Materials. Master’s Thesis, University of Texas at Arlington, Arlington, TX, USA, 2012. [Google Scholar]
- Ghorbanpour, A. Leachate Recirculation Modelling Using Vertical Wells in Bioreactor Landfills. Master’s Thesis, University of Texas at Arlington, Arlington, TX, USA, 2013. [Google Scholar]
- Bronswijk, J.J.B. Modeling of water balance, cracking and subsidence of clay soils. J. Hydrol. 1988, 97, 199–212. [Google Scholar] [CrossRef]
- Hossain, J. Geohazard Potential of Rainfall Induced Slope Failure on Expansive Clay. Ph.D. Thesis, University of Texas at Arlington, Arlington, TX, USA, 2012. [Google Scholar]
- Zhan, T.L.T.; Ng, C.W.W.; Fredlund, D.G. Field study of rainfall infiltration into a grassed unsaturated expansive soil slope. Can. Geotech. J. 2007, 44, 392–408. [Google Scholar] [CrossRef]
- Favre, F.; Boivin, P.; Wopereis, M.C.S. Water movement and soil swelling in a dry, cracked Vertisol. Geoderma 1997, 78, 113–123. [Google Scholar] [CrossRef]
- Khan, M.S.; Hossain, M.S.; Ahmed, A.; Faysal, M. Investigation of a shallow slope failure on expansive clay in Texas. Eng. Geol. 2017, 219, 118–129. [Google Scholar] [CrossRef]
- Albrecht, B.A.; Benson, C.H. Effect of desiccation on compacted natural clays. J. Geotech. Geoenviron. Eng. 2001, 127, 67–75. [Google Scholar] [CrossRef]
- Omidi, G.H.; Thomas, J.C.; Brown, K.W. Effect of Desiccation Cracking on the Hydraulic Conductivity of a Compacted Clay Liner. Water Air Soil Pollut. 1996, 89, 91–103. [Google Scholar] [CrossRef]
- Troncone, A.; Pugliese, L.; Lamanna, G.; Conte, E. Prediction of rainfall-induced landslide movements in the presence of stabilizing piles. Eng. Geol. 2021, 288, 106143. [Google Scholar] [CrossRef]
- Montrasio, L.; Valentino, R.; Losi, G.L. Shallow landslides triggered by rainfalls: Modeling of some case histories in the Reggiano Apennine (Emilia Romagna Region, Northern Italy). Nat. Hazards 2012, 60, 1231–1254. [Google Scholar] [CrossRef]
- Tarboton, D.G. Rainfall-Runoff Processes; Utah State University: Logan, UT, USA, 2003. [Google Scholar]
- Zapata, C.E.; Houston, W.N.; Houston, S.L.; Walsh, K.D. Soil-water characteristic curve variability. Adv. Unsatur. Geotech. 2000, 99, 84–124. [Google Scholar]
- Fredlund, D.G.; Xing, A. Equations for the soil-water characteristic curve. Can. Geotech. J. 1994, 31, 521–532. [Google Scholar] [CrossRef]
- Van Genuchten, M.T. A closed-form equation for predicting the hydraulic conductivity of unsaturated soils. Soil Sci. Soc. Am. J. 1980, 44, 892–898. [Google Scholar] [CrossRef] [Green Version]
- Schaap, M.G.; Leij, F.J. Improved prediction of unsaturated hydraulic conductivity with the Mualem-van Genuchten model. Soil Sci. Soc. Am. J. 2000, 64, 843–851. [Google Scholar] [CrossRef] [Green Version]
- Tuller, M.; Or, D. Retention of water in soil and the soil water characteristic curve. Encycl. Soils Environ. 2004, 4, 278–289. [Google Scholar]
- Alam, J.B.; Hossain, M.S.; Ahmed, A.; Khan, M.S. Comparison of deep percolation of flat and slope section vegetated lysimeters using field soil water characteristic curve. In Proceedings of the Second Pan American Conference on Unsaturated Soils, Dallas, TX, USA, 12–15 November 2017; Geo-Institute of ASCE: Dallas, TX, USA, 2017. [Google Scholar]
- Albright, W.H.; Benson, C.H. Alternative Cover Assessment Program, 2002 Annual Report; Publication No. 41182; Division of Hydrological Sciences, Desert Research Institute, University and Community College System of Nevada: Reno, NV, USA; University of Wisconsin–Madison: Madison, WI, USA, 2002. [Google Scholar]
- Zhai, Q.; Rahardjo, H.; Satyanaga, A.; Dai, G.L.; Du, Y.J. Estimation of the Wetting Scanning Curves for Sandy Soils. Eng. Geol. 2020, 272, 105635. [Google Scholar] [CrossRef]
- Zhai, Q.; Rahardjo, H.; Satyanaga, A.; Zhu, Y.Y.; Dai, G.L.; Zhao, X.L. Estimation of wetting hydraulic conductivity function for unsaturated sandy soil. Eng. Geol. 2021, 285, 106034. [Google Scholar] [CrossRef]
- Hedayati, M.; Ahmed, A.; Hossain, M.S.; Hossain, J.; Sapkota, A. Evaluation and comparison of in-situ soil water characteristics curve with laboratory SWCC curve. Transp. Geotech. 2020, 23, 100351. [Google Scholar] [CrossRef]
Figure 1.
(a) Instrumentation plan for both pavements, (b) Field instrumentation on SH 342 and FM 2757.
Figure 1.
(a) Instrumentation plan for both pavements, (b) Field instrumentation on SH 342 and FM 2757.


Figure 2.
(a) Moisture variation at center and edge borehole of SH 342 and (b) Moisture variation in center borehole in FM 2757.
Figure 2.
(a) Moisture variation at center and edge borehole of SH 342 and (b) Moisture variation in center borehole in FM 2757.

Figure 3.
Field SWCC from SH 342 sensor data.

Figure 4.
Moisture and suction variation in center borehole of SH 342 site.

Figure 5.
(a) Saturation level before rainfall (b) Saturation level after 4 days of rainfall (c) Suction level before rainfall (d) Suction level after 4 days of rainfall.
Figure 5.
(a) Saturation level before rainfall (b) Saturation level after 4 days of rainfall (c) Suction level before rainfall (d) Suction level after 4 days of rainfall.

Figure 6.
Field and numerical model comparison for rainfall event of (a) October 2014 and (b) November 2014.
Figure 6.
Field and numerical model comparison for rainfall event of (a) October 2014 and (b) November 2014.


Table 1.
Duration and Intensity of Rainfall in SH 342.
| Time | Rainfall (mm) | Time | Rainfall (mm) | Time | Rainfall (mm) |
|---|---|---|---|---|---|
| 17 July 2014 11:00 a.m. | 1.4 | 22 November 2014 6:00 p.m. | 1.4 | 23 November 2014 1:00 a.m. | 0.2 |
| 17 July 2014 12:00 p.m. | 1.8 | 22 November 2014 7:00 p.m. | 1.0 | 23 November 2014 2:00 a.m. | 0.2 |
| 17 July 2014 1:00 p.m. | 0.5 | 22 November 2014 8:00 p.m. | 1.4 | 23 November 2014 3:00 a.m. | 0.2 |
| 17 July 2014 2:00 p.m. | 1.2 | 22 November 2014 9:00 p.m. | 1.4 | 23 November 2014 4:00 a.m. | 0.0 |
| 17 July 2014 3:00 p.m. | 2.0 | 22 November 2014 10:00 p.m. | 1.0 | 23 November 2014 5:00 a.m. | 0.2 |
| 17 July 2014 4:00 p.m. | 0.2 | 22 November 2014 11:00 p.m. | 0.6 | 23 November 2014 6:00 a.m. | 0.0 |
| 23 November 2014 12:00 a.m. | 0.2 | 23 November 2014 7:00 a.m. | 0.2 |
Table 2.
Variation of Volumetric Moisture Content (m3/m3) in Response to Rainfall in SH 342.
| Time | 1.2 m | 2.4 m | Time | 1.2 m | 2.4 m |
|---|---|---|---|---|---|
| 17 July 2014 12:00 p.m. | 0.174 | 0.366 | 22 November 2014 11:00 p.m. | 0.176 | 0.338 |
| 17 July 2014 1:00 p.m. | 0.174 | 0.366 | 23 November 2014 12:00 a.m. | 0.176 | 0.337 |
| 17 July 2014 2:00 p.m. | 0.217 | 0.366 | 23 November 2014 1:00 a.m. | 0.176 | 0.338 |
| 17 July 2014 3:00 p.m. | 0.274 | 0.385 | 23 November 2014 2:00 a.m. | 0.210 | 0.338 |
| 17 July 2014 4:00 p.m. | 0.273 | 0.461 | 23 November 2014 3:00 a.m. | 0.244 | 0.338 |
| 17 July 2014 5:00 p.m. | 0.270 | 0.468 | 23 November 2014 4:00 a.m. | 0.245 | 0.338 |
| 23 November 2014 5:00 a.m. | 0.248 | 0.338 | |||
| 23 November 2014 6:00 a.m. | 0.249 | 0.339 | |||
| 23 November 2014 7:00 a.m. | 0.249 | 0.343 | |||
| 23 November 2014 8:00 a.m. | 0.247 | 0.392 | |||
| 23 November 2014 9:00 a.m. | 0.245 | 0.415 | |||
| 23 November 2014 10:00 a.m. | 0.243 | 0.417 |
Table 3.
Rainfall events with Volumetric Water Content (m3/m3) of 18 August 2012 and 29 September 2012.
Table 3.
Rainfall events with Volumetric Water Content (m3/m3) of 18 August 2012 and 29 September 2012.
| Time | VMC (Edge) | VMC (Center) | Rainfall (mm) | Time | VMC (Edge) | VMC (Center) | Rainfall (mm) |
|---|---|---|---|---|---|---|---|
| 18 August 2012 12:01 a.m. | 0.314 | 0.229 | 7.0 | 29 September 2012 6:00 a.m. | 0.290 | 0.221 | 0.2 |
| 18 August 2012 1:00 a.m. | 0.373 | 0.229 | 5.8 | 29 September 2012 7:00 a.m. | 0.290 | 0.221 | 0.1 |
| 18 August 2012 2:00 a.m. | 0.367 | 0.229 | 0.0 | 29 September 2012 8:00 a.m. | 0.290 | 0.221 | 0.0 |
| 18 August 2012 3:00 a.m. | 0.367 | 0.228 | 0.0 | 29 September 2012 9:00 a.m. | 0.387 | 0.222 | 0.5 |
| 18 August 2012 4:00 a.m. | 0.383 | 0.228 | 19.6 | 29 September 2012 10:00 a.m. | 0.392 | 0.221 | 0.8 |
| 18 August 2012 5:00 a.m. | 0.365 | 0.228 | 7.2 | 29 September 2012 11:00 a.m. | 0.380 | 0.222 | 0.5 |
| 18 August 2012 6:00 a.m. | 0.352 | 0.262 | 0.0 | 29 September 2012 12:00 p.m. | 0.361 | 0.222 | 0.8 |
| 18 August 2012 7:00 a.m. | 0.354 | 0.271 | 0.0 | 29 September 2012 1:00 p.m. | 0.355 | 0.222 | 0.8 |
| 18 August 2012 8:00 a.m. | 0.355 | 0.269 | 0.0 | 29 September 2012 2:00 p.m. | 0.352 | 0.222 | 0.0 |
| 18 August 2012 9:00 a.m. | 0.354 | 0.268 | 0.0 | 29 September 2012 3:00 p.m. | 0.352 | 0.222 | 0.8 |
| 29 September 2012 4:00 p.m. | 0.351 | 0.222 | 2.8 | ||||
| 29 September 2012 5:00 p.m. | 0.351 | 0.228 | 4.6 | ||||
| 29 September 2012 6:00 p.m. | 0.351 | 0.273 | 2.4 | ||||
| 29 September 2012 7:00 p.m. | 0.350 | 0.269 | 3.8 | ||||
| 29 September 2012 8:00 p.m. | 0.348 | 0.267 | 5.2 | ||||
| 29 September 2012 9:00 p.m. | 0.348 | 0.265 | 4.0 |
Table 4.
Unsaturated Flow Parameters used in the Study.
| Fitting Parameters | Ɵs | Ɵr | |||
|---|---|---|---|---|---|
| α | n | m | |||
| Field SWCC | 0.089 | 3.8 | 0.74 | 0.46 | 0.11 |
Publisher’s Note: MDPI stays neutral with regard to jurisdictional claims in published maps and institutional affiliations. |
© 2022 by the authors. Licensee MDPI, Basel, Switzerland. This article is an open access article distributed under the terms and conditions of the Creative Commons Attribution (CC BY) license (https://creativecommons.org/licenses/by/4.0/).
Share and Cite
MDPI and ACS Style
Ahmed, A.; Hossain, S. Field Determination of Unsaturated Permeability and Flow Properties through Subgrade Instrumentation. Geosciences 2022, 12, 95. https://doi.org/10.3390/geosciences12020095
AMA Style
Ahmed A, Hossain S. Field Determination of Unsaturated Permeability and Flow Properties through Subgrade Instrumentation. Geosciences. 2022; 12(2):95. https://doi.org/10.3390/geosciences12020095
Chicago/Turabian StyleAhmed, Asif, and Sahadat Hossain. 2022. "Field Determination of Unsaturated Permeability and Flow Properties through Subgrade Instrumentation" Geosciences 12, no. 2: 95. https://doi.org/10.3390/geosciences12020095
Note that from the first issue of 2016, this journal uses article numbers instead of page numbers. See further details here.