Article

Mangifera indica as Bioindicator of Mercury Atmospheric Contamination in an ASGM Area in North Gorontalo Regency, Indonesia

1
Graduate School of Science and Engineering, Ehime University, Matsuyama 790-8577, Japan
2
Faculty of Collaborative Regional Innovation, Ehime University, Matsuyama 790-8577, Japan
3
CSIRO Mineral Resources Program, Rm 206, School of Physics, University of Melbourne, Parkville VIC 3010, Australia
4
Cyclotron Research Centre, Iwate Medical University, 348-58 Tomegamori, Takizawa, Iwate 020-0173, Japan
*
Author to whom correspondence should be addressed.
Geosciences 2018, 8(1), 31; https://doi.org/10.3390/geosciences8010031
Submission received: 20 November 2017 / Revised: 31 December 2017 / Accepted: 9 January 2018 / Published: 19 January 2018

Abstract

:
We report the atmospheric Hg contamination in an artisanal and small-scale gold mining (ASGM) area in North Gorontalo, Indonesia. It is well known that atmospheric Hg contaminates the air, water, soil, and living organisms, including trees. In this study, we calculated total weight of heavy metals, especially Hg, and quantitatively measure the concentrations of heavy metals, especially Hg, in tree bark from an ASGM area. Tree bark can be used for the environmental assessment of atmospheric contamination because it attaches and absorbs heavy metals. Atmospheric Hg and other heavy metals, including Fe and Mn, and As were detected on the tree bark samples. The total weight of Hg, As, Fe, and Mn in the tree bark samples ranged from undetectable (ND) to 9.77, ND to 81.3, 124–4028, 37.0–1376 µg dry weight (DW), respectively per weight of sample. Based on quantitatively analysis micro-PIXE, the highest concentrations of all these metals were detected in the outer part of the bark. We conclude that tree bark can adsorb atmospheric contamination, which is then absorbed into the inner tissues.

1. Introduction

Artisanal and small-scale gold mining (ASGM) provides income to many poor communities predominantly in developing countries, such as Indonesia, where it is also one the major sources of Hg contamination. Mercury is extremely dangerous and contaminates the air, water, soil, and living organisms, including trees. ASGM activity is implicated in contamination issues which seriously compromise ecosystem and human health which estimated about 50 million workers in over 70 countries [1,2]. The health of miners and inhabitants living within or outside an area affected by Hg contamination is affected by the inhalation of atmospheric Hg [3]. Anthropogenic Hg emissions into the atmosphere significantly interfere with the natural Hg cycle [4]. Estimates of natural global Hg emissions into the atmosphere vary by orders of magnitude [4,5]. The source of atmospheric Hg derived from ASGM is the amalgamation process, in which amalgam is burned in a small charcoal fire, releasing Hg into the atmosphere [3].
Heavy metals pollution is a major environmental challenge due to its destructive and harmful effects on living organisms when their concentrations exceed a permissible limits [6]. The main sources of heavy metal pollution are agricultural run-off and urban areas, discharges from mining, factories and municipal sewer systems, leaching from dumps and former industrial sites, and atmospheric deposition [7]. Plants are sensitive to their environmental conditions, and their elemental compositions actively reflect changes in these conditions [8,9,10]. Tree bark, in particular, can be used to assess the status of the environment, especially the level of Hg contamination. The enrichment of trace elements in tree bark can also allow us to trace a pollution source [11]. Airborne particles are trapped within the structure of tree bark, where they accumulate over several years [12]. The mechanisms of trace element uptake by the plant involve both root uptake and foliar absorption, which includes the deposition of particulate matter on the plant leaves [13]. The different uptake patterns of plants are based on three factors: the plant species, the element species, and the conditions at specific sites [14,15].
The proton microprobe is an ideal tool for the nondestructive in situ microanalysis of mineral grains [16]. By utilizing proton-induced X-ray emissions (PIXEs), it can detect trace elements in situ with a detection sensitivity of a few ppm in individual grains for most minerals and of <1 ppm in some cases [17]. A quantitative analysis with micro-PIXE circumvents the standardization problem that plagues other instrumental techniques, such as the ion microprobe, because no standard is required [16]. Micro-PIXE spectrometry has been used to study the localization of trace metals in metal-indicator and metal-hyperaccumulating plant species [18].
In this study, we investigated the heavy metals pollution, especially Hg, arising from the amalgamation process in an ASGM area. Tree bark was used for the environmental assessment in this study because it attaches and absorbs heavy metals, especially Hg vapor. The aim of the study was to determine the total weight of several heavy metals and especially distributions of Hg total weight in the tissues of tree bark attributable to atmospheric contamination in an ASGM area in the North Gorontalo Regency, Indonesia.

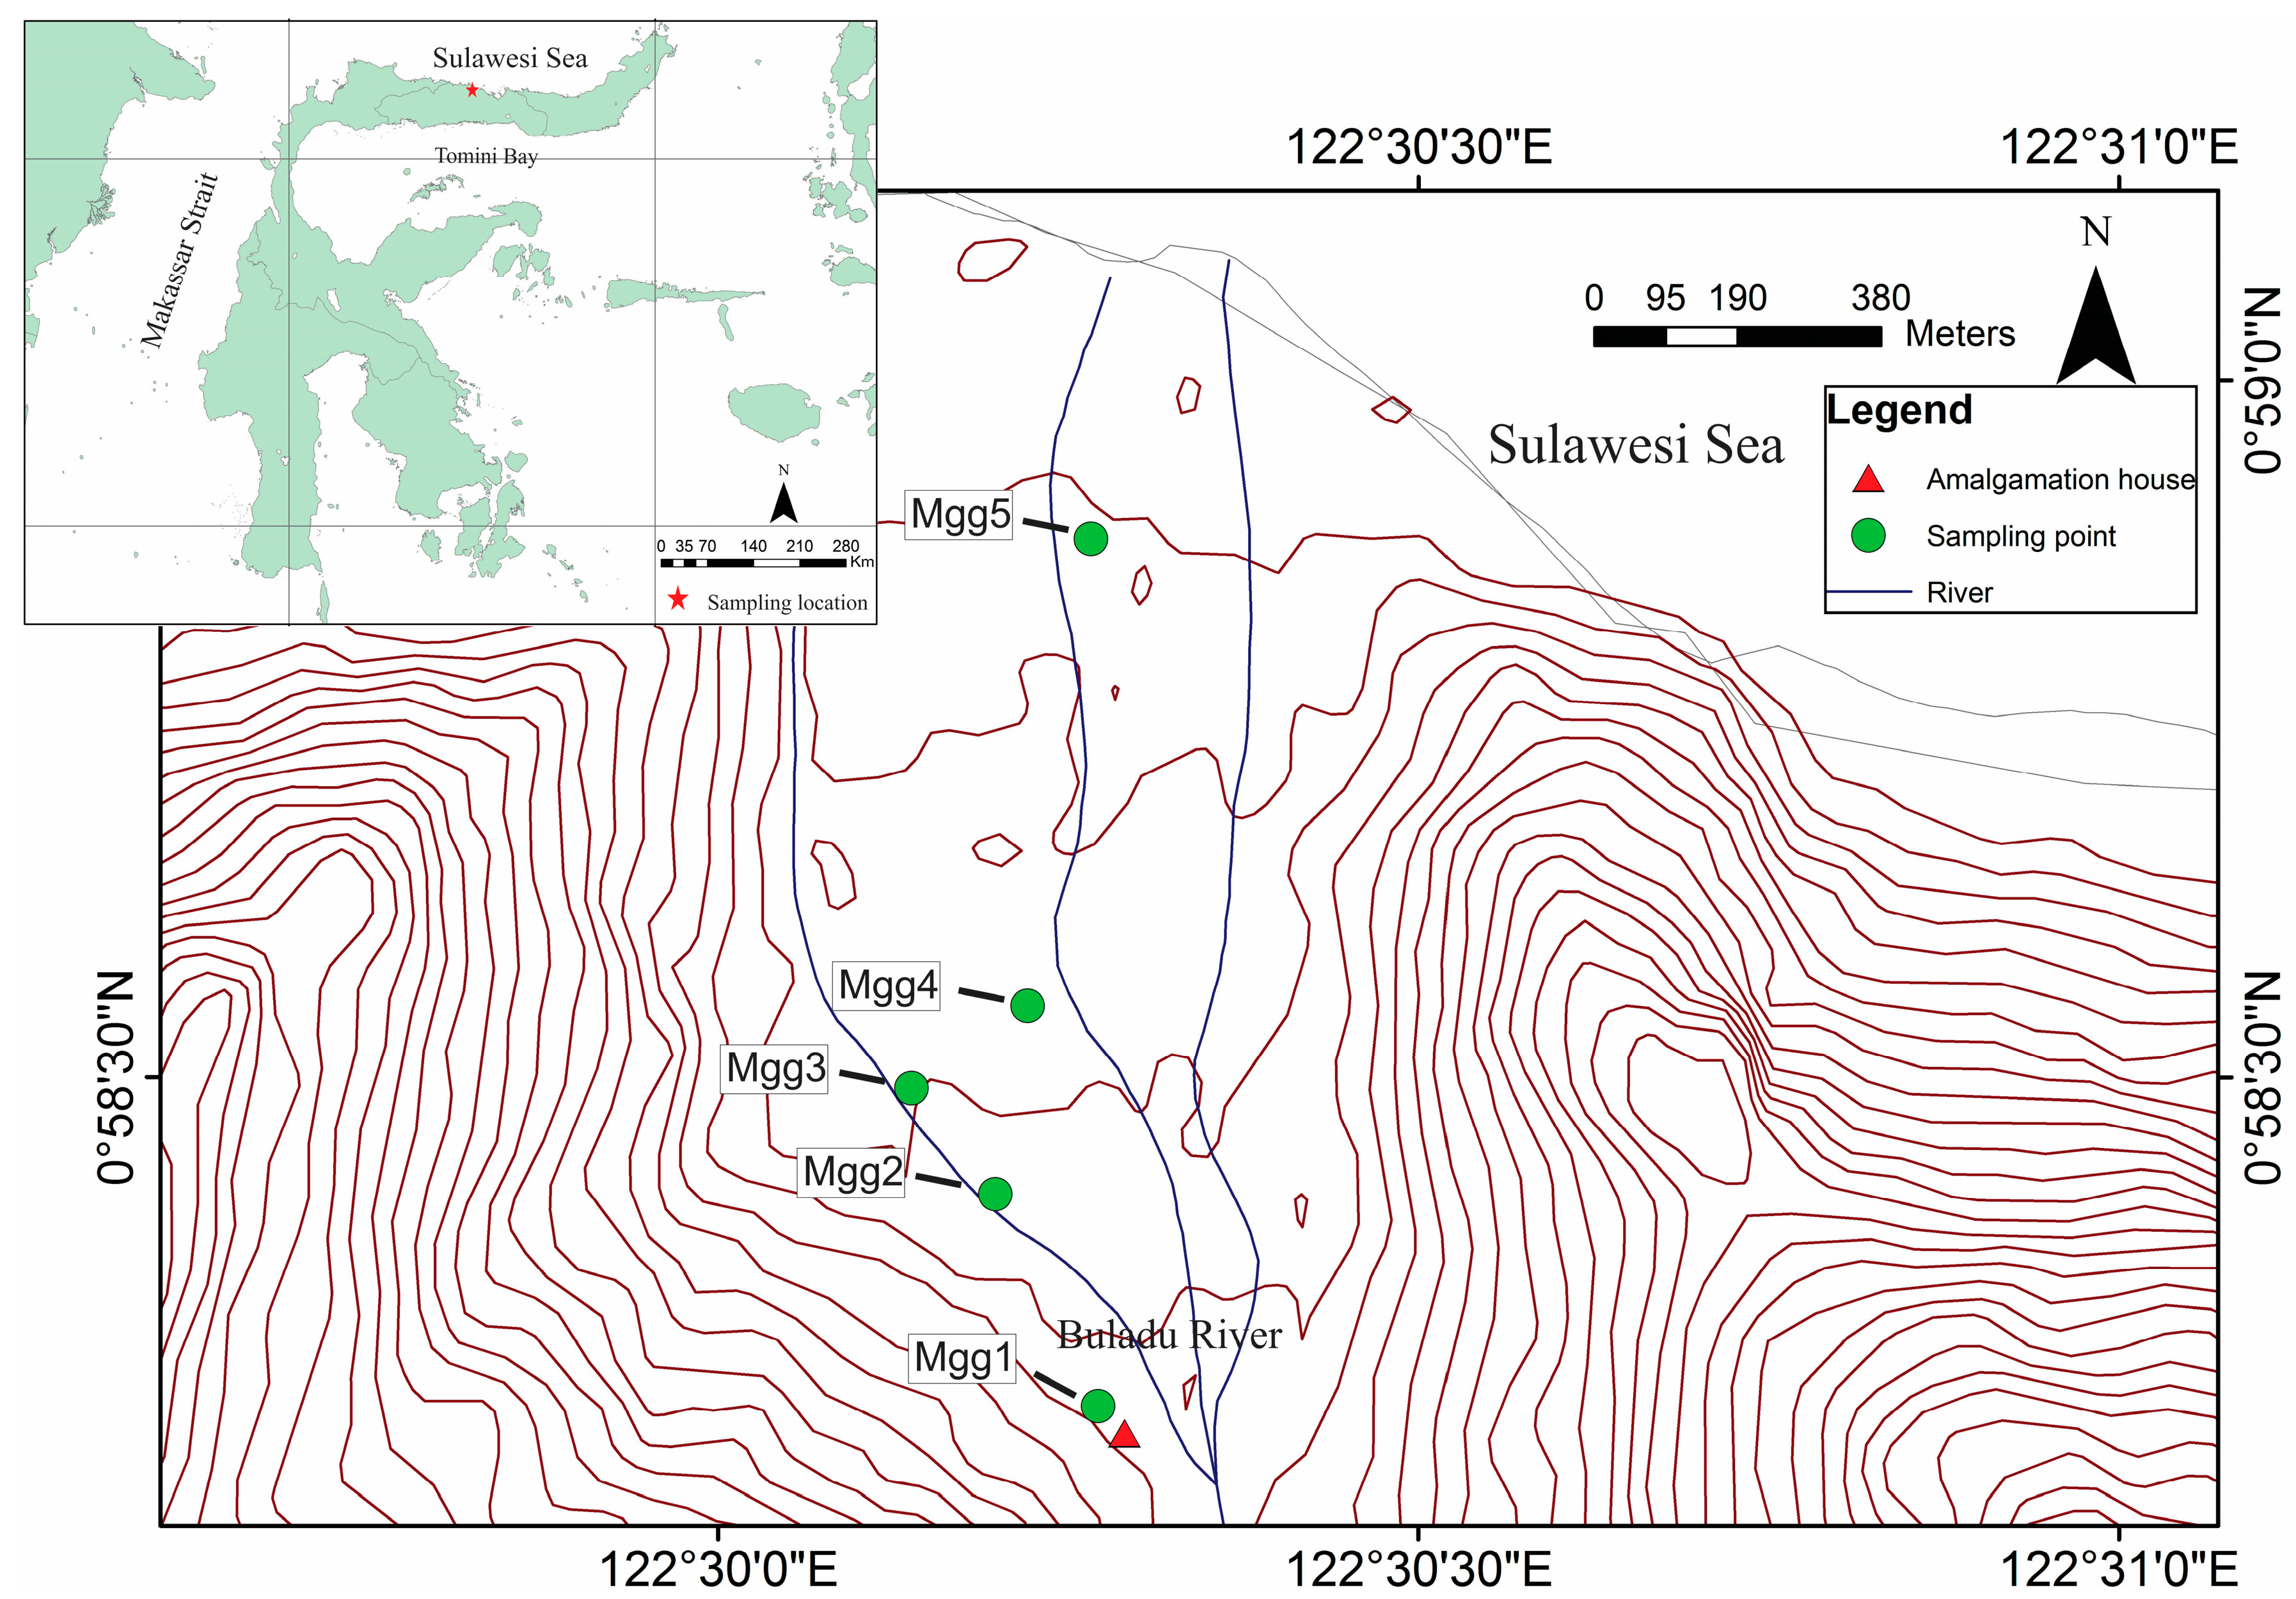
2. Materials and Methods

We performed a field survey and laboratory analyses to determine the heavy metal concentrations (especially Hg) in tree bark to assess the environmental contamination in the study area. We obtained tree bark samples from the species Mangifera indica in the ASGM area in the North Gorontalo Regency, Indonesia, shown in Figure 1. The tree bark samples were collected about five M. indica tree at several different heights in each tree (100, 200, and 300 cm). Sampling numbers of this study were Mgg1, Mgg2, Mgg3, Mgg4, and Mgg5 based on distance to the amalgamation house. The diameter of Mgg1, Mgg2, Mgg3, Mgg4, and Mgg5 tree were 35.6, 46.2, 39.2, 41.1, and 47.5 cm, respectively. The bark from each tree was collected as fragments with dimensions of about 10 × 10 cm to ensure homogeneous sampling.

2.1. Sample Preparation

The tree bark samples were dried at ~80 °C for two days in a ventilated oven. About 15 cm2 of each sample was crushed to a fine powder with a powder mill (Varian PM-2005m, Osaka Chemical Co., Ltd., Osaka, Japan) to produce homogeneous samples for analysis. The tree bark powders (30 mg of each sample) were digested with a mixture of indium (In) and HNO3 in a ratio of 3:100, before the heavy metal concentrations such as Pb, Zn, Fe (especially Hg), and As were determined with PIXE [19,20] at Iwate Medical University (Iwate, Japan). The dimensions of the tree bark samples (about 15 cm2) were calculated with the ImageJ (version 1.48) software (National Institutes of Health, Bethesda, MD, USA).

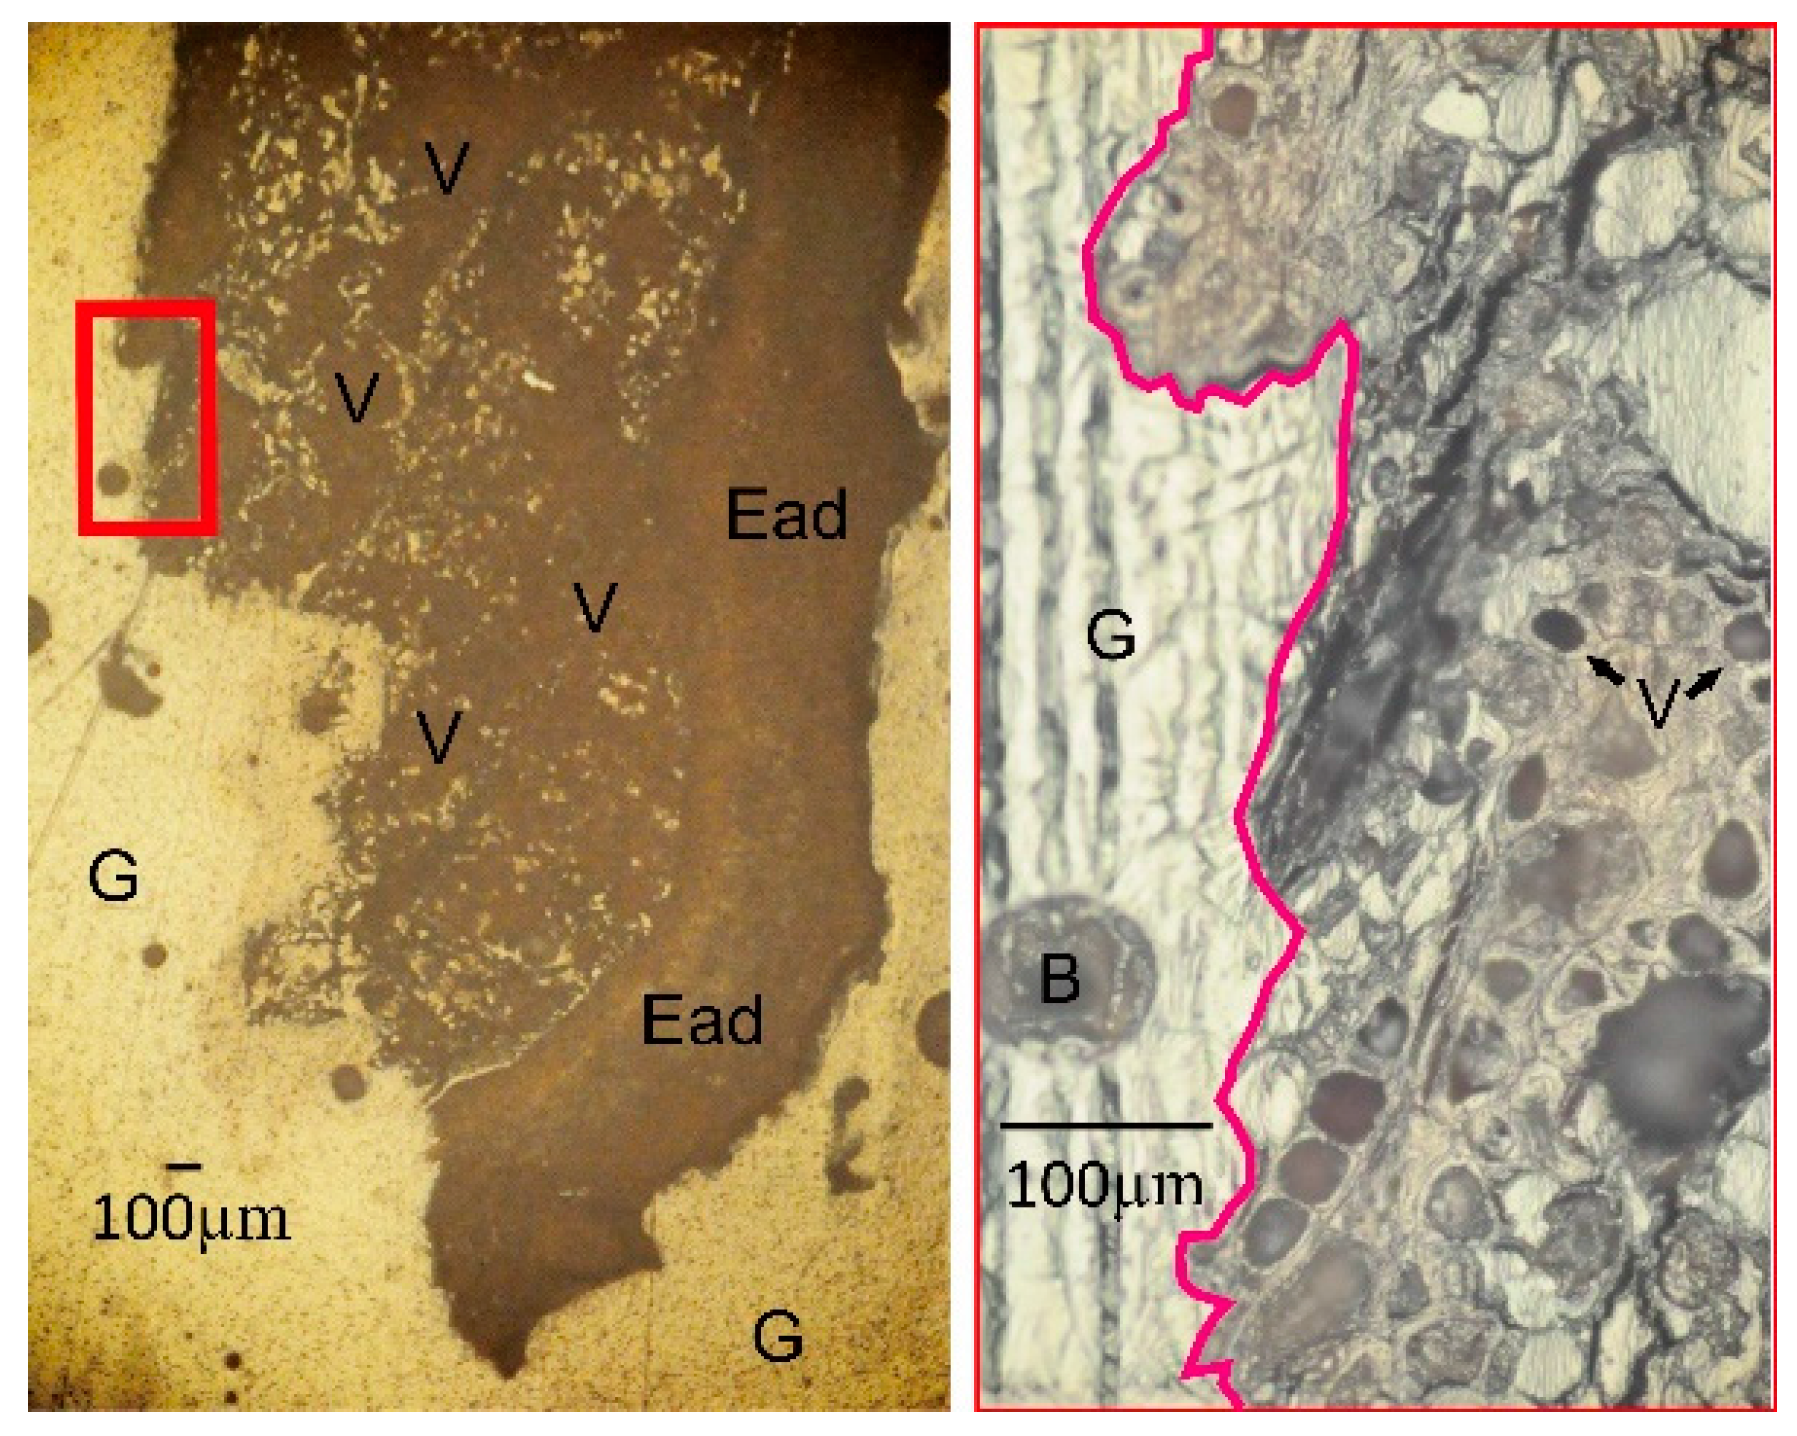
2.2. Thin Section Preparation

The tree bark samples were first dried at ~80 °C for two days in a ventilated oven. Once dry, the samples were cut in cross-sections to prepare thin sections. A glue was made by mixing Specifix Resin and Specifix-20 Curing Agent (Struers, Cleveland, OH, USA) in a ratio of 5.2:1 (v/v). During mixing, we avoided getting bubbles in the mixture to ensure high-quality thin sections. The cross-sections of tree bark and glue were then mixed in above glass holder and placed under vacuum to completely remove any bubbles that had formed during the mixing process. The samples were left to harden for about two days and were then polished with diamond pad. Thin sections were prepared for analysis and detailed observation. The matrix of the tree bark was examined with reflected light microscopy (Figure 2).

2.3. Analytical Procedure

The quantitative concentrations of heavy metals including Hg in the tree bark samples were determined with the micro-PIXE instrument, PIXE line and system was built inhouse at the University of Melbourne (Australia). The background spectrum for micro-PIXE is about two orders of magnitude lower than that of an electron probe [21,22] making it a powerful tool for the measurement of heavy metal elements with ppm-level sensitivity [23,24]. Prior to analysis, all samples were polished and carbon coated for charge collection measurement. The Microdaq system was used to collect all data recorded as the 3MeV proton beam was raster scanned across the sample under test. For this work a 100 µm Al filter was used to improve the quality of statistic around the Hg lines and beam currents of the order of 1-2nA were used. The proton beam focus around 2 µm [25,26,27]. Quantitative 2D elemental images were obtained with the Dynamic Analysis method [28], an analytical method for projecting the quantitative major and trace element images from PIXE data. The method deconvolutes the full elemental spectral signatures to produce images from which overlapping elements, detector effects, and background noise have been removed. The images are quantitative and stored in units of ppm [24,28].
The GeoPIXE II software package (CSIRO, Clayton, Australia) [24,29] was used to analyze the PIXE spectra and generate overlap-resolved and background-subtracted quantitative elemental maps with the Dynamic Analysis method [24,29].

2.4. Calculation of Total Weight

The accumulation of Hg can be estimated from the total weight of mercury (THg). THg is defined as the dry weight of the sample multiplied by the Hg concentration determined by the PIXE analysis in 100 cm2 of sample.
THg = DW × CHg
where DW is the dry weight of the sample and CHg is the Hg concentration.

2.5. Statistical Analysis

Statistical analyses were performed with SPSS Statistic 21 for Windows (IBM, Armonk, NY, USA). The tree bark data were log-normally distributed before their analysis, and statistically significant differences (p < 0.05) were determined with one-way ANOVA.

3. Results

3.1. Estimates of Total Weight

In this study, we screened M. indica bark in an ASGM area for heavy metal contamination, using a bioindicator approach to evaluate atmospheric contamination. We sampled the bark from the trees at various heights with this experimental design to establish the height to which the atmospheric Hg contamination extends in the ASGM area. The total weight of Hg in the tree bark samples ranged from undetectable (ND) to 9.77 µg DW per weight of sample (Table 1).
A plant can be categorized as toxic if the concentration of Hg exceeds 1 ppm [30]. This study shows that M. indica can accumulate high concentrations of Hg from atmospheric contamination through its bark. It also demonstrates that the bark of M. indica can be used as a bioindicator of atmospheric Hg contamination in environmental assessments of ASGM areas. The As total weight in the tree barks ranged from ND to 81.3 µg-DW (Table 2). The bark of M. indica also accumulated lead (Pb), cobalt (Co), and manganese (Mn) at total weight ranges of 2.20–106, ND–8.69, and 37.0–1376 µg DW per weight of sample respectively (Table 1). The bark of M. indica also accumulated other heavy metals, including zinc (Zn), iron (Fe), and nickel (Ni), with total weight ranges of 5.90–131, 124–4028, and 1.33–19.1 µg DW, per weight of sample respectively (Table 2). These results suggest that M. indica accumulates high total weights of As, Pb, Co, Mn, Zn, Fe, and Ni (Table 1 and Table 2, Figures 3 and 4) in this ASGM area. Therefore, this study demonstrates that the bark of M. indica can be used as a biomarker for atmospheric contamination with heavy metals, especially Hg, in environmental assessment projects.

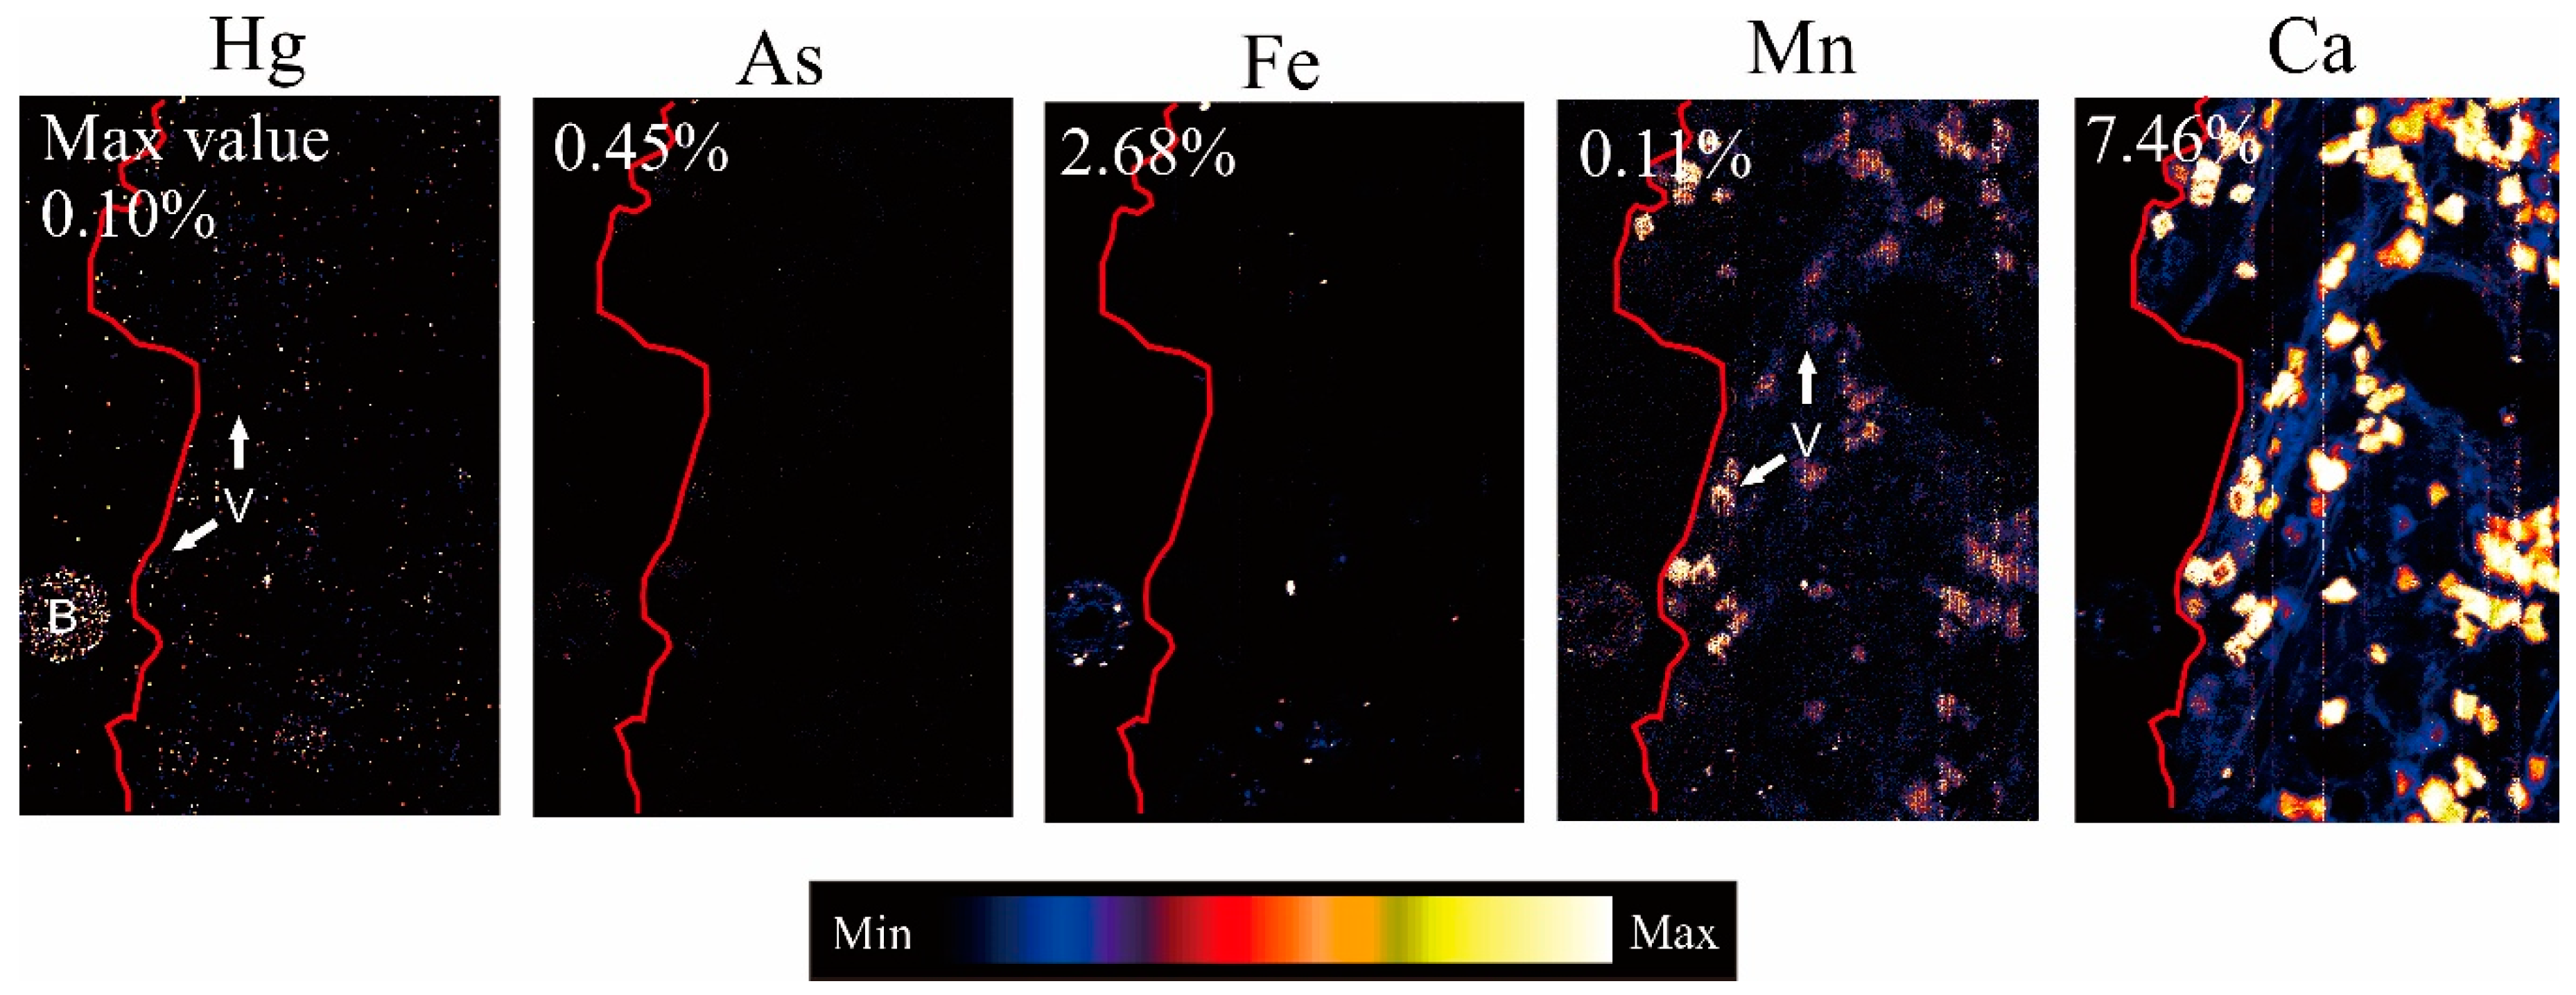
3.2. Quantitavie Analysis Results Using Dynamic Analysis of Micro-PIXE

The spectrum shown in the Figure 3 is the total PIXE spectrum for a scan of tree bark and the images show the elemental distributions projected with the Dynamic Analysis method [24,28]. The Dynamic Analysis transform for imaging is built on a standardless PIXE method developed at the CSIRO for the quantitative analysis of PIXE [24,28]. Accurate elemental mapping using Dynamic Analysis is invaluable, because in most cases, it eliminates the risk of producing false images that arise as artifacts of the mapping method [31]. The resulting images are stored in ppm/wt%–charge or ppm–flux units. The quantitative 2D elemental images generated with the micro-PIXE analysis indicated that the maximum values for Hg, As, Fe, and Mn, in the Mgg5 1 m tree bark sample of M. indica, were 0.10%, 0.45%, 2.68%, and 0.11%, respectively (Figure 3).

4. Discussion

4.1. Dynamic Analysis of 2D Tree Barks Concentrations of Hg

Micro-PIXE was suitable for scanning these samples because its lateral resolution extends to the submicrometer range, and for localizing the elements of interest and mapping their distributions in the inspected area [26]. It is also an ideal technique for localizing the sites of metal accumulation in plants [27]. Our quantitative analysis of M. indica provides valuable data that clarify the distributions of heavy metals, especially Hg. It clearly shows heterogeneities in the heavy metal concentrations, especially Hg, within the tree bark tissues. The atmospheric Hg contamination was absorbed into the inner part of the bark through the adaxial epidermis (Ead) and the vascular (V) [32] tissue after it attached to the outer bark. There is probably barrier of mercury translocation from root to upper parts [33]. The Hg is entering the bole of the tree through the bark either from atmospheric deposition directly to the bark or the transport of atmospheric Hg from the leaves through the phloem rather than uptake by root [34]. This indicates that atmospheric Hg and other heavy metals can penetrate to the inner parts of the plant through the phloem activity during plant’s metabolism.
Hg, like other metals, can be translocated to the aboveground tissue along a similar pathway to that used by nutrients in solution [35]. However, Hg translocation is reduced by the strong bonds between the metal and the cysteine thiol groups in the roots, and thus blocks the transport of nutrients into the vascular tissues and consequently the supply of nutrients to the aerial parts of the plants [35]. This study suggests that tree bark can be used in the environmental assessment of atmospheric Hg contamination in ASGM areas.

4.2. Total Hg Weight Distribution Based on Tree Height

No analysis of M. indica tree bark in ASGM areas has been reported until now. In this study, the tree bark analysis with total weight of heavy metals (Table 1 and Table 2), especially Hg, and these accumulated in the trees at heights of 1, 2, and 3 m (Figure 4). In this study, the ND results are probably attributable to the leaching of Hg during the weathering condition at different sampling heights. This study has shown that Hg can be suspended to a height of 3 m in the atmosphere. Furthermore, Hg contaminated the tree bark at some distance from the site of amalgamation, probably with the assistance of atmospheric weathering condition. Therefore, weathering condition significantly affect the distribution of THg weight in the atmosphere, which then contaminates the tree bark in the vicinity. The average of THg calculation in 1 m, 2 m, and 3 m were 3.81, 3.63, and 1.87 µg DW per weight of sample. Based on average calculation of five sampling point, Hg accumulated to its highest level at 1 m above ground level (Figure 4). Overall, this study suggests that the bark of M. indica trees has great potential utility as a bioindicator of atmospheric Hg contamination in ASGM areas.

4.3. THg Weight Distribution Based on Location

The sample location in this study and its topography are shown in Figure 1 and Figure 4 and each bark sample was collected at a different topographic position. The concentrations of Hg in the tree bark suggested that topography significantly influences the accumulation of Hg in the atmosphere, together with the weathering condition The map of the THg distribution (Figure 4) suggests that the distribution of THg weight in the tree bark is affected by the distance to the amalgamation site, decreasing with distance, especially at heights of 2–3 m (Figure 4). This is probably attributable to the weathering condition such wind direction, which move the Hg in the atmosphere and deposit it at lower topographic sites in the estuary area (Figure 4). In this study, the topography at the sampling site significantly influenced the accumulation of Hg in the tree bark.

5. Conclusions

In this study, we have showed the distributions and concentrations of atmospheric Hg contamination in tree bark of M. indica. Our micro-PIXE results showed that Hg accumulates in the species M. indica after its deposition on the bark. The height level of 1 m has highest average on THg in the tree bark. Therefore, our data suggest that there is pathway via which Hg is absorbed into the inner vascular tissues of tree bark and that the THg distribution is influenced by factors such as the weathering condition and topography. This micro-PIXE analysis suggests that the bark of the M. indica tree is a good candidate bioindicator of atmospheric contamination with Hg and other heavy metals in ASGM areas, and has utility in the environmental assessment of air pollution.

Acknowledgments

Hendra Prasetia wishes to thank to the Japanese Government for providing a Monbukagakusho Scholarship for graduate studies at Ehime University, and the North Gorontalo Regency Government of Gorontalo Province that allowed the author to conduct the research activity.

Author Contributions

All authors contributed to the work presented in the manuscript. Hendra Prasetia, as the principal researcher, which was undertaken in association with his PhD program at Ehime University. Masayuki Sakakibara as PhD supervisor and Koji Omori as a joint research on providing tree bark sample. Jamie S. Laird provided the micro-PIXE measurement of tree bark samples. Koichiro Sera provided the PIXE measurement of tree bark samples and Idham A. Kurniawan provided thin section preparation on tree bark and commentary during development of the manuscript.

Conflicts of Interest

The authors declare no conflict of interest.

References

  1. Zolnikov, T.R. Science of the Total environment limitations in small artisanal gold mining addressed by educational components paired with alternative mining methods. Sci. Total Environ. 2012, 419, 1–6. [Google Scholar] [CrossRef] [PubMed]
  2. Reichelt-Brushett, A.J.; Stone, J.; Howe, P.; Thomas, B.; Clark, M.; Male, Y.; Nanlohy, A.; Butcher, P. Geochemistry and mercury contamination in receiving environments of artisanal mining wastes and identified concerns for food safety. Environ. Res. 2017, 152, 407–418. [Google Scholar] [CrossRef] [PubMed]
  3. Taylor, H.; Appleton, J.D.; Lister, R.; Smith, B.; Chitamweba, D.; Mkumbo, O.; Machiwa, J.F.; Tesha, A.L.; Beinhoff, C. Environmental assessment of mercury contamination from the Rwamagasa artisanal gold mining centre, Geita District, Tanzania. Sci. Total Environ. 2005, 343, 111–133. [Google Scholar] [CrossRef] [PubMed]
  4. Fitzgerald, W.F.; Engstrom, D.R.; Mason, R.P.; Nater, E.A. The case for atmospheric mercury contamination in remote areas. Environ. Sci. Technol. 1998, 32, 1–7. [Google Scholar] [CrossRef]
  5. Rasmussen, P.E. Current methods of estimating atmospheric mercury fluxes in remote areas. Environ. Sci. Technol. 1994, 28, 2233–2241. [Google Scholar] [CrossRef] [PubMed]
  6. Ayodele, O.S.; Awokunmi, E.E.; Oshin, O.O. Appraisal of heavy metals pollution in the stream sedi- ments from okemesi-ijero area, southwestern nigeria: In-Sight from geochemical fractionations and multivariate analysis techniques. J. Phys. Sci. Environ. Stud. 2017, 3, 36–47. [Google Scholar]
  7. Ubeid, K.F. Assessment of Heavy Metals Pollution in Tide and Shelf Zone Sediments along the Southern Part of Gaza Strip Coast, Palestine. IUG J. Nat. Stud. 2017, 25, 51–55. [Google Scholar]
  8. Vtorova, V.N. Substantiation of methods and objects of observations over chemical composition of plants during monitoring of forest ecosystem. Inf. Bull. Probl. III Counc. Mutual Econ. Help 1987, 1, 1–2. [Google Scholar]
  9. Vtorova, V.N. Quantitative evalution of the chemical similarity of needles of Picea schrenkiana with other spruce species in natural and artificial growth conditions. Biol. Bull. Acad. Sci. USSR 1991, 17, 245–253. [Google Scholar]
  10. Kabata-Pendias, A.; Pendias, H. Trace Elements in Soils and Plants; CRC Press: Boca Raton, FL, USA, 1984; Volume 315. [Google Scholar]
  11. Geagea, M.L.; Stille, P.; Millet, M.; Perrone, T. REE characteristics and Pb, Sr and Nd isotopic compositions of steel plant emissions. Sci. Total Environ. 2007, 373, 404–419. [Google Scholar] [CrossRef] [PubMed]
  12. Catinon, M.; Ayrault, S.; Clocchiatti, R.; Boudouma, O.; Asta, J.; Tissut, M.; Ravanel, P. The anthropogenic atmospheric elements fraction: A new interpretation of elemental deposits on tree barks. Atmos. Environ. 2009, 43, 1124–1130. [Google Scholar] [CrossRef]
  13. Olajire, A.A.; Ayodele, E.T. Study of atmospheric pollution levels by trace elements analysis of tree bark and leaves. Bull. Chem. Soc. Ethiop. 2003, 17, 11–17. [Google Scholar] [CrossRef]
  14. Markert, B. Presence and significance of naturally occurring chemical elements of the periodic system in the plant organism and consequences for future investigations on inorganic environmental chemistry in ecosystems. Plant Ecol. 1992, 103, 1–30. [Google Scholar]
  15. Markert, B. Plants as Biomonitors for Heavy metal Pollution of the Terrestrial Environment; Wiley-Balckwell: Hoboken, NJ, USA, 1994. [Google Scholar]
  16. Ryan, C.G.; Cousens, D.R.; Sie, S.H.; Griffin, W.L.; Suter, G.F.; Clayton, E. Quantitative pixe microanalysis of geological matemal using the CSIRO proton microprobe. Nucl. Instrum. Methods Phys. Res. Sect. B Beam Interact. Mater. Atoms 1990, 47, 55–71. [Google Scholar] [CrossRef]
  17. Folkmann, F.; Borggreen, J.; Kjeldgaard, A. Sensitivity in trace-element analysis by p, α and 16O induced X-rays. Nucl. Instrum. Methods 1974, 119, 117–123. [Google Scholar] [CrossRef]
  18. Siegele, R.; Kachenko, A.G.; Bhatia, N.P.; Wang, Y.D.; Ionescu, M.; Singh, B.; Baker, A.J.M.; Cohen, D.D. Localisation of trace metals in metal-accumulating plants using μ-PIXE. X-Ray Spectrom. 2008, 37, 133–136. [Google Scholar] [CrossRef]
  19. Sera, K.; Yanagisawa, T.; Tsunoda, H.; Futatsugawa, S.; Hatakeyama, S.; Saitoh, Y.; Suzuki, S.; Orihara, H. Bio-PIXE at the Takizawa facility (Bio-PIXE with a baby cyclotron). Int. J. PIXE 1992, 2, 325–330. [Google Scholar] [CrossRef]
  20. Prasetia, H.; Sakakibara, M.; Sueoka, Y.; Sera, K. Pteris cretica as a Potential Biomarker and Hyperaccumulator in an Abandoned Mine Site, Southwest Japan. Environments 2016, 3, 15. [Google Scholar] [CrossRef]
  21. Reuter, W.; Lurio, A.; Cardone, F.; Ziegler, J.F. Quantitative analysis of complex targets by proton-induced X-rays. J. Appl. Phys. 1975, 46, 3194–3202. [Google Scholar] [CrossRef]
  22. Johansson, S.A.E.; Johansson, T.B. Analytical application of particle induced X-ray emission. Nucl. Instrum. Methods 1976, 137, 473–516. [Google Scholar] [CrossRef]
  23. Campbell, J.L.; Maxwell, J.A.; Teesdale, W.J.; Wang, J.-X.; Cabri, L.J. Micro-PIXE as a complement to electron probe microanalysis in mineralogy. Nucl. Instrum. Methods Phys. Res. Sect. B Beam Interact. Mater. Atoms 1990, 44, 347–356. [Google Scholar] [CrossRef]
  24. Ryan, C.G. Quantitative trace element imaging using PIXE and the nuclear microprobe. Int. J. Imaging Syst. Technol. 2000, 11, 219–230. [Google Scholar] [CrossRef]
  25. Sugawara, H.; Sakakibara, M.; Belton, D.; Suzuki, T. Quantitative micro-PIXE analysis of heavy-metal-rich framboidal pyrite. J. Mineral. Petrol. Sci. 2008, 103, 131–134. [Google Scholar] [CrossRef]
  26. Nečemer, M.; Kump, P.; Ščančar, J.; Jaćimović, R.; Simčič, J.; Pelicon, P.; Budnar, M.; Jeran, Z.; Pongrac, P.; Regvar, M.; et al. Application of X-ray fluorescence analytical techniques in phytoremediation and plant biology studies. Spectrochim. Acta Part B At. Spectrosc. 2008, 63, 1240–1247. [Google Scholar] [CrossRef]
  27. Krämer, U.; Grime, G.W.; Smith, J.A.C.; Hawes, C.R.; Baker, A.J.M. Micro-PIXE as a technique for studying nickel localization in leaves of the hyperaccumulator plant Alyssum lesbiacum. Nucl. Instrum. Methods Phys. Res. Sect. B Beam Interact. Mater. Atoms 1997, 130, 346–350. [Google Scholar] [CrossRef]
  28. Ryan, C.G.; Jamieson, D.N.; Churms, C.L.; Pilcher, J.V. A new method for on-line true-elemental imaging using PIXE and the proton microprobe. Nucl. Instrum. Methods Phys. Res. Sect. B Beam Interact. Mater. Atoms 1995, 104, 157–165. [Google Scholar] [CrossRef]
  29. Kachenko, A.G.; Bhatia, N.P.; Singh, B.; Siegele, R. Arsenic hyperaccumulation and localization in the pinnule and stipe tissues of the gold-dust fern (Pityrogramma calomelanos (L.) Link var. austroamericana (Domin) Farw.) using quantitative micro-PIXE spectroscopy. Plant Soil 2007, 300, 207–219. [Google Scholar] [CrossRef]
  30. Kabata-Pendias, A. Trace Elements in Soils and Plants; CRC Press LCC: Boca Raton, FL, USA, 2011. [Google Scholar]
  31. Turnau, K.; Przybyłowicz, W.J.; Mesjasz-Przybyłowicz, J. Heavy metal distribution in Suillus luteus mycorrhizas—As revealed by micro-PIXE analysis. Nucl. Instrum. Methods Phys. Res. Sect. B Beam Interact. Mater. Atoms 2001, 181, 649–658. [Google Scholar] [CrossRef]
  32. Vogel-Mikus, K.; Regvar, M.; Mesjasz-Przybyłowicz, J.; Przybyłowicz, W.J.; Simcic, J.; Pelicon, P.; Budnar, M. Spatial distribution of cadmium in leaves of metal hyperaccumulating Thlaspi praecox using micro-PIXE. New Phytol. 2008, 179, 712–721. [Google Scholar] [CrossRef] [PubMed]
  33. Patra, M.; Bhowmik, N.; Bandopadhyay, B.; Sharma, A. Comparison of mercury, lead and arsenic with respect to genotoxic effects on plant systems and the development of genetic tolerance. Environ. Exp. Bot. 2004, 52, 199–223. [Google Scholar] [CrossRef]
  34. Siwik, E.I.H.; Campbell, L.M.; Mierle, G. Distribution and trends of mercury in deciduous tree cores. Environ. Pollut. 2010, 158, 2067–2073. [Google Scholar] [CrossRef] [PubMed]
  35. Lomonte, C.; Wang, Y.; Doronila, A.; Gregory, D.; Baker, A.J.M.; Siegele, R.; Kolev, S.D. Study of the spatial distribution of mercury in roots of vetiver grass (Chrysopogon zizanioides) by micro-PIXE spectrometry. Int. J. Phytorem. 2014, 16, 1170–1182. [Google Scholar] [CrossRef] [PubMed]
Figure 1. The M. indica sampling point in East Sumalata District, Gorontalo Province, Indonesia. Sample numbering is based on distance to the amalgamation house.
Geosciences 08 00031 g001
Figure 2. The microscope image view of vascular tissue of M. indica on sampling Mgg5 1 m. Ead: Epidermis adaxial; V: Vascular tissue; B: Bubble; G: Glass.
Geosciences 08 00031 g002
Figure 3. The quantitative two-dimensional (2D) elementals images compiled from micro-proton-induced X-ray emissions (PIXE) analyses of M. indica tree bark, Mgg 5 1 m, artisanal and small-scale gold mining (ASGM) area in North Gorontalo Regency, Indonesia. These images show the detail concentrations and distributions of heavy metals, especially Hg in the tree bark. V: Vascular tissue.
Geosciences 08 00031 g003
Figure 4. Distribution maps of the total weight of mercury (THg) in the tree barks of M. indica (N = 15). Sample numbering based on distance to amalgamation house.
Geosciences 08 00031 g004
Table 1. Total weight of heavy metals of M. indica tree barks.
SamplesT(Hg) (µg-DW) ± SDT(Pb) (µg-DW) ± SDT(Co) (µg-DW) ± SDT(Mn) (µg-DW) ± SD
Mgg1 1 m3.78 ± 3.6015.8 ± 4.426.38 ± 6.80109 ± 6.96
Mgg1 2 m6.13 ± 3.5131.6 ± 6.05ND145 ± 9.55
Mgg1 3 mND11.9 ± 4.38ND313 ± 23.1
Mgg2 1 m4.86 ± 13.2106 ± 37.4ND1376 ± 88.3
Mgg2 2 m2.26 ± 6.7759.7 ± 11.9ND664 ± 39.4
Mgg2 3 m9.33 ± 4.9820.6 ± 5.738.69 ± 6.42136 ± 9.24
Mgg3 1 m6.07 ± 4.9526.7 ± 9.216.51 ± 3.13322 ± 22.6
Mgg3 2 mND12.4 ± 3.820.17 ± 0.6143.8 ± 2.56
Mgg3 3 mND14.3 ± 5.035.58 ± 3.6850.8 ± 3.41
Mgg4 1 mND21.6 ± 8.60ND37.0 ± 3.80
Mgg4 2 m9.77 ± 4.0426.5 ± 4.9220.9 ± 6.3556.1 ± 3.37
Mgg4 3 mND77.9 ± 17.4ND47.7 ± 4.50
Mgg5 1 m4.34 ± 7.5436.7 ± 11.54.97 ± 5.3251.7 ± 3.65
Mgg5 2 mND9.94 ± 3.17ND96.0 ± 5.62
Mgg5 3 mNDND8.58 ± 5.0458.6 ± 4.16
T: Total; DW: Dry weight; SD: Standard Deviation; ND: Undetectable.
Table 2. Total weight of heavy metals of M. indica tree barks.
SamplesT(As) (µg-DW) ± SDT(Zn) (µg-DW) ± SDT(Fe) (µg-DW) ± SDT(Ni) (µg-DW) ± SD
Mgg1 1 mND14.6 ± 5.68300 ± 17.94.18 ± 1.22
Mgg1 2 m8.64 ± 1.5738.1 ± 3.06618 ± 37.32.33 ± 1.55
Mgg1 3 mND33.0 ± 3.57162 ± 16.93.28 ± 2.23
Mgg2 1 m81.3 ± 10.8131 ± 9.954028 ± 2575.52 ± 3.48
Mgg2 2 m4.41 ± 3.0230.8 ± 2.89442 ± 29.36.51 ± 2.05
Mgg2 3 mND20.1 ± 1.85130 ± 10.44.42 ± 1.23
Mgg3 1 m12.1 ± 2.4521.9 ± 2.573946 ± 2687.07 ± 1.94
Mgg3 2 mND8.19 ± 0.74244 ± 12.91.70 ± 0.51
Mgg3 3 mND12.3 ± 1.08230 ± 14.31.68 ± 0.63
Mgg4 1 mND37.5 ± 3.24292 ± 20.88.26 ± 1.75
Mgg4 2 mND90.9 ± 4.801006 ± 49.419.1 ± 1.50
Mgg4 3 mND27.2 ± 2.59314 ± 21.21.40 ± 1.54
Mgg5 1 mND12.9 ± 1.31220 ± 13.72.51 ± 0.91
Mgg5 2 mND9.97 ± 1.14955 ± 52.16.31 ± 3.93
Mgg5 3 mND5.90 ± 0.92125 ± 8.771.33 ± 0.84
T: Total; DW: Dry weight; SD: Standard Deviation; ND: Undetectable.

