Recession and Ice Surface Elevation Changes of Baranowski Glacier and Its Impact on Proglacial Relief (King George Island, West Antarctica)


1
Institute of Geophysics, Polish Academy of Sciences, ul. Księcia Janusza 64, 01-452 Warsaw, Poland
2
Institute of Biochemistry and Biophysics, Polish Academy of Sciences, ul. Pawińskiego 5a, 02-106 Warsaw, Poland
*
Author to whom correspondence should be addressed.
Geosciences 2018, 8(10), 355; https://doi.org/10.3390/geosciences8100355
Submission received: 27 July 2018
/
Revised: 14 September 2018
/
Accepted: 18 September 2018
/
Published: 20 September 2018
(This article belongs to the Special Issue Global Climate Change and Geological Processes)
Abstract
:Glacial forefields areas are dynamic landscapes, and due to the glacier frontal position changes, they are sensitive to climatic fluctuations. The results of the analysis of aerial photos, satellite imagery, archival maps, and terrestrial laser scanning surveys are presented. These investigations reveal that the ice surface decreased during the period 1989–2001, when almost the entire current forefield was already uncovered. Moreover, it is shown that, since 1969, there has been a relationship between the changes in air temperature and the changes of the annual front position rate of Baranowski Glacier. Specifically, the results demonstrate that during the cooling observed for the Antarctic Peninsula Regions since 2000, there is a deceleration of the recession rate and ice surface elevation changes of Baranowski Glacier. It is also shown that the fluctuation of the areal extent of the glacier as well as ice surface elevation changes are closely associated with proglacial relief. Moreover, it is shown that the difference in the retreat of the northern and southern tongue of the glacier can be explained by the presence of relatively warm water in the shallow bay, which can enhance the melting process of the northern part. In addition, existence of long flutes and crevasse fill ridges on the analyzed forefield of Baranowski Glacier suggest that the former episodes of its surge, which could happen at least in the northern part of the forefield and middle part of the southern forefield of the glacier.
1. Introduction
Melting glaciers and changes in the frozen ground conditions, primarily controlled by climate changes, strongly influence the geomorphological processes occurring in ice-free areas [1] defined here as glacial forefields. Moreover, glaciers in polar regions play important roles in the functions of local [2] and global ecosystems [3]. Thus, studies on the reaction of glaciers to climate fluctuations [4,5,6] and their impacts on the regional environment are exceptionally important [7].
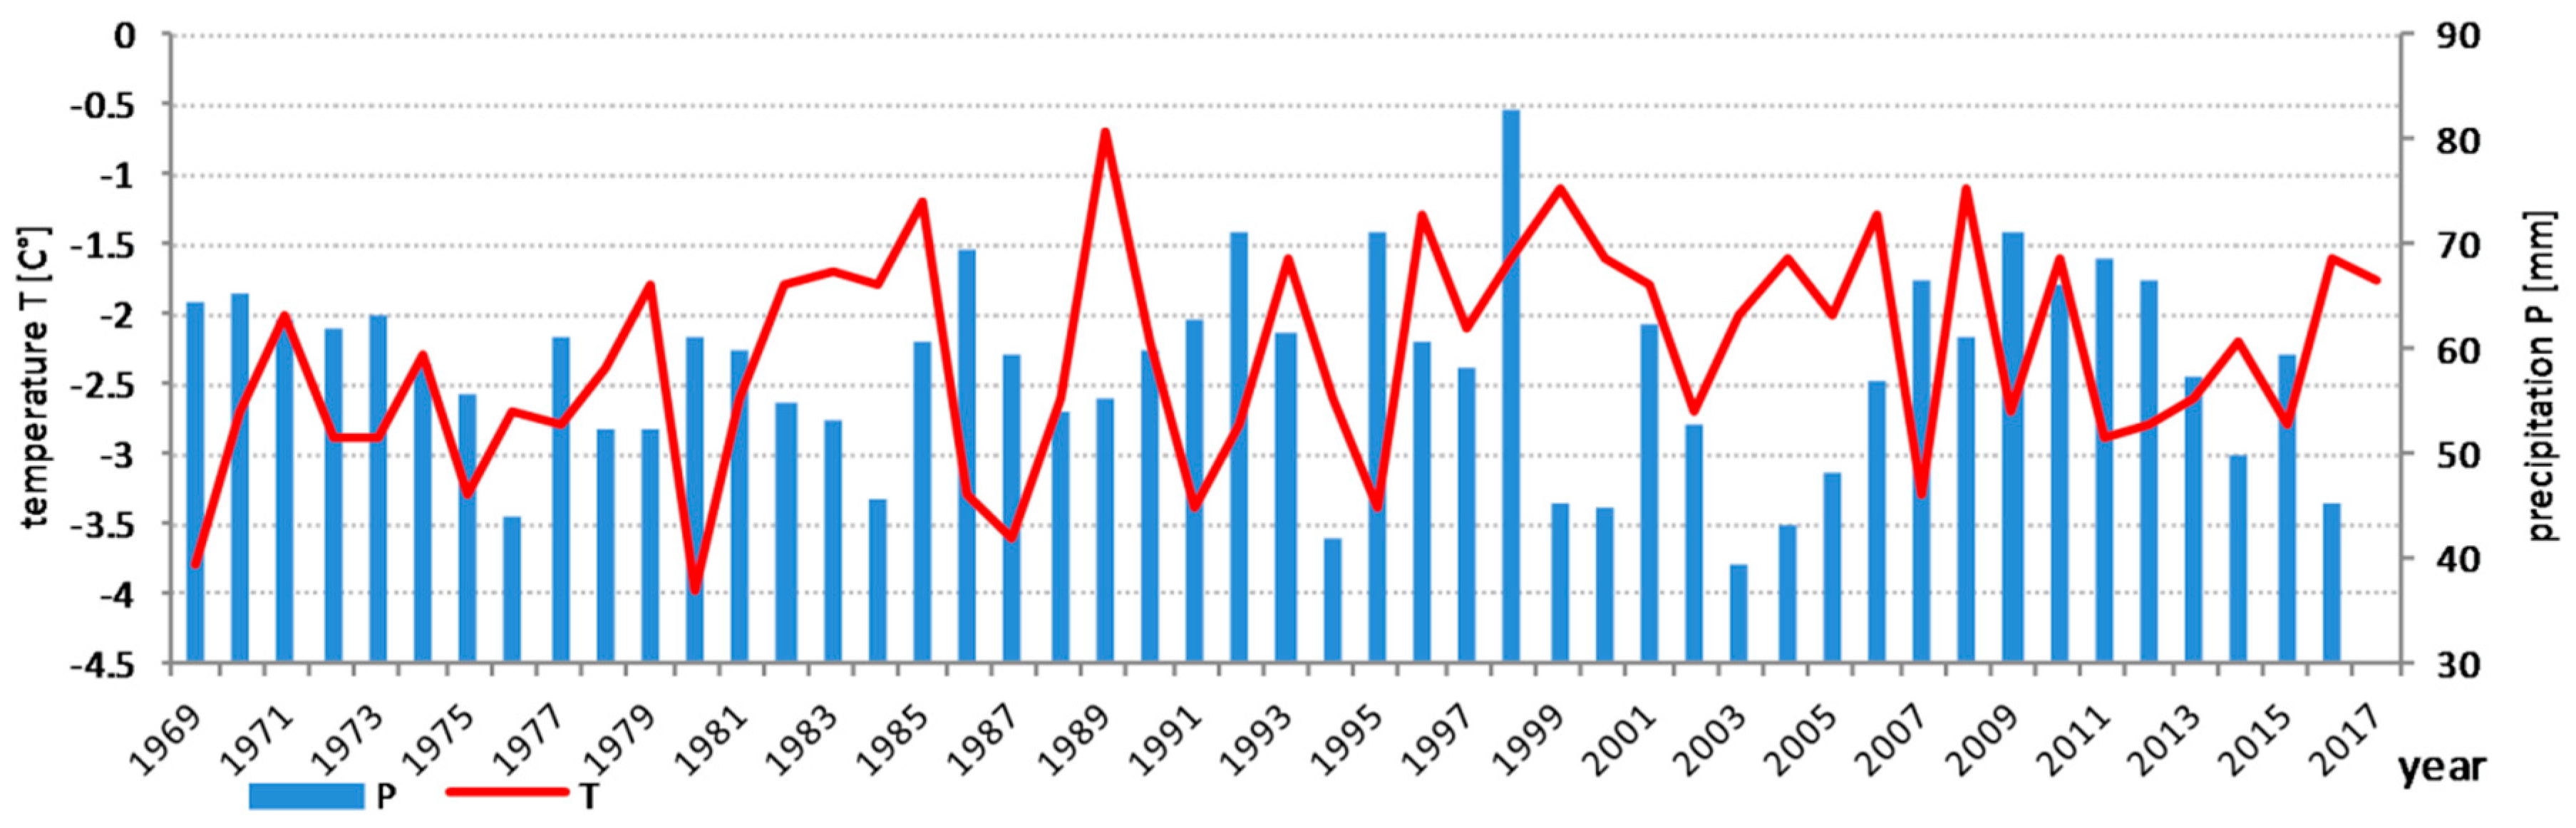
Since the 1950’s, regional warming has been observed on the Antarctic Peninsula [8,9,10,11,12] with an increased in air temperature of 0.32 °C/decade from 1979 to 1997 [13]. Nevertheless, several authors [13,14] have reported a cooling trend over the last 20 years, with a decreased air temperature of −0.47 °C/decade over the period 1999–2014 [13]. These findings, however, depend on data interpretation. For Bellingshausen Station on King George Island (KGI), the air temperature reached a maximum in 1989 and the relatively stable fluctuations of air temperature were observed until 2009 (Figure 1; [15]). Based on these data, the cooling noted above could be suggested for only the summer months during the period 2012–2015, as shown by Pętlicki et al. [16]. Oliva et al. [13] suggested that the recent cooling was amplified by an increasing extent of sea ice, which, in 2014 [17], reached its highest value since 1979. However, the difference of mean annual temperature between 2015 and 2016 was 1.2 °C (Figure 1, [15]), whereas the mean annual air temperature for Fieldes Peninsula was −2.3 °C for the period 1969–2017. Simultaneously, the Antarctic ice extent was minimal in 2016–2017 [17]. In addition, during years of suggested cooling, decreased precipitation has been reported (Figure 1).
The reactions of glaciers, generally in the form of mass loss [18], glacier recession [13], and decreased ice surface elevation [16], have been observed, especially for those located in the South Shetland Islands [18,19,20,21,22,23]. Since 1956, climate warming has been the main factor causing these changes. Special attention has been paid to the glaciers located within Admiralty Bay [16,19,24,25,26,27,28,29,30,31] and others that drain the Warszawa Ice field [20,32,33]. The effects of climate change were confirmed, for example, on the Ecology and Sphinx glaciers between 2012 and 2013 in the form of a short-term negative mass balance [24]. Importantly, most of the glaciers covering KGI terminate in tidewater settings with recession not yet leading to the development of subaerially exposed forefields, whereas for land-based glaciers, front position changes are substantial and are directly associated with periglacial processes, permafrost degradation and the spread of vegetation on the newly ice-free areas [1,34,35,36,37].
While many studies have been carried out on KGI, not enough attention has been devoted to the Baranowski Glacier, the central glacier located on the Western shore of Admiralty Bay. Since the early 1980s, this glacier has terminated on land. The basin is a unique region with a large proportion of ice-free area on which climatic fluctuations and glacial evolution impact the recent proglacial landscape [38,39]. Geomorphological observations were conducted in this area between 1984 and 1986 [40] and from 1990 to 1992 during the Polish expeditions to KGI [38,41,42]. Since then, due to the recession of the glacier, the forefield has changed considerably. Therefore, the main goals of this research are (1) to present the relationships between the recession of Baranowski Glacier and the available climate data from KGI since 1956; (2) to supplement our knowledge about the ice surface elevation changes of the glaciers located on KGI, based on the observation of Baranowski Glacier since 1989; and (3) to improve our understanding of the relief of this proglacial region in front of the Baranowski Glacier.
2. Materials and Methods
2.1. Study Site
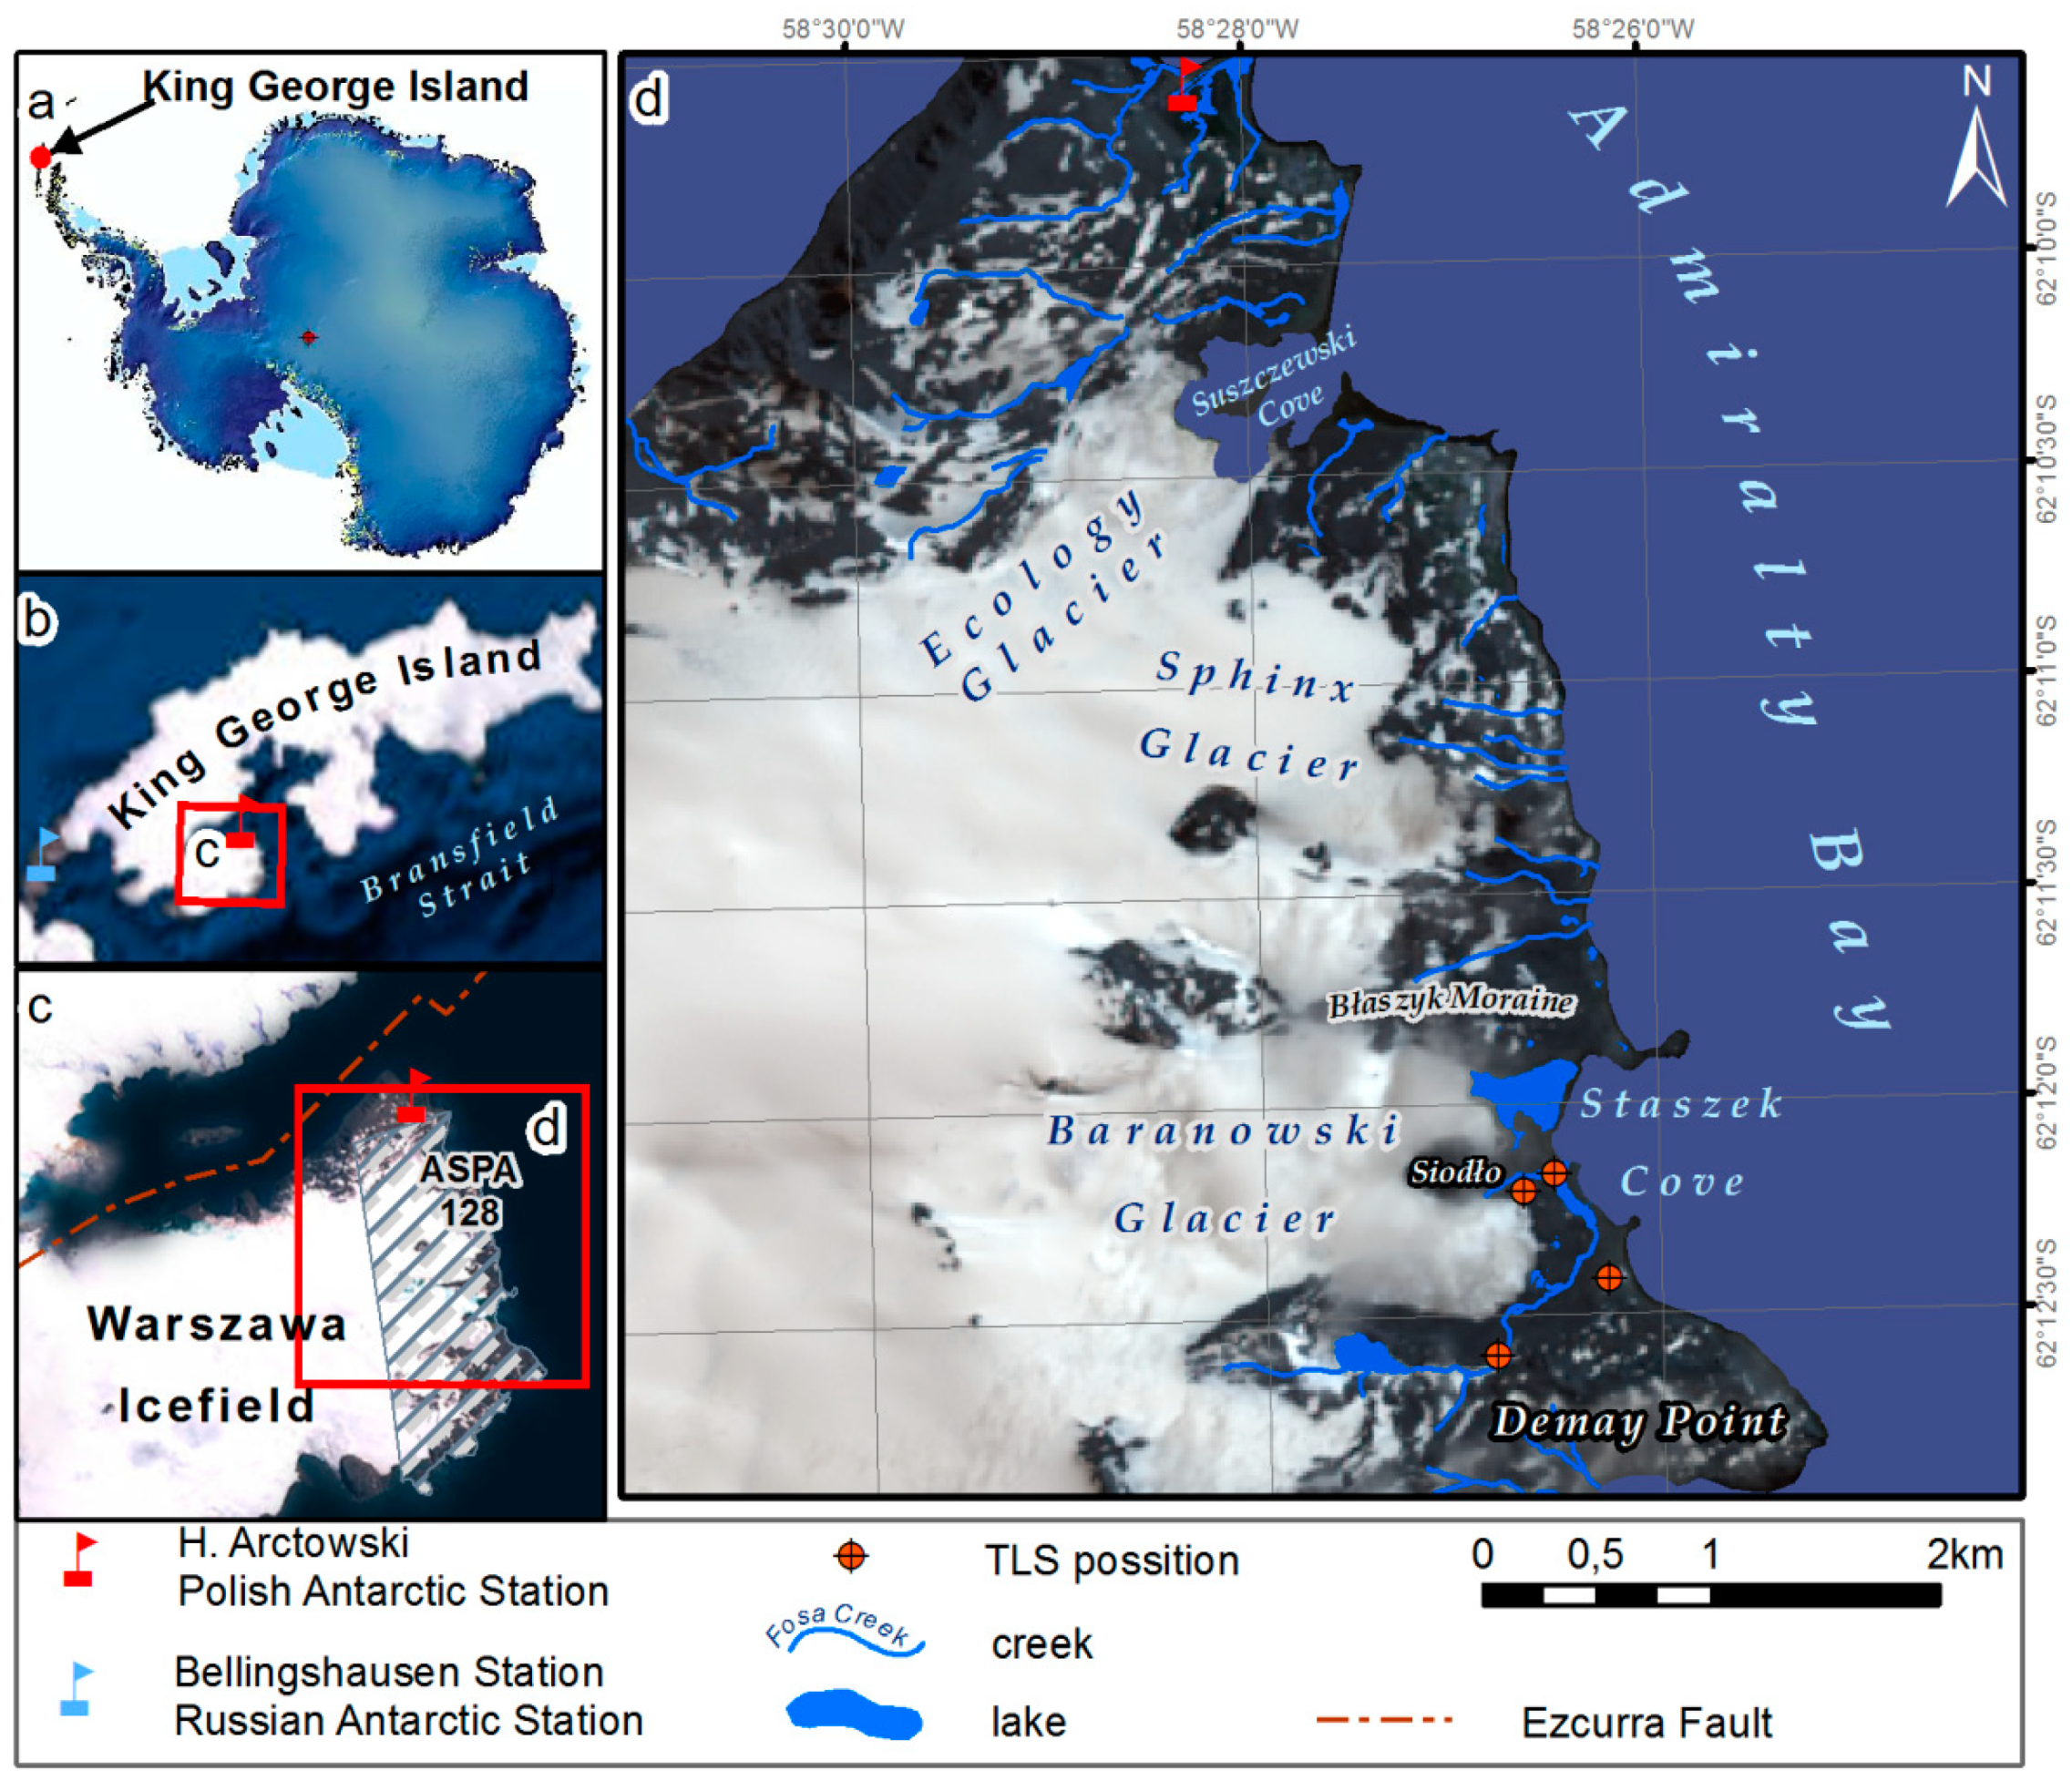
The Baranowski Glacier is located on the Western shore of Admiralty Bay on KGI (West Antarctica), the largest island of the South Shetland Islands archipelago (Figure 2a). The island is separated from the Antarctic Peninsula by the Bransfield Strait by a distance of approximately 120–130 km. The total area of the island is 1250 km2, and almost the entire island is covered by ice caps (Figure 2b). The glacier drains the Warszawa Ice field at its Eastern edge (Figure 2c), where melt water flows into Staszek Cove (Figure 2d). Its frontal part is divided into two tongues: the northern tongue and the southern tongue. An ice cliff is present where the northern tongue terminates in close proximity to a coastal lagoon, which is separated from Staszek Cove by a narrow spit during low tides [39,43]. The southern tongue terminates approximately 240 m from the recent shoreline with a varied forefield of proglacial landforms. The tongues are separated by a rocky mountain—Siodło with an elevation of 132 m a.s.l. as measured by a terrestrial laser scanner. An additional unique feature of the study is that the area is located within the Antarctic Specially Protected Area number 128 (ASPA 128) (Figure 2c). The area is designated as such in order to provide appropriate protection for Antarctic birds, marine mammals and vegetation [44]. The recession of the glacier reveals potentially new ice-free areas for penguin colonies, elephant seals and fur seals. Some of these species, such as a fur seal colony, already dwell close to the shore in the summer (Figure 2).
2.2. Front Position Changes
In order to obtain a reliable view of the glacier front position, archival maps, aerial photos, Landsat satellite images, and a terrestrial laser scanning (TLS) survey conducted in summer 2016 have been used. The most important factors, decisive for the accepted materials, were as follows:
- The minimum spatial resolution of the satellite images had to be 15 m in order to obtain a trustworthy view of the glacier front position;
- Due to the least snow cover in general being during the austral summer, most of the images were selected between December and March. Satellite scenes available during others seasons but without snow cover were also taken into account;
- Cloud cover could not veil the glacier front;
- Free access to some of the satellite images (e.g., Landsat) [45].
Specifically, the following materials were used for the determination of the front positions of Baranowski Glacier since 1956:
- (1)
- Falkland Island Dependency Aerial Survey Expedition (FIDASE)—aerial photography taken on 20 December 1956 with a scale of 1:28,000. The calibration of photos was with the use of ground control points (GCP), with a total root mean square (RMS) error of 0.5 m;
- (2)
- 1:3600 scale airborne images, taken in January/February of 1979;
- (3)
- SPOT XS multispectral satellite imagery taken on 29 March 1995 with a spatial resolution of 20 m [28];
- (4)
- Landsat satellite images taken on 04 February 2003, 14 January 2007, and 05 February 2018; the determination of the frontal positions was based on a panchromatic band with a spatial resolution of 15 m;
- (5)
- (6)
- The ASPA 128 topographic map from 2001 at a scale of 1:12,500 [47];
- (7)
- The map of the Western shore of Admiralty Bay from 2001 at a scale of 1:10,000 [48];
- (8)
- The TLS survey done on 08 January 2016. The total geo-referencing error was 85 mm.
The acquired materials were integrated in the Universal Transverse Mercator (UTM 21S), used as common reference system, and processed. Front positions were vectorized manually in ArcGIS (© ESRI) project.
2.3. Surface Water Temperature
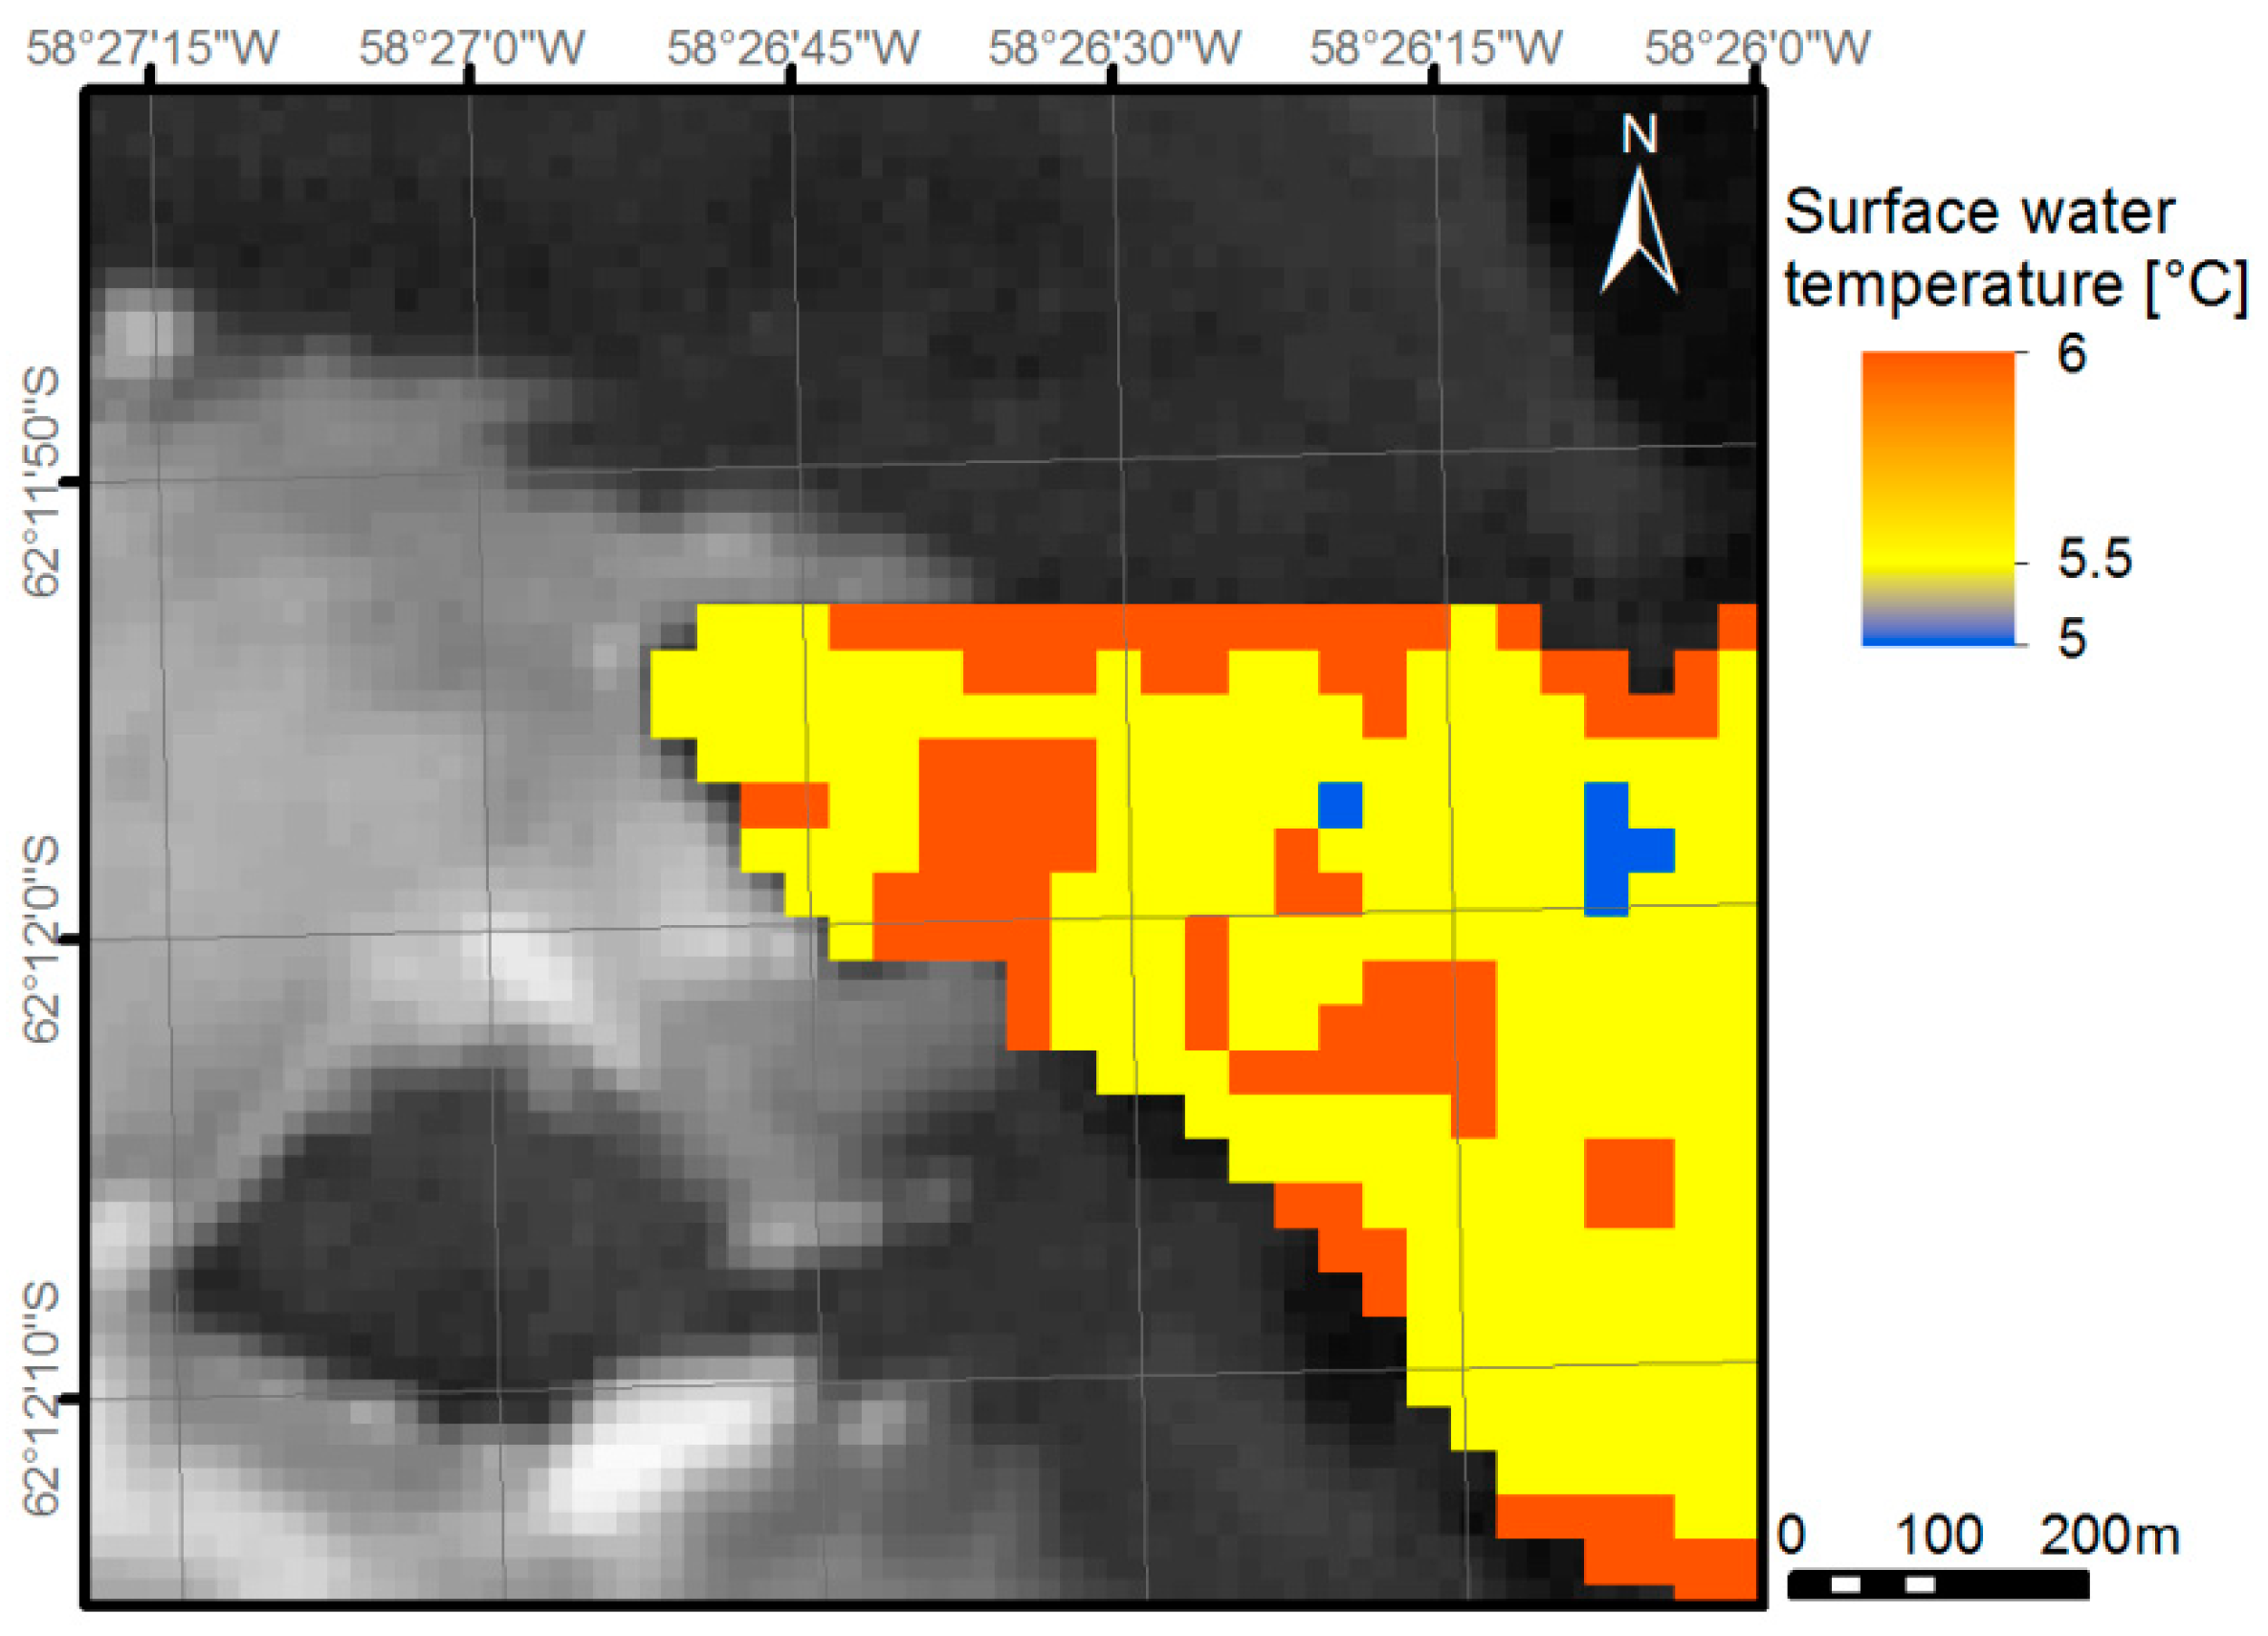
For the calculation of surface water temperature during the periods of large retreat rate in the past, a LANDSAT image acquired on 4 February 2003 was used. The image processing of the thermal band was based on standard procedure and began from the conversion of background noise (DN) to radiance, then radiance to temperature in Kelvin [49] and finally converted to Celsius.
2.4. Ice Surface Elevation
Ice surface elevation was obtained from digital elevation models (DEMs). DEMs were created based on the archival map from 1990 [46], 2001 [47,48,50] and field measurements in 2016 were made using a terrestrial laser scanner (TLS). Mean elevation error calculated with the use of ground control points measured by TLS in 2016 for Demay Point crest and the pass below was 10.46 ± 7.37 m for 1989 DEM and 4.94 ± 6.74 m for 2001 DEM. However, on glaciated areas, the error could be larger.
To build the model from 1989, an archival map of Admiralty Bay from 1990 [46], at the scale of 1:50,000, was used. The model was built using the Topo To Raster tool in ArcGIS software (Esri, Redlands, CA, USA) (© ESRI). An output raster with a spatial resolution of 0.5 m was generated based on contours with intervals of 25 m. Despite the large distortion of the map of Ecology Glacier’s surroundings [16], the results for the Baranowski Glacier rectification seem to be quite reliable, with an error not exceeding 2.9 m. This accuracy allowed the use of the map for further analysis.
The numerical model from 2001 was created from the ASPA 128 topographic map [47] at a scale of 1:25,000 and a map of the Western shore of Admiralty Bay at a scale of 1:10,000 [48]. These data were collected during the XXV Polish Polar Expedition in 2000–2001 using differential GPS measurements with 100 mm precision [31]. Contours with 10 m intervals were interpolated using the Topo To Raster tool in ArcGIS software (© ESRI). The spatial resolution of the DEM was 0.5 m.
The DEM of the study area for 2016 was evaluated based on TLS measurements with the use of a Riegl VZ-6000 terrestrial laser scanner (RIEGL Laser Measurement Systems, Horn, Austria). The glacier and its forefield were scanned during a field campaign carried out on 08 January 2016. To obtain a reliable view, four laser positions were employed, as presented in Figure 2. Spatial resolution of the model was 0.5 m, with an accuracy of 85 mm. The ice basin was designated manually based on isohips from the Antarctic Digital database.
2.5. Ice Elevation Differences Calculation
Differentiation maps were produced following the method used in previous studies [16,51,52,53]. First, elevation models were created using a common reference system. Following that, one model was subtracted from the other. This process produced the ice difference raster above the forefield and frontal part of the glacier.
2.6. Geomorphological Mapping
The geomorphological map was created using data from field studies carried out during the austral summer 2016 expedition to the Western shore of Admiralty Bay. A preliminary map was prepared based on available geomorphological maps, photographic analysis, and TLS survey. To complete and verify empirical studies, existing cartographical materials including geomorphological maps [41,42,54] were used.
2.7. Mean Monthly Air Temperature
The data used for the calculation of the mean monthly air temperature for the period of 1969–2017 were provided from the Bellingshausen Station, located in a distance of about 25 km in a direct line from the study site (Figure 2b). As most of the basic materials for the determination of the front positions of the Baranowski Glacier came from the beginnings of the summers (i.e., January or February) for better readability of the data, we decided to present the mean monthly air temperatures for individual/considered period of time, up to the end of the year preceding the reported position of the glacier’s front.
3. Results
3.1. Terminus Position Changes
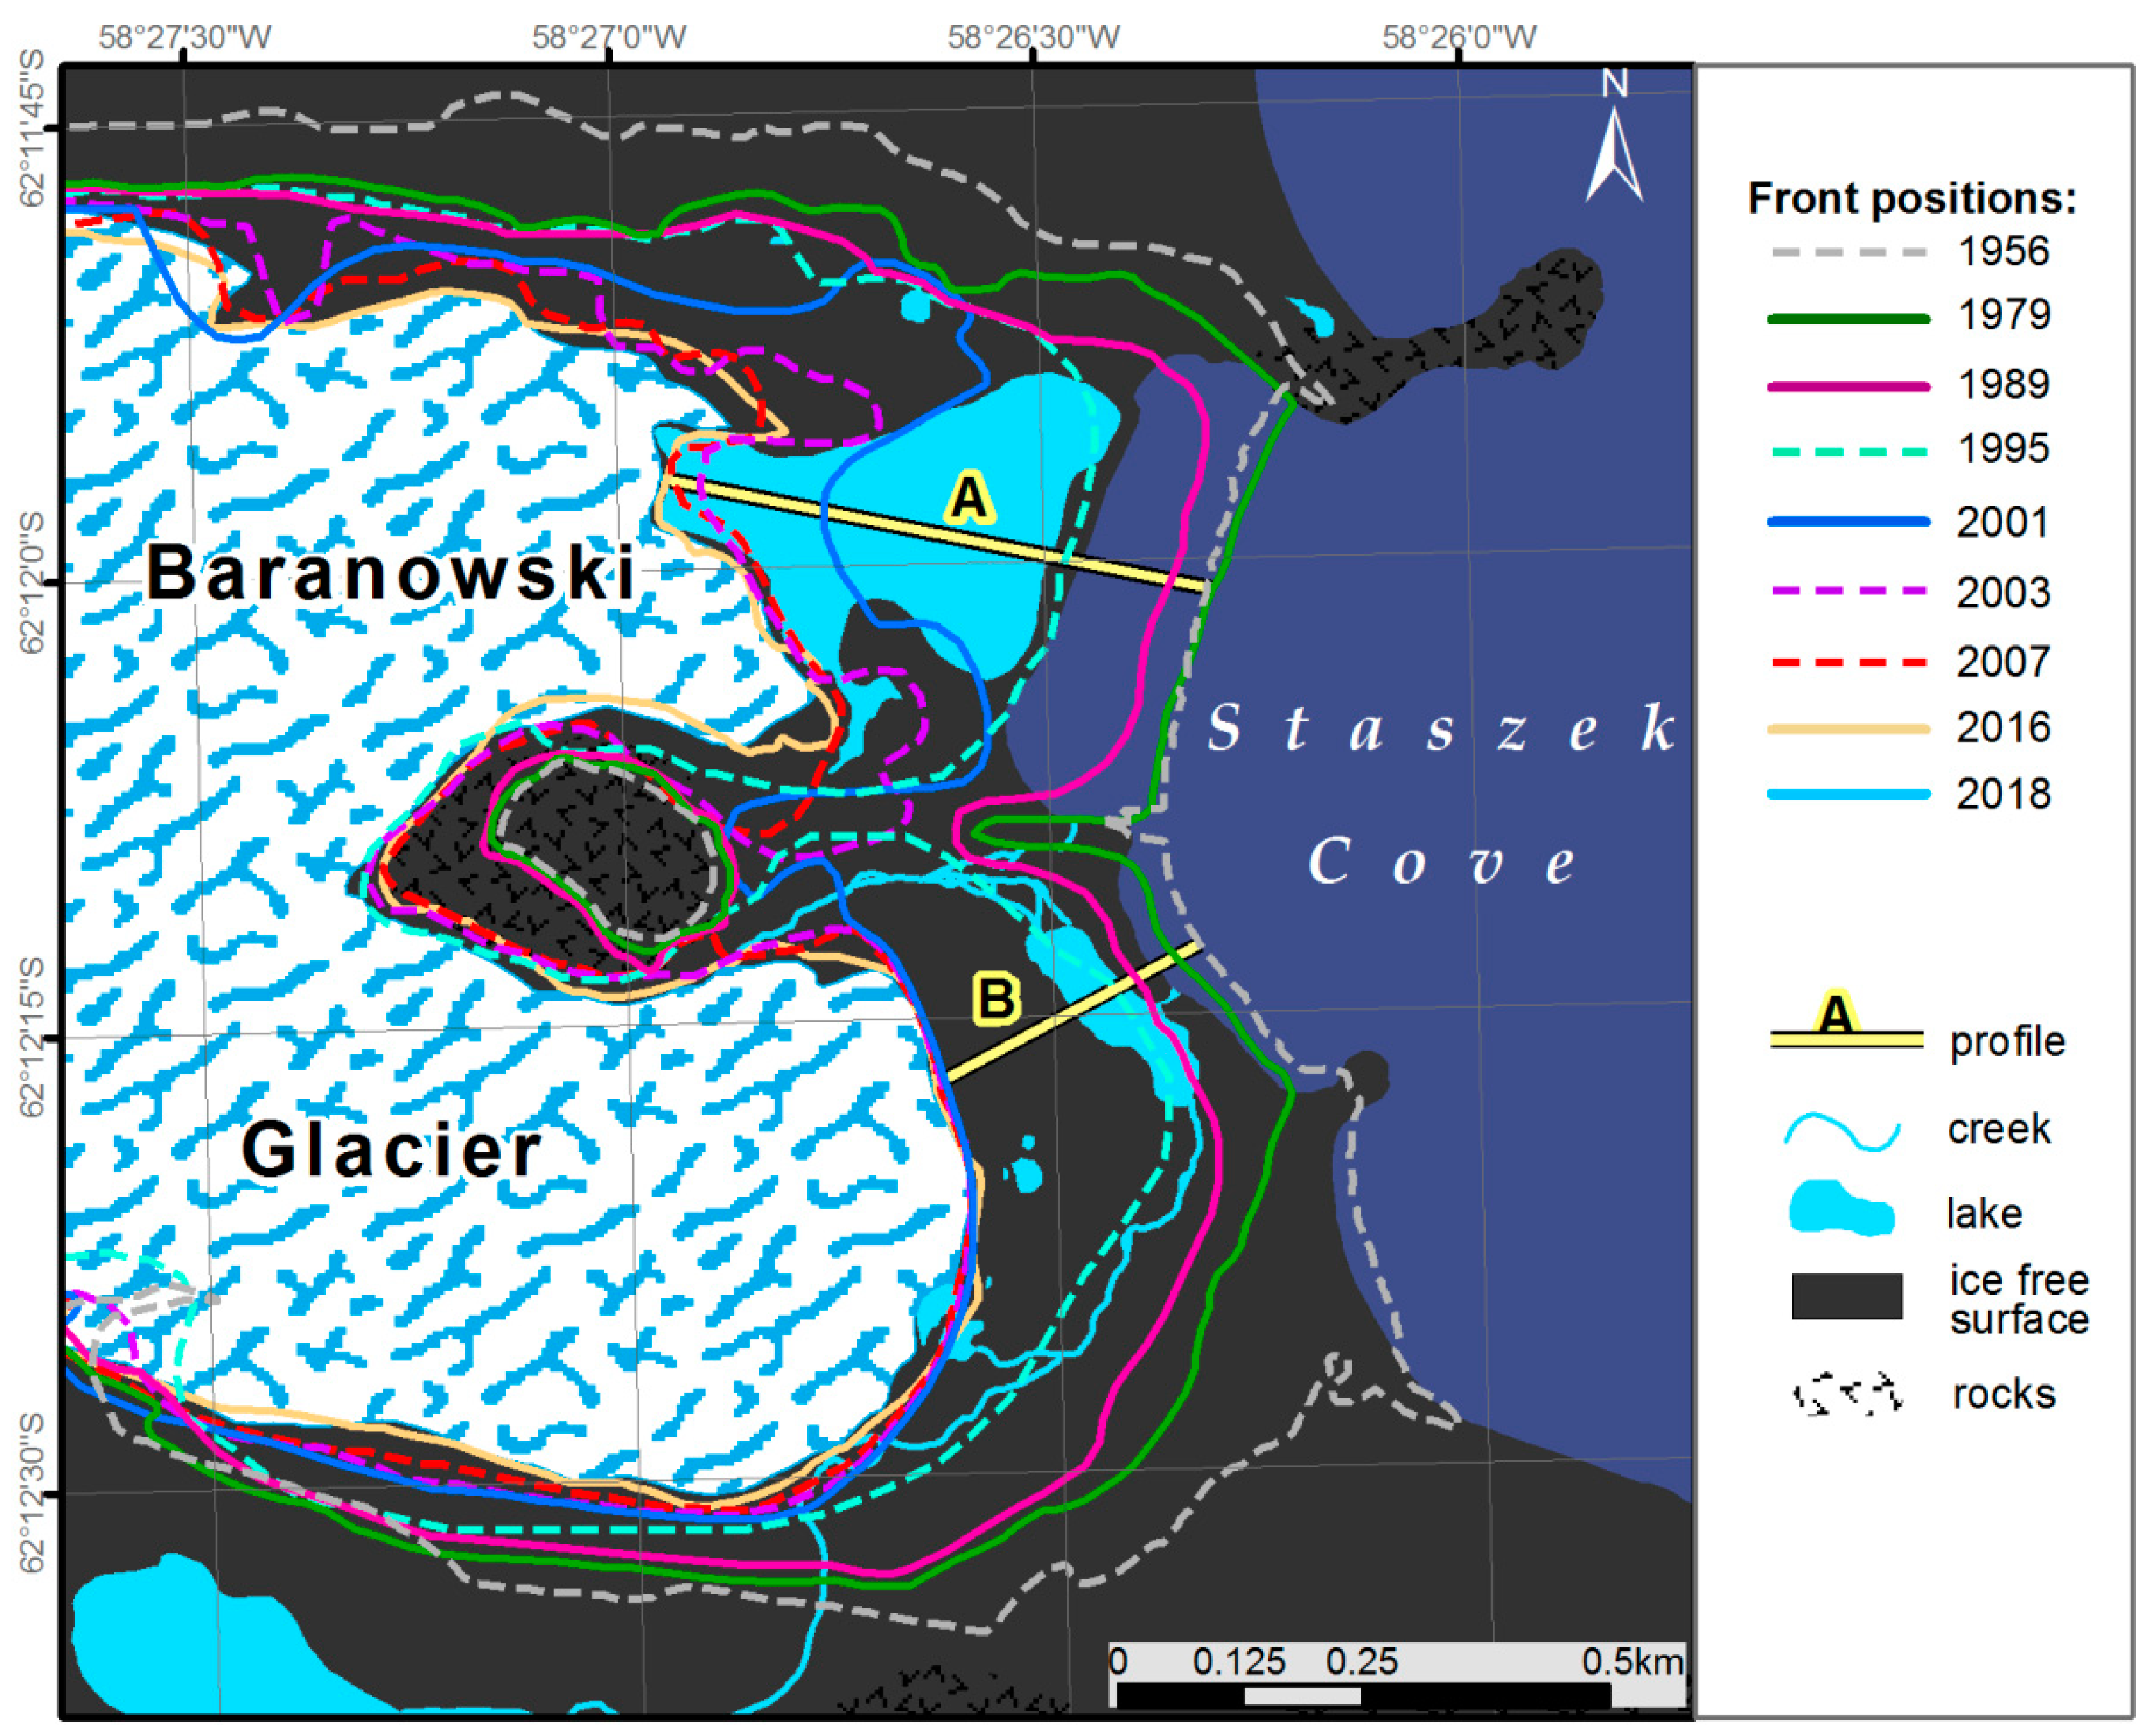
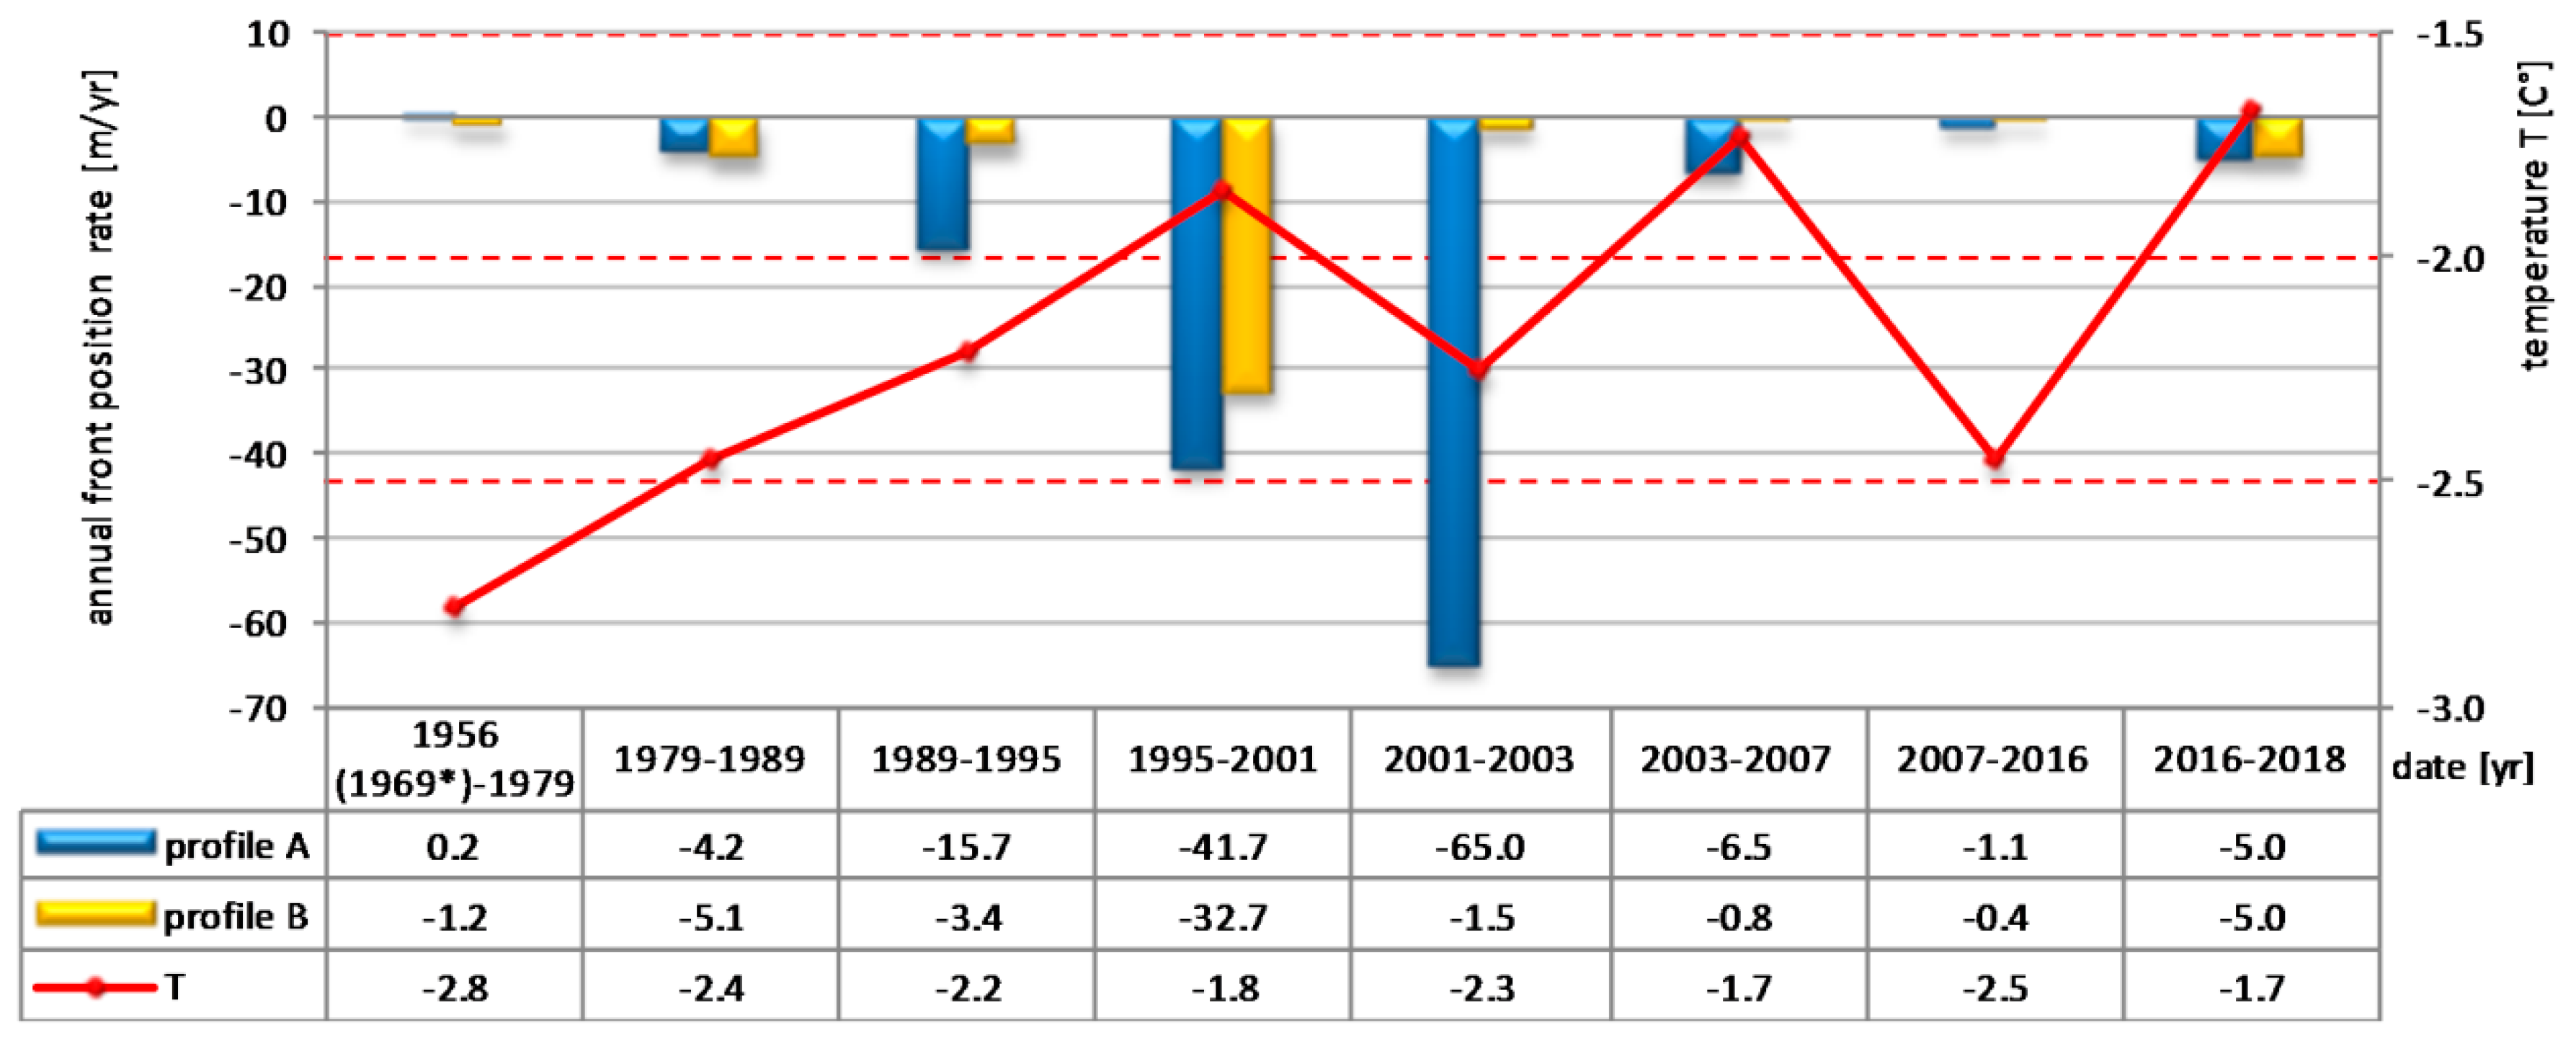
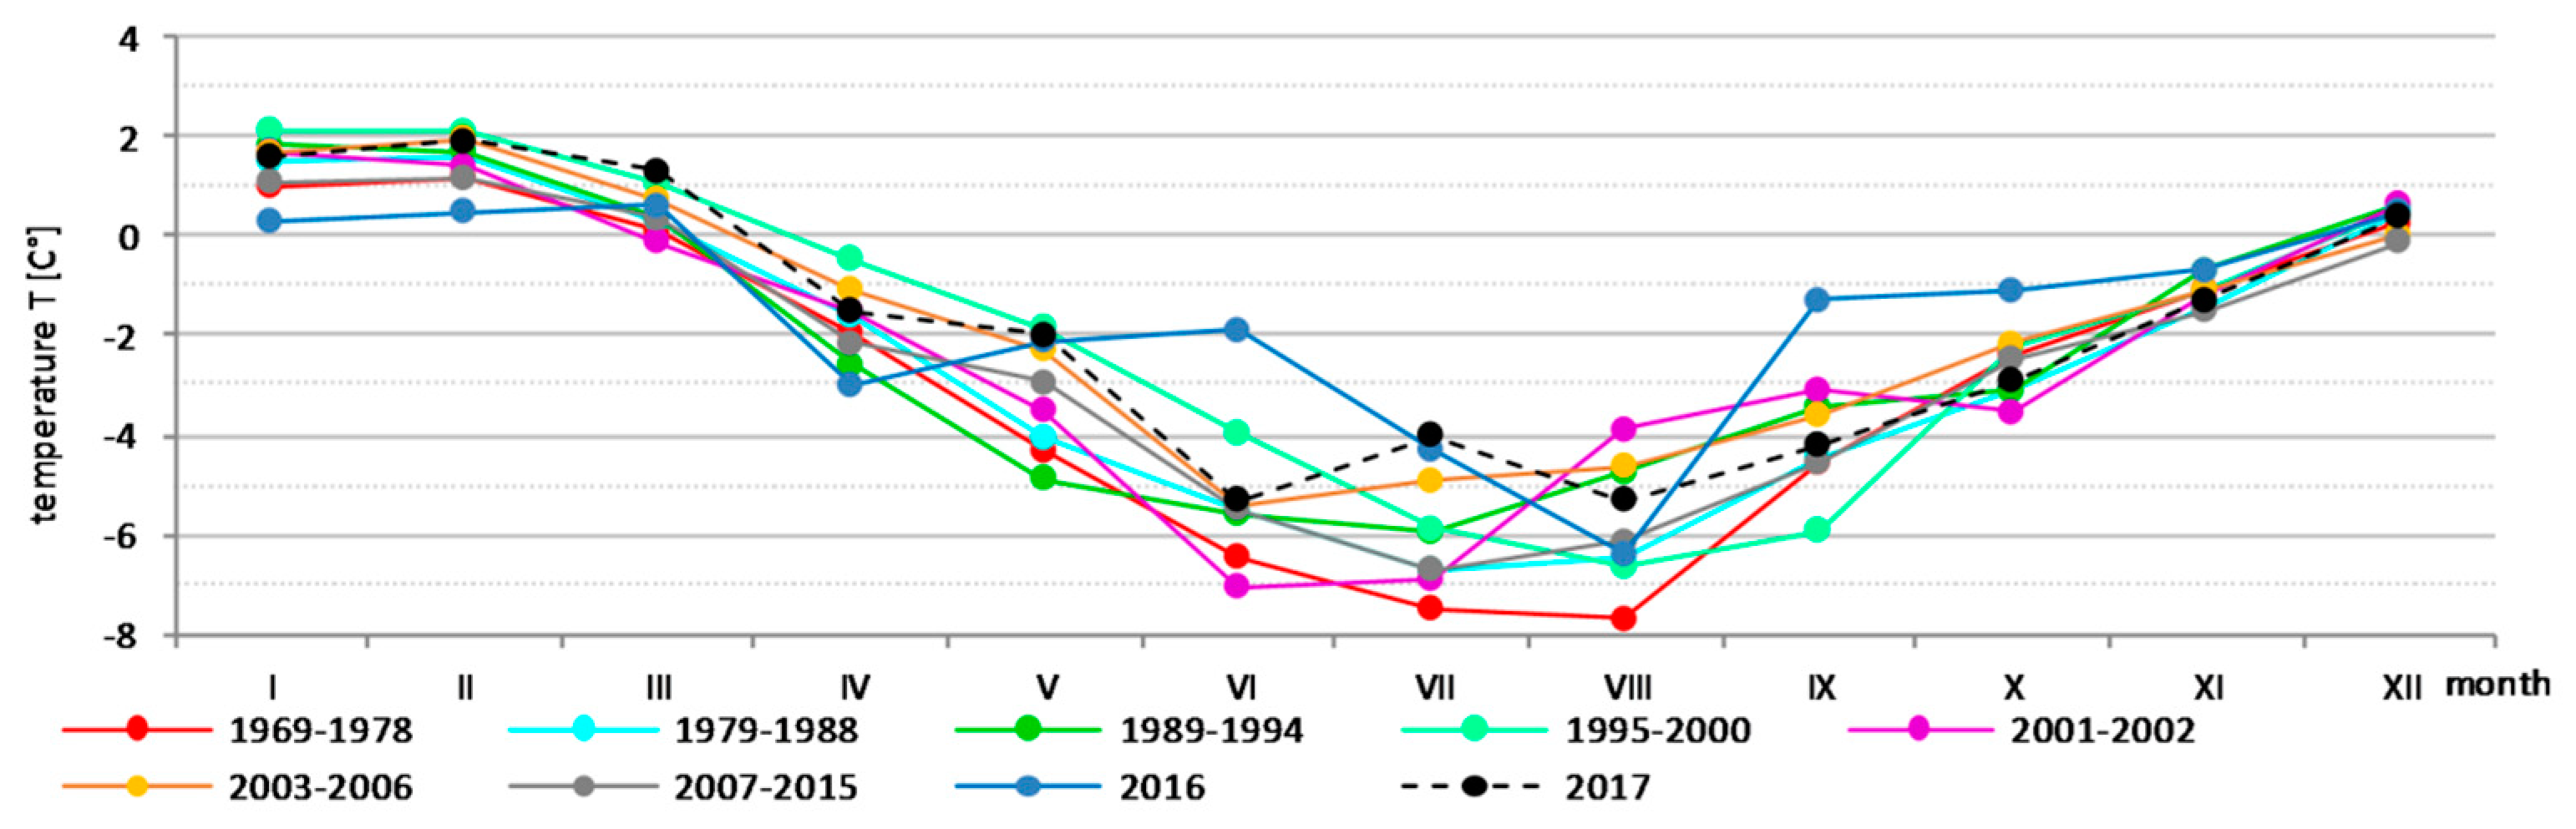
The front position of the Baranowski Glacier has changed considerably over the last 60 years (Figure 3). Between 1956 and 1978, the glacier was tidally terminating with a relatively stable front position that extended approximately 130 m seawards of the present shoreline. In 1979, the front position on the North side of the glacier even advanced by 5 to 15 m in relation to the front position from 1956 (Figure 3). In a similar period, 1969–1978, the lowest multi-year mean air temperature reached −2.8 °C (Figure 4) with extreme cold winters (Figure 5) in comparison to the whole analyzed period. Nonetheless, the glacier started to split into two tongues—the northern and southern—around 1980. During the following years, the northern tongue remained in contact with the sea, whereas the southern tongue was starting to become land-terminating (Figure 3). Between 1989 and 1995, the frontal retreat rate for the northern tongue was above 15 m/year—associated with the increasing multi-year mean air temperature (Figure 4). A high mean monthly air temperature was also identified for this time series, especially during summer months, with relatively warm winters (Figure 5). In 1995, both tongues became land-based; nevertheless, the northern tongue rested on a narrow spit (Figure 3). After that, this tongue retreated to a proglacial lagoon, where the calving process accelerated, increasing the retreat from 42 to 65 m/year for the periods 1995–2000 and 2001–2002 (profile A, Figure 4), respectively. The recession rate of the southern tongue was also at its highest for the period 1995–2000, but not as massively as the other tongue, and reached a maximum of 33 m/year (profile B, Figure 4), somewhat slower than that of the northern tongue. Both periods were characterized by the highest retreat rate, which could be explained by the maximum monthly mean air temperature, particularly during summers over 1995–2000, with warm winters, which slowly decreased during the next 2 years (Figure 4 and Figure 5). Moreover, in that time, when the ice cliff was located in the proglacial lagoon, the surface water temperature was high and reached 5.5–6.0 °C during summer (Figure 6). This factor could additionally accelerate calving and melting processes.
Between 2003 and 2018, the front position of the glacier seemed to be more stable (Figure 3 and Figure 4), which could be associated with the cooling observed in the Antarctic Peninsula region (Figure 1; [13,14,16]), particularly visible in summer 2016 (Figure 5), which was the coldest in the whole analyzed period. In addition, a slowing-down of the frontal retreat rate for the northern tongue was also visible since the ice cliff has been grounded on the land for at least five years (based on field observations). Recently, some of the frontal sections of the southern tongue of the Baranowski Glacier have receded an additional 50 m since 2016 (Figure 3), which was related to an almost-as-warm summer as the summers in 1995–2000 and a very warm winter (Figure 5).
3.2. Ice Surface Elevation Changes
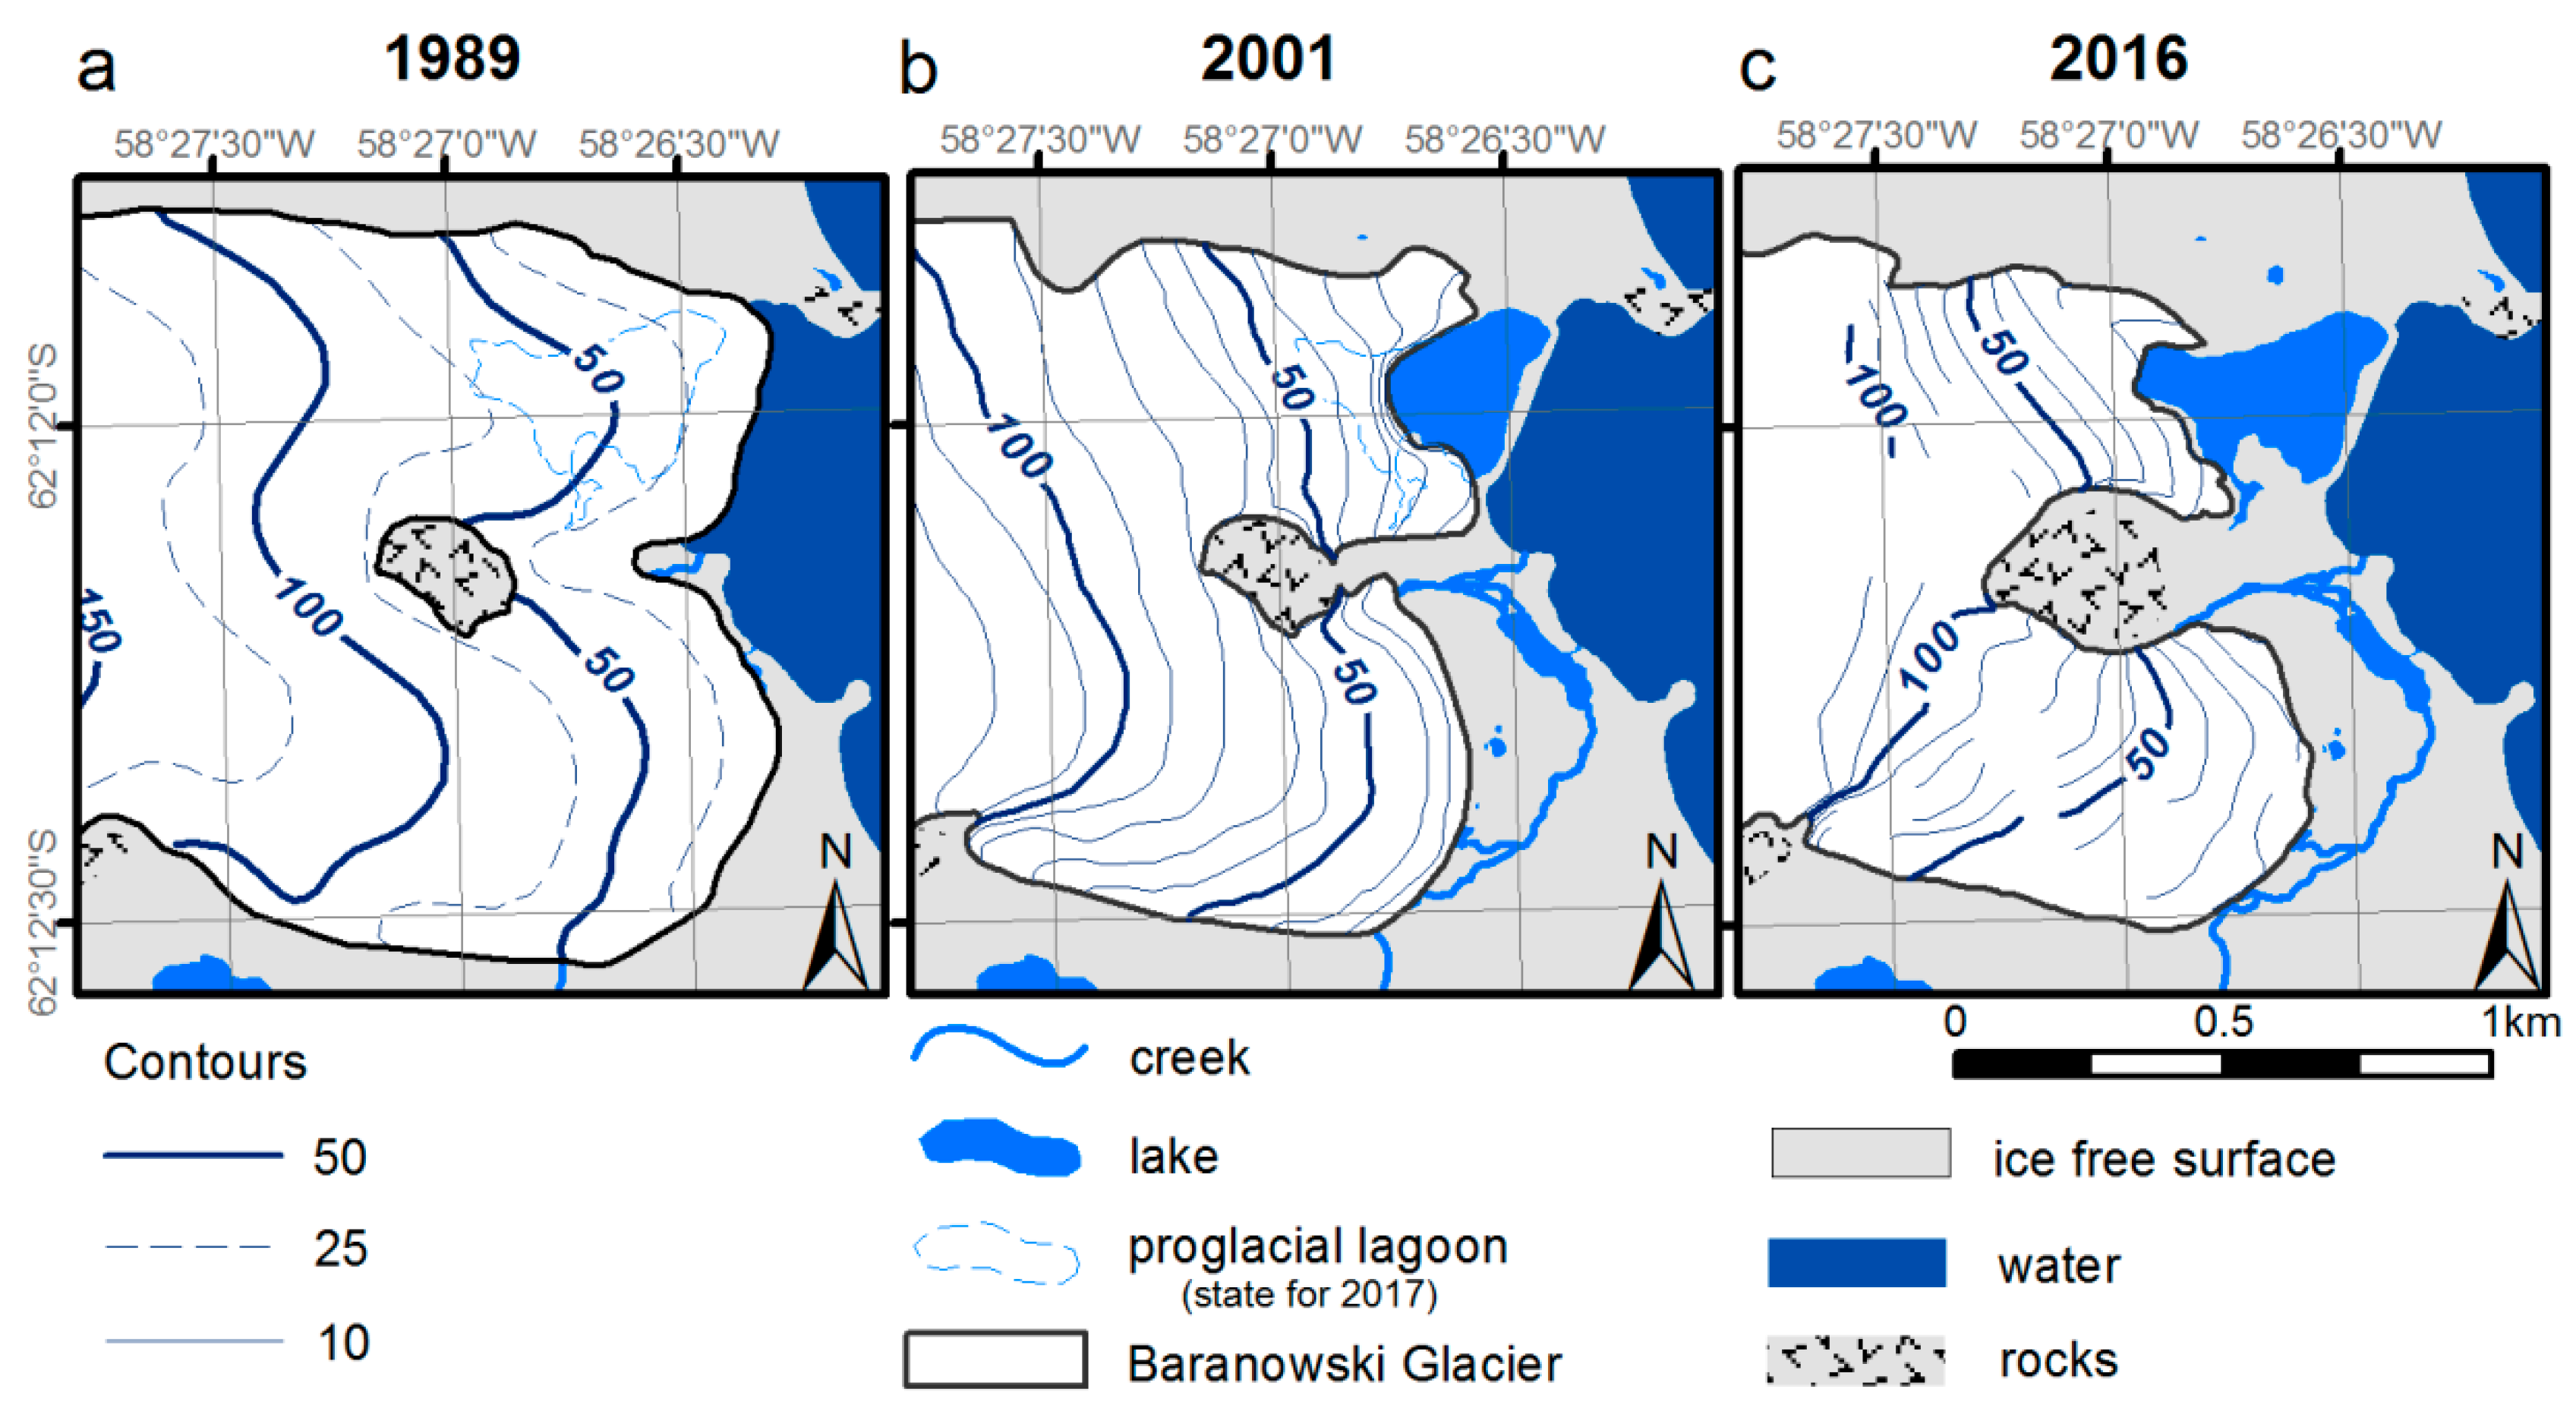
Contour maps (Figure 7) present spatial and temporal changes of the glacier surface elevation for 1989–2016. During this time, the major part of the surface of the glacier was relatively flat. However, in 1989, along the two main axes of the tongues of the glacier surface below 150 m a.s.l., contours were convex, demonstrating higher elevation in comparison to the external parts, whereas in 2001 and 2016, the ice surface seemed flatter (Figure 7). It should be noted here, that the measurements of equilibrium line altitudes (ELA) for Baranowski Glacier have never been carried out. It is also important that the measurements and observations for other glaciers located on the Warsaw Dome are not consistent and are unambiguous. For example, Simoes et al. [26] based on the analysis of the transient snow line positioning obtained from remote sensing data claimed that the ELA for the King George Island Ice Cape equaled 300–350 m but Braun et al. [55] based on the same method as Simoes et al. [26], suggested that for the northern side of KGI it was 250 m. More specifically, Bintanja [56] estimated that for the Ecology Glacier ELA is 100 m. More recent direct observation with the use of stakes done by Sobota et al. [24] for Ecology and Sphinx Glacial System (ESGS) suggested that the average ELA in 2012–2013 was 156 m a.s.l. On the other hand, Falk et al. [20], based on their own glaciological observation, calculated the average ELA for Fourcad Glacier over the period 2010–2015 and obtained that it was 260 ± 20 m. All of the published studies suggested that since 1980, the ELA for KGI has been rather stable with small negative mass balance [20], but all studies expected further glacial retreat. As the Baranowski Glacier is the closest to ESGS and even being the part of this system, it can be assumed that the ELA of Baranowski Glacier is around 150 m and is presented in Figure 7, this isoline since 1989 rose higher from Siodło and the surface of the glacier started to thin in the following years. However, in 2016, a 100 m isoline moved further East in comparison to 2001, resulting in an increase of the ice surface elevation above Siodło. Still, the entire glacier surface, presented in Figure 7, is inside the ablation zone.
In 1989, the lateral part of the glacier in the South was limited by an ice elevation of 20 m a.s.l., whereas the northern side was 40 m a.s.l. up the slope. In 1989, the ice elevation above the recent forefield on the South side was lower than 50 m a.s.l., decreasing towards the shore. The North side was slightly higher, reaching 70 m in the front of the recent tongue. In 2001, the southern forefield was almost entirely uncovered, while the elevation of the glacier on the north side close to the front was approximately 20–30 m a.s.l. with an ice cliff height of 30 m.
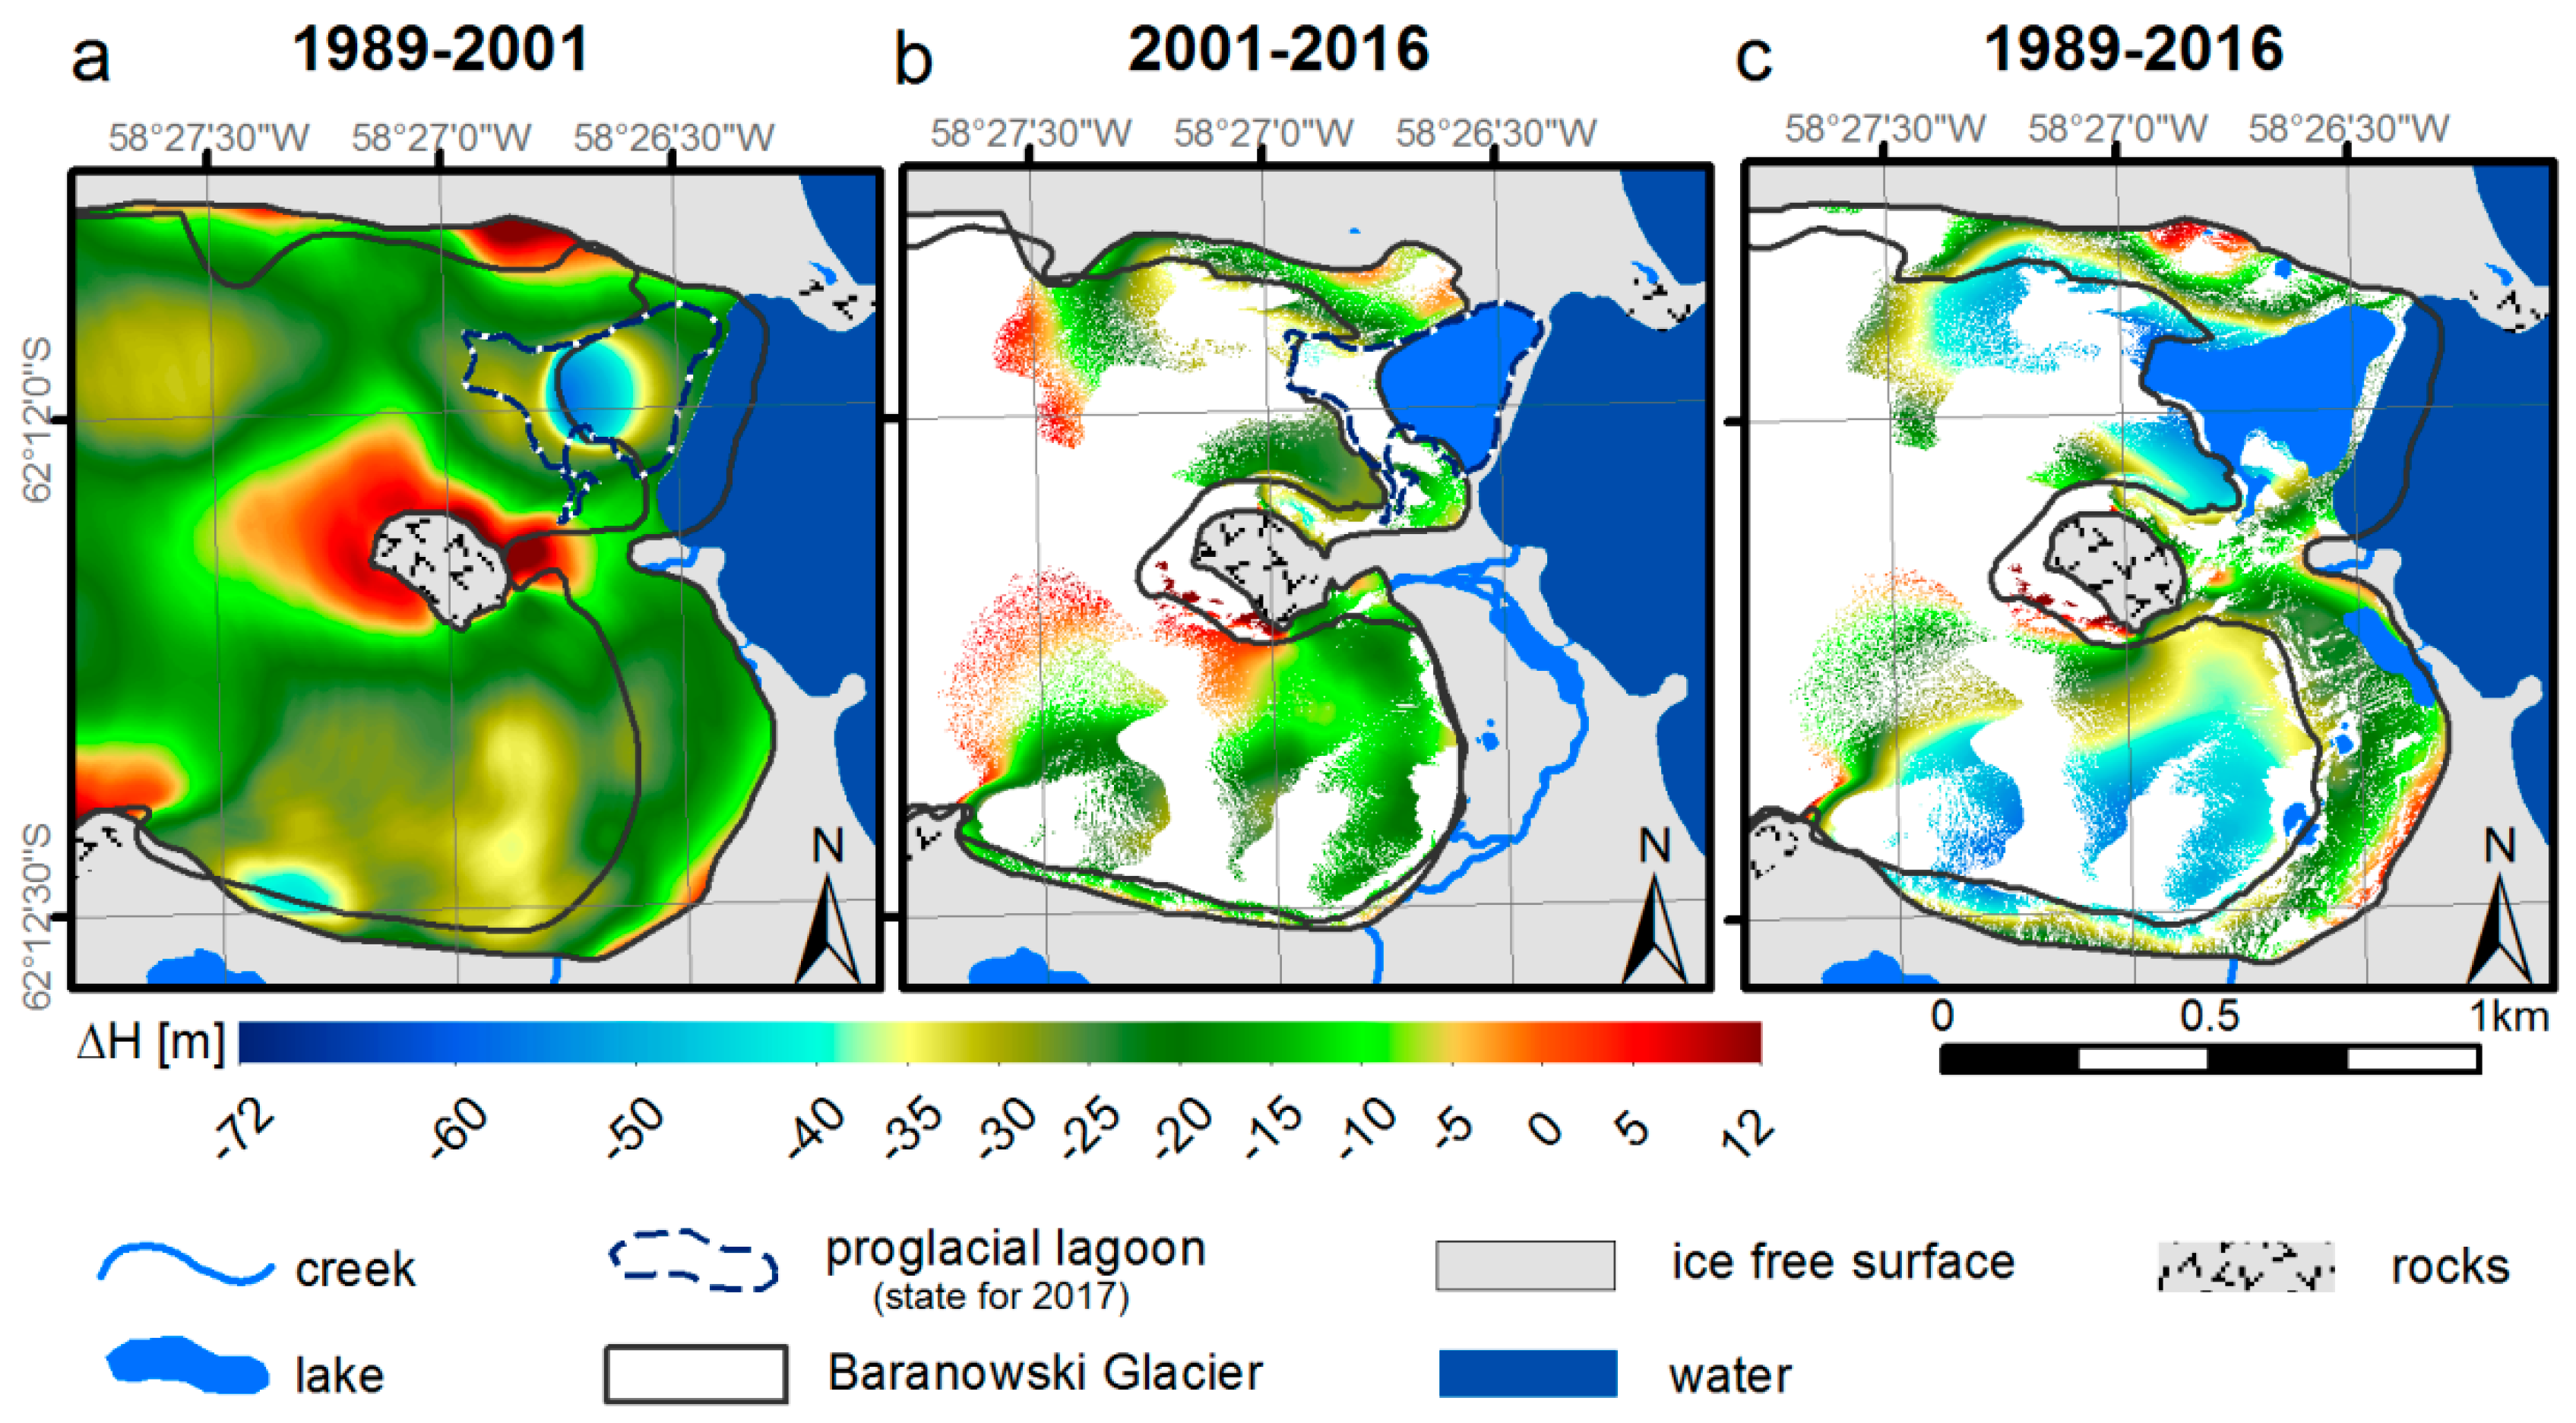
The surface elevation of the Baranowski Glacier changed over the analyzed time and generally decreased (Figure 8). The surface elevation lost between 40 and 60 m in central parts of both tongues, despite the fact that the upper part, close to Siodło, was 10–12 m lower in 1989 than in 2001 (Figure 8a). However, this increase in ice surface can be caused by the distortion of the archival map from 1989 [46], especially close to the rock. Between 2001 and 2016, the glacier surface shifted to increase in ice elevation by ~5 m (Figure 8b), above the 100 m isoline.
In the central part of the current forefield, the ice surface elevation decreased by between 10 and 30 m since 1989, when the front of the glacier melted. However, in close vicinity to the present termini, the ice elevation loss was ~5 m greater (Figure 8c). A sizeable elevation change is visible in the middle part of the ice cliff, where, for the period 1989–2001, a lowering of ~50 m can be seen (Figure 8a). This situation was probably caused by ice calving processes, when the ice cliff reached the proglacial lagoon with unknown bathymetry.
The elevation of the glacier in lateral parts of the southern and northern tongues in 1989 was ~5 m and ~10 m, respectively, lower than the elevation of the terrain in 2001 and 2016 (Figure 8a,c). Since 2001, accumulated deposits enlarged the already existing ridges to their current length of 0.6 km on the south side, and 1.2 km on the north side. Similar elevation changes have been observed for the area surrounding Siodło (Figure 8), which may be related to the uncovering of a rocky outcrop and the accumulation of debris eroded from the slope and glacier deposits. However, lower values of ice elevation in lateral parts and close to Siodło could also be amplified by the error of calculation due to a large shift of the archival map from 1990 in those places. A total of 40 to 60 m of ice surface elevation lowering has been observed in lateral parts of the glacier (Figure 8c).
Due to the lack of data, the bed topography under the recent extent of the Baranowski Glacier is still unknown.
3.3. Geomorphology of the Forefield
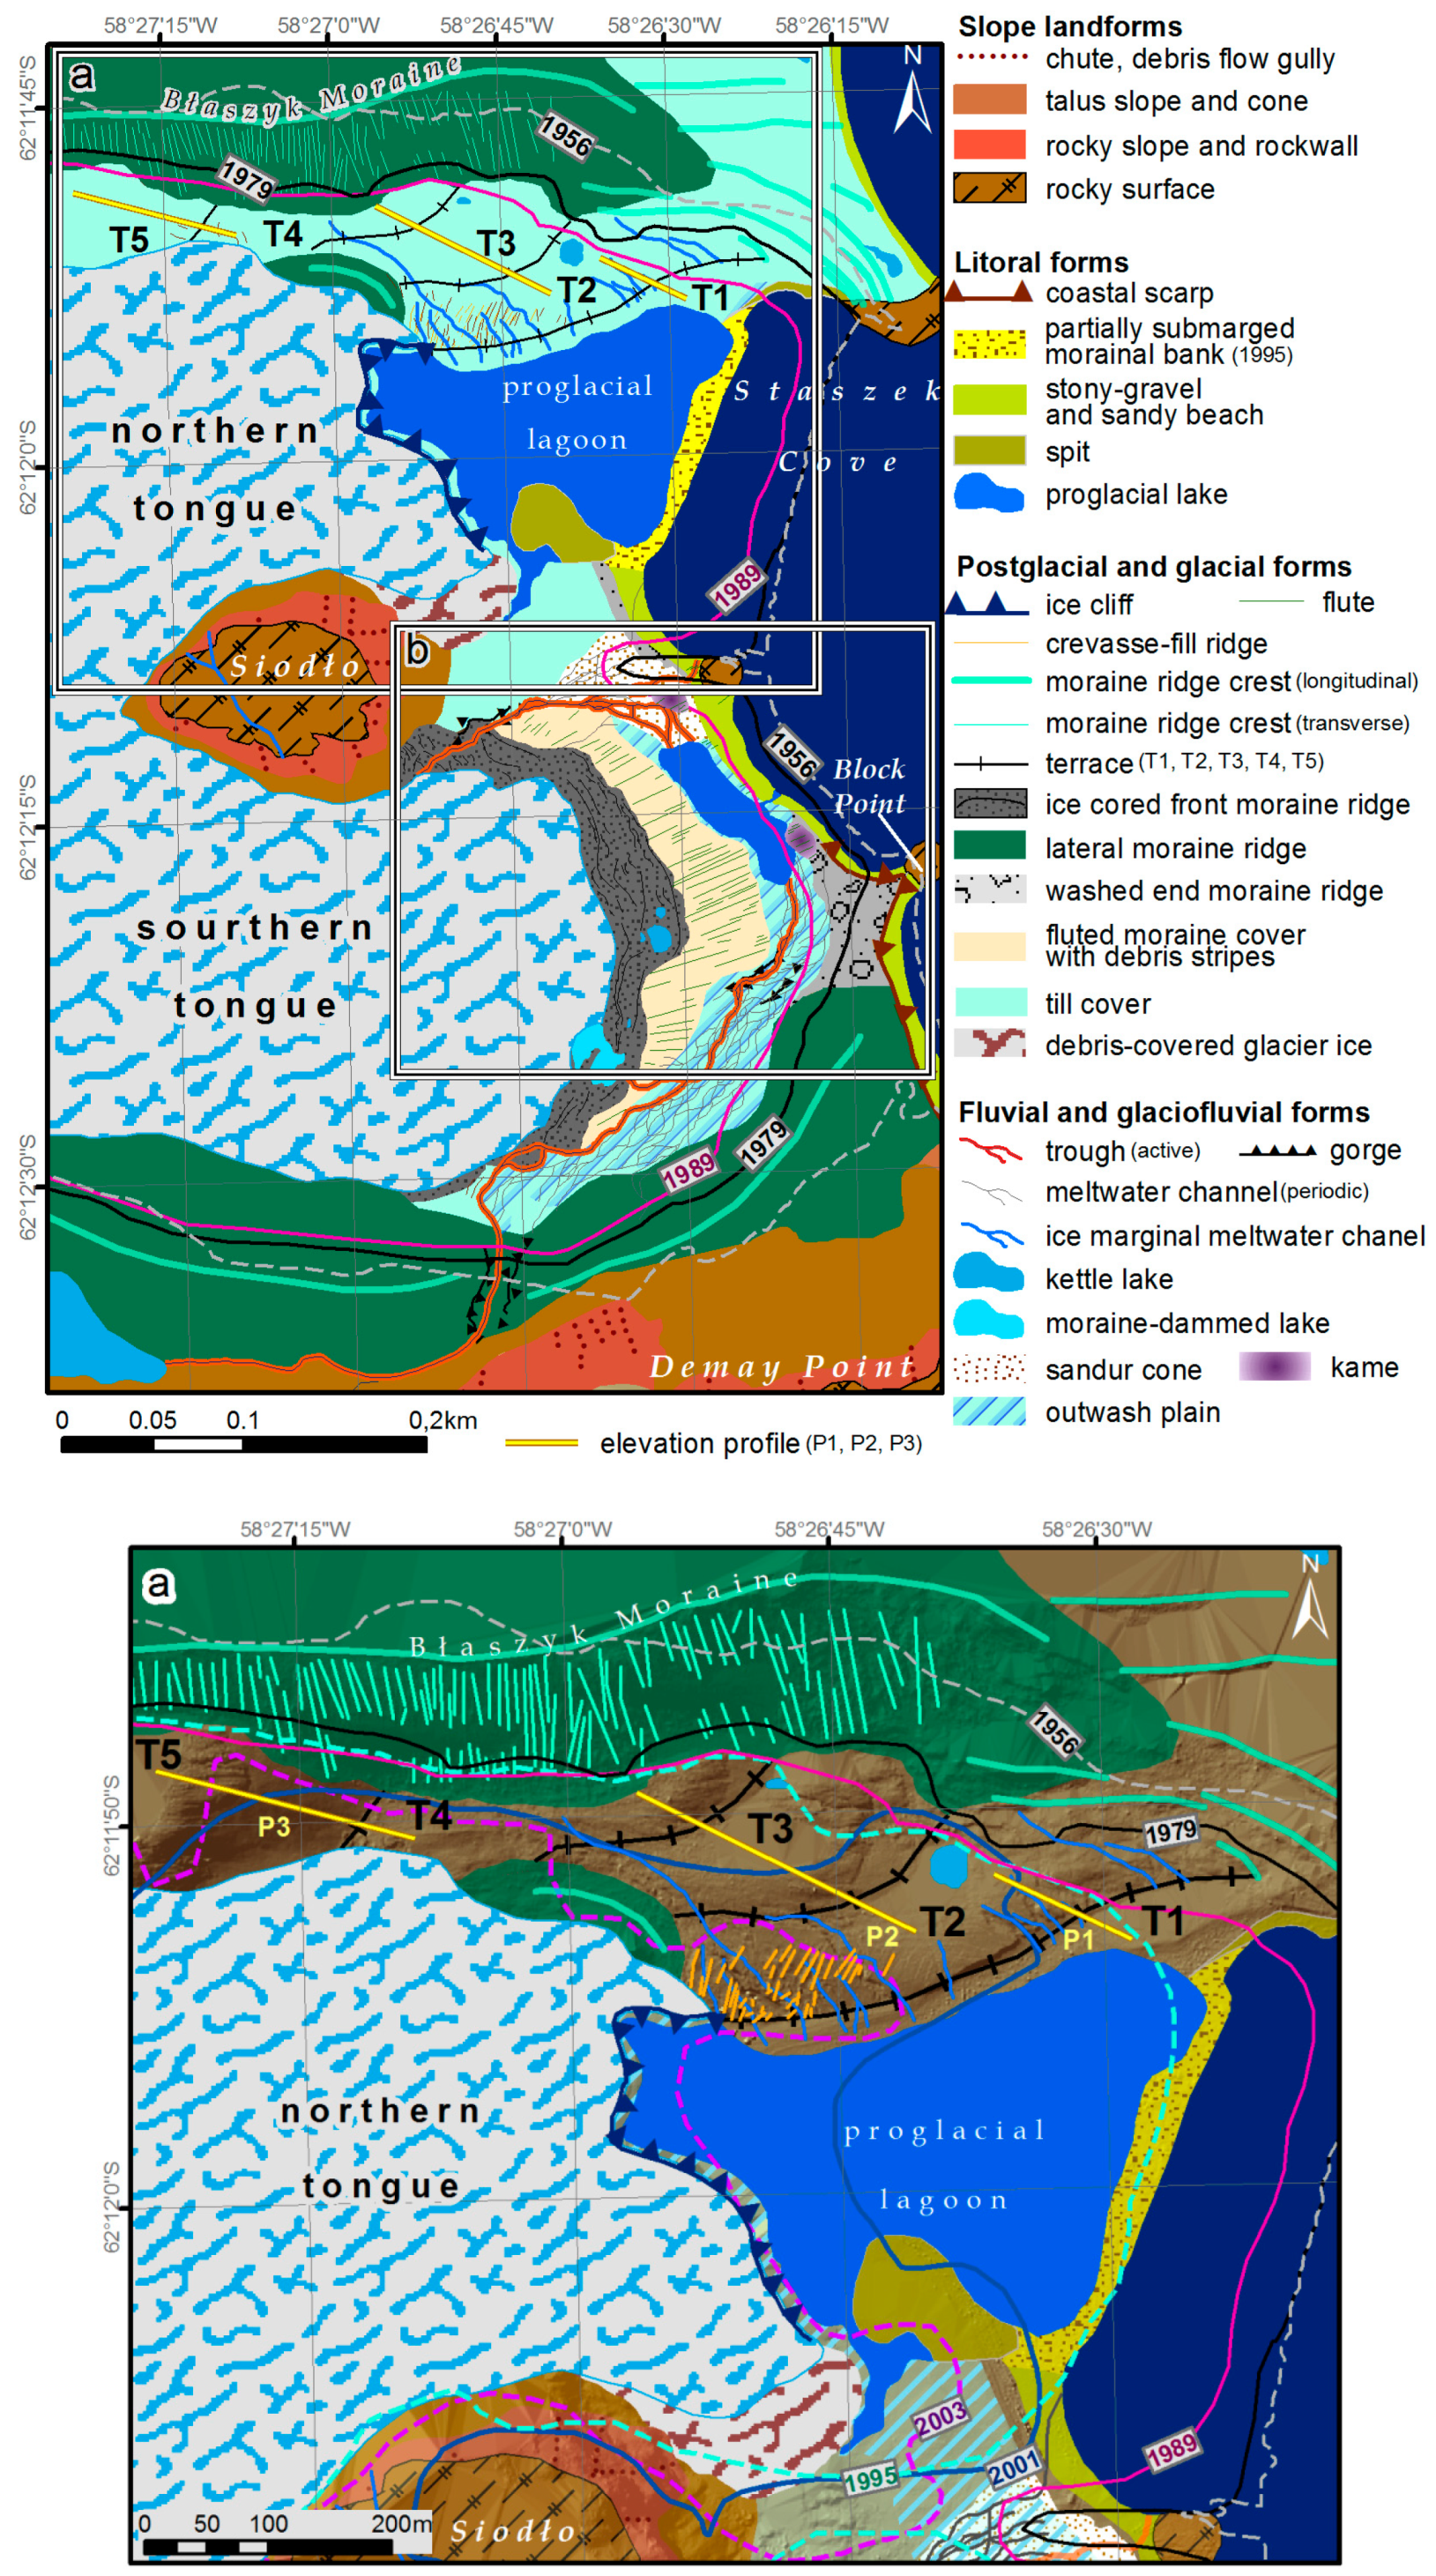
The study area is located in close vicinity to the Ezcurra Fault (Figure 2c), which divides Admiralty Bay between the Mesozoic in the north and the Tertiary in the south of the Baranowski Glacier Group [57]. The geological bed is represented mostly by basalts and andesite [57] from the late Early to Middle Eocene age [58]. The whole forefield is covered by Holocene deposits [58] as a result of the building and destruction processes of the glacier during the last 40 years. Therefore, the recession of the glacier revealed recent relief on the forefield (Figure 9 and Figure 9a).
3.3.1. Slope Landforms
Slope landforms are commonly found at Siodło and on the northern slope of Demay Point (Figure 9). Visible on the formed floors is a rocky surface—rocky slope and rock wall—and talus slopes, which are characteristic of most rocky mountains and slopes and were recognized and described for this region by Dąbski et al. [54]. Rocky slopes are cut by the chutes and debris flow gullies, at the outlet of which talus cones and covers are formed (Figure 9). These landforms are typical for rocky-mountains [59].
3.3.2. Littoral Landforms
Close to the shore in the southern part of the forefield, the narrow, mostly stony, and gravel beach is often eroded. Due to the tides (reaching 2 m) and surf along the southern part of the beach, a coastal scarp with a height of approximately 2–5 m is present (Figure 9b). The strongest surf, in comparison to other parts of the shore, may be caused by the frequent occurrence of storms entering to Admiralty Bay from the Bransfield Strait. The middle and northern parts of the beach are less eroded and may be protected by Block Point acting as a natural breakwater.
In northern part of the forefield, in front of the ice cliff, a proglacial lagoon with a total area 0.09 km2 has formed (Figure 9a and Figure 10). However, the bathymetries of the lagoon and other lakes have not been measured yet. At the southern part of the lagoon, a small spit with a length of approximately 100 m is recognized with characteristic curvature referring to the wind and oceanological interactions. The lagoon is separated from Staszek Cove by a partially submerged morainal bank under the shallow water (Figure 9a). The morainal bank is associated with the extent of the glacier’s front position in 1995 (Figure 3 and Figure 9a) and the accumulation of the glacier’s deposits, which is similar to the foreshore flat close to Suszczewski Cove in front of Ecology Glacier [16].
3.3.3. Post-Glacial and Glacial Landforms
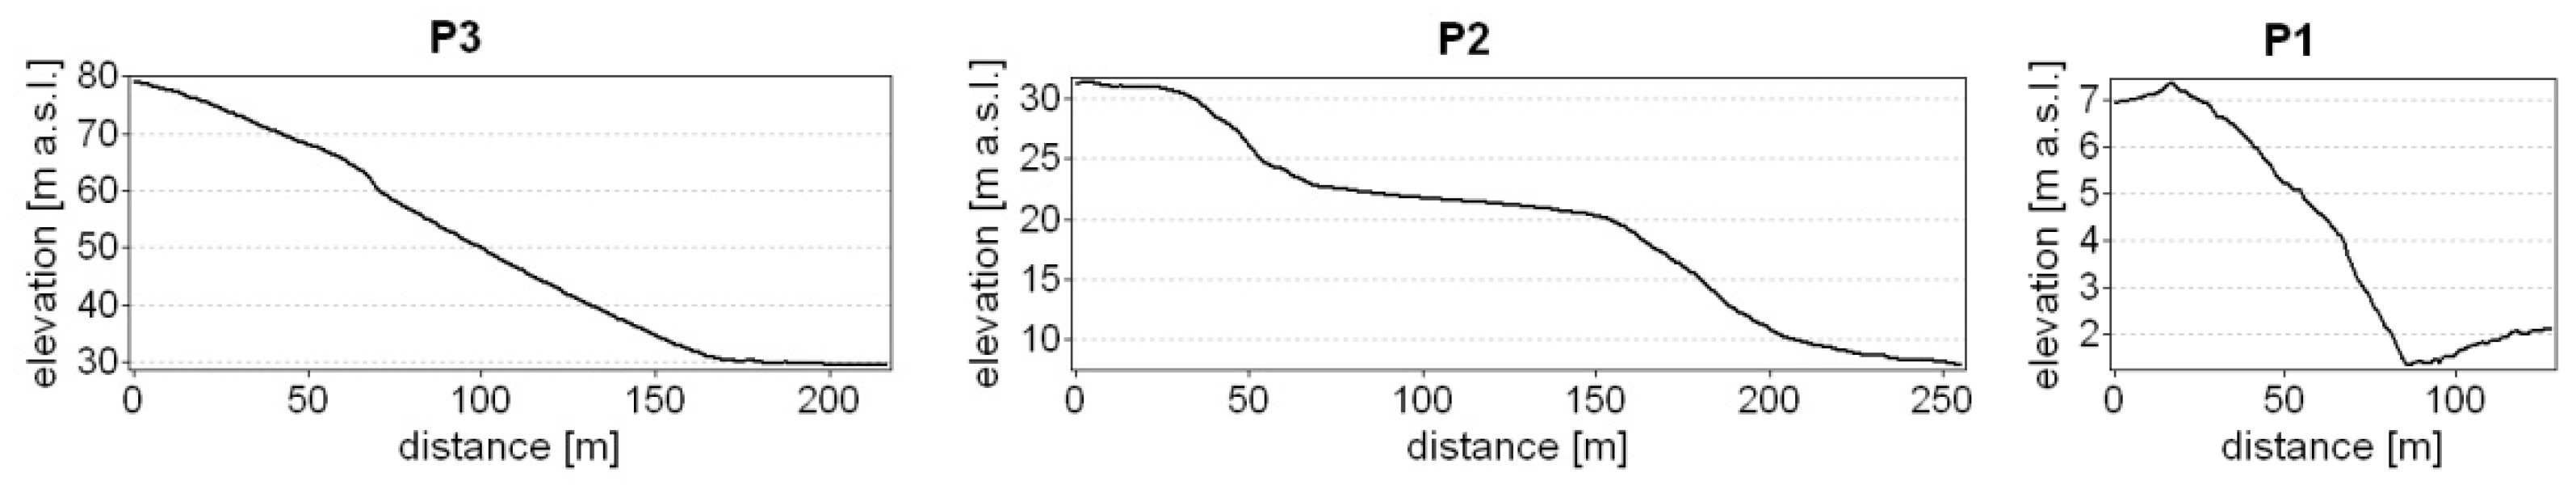
The predominantly occurring landforms on the terrain are post-glacial. The farthest extent on the land of the Baranowski Glacier determines the location of the glacier terminus of the washed end moraine ridge along the coastline. In front of the proglacial lagoon, the ridge transforms into the morainal bank. At the northern tongue, an ice cliff with an elevation of 20 m a.s.l. has been measured. The ice cliff is grounded on a narrow passage between the proglacial lagoon and floods during high tides. Furthermore, close to the Siodło mountain, debris-covered glacier ice has been indicated. The forefield area is limited by lateral moraine ridges on both sides (Figure 9). The maximum elevation of the southern lateral moraine is 30 m a.s.l., whereas that of the ice-cored Błaszyk Moraine is approximately 50 m a.s.l. Furthermore, the Błaszyk Moraine is considered an earlier medial moraine ridge, formed as a result of confluence with the Sphinx Glacier [41]. The moraine is varied by a densely distributed moraine ridge crest with a transverse course to the main crest, which is parallel to the northern tongue (Figure 9a). Between the Błaszyk Moraine and the northern tongue the cascade system of five till terraces has been recognized (Figure 9a and Figure 11). The smooth surface of each terrace is separated by approximately 10 m of height steps. The exception is the highest terrace (T5), separated from lower (T4) by the 50 m step (Figure 10). The Western edge of the terrace 2 (T2) is covered by numerous crevasse-fill ridges with 10–40 m long, 1–6 m wide, and 0.5–2 m height. Orientation of the forms is transverse and oblique to the ice-flow direction (Figure 11).
The distal part of the southern forefield is limited by the lateral moraine ridge with longitudinal moraine ridge crests. The course of this form was strictly in line with the front position of the glacier in 1956 (Figure 9b), when the form was already visible on aerial photos. In front of the southern tongue (Figure 10), the ice-cored front moraine ridge accumulated numerous curved ridges. Further from the terminus, the fluted moraine cover extended with numerous subglacial landforms like flutes and debris stripes—reflecting ice-flow direction (Figure 9b) [60]. Few of the flutes ware also present in lower part of the forefield. The length of the forms range from five to 110 m with a rise up to one m above the moraine. Along the shore, a washed end moraine ridge has been recognized (Figure 9b). This moraine ridge corresponds to the mapped 1979–1989 glacial extent and can be associated with the accumulation of glacial deposits that have subsequently been washed and partially eroded.
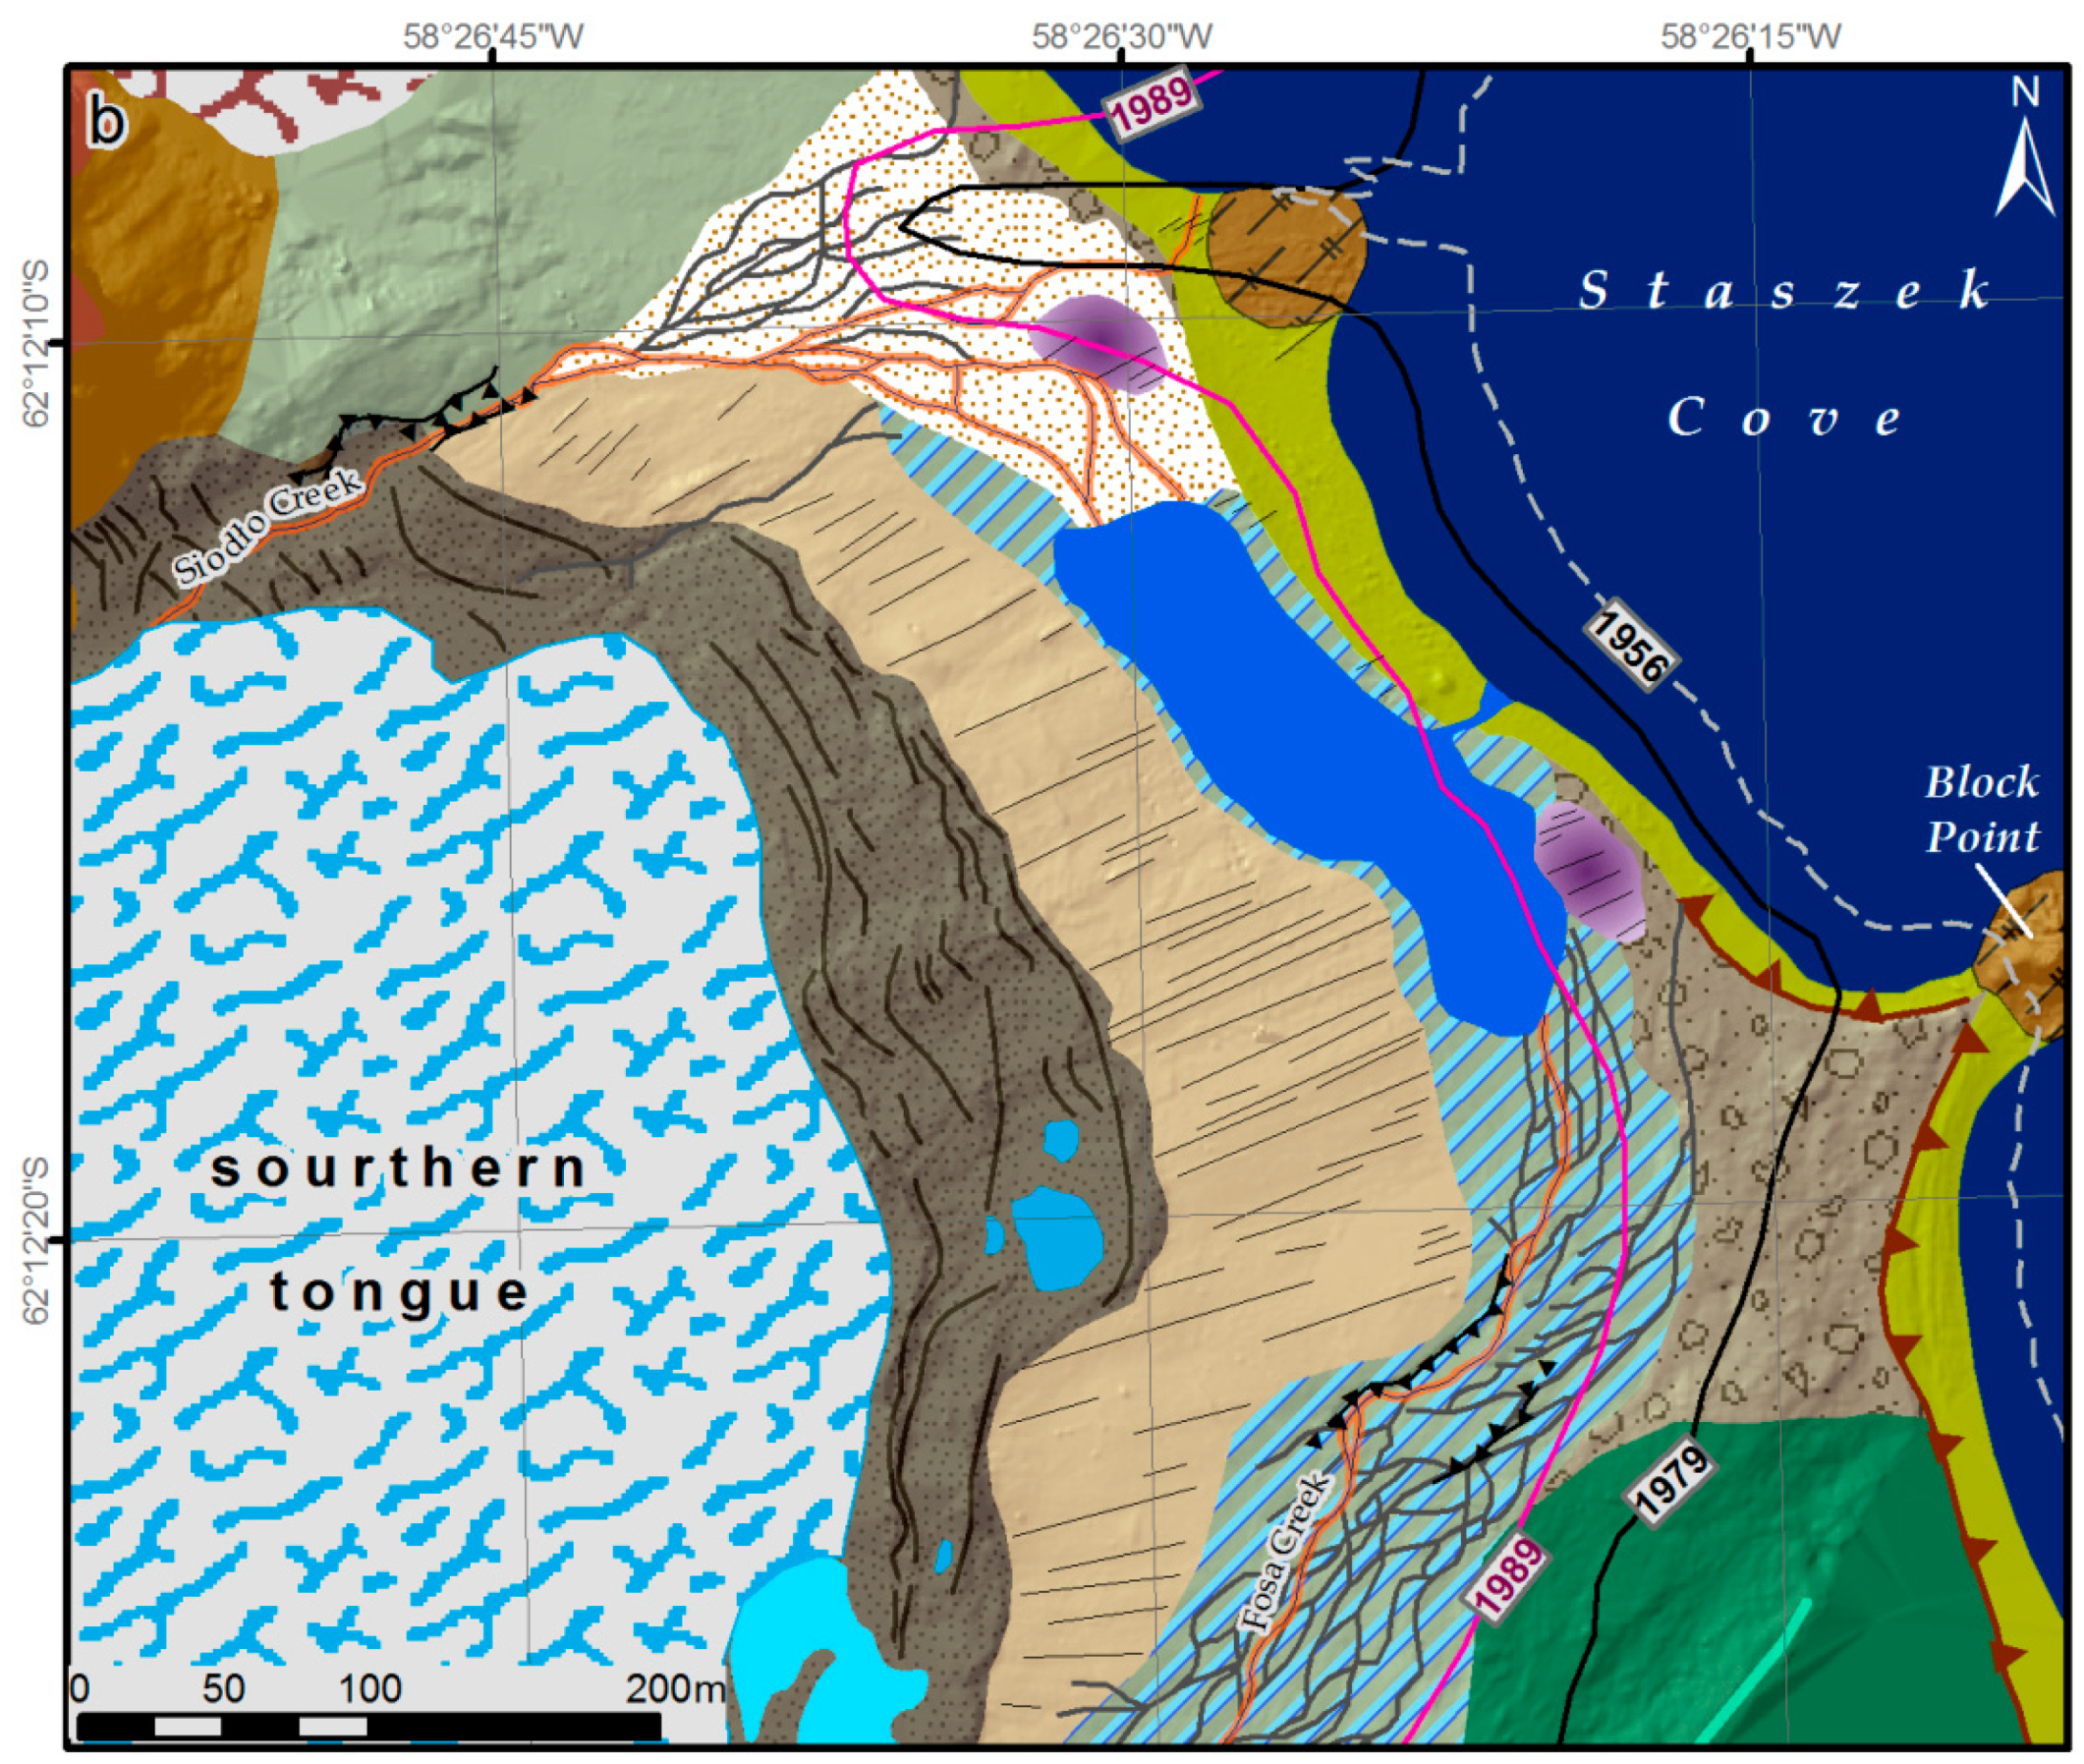
3.3.4. Fluvial and Glaciofluvial Forms
In the central part of the forefield, in the front moraine ridge close to the glacier, a small outwash plain occurs. This form is varied, with proglacial lake basin and proglacial channels represented by braided troughs (Figure 9b and Figure 10). In most of the creeks, the water flows periodically, whereas in two creeks, the Fosa and Siodło Creeks, water flowed during the entire 2016 summer season [43]. Both creeks had cut gorges in ice-cored front moraine and lateral moraine ridges. Approximately 200 m below the gorge in the front moraine ridge, Siodło Creek (subglacial outflow) and the episodic creeks have created a delta mouth where a sandur cone has been accumulated (Figure 9b). On the sandur, one of the two kames has been formed. The second is located close to the lake. The diameter of the kames is approximately 50 m with 1.5–2.5 m of height. Furthermore, small ponds (like kettle lakes and one moraine-dammed lake) have been located on ice-cored front moraine ridge and still cover on the terraces (Figure 9). Ice marginal meltwater channels have been indicated on the terraces too, the same as on the top of Siodło mountain.
4. Discussion
Since the beginning of the 1990s, when the geomorphological observations on the Western shore of Admiralty Bay were conducted [37,40,41], there has been a rapid recession of the glacier front, revealing a new forefield. During the periods 1956–1979 and 2012–2016, the front position of the Baranowski Glacier was relatively stable [31], which was similar to the results presented for Ecology Glacier [16,24,31]. However, Pętlicki et al. [16] showed that the extensive retreat of the front position of Ecology Glacier, as revealed by a comparison between 1979–1988 and 2007–2012, does not match the timing of the greatest retreat of the front of Baranowski Glacier, which was observed from 1995 to 2003. Certain differences probably arise from the timing of when the Ecology Glacier ice cliff was stranded in relatively deep water [16] and calved very quickly.
In addition, some of the different reactions to similar environmental conditions in the north and south parts of the glacier can be explained due to the presence of relatively warm water (Figure 6), which can enhance the melting process of the northern part. For the entire time period between 1956 and 2017, the retreat rate for profile A is higher (9.2 m/year) than that for profile B (5.1 m/year) (Figure 4). This observation was also reported in previous works, which concluded that increased calving may be triggered by warm water undercutting the ice cliff [61,62,63,64]. While the northern tongue is recently grounded on the bottom moraine, tidal amplitudes close to the lagoon may have an effect on the calving [65] due to the connection with Staszek Cove. During high tides, the average daily tidal amplitude was 1.16 m with a maximum of 1.84 m in 1979 and 1.17 m with a maximum of 1.91 m in 2001 [66]. Despite the grounded ice cliff, tidal amplitudes affected the buoyancy, which should also increase calving.
Aerial photos from 1956, which were the first available archival cartographic materials for the Baranowski Glacier, showed that the entire area of the present forefield was covered by the glacier at that time. Moreover, in 1956, its extent was closely related to the course of lateral morainal ridges, which already existed on both sides, although they were probably smaller than they are now. Between 1956 and 1979, glacial deposits accumulated, the ridges of the Błaszyk Moraine increased to 50 m a.s.l., and the southern lateral moraine ridge increased to 30 m a.s.l. In 1989, the ice elevation in the lateral parts decreased from 40 m close to the Błaszyk Moraine to 20 m on the southern end and was increasing upslope. Notably, the ice elevation in these areas was ~10 m and ~5 m lower than the elevation of the terrain in 2001 and 2016 on the north and south tongues, respectively. It seems that in this case, climate conditions could contribute to the ice thickening and result in enlargement of the already existing lateral moraine ridges. Other considering factor provided to enlarging of the southern lateral moraine ridge was probably the accumulation of deposits from the eroded northern slope of Demay Point. The deposits could come from the upper parts and build up the ridge. On the other hand, the higher elevation of the Błaszyk Moraine could be caused by the confluence of the Baranowski and Sphinx Glacier [37,41], and the accumulation of deposits at a broader scale in the medial moraine ridge.
In 1989, when the glacier retreated back onto the land on the southern forefield, the ice surface elevation was lower than 50 m a.s.l. The melting of the glacier caused the formation of an end moraine ridge, which was washed due to erosional processes close to the littoral zone. A partial residue of the landform has become visible recently (Figure 9b). On both sides of terminus position from 1989 two kames have been formed—being the confirmation for the retreating process. However, surfaces of the both kames are fluted which is an evidence for subglacial landforms characteristic for surge-type glaciers [60]. While there are other observations for the possible surge of the Baranowski Glacier such as fluted moraine in front of southern terminus (Figure 9b) or identifications of crevasse-fill ridges found in terrace T2 close to the ice cliff visible in Figure 9a, or ice thickening in this area presented in Figure 8b—this phenomena is not confirmed by the climate data or the analysis of terminus position changes (Figure 3).
In 1989, the ice surface elevation was 15–20 m, whereas at the front moraine ridge, it was between 30 and 35 m. Rachlewicz [38] claimed that the front moraine ridge and Błaszyk Moraine are ice-cored. Recent observation confirms no changes in this area. The evidence for this statement can be kettle lakes (Figure 9) being the result of dead-ice melting [60] that commonly occures in the front moraine ridge and the terraces close to the Błaszyk Moraine (Figure 9a).
In the middle part of the new ice-free locations on the southern forefield, a new proglacial lake basin and a large area of outwash plain have appeared. These locations are cut by numerous and periodically active troughs. Sziło and Bialik [39] suggested that the rapid changes in the geomorphology of this part of the Baranowski Glacier forefield were due to the high energetic differentiation of the sediment particles. Furthermore, it has been shown that the differences between two creeks, Fosa and Siodło, are due to their relative stage of formation and position of the glacier terminus. Fosa Creek has not been covered with ice for more than 30 years and seems to be at a more stable development point.
5. Conclusions
The following points summarize our results:
- Since 1956, the front position of the Baranowski Glacier and its ice surface elevation has been changing. Over 50 years of rising trends in the mean annual air temperature, the reaction of the glacier has simultaneously been visible, as manifested by recession and ice surface lowering. However, from 2001 to 2016, regional cooling in the summer months was observed, which could decelerate this process. In contrast, since 2017, repeated increases in the mean annual air temperature up to −1.6 °C, in comparison to the mean annual air temperature of −2.3 °C for the period 1969–2017 and warm summers, caused a reduction in the front position of approximately 5 m per year. Consequentially, the melting glacier has uncovered new ice-free surfaces, where the relief of the forefield strictly reflects the spatial and temporal fluctuation of the glacier retreat rate and ice elevation changes;
- The highest recession rate observed for the northern tongue, when the ice cliff was flowing to the proglacial lagoon in the period 2001–2003, reached 65 m/year. In contrast, the recession rate for the southern tongue terminating on land was 1.5 m/year in the same period. The different reaction of both tongues during the same climate conditions suggests that warm water in the proglacial lagoon, reaching 5.0–5.5 °C, played a significant role in calving and melting processes and caused a retreat of the glacier front;
- Observations of long flutes and crevasse fill ridges on the analyzed forefield of Baranowski Glacier suggest a former surge episode, which could happen at least in the northern part of the glacier and the middle part of the southern forefield.
- The formation of the northern forefield started in 1995. Nevertheless, the ice surface elevation in 1989 was approximately 70 m a.s.l., descending to the edges. In addition, the elevation of the ice cliff is not certain; however, the model results suggest no huge changes. Therefore, it was likely similar to values from 2016, when it was 20 m. The glacier in the northern part calved from the ice cliff with a maximum loss of 50 m between 1989 and 2001. The largest loss of frontal ice cliff occurred in the center of the current proglacial lagoon, suggesting that this location may be the deepest due to the erosional force from the calved glacier scouring the bottom. However, the bathymetry of the lagoon is still unknown and needs further study;
- The recent relief of the forefield is the result of climatic conditions due to the fluctuations of air temperature. This condition has influenced the dynamics of the frontal position changes of the Baranowski Glacier and the morphodynamics of the geomorphological processes;
- As the bed topography is still unknown, it is difficult to forecast the further direction of the developing proglacial relief. However, the convex shape of isolines on the southern part of Siodło in 1989, 2001, and 2016 allow us to postulate that, under this part of the glacier, the slope is most likely steeper than in the surrounding areas, and that after the recession of the glacier, most of the forms may be erosional.
Author Contributions
Conceptualization, J.S.; Methodology, J.S.; Software, J.S.; Validation, J.S.; Formal Analysis, J.S.; Investigation, J.S. and R.J.B.; Resources, J.S. and R.J.B.; Data Curation, J.S.; Writing-Original Draft Preparation, J.S. and R.J.B.; Writing-Review & Editing, J.S. and R.J.B.; Visualization, J.S.; Supervision, J.S. and R.J.B.; Project Administration, J.S.; Funding Acquisition, J.S. and R.J.B.
Funding
This publication has been partially financed by funds from the Leading National Research Centre (KNOW) received by the Centre for Polar Studies for the period 2014–2018.
Acknowledgments
The data used in the paper were collected based on the Arctowski Polish Antarctic Station and with help of the staff of the Arctowski Polish Antarctic Station, who supported the field work. We are also very grateful to Michał Pętlicki for his help during field work and for providing us with the LiDAR data of the forefield of Baranowski Glacier. We would also like to thank Vladimir Radionov (Arctic and Antarctic Research Institute) for the complemenary meteorological data from Bellingshausen Station. Authors would like also to thank the Reviewers for very detailed comments which have improve the final version of the presented paper.
Conflicts of Interest
The authors declare no conflicts of interest. The founding sponsors had no role in the design of the study; in the collection, analysis, or interpretation of the data; in the writing of the manuscript; or in the decision to publish the results.
References
- López-Martínez, J.; Serrano, E.; Schmid, T.; Mink, S.; Linés, C. Periglacial processes and landforms in the South Shetland Islands (northern Antarctic Peninsula region). Geomorphology 2012, 155, 62–79. [Google Scholar] [CrossRef]
- Doran, P.T.; Priscu, J.C.; Lyons, W.B.; Walsh, J.E.; Fountain, A.G.; McKnight, D.M.; Moorhead, D.L.; Virginia, R.A.; Wall, D.H.; Clow, G.D.; et al. Antarctic climate cooling and terrestrial ecosystem response. Nature 2002, 415, 517–520. [Google Scholar] [CrossRef] [PubMed]
- Davis, C.H.; Li, Y.; McConnell, J.R.; Frey, M.M.; Hanna, E. Snowfall-driven growth in East Antarctic ice sheet mitigates recent sea-level rise. Science 2005, 308, 1898–1901. [Google Scholar] [CrossRef] [PubMed]
- Oerlemans, J. Extracting a climate signal from 169 glacier records. Science 2005, 308, 675–677. [Google Scholar] [CrossRef] [PubMed]
- Prinz, R.; Heller, A.; Ladner, M.; Nicholson, L.I.; Kaser, G. Mapping the Loss of Mt. Kenya’s Glaciers: An Example of the Challenges of Satellite Monitoring of Very Small Glaciers. Geosciences 2018, 8, 174. [Google Scholar] [CrossRef]
- Osipov, E.Y.; Osipova, O.P. Glacier Changes on the Pik Topografov Massif, East Sayan Range, Southeast Siberia, from Remote Sensing Data. Geosciences 2018, 8, 148. [Google Scholar] [CrossRef]
- Walther, M.; Dashtseren, A.; Kamp, U.; Temujin, K.; Meixner, F.; Pan, C.G.; Gansukh, Y. Glaciers, Permafrost and Lake Levels at the Tsengel Khairkhan Massif, Mongolian Altai, During the Late Pleistocene and Holocene. Geosciences 2017, 7, 73. [Google Scholar] [CrossRef]
- Skvarca, P.; Rack, W.; Rott, H.; Donángelo, T.I. Climatic trend and the retreat and disintegration of ice shelves on the Antarctic Peninsula: An overview. Polar Res. 1999, 18, 151–157. [Google Scholar] [CrossRef]
- Steig, E.J.; Schneider, D.P.; Rutherford, S.D.; Mann, M.E.; Comiso, J.C.; Shindell, D.T. Warming of the Antarctic ice-sheet surface since the 1957 International Geophysical Year. Nature 2009, 457, 459. [Google Scholar] [CrossRef] [PubMed]
- Barrand, N.E.; Vaughan, D.G.; Steiner, N.; Tedesco, M.; Munneke, P.K.; Broeke, M.R.; Hosking, J.S. Trends in Antarctic Peninsula surface melting conditions from observations and regional climate modeling. J. Geophys. Res. Earth Surf. 2013, 118, 315–330. [Google Scholar] [CrossRef] [Green Version]
- Falk, U.; Sala, H. Winter melt conditions of the inland ice cap on King George Island, Antarctic Peninsula. Erdkunde 2015, 69, 341–363. [Google Scholar] [CrossRef]
- Vaughan, D.G.; Marshall, G.J.; Connolley, W.M.; Parkinson, C.; Mulvaney, R.; Hodgson, D.A.; King, J.C.; Pudsey, C.J.; Turner, J. Recent rapid regional climate warming on the Antarctic Peninsula. Clim. Chang. 2003, 60, 243–274. [Google Scholar] [CrossRef]
- Oliva, M.; Navarro, F.; Hrbáček, F.; Hernández, A.; Nỳvlt, D.; Pereira, P.; Ruiz-Fernández, J.; Trigo, R. Recent regional climate cooling on the Antarctic Peninsula and associated impacts on the cryosphere. Sci. Total Environ. 2017, 580, 210–223. [Google Scholar] [CrossRef] [PubMed]
- Turner, J.; Lu, H.; White, I.; King, J.C.; Phillips, T.; Hosking, J.S.; Bracegirdle, T.J.; Marshall, G.J.; Mulvaney, R.; Deb, P. Absence of 21st century warming on Antarctic Peninsula consistent with natural variability. Nature 2016, 535, 411–415. [Google Scholar] [CrossRef] [PubMed] [Green Version]
- Arctic and Antarctic Research Institute, St. Petersburg. Available online: http://www.aari.aq/data/data.php?lang=1&station=0 (accessed on 17 September 2018).
- Pętlicki, M.; Sziło, J.; MacDonell, S.; Vivero, S.; Bialik, R. Recent Deceleration of the Ice Elevation Change of Ecology Glacier (King George Island, Antarctica). Remote Sens. 2017, 9, 520. [Google Scholar] [CrossRef]
- Cryosphere—Hydrosphere, Biosphere and Geophysics—NASA. Available online: https://neptune.gsfc.nasa.gov/csb/index.php?section=234 (accessed on 17 September 2018).
- Navarro, F.J.; Jonsell, U.Y.; Corcuera, M.I.; Martín-Español, A. Decelerated mass loss of Hurd and Johnsons Glaciers, Livingston Island, Antarctic Peninsula. J. Glaciol. 2013, 59, 115–128. [Google Scholar] [CrossRef] [Green Version]
- Rückamp, M.; Braun, M.; Suckro, S.; Blindow, N. Observed glacial changes on the King George Island ice cap, Antarctica, in the last decade. Glob. Planet. Chang. 2011, 79, 99–109. [Google Scholar] [CrossRef]
- Falk, U.; López, D.A.; Silva-Busso, A. Multi-year analysis of distributed glacier mass balance modelling and equilibrium line altitude on King George Island, Antarctic Peninsula. Cryosphere 2018, 12, 1211–1232. [Google Scholar] [CrossRef] [Green Version]
- Knap, W.H.; Oerlemans, J.; Cabée, M. Climate sensitivity of the ice cap of King George Island, South Shetland Islands, Antarctica. Ann. Glaciol. 1996, 23, 154–159. [Google Scholar] [CrossRef] [Green Version]
- Machío, F.; Rodríguez-Cielos, R.; Navarro, F.; Lapazaran, J.; Otero, J. A 14-year dataset of in situ glacier surface velocities for a tidewater and a land-terminating glacier in Livingston Island, Antarctica. Earth Syst. Sci. Data 2017, 9, 751. [Google Scholar] [CrossRef]
- Fieber, K.D.; Mills, J.P.; Miller, P.E.; Clarke, L.; Ireland, L.; Fox, A.J. Rigorous 3D change determination in Antarctic Peninsula glaciers from stereo WorldView-2 and archival aerial imagery. Remote Sens. Environ. 2018, 205, 18–31. [Google Scholar] [CrossRef]
- Sobota, I.; Kejna, M.; Araźny, A. Short-term mass changes and retreat of the Ecology and Sphinx glacier system, King George Island, Antarctic Peninsula. Antarct. Sci. 2015, 27, 500–510. [Google Scholar] [CrossRef]
- Muser, D.; (Albert-Ludwigs-Universität Freiburg, Freiburg im Breisgau, Germany). Der Gletscherrückzug auf King George Island, South Shetland Islands Zwischen 1956 und 1992. Eine Digitale Auswertung von Karten, Luftbildern und Satellitendaten. Unpublished Thesis. 1995. (In German) [Google Scholar]
- Simões, J.C.; Bremer, U.F.; Aquino, F.E.; Ferron, F.A. Morphology and variations of glacial drainage basins in the King George Island ice field, Antarctica. Ann. Glaciol. 1999, 29, 220–224. [Google Scholar] [CrossRef] [Green Version]
- Birkenmajer, K. Retreat of Ecology Glacier, Admiralty Bay, King George Island (South Shetland Islands, West Antarctica), 1956–2001. Bull. Pol. Acad. Sci. Earth Sci. 2002, 50, 15–29. [Google Scholar]
- Braun, M.; Gossmann, H. Glacial changes in the areas of Admiralty Bay and Potter Cove, King George Island, maritime Antarctica. In Geoecology of Antarctic Ice-Free Coastal Landscapes; Springer: Berlin, Germany, 2002; pp. 75–89. [Google Scholar]
- Rosa, K.K.; Vieira, R.; Simões, J.C. Dinâmica Glacial e Características Sedimentares Resultantes na Zona Proglacial da Geleira Ecology-Baía do Almirantado, Ilha Rei George Antártica. Rev. Bras. Geomorfol. 2006, 7, 51–60. [Google Scholar] [CrossRef]
- Osmanoğlu, B.; Braun, M.; Hock, R.; Navarro, F.J. Surface velocity and ice discharge of the ice cap on King George Island, Antarctica. Ann. Glaciol. 2013, 54, 111–119. [Google Scholar] [CrossRef] [Green Version]
- Pudełko, R.; Angiel, P.J.; Potocki, M.; Jędrejek, A.; Kozak, M. Fluctuation of Glacial Retreat Rates in the Eastern Part of Warszawa Icefield, King George Island, Antarctica, 1979–2018. Remote Sens. 2018, 10, 892. [Google Scholar] [CrossRef]
- Kim, K.Y.; Lee, J.; Hong, M.H.; Hong, J.K.; Jin, Y.K.; Shon, H. Seismic and radar investigations of Fourcade Glacier on King George Island, Antarctica. Polar Res. 2010, 29, 298–310. [Google Scholar] [CrossRef]
- Kim, K.Y.; Lee, J.; Hong, M.H.; Hong, J.K.; Shon, H. Helicopter-borne and ground-towed radar surveys of the Fourcade Glacier on King George Island, Antarctica. Explor. Geophys. 2010, 41, 51–60. [Google Scholar] [CrossRef]
- Oliva, M.; Ruiz-Fernández, J. Coupling patterns between para-glacial and permafrost degradation responses in Antarctica. Earth Surf. Process. Landf. 2015, 40, 1227–1238. [Google Scholar] [CrossRef]
- Oliva, M.; Ruiz-Fernández, J. Geomorphological processes and frozen ground conditions in Elephant Point (Livingston Island, South Shetland Islands, Antarctica). Geomorphology 2017, 293, 368–379. [Google Scholar] [CrossRef]
- Francelino, M.R.; Schaefer, C.E.G.; Simas, F.N.B.; Fernandes Filho, E.I.; de Souza, J.J.L.L.; da Costa, L.M. Geomorphology and soils distribution under paraglacial conditions in an ice-free area of Admiralty Bay, King George Island, Antarctica. Catena 2011, 85, 194–204. [Google Scholar] [CrossRef]
- Almeida, I.C.; Schaefer, C.E.G.; Fernandes, R.B.; Pereira, T.T.; Nieuwendam, A.; Pereira, A.B. Active layer thermal regime at different vegetation covers at Lions Rump, King George Island, Maritime Antarctica. Geomorphology 2014, 225, 36–46. [Google Scholar] [CrossRef]
- Rachlewicz, G. Glacial relief and deposits of the western coast of Admiralty Bay, King George Island, South Shetland Islands. Pol. Polar Res. 1999, 20, 89–130. [Google Scholar]
- Sziło, J.; Bialik, R.J. Grain Size Distribution of Bedload Transport in a Glaciated Catchment (Baranowski Glacier, King George Island, Western Antarctica). Water 2018, 10, 360. [Google Scholar] [CrossRef]
- Tatur, A.; del Valle, R. Badania paleolimnologiczne i geomorfologiczne na Wyspie Króla Jerzego, Antarktyka Zachodnia (1984–1986). Przegląd Geol. 1986, 34, 621–626. [Google Scholar]
- Kostrzewski, A.; Rachlewicz, G.; Zwolinski, Z. Geomorphological map of the western coast of Admiralty Bay, King George Island. In Relief, Quaternary Paleogeography and Changes of the Polar Environment; Maria Curie-Skłodowska University Press: Lublin, Poland, 1998; pp. 71–77. [Google Scholar]
- Kostrzewski, A.; Rachlewicz, G.; Zwolinski, Z. The relief of the Western coast of Admiralty Bay, King George Island, South Shetlands. Quaest. Geogr. 2003, 22, 43–58. [Google Scholar]
- Sziło, J.; Bialik, R.J. Bedload transport in two creeks at the ice-free area of the Baranowski Glacier, King George Island, West Antarctica. Pol. Polar Res. 2017, 38, 21–39. [Google Scholar] [CrossRef] [Green Version]
- Final Report of the Thirty-Seventh Antarctic Treaty Consultative Meeting. Available online: https://www.ats.aq/documents/ATCM37/fr/ATCM37_fr001_e.pdf (accessed on 17 September 2018).
- USGS Earth Explorer. Available online: https://earthexplorer.usgs.gov/ (accessed on 17 September 2018).
- Battke, Z. Admiralty Bay, King George Island, 1:50,000; E. Romer State Cartographical Publishing House: Warsaw, Poland, 1990. [Google Scholar]
- Pudełko, R. Topographic map of the SSSI No. 8, King George Island, West Antarctica. Pol. Polar Res. 2003, 24, 53–60. [Google Scholar]
- Pudełko, R. Two new topographic maps for sites of scientific interest on King George Island, West Antarctica. Pol. Polar Res. 2008, 29, 291–297. [Google Scholar]
- Landsat 7 Science Data Users Handbook. Available online: https://landsat.gsfc.nasa.gov/wp-content/uploads/2016/08/Landsat7_Handbook.pdf (accessed on 17 September 2018).
- Pudełko, R. Site of Special Interest No. 8 (SSSI-8) King George Island 2002, Topographic Map, 1:12,500 Scale; Department of Antarctic Biology: Warsaw, Poland, 2002. [Google Scholar]
- Nuth, C.; Kääb, A. Co-registration and bias corrections of satellite elevation data sets for quantifying glacier thickness change. Cryosphere 2011, 5, 271–290. [Google Scholar] [CrossRef] [Green Version]
- Paul, F.; Haeberli, W. Spatial variability of glacier elevation changes in the Swiss Alps obtained from two digital elevation models. Geophys. Res. Lett. 2008, 35, L21502. [Google Scholar] [CrossRef]
- Navarro, F.J.; Glazovsky, A.F.; Macheret, Y.Y.; Vasilenko, E.V.; Corcuera, M.I.; Cuadrado, M.L. Ice-volume changes (1936–1990) and structure of Aldegondabreen, Spitsbergen. Ann. Glaciol. 2005, 42, 158–162. [Google Scholar] [CrossRef]
- Dąbski, M.; Zmarz, A.; Pabjanek, P.; Korczak-Abshire, M.; Karsznia, I.; Chwedorzewska, K.J. UAV-based detection and spatial analyses of periglacial landforms on Demay Point (King George Island, South Shetland Islands, Antarctica). Geomorphology 2017, 290, 29–38. [Google Scholar] [CrossRef]
- Braun, M.; Rau, F.; Saurer, H.; Goßmann, H. The development of radar glacier zones onthe King George Island ice cap (Antarctica) during the austral summer 1996/97 as observed in ERS-2 SAR data. Ann. Glaciol. 2000, 31, 357–363. [Google Scholar] [CrossRef]
- Bintanja, R. The local surface energy balance of the Ecology Glacier, King George Island, Antarctica: measurements and modelling. Antarct. Sci. 1995, 7, 315–325. [Google Scholar] [CrossRef]
- Birkenmajer, K. Geology of Admiralty Bay, King George Island (South Shetland Islands). An outline. Pol. Polar Res. 1980, 1, 29–54. [Google Scholar]
- Mozer, A.; Pécskay, Z.; Krajewski, K.P. Eocene age of the Baranowski Glacier Group at Red Hill, King George Island, West Antarctica. Pol. Polar Res. 2015, 36, 307–324. [Google Scholar] [CrossRef] [Green Version]
- Kotarba, A.; Kaszowski, L.; Krzemień, K. High-mountain Denudational System of the Polish Tatra Mountains = Wysokogórski System Denudacyjny Tatr Polskich. Available online: http://rcin.org.pl/Content/18828/WA51_35225_r1987-nr3_Geogr-Stud-Special-I.pdf (accessed on 18 September 2018).
- Schomacker, A.; Benediktsson, I.O.; Ingólfsson, Ó. The Eyjabakkajökull glacial landsystem, Iceland: Geomorphic impact of multiple surges. Geomorphology 2014, 218, 98–107. [Google Scholar] [CrossRef]
- Kirkbride, M.P.; Warren, C.R. Calving processes at a grounded ice cliff. Ann. Glaciol. 1997, 24, 116–121. [Google Scholar] [CrossRef] [Green Version]
- O’Leary, M.; Christoffersen, P. Calving on tidewater glaciers amplified by submarine frontal melting. Cryosphere 2013, 7, 119–128. [Google Scholar] [CrossRef]
- Pętlicki, M.; Ciepły, M.; Jania, J.A.; Promińska, A.; Kinnard, C. Calving of a tidewater glacier driven by melting at the waterline. J. Glaciol. 2015, 61, 851–863. [Google Scholar] [CrossRef] [Green Version]
- Haresign, E.; Warren, C.R. Melt rates at calving termini: a study at Glaciar León, Chilean Patagonia. Geol. Soc. Lond. Spec. Publ. 2005, 242, 99–109. [Google Scholar] [CrossRef]
- Bartholomaus, T.C.; Larsen, C.F.; West, M.E.; O’Neel, S.; Pettit, E.C.; Truffer, M. Tidal and seasonal variations in calving flux observed with passive seismology. J. Geophys. Res. Earth Surf. 2015, 120, 2318–2337. [Google Scholar] [CrossRef]
- Online Tides and Currents Predictions. Available online: http://tides.mobilegeographics.com (accessed on 17 September 2018).
Figure 1.
Mean annual air temperature and sum of the precipitation at Bellingshausen Station (Fieldes Peninsula) in the period 1969–2017 [15].
Figure 1.
Mean annual air temperature and sum of the precipitation at Bellingshausen Station (Fieldes Peninsula) in the period 1969–2017 [15].

Figure 2.
Location of the study area: (a) Antarctica; (b) King George Island (KGI); (c) Warszawa Icefield; (d) Western shore of Admiralty Bay. Basemap: Landsat (18 January 2014). Reference system: World Geodetic System (WGS) 1984, Universal Transverse Mercator (UTM) zone 21S, geoid Earth Gravitational Model 1996 (EGM96).

Figure 3.
Front position changes based on aerial (1956, 1979) and satellite (1995, 2003, 2007, 2018) images, archival maps (1989, 2001), and terrestrial laser scanner (TLS) survey (2016). Reference system: WGS 1984, UTM zone 21S, geoid EGM96. Base map is Landsat acquired on 05 February 2018.
Figure 3.
Front position changes based on aerial (1956, 1979) and satellite (1995, 2003, 2007, 2018) images, archival maps (1989, 2001), and terrestrial laser scanner (TLS) survey (2016). Reference system: WGS 1984, UTM zone 21S, geoid EGM96. Base map is Landsat acquired on 05 February 2018.

Figure 4.
Multi-year frontal fluctuation rates (1956–2018) and multi-year mean air temperature (1969–2017). * Air temperature records from Bellingshausen Station are available since 1969.
Figure 4.
Multi-year frontal fluctuation rates (1956–2018) and multi-year mean air temperature (1969–2017). * Air temperature records from Bellingshausen Station are available since 1969.

Figure 5.
Mean monthly air temperature for time series from frontal fluctuation rates.

Figure 6.
Surface water temperature based on Landsat imagery acquired on 4 February 2003.

Figure 7.
Ice elevation in (a) 1989, (b) 2001, and (c) 2016. Reference system: WGS 1984, UTM zone 21S, and geoid EGM96.
Figure 7.
Ice elevation in (a) 1989, (b) 2001, and (c) 2016. Reference system: WGS 1984, UTM zone 21S, and geoid EGM96.

Figure 8.
Ice surface elevation differences between (a) 1989 and 2001, (b) 2001 and 2016, and (c) 1989 and 2016. Reference system: WGS 1984, UTM zone 21S, and geoid EGM96.
Figure 8.
Ice surface elevation differences between (a) 1989 and 2001, (b) 2001 and 2016, and (c) 1989 and 2016. Reference system: WGS 1984, UTM zone 21S, and geoid EGM96.

Figure 9.
Geomorphological map of the study area: (a) northern forefield and (b) southern forefield. Reference system: WGS 1984, UTM zone 21S, and geoid EGM96.
Figure 9.
Geomorphological map of the study area: (a) northern forefield and (b) southern forefield. Reference system: WGS 1984, UTM zone 21S, and geoid EGM96.


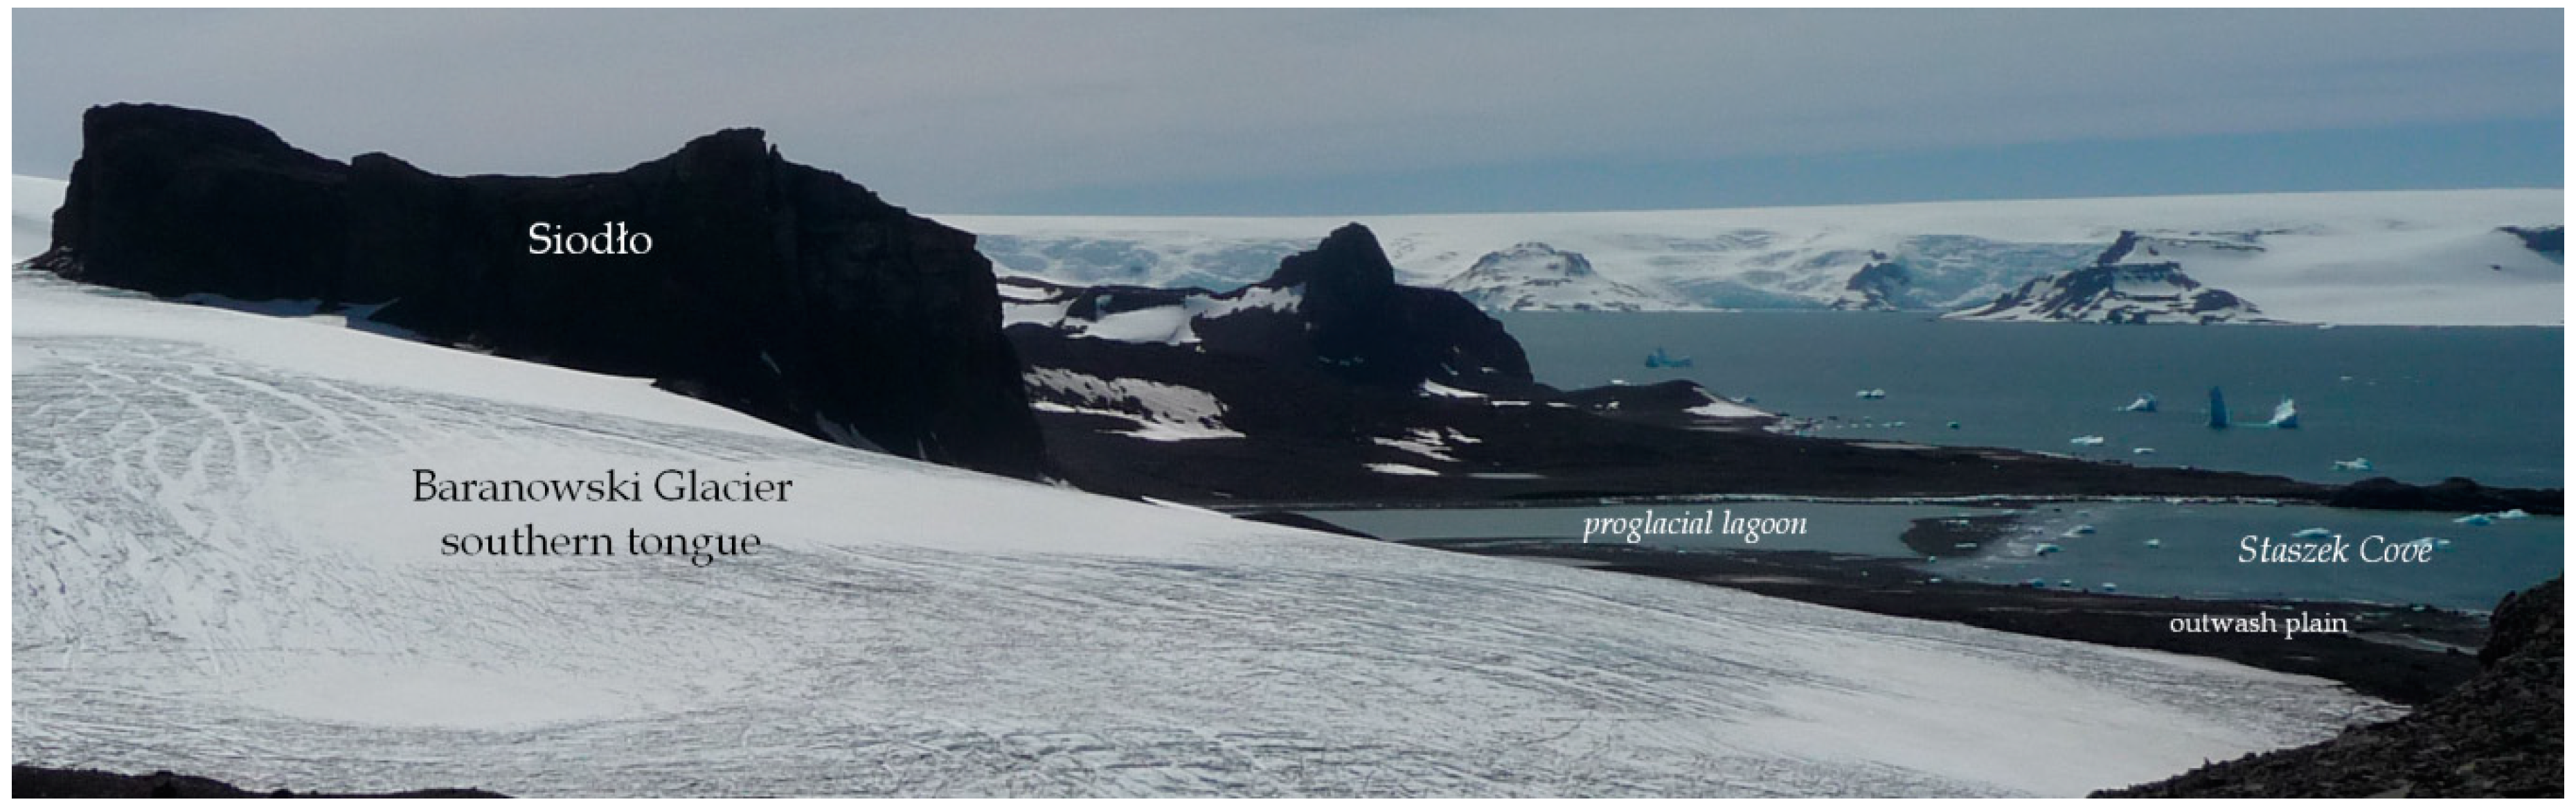
Figure 10.
Forefield of the Baranowski Glacier in 2016 (southern tongue) (Photo J. Sziło).

Figure 11.
Elevation profiles along the terraces.

© 2018 by the authors. Licensee MDPI, Basel, Switzerland. This article is an open access article distributed under the terms and conditions of the Creative Commons Attribution (CC BY) license (http://creativecommons.org/licenses/by/4.0/).
Share and Cite
MDPI and ACS Style
Sziło, J.; Bialik, R.J. Recession and Ice Surface Elevation Changes of Baranowski Glacier and Its Impact on Proglacial Relief (King George Island, West Antarctica). Geosciences 2018, 8, 355. https://doi.org/10.3390/geosciences8100355
AMA Style
Sziło J, Bialik RJ. Recession and Ice Surface Elevation Changes of Baranowski Glacier and Its Impact on Proglacial Relief (King George Island, West Antarctica). Geosciences. 2018; 8(10):355. https://doi.org/10.3390/geosciences8100355
Chicago/Turabian StyleSziło, Joanna, and Robert Józef Bialik. 2018. "Recession and Ice Surface Elevation Changes of Baranowski Glacier and Its Impact on Proglacial Relief (King George Island, West Antarctica)" Geosciences 8, no. 10: 355. https://doi.org/10.3390/geosciences8100355
Note that from the first issue of 2016, this journal uses article numbers instead of page numbers. See further details here.