
The Fellini Museum of Rimini in Italy and the Genetic Algorithms-Based Method to Optimize the Design of an Integrated System Network and Installations

1
Safety & Security Engineering Group–DICMA, SAPIENZA–University of Rome, 00184 Rome, Italy
2
Wessex Institute of Technology, Ashurst Lodge, Ashurst, Southampton SO40 7AA, UK
3
European Academy of Sciences and Arts, A-5020 Salzburg, Austria
Heritage 2022, 5(2), 1310-1329; https://doi.org/10.3390/heritage5020068
Submission received: 27 March 2022
/
Revised: 6 June 2022
/
Accepted: 13 June 2022
/
Published: 20 June 2022
(This article belongs to the Section Museum and Heritage)
Abstract
:The Fellini Museum is an exhibition hall dedicated to the Rimini film director Federico Fellini, included by the Ministry of Culture of Italy among the great national cultural projects. It was inaugurated on 19 August 2021, and it is the first worldwide exhibition hall dedicated to the famous film director. The museum, intended as a widespread museum center, is divided into three separate places in the historic center of Rimini: Sismondo Castle (built at the behest of Sigismondo Malatesta, at that time Lord of Rimini and Fano, starting from 1437 AD), Fulgor Palace and Malatesta square. The goal of the present paper is double. In the first part, as a case study, the innovative integrated system and installations planned for the optimal functioning and management of the Fellini Museum of Rimini in Italy is illustrated, showing its related complexity, due to its extension and articulation through different environments and due to the respect for architectural/historical heritage. In the second part, as dedicated and linked research, a proper Genetic Algorithms-based method, studied and applied for the optimization of the design of the wired network of the integrated system, the electrical power network and the air conditioning network is illustrated. It guarantees a decrease of realization costs, considering also the typical vincula and restrictions of already existing historical buildings, such as the considered one.
1. Introduction
Museums represent important cultural heritage sites generally hosted in new buildings created on purpose or adapting already existing historical buildings where possible. In either case, it is necessary to guarantee the security of the infrastructure, its artifacts and the people involved. This includes: (i) ensuring the safety, security and comfort of visitors and personnel, (ii) preserving works of art in the museums, and (iii) managing physical installations such as the electrical power, lighting, and air-conditioning of the cultural sites required for their conservation, and energy consumption. Such considerations contribute to the inclusivity of people with special needs, children, and the elderly when it comes to the usability and experience aspects of facilities provided within these sites.
From these points of view, technology and integrated technological systems (ITSs) represent powerful tools [1,2,3,4,5,6,7,8,9], and in particular, the IoT (Internet of Things)/IoE (Internet of Everything) is used to achieve an integral control of the whole museum, as well as to provide advanced functionalities for different purposes [10,11,12,13,14,15,16,17].
The use of technology and ITS needs a communication system that includes both wireless and wired networks. The latter could present an issue in an already existing historical building due to the architectonic and aesthetic restrictions. Similar problems occur in the design and the realization of installations such as the electrical power and the air conditioning units. For these reasons, it is very important to find a way to optimize the design of the communication and electrical networks as well as the air-conditioning systems which involves ensuring an optimal set of physical resources required and their specific placement on the site for performance efficiency. They represent a typical nonlinear and multiple objectives problem for which the concept of Genetic Algorithms is likely to provide the best set of solutions.
The goal of the present paper is double and listed in the following:
- In the first part, as a case study, the innovative integrated system and installations planned for the optimal functioning and management of the Fellini Museum of Rimini in Italy is illustrated. It brings out its related complexity in the process of its extension of a historical heritage site to a museum holding artefacts that need to be preserved under different environments when open to the public.
- In the second part, as a dedicated and linked research area, an appropriate Genetic Algorithms (GAs)-based method [18,19,20,21,22,23,24,25,26] is studied and applied for the optimization of the design of the wired network of the integrated system, the electrical power network, and the air conditioning network. The work of the second part illustrates its capability to guarantee a decrease in the realization costs, subject to meeting the extreme constraints in the conservation of such historical buildings.
In the context of this work, the following references are made:
- “People” refers to security and safety personnel, control personnel, maintenance personnel, visitors, etc.
- “Devices” refers to actuators, sensors, mobile terminals, wearable devices, etc.
- “Operators” refers to the operator personnel of the control room, security personnel, safety personnel, maintenance personnel, police, fire brigades, civil protection, etc.
- Security, safety, and emergency, in loose terms, are referred to as the “security” of people and physical/non-physical resources.
- Risk of security/safety/control, in loose terms, is referred to as “risk”.
- Firewall, intrusion and anti-virus tools, in loose terms, are referred to as “cyber-security tools”.
The rest of the paper is organized as follows: in Section 2, the Fellini Museum of Rimini, in Italy, is illustrated; in Section 3, the integrated system and installations of the museum is illustrated; in Section 4, the genetic algorithm-based optimization/design technique for integrated systems and installations is illustrated; Section 5 provides the analysis of the results of the GAs-based algorithm proposed; Section 6 provides a discussion.
2. The Fellini Museum of Rimini in Italy
The Fellini Museum is an exhibition hall dedicated to the Rimini film director Federico Fellini, included by the Ministry of Culture of Italy among the great national cultural projects [27]. In December 2016, the Ministry of Cultural Heritage of Italy allocated a budget for the creation of the museum, which is part of the “Great Projects of Cultural Heritage 2017–2018” project. The museum was inaugurated on 19 August 2021, and it is the first worldwide exhibition hall dedicated to the famous film director who won five Academy Awards (four for Best Foreign Language Film and one in recognition of his place as one of the screen’s master storytellers), was nominated 12 times for Academy Awards, and won the greatest number of Academy Awards for Best Foreign Language Film in history [28,29,30,31,32,33,34,35,36,37].
The museum is physically widespread and divided into three separate places in the historic center of Rimini: (i) Sismondo Castle, built at the behest of Sigismondo Pandolfo Malatesta, at the time Lord of Rimini and Fano, starting from 1437 A.D and designed by Filippo Brunelleschi, (ii) Fulgor Palace, also called Valloni Palace, an eighteenth-century building that hosts on the ground floor the mythical cinema immortalized in Fellini’s film Amarcord, and (iii) Malatesta square. Both the Sismondo Castle and the Fulgor Palace have been redesigned with immersive multimedia facilities to provide an enhanced and highly interactive visitors’ experience.
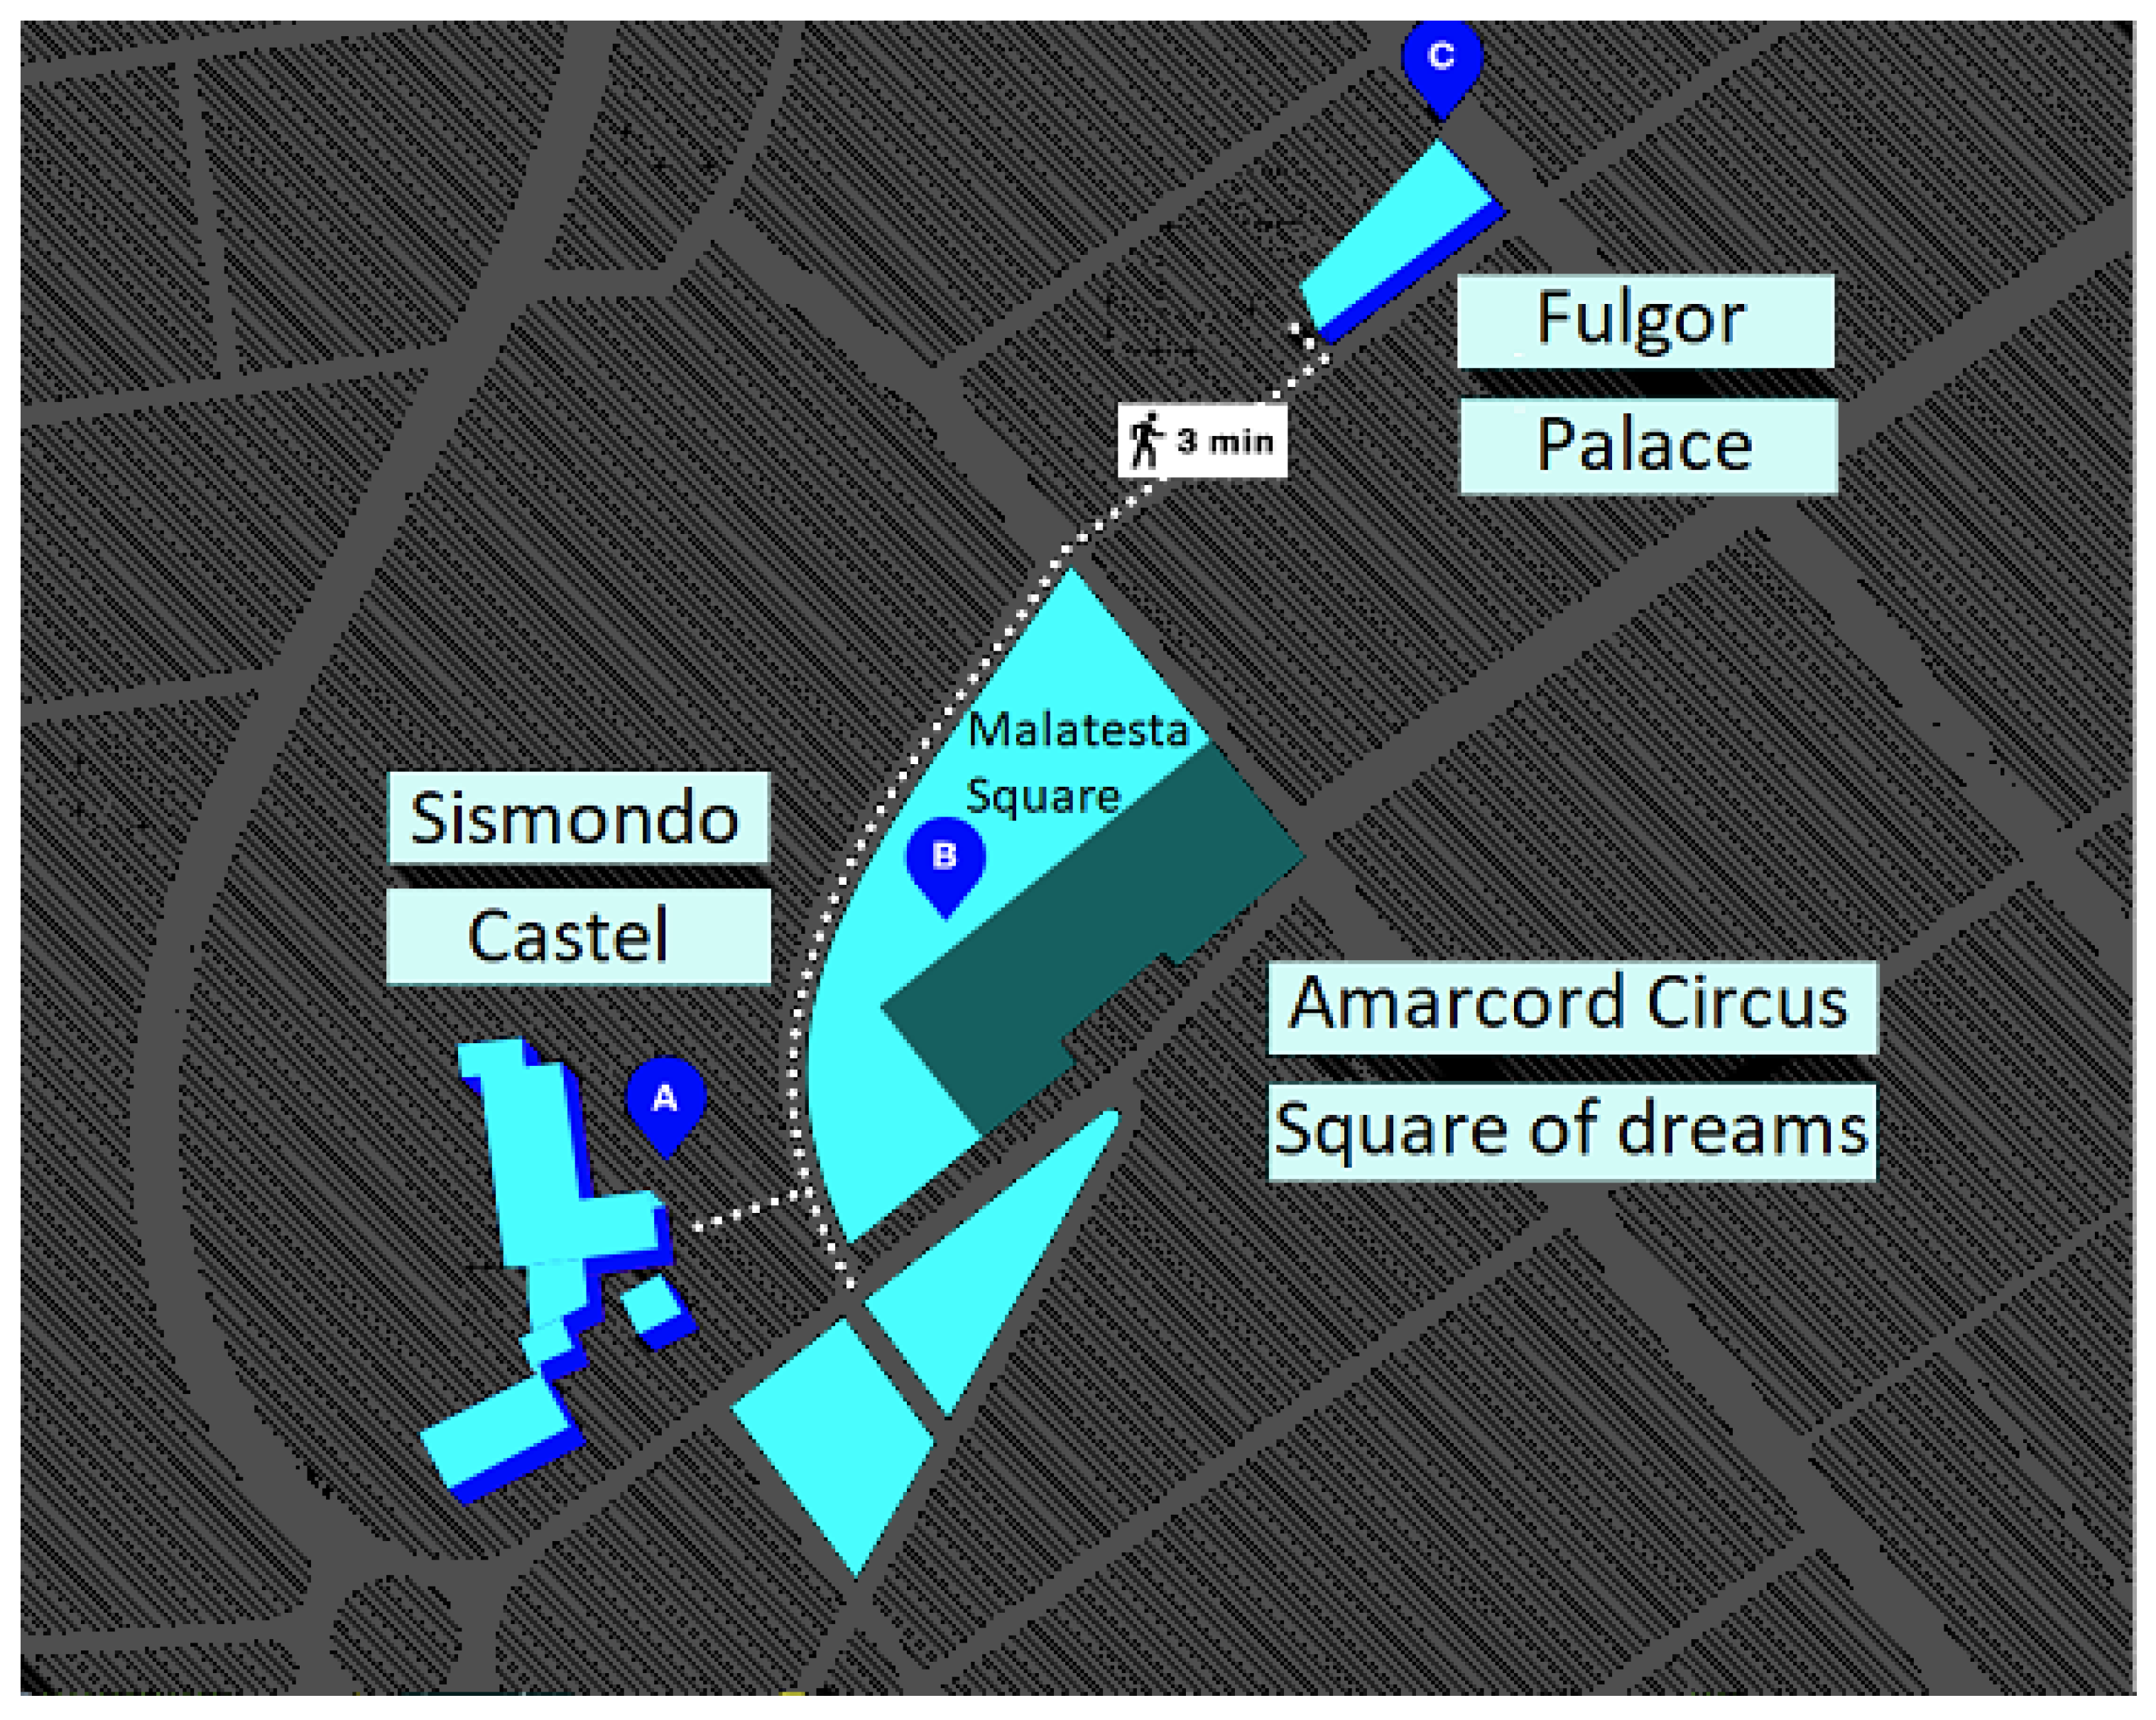
As shown in Figure 1, the museum path is laid out to start from Sismondo Castle along a path that includes the projection of rare films and the display of scenographic objects from Federico Fellini’s films.
One room is dedicated to a diary in which the director wrote down his dreams, giving them shape and color. Another room of swings is dedicated to history, the thousand faces of Fellini’s wife Giulietta Masina, considered one of the best Italian actresses of her generation. She left an indelible mark on the history of Italian cinema, above all thanks to her great interpretations in Fellini’s films.
At Fulgor Palace, there are screenings in a continuous cycle taken from his films, and also a documentation center, an archive, a study and consultation space, as well as a bookshop.
The Malatesta square is set up for a lighting display that provides a visual treat for visitors whilst at the same time, the lighting is designed carefully to prevent damage to the artefacts. In addition, there is a fountain that recreates the fog effect of the film Amarcord. It surrounds Sismondo Castle, and the whole complex has been renamed “the square of dreams”. It is a wide urban area, with green portions, arenas for exhibits, installations, and a vast expanse of water with powerful nebulizers, completed by the ancient moat of the castle with a large circular bench. This articulated scenario, as in the finale of Fellini’s film 8½, is meant to be a hymn to life, to solidarity, to the desire to be together.
Thus, we can see that each room caters to provide facilities so that a visitor can build their own visit in an immersive manner from a multitude of choice. For example, Fellini’s themed rooms have specific themes such as circus, dream environments, and the like, from which visitors can build their own visit depending on their interests. Similarly, they can choose the continuous films in Fulgor Palace.
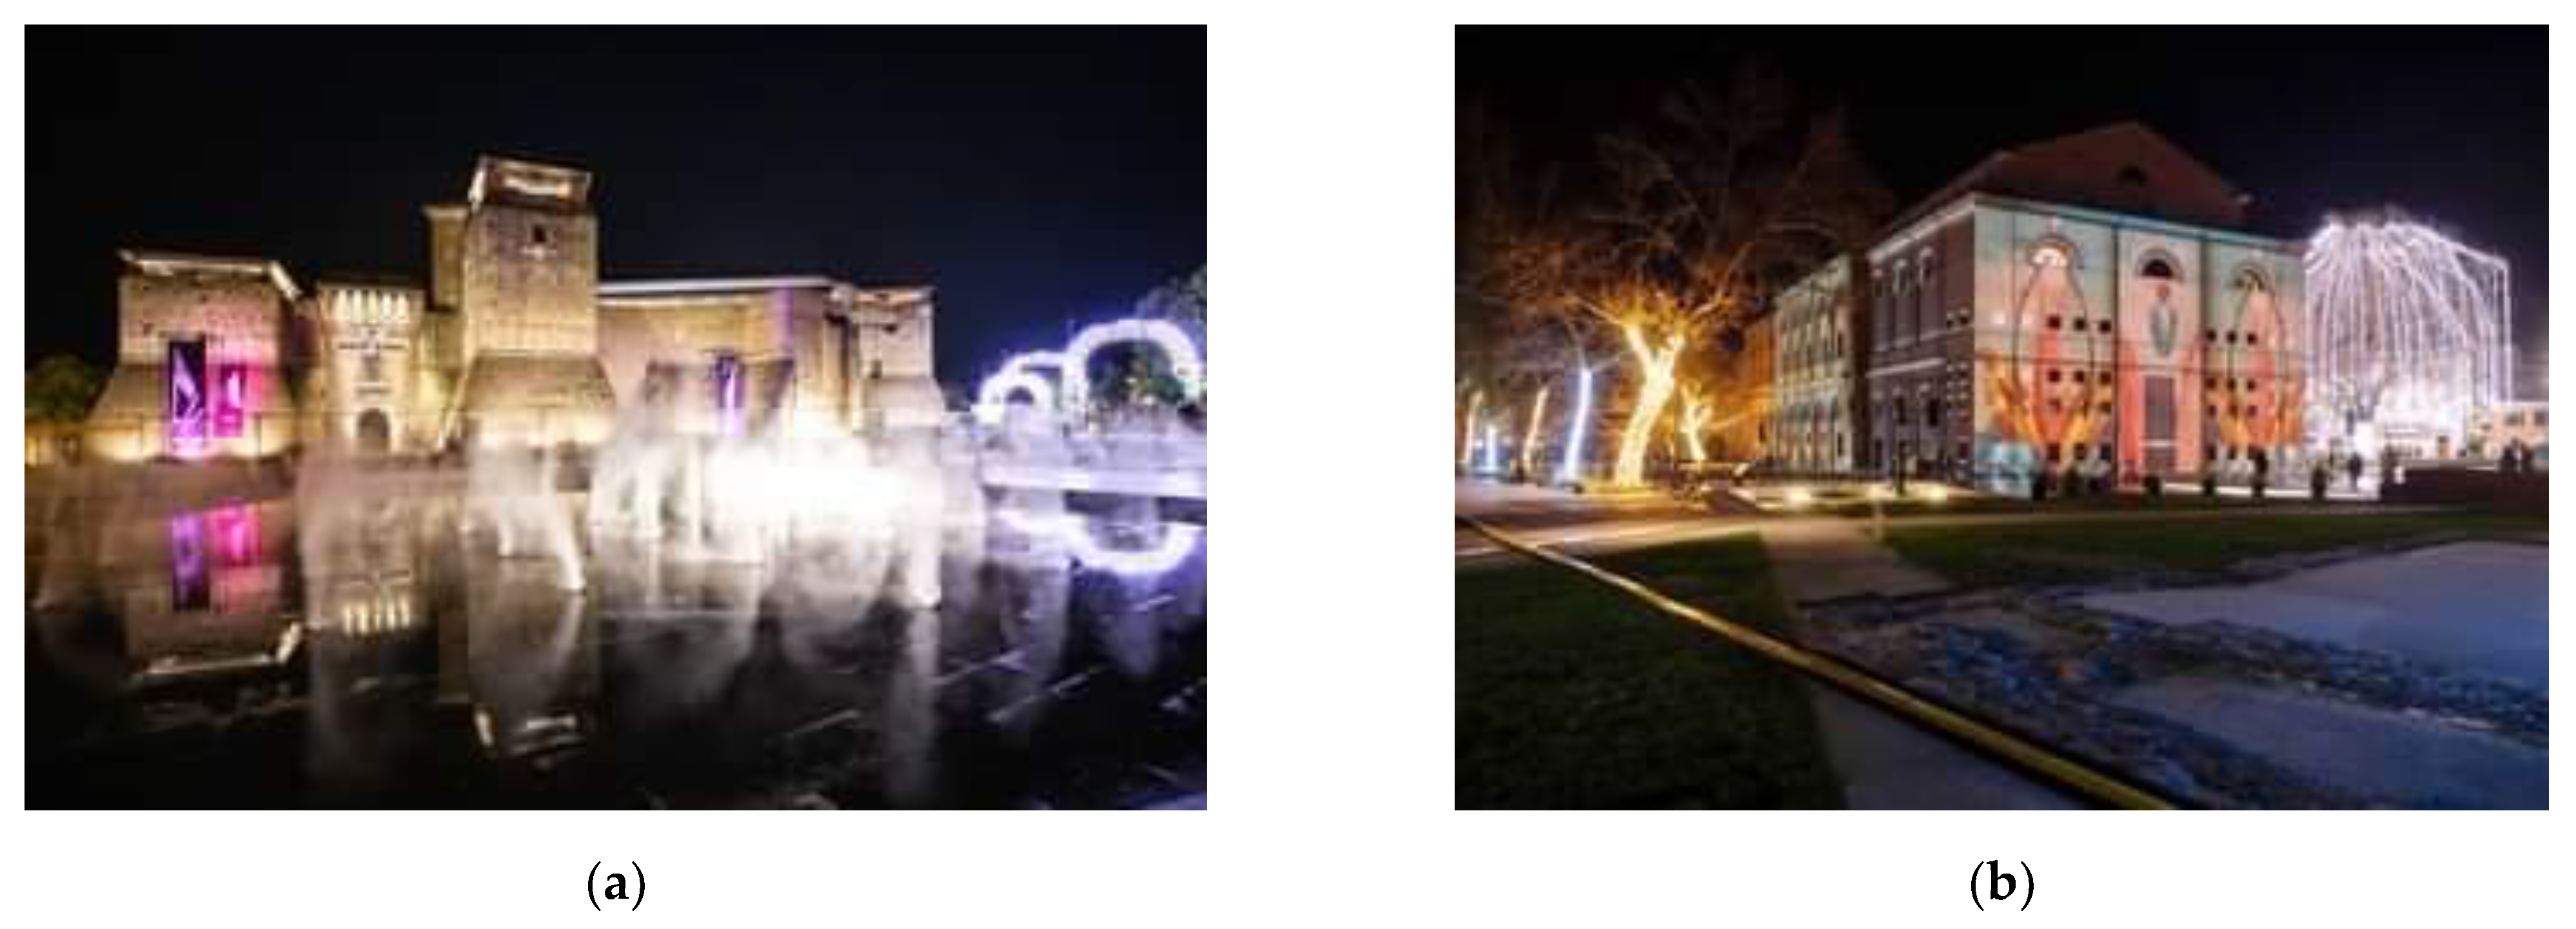
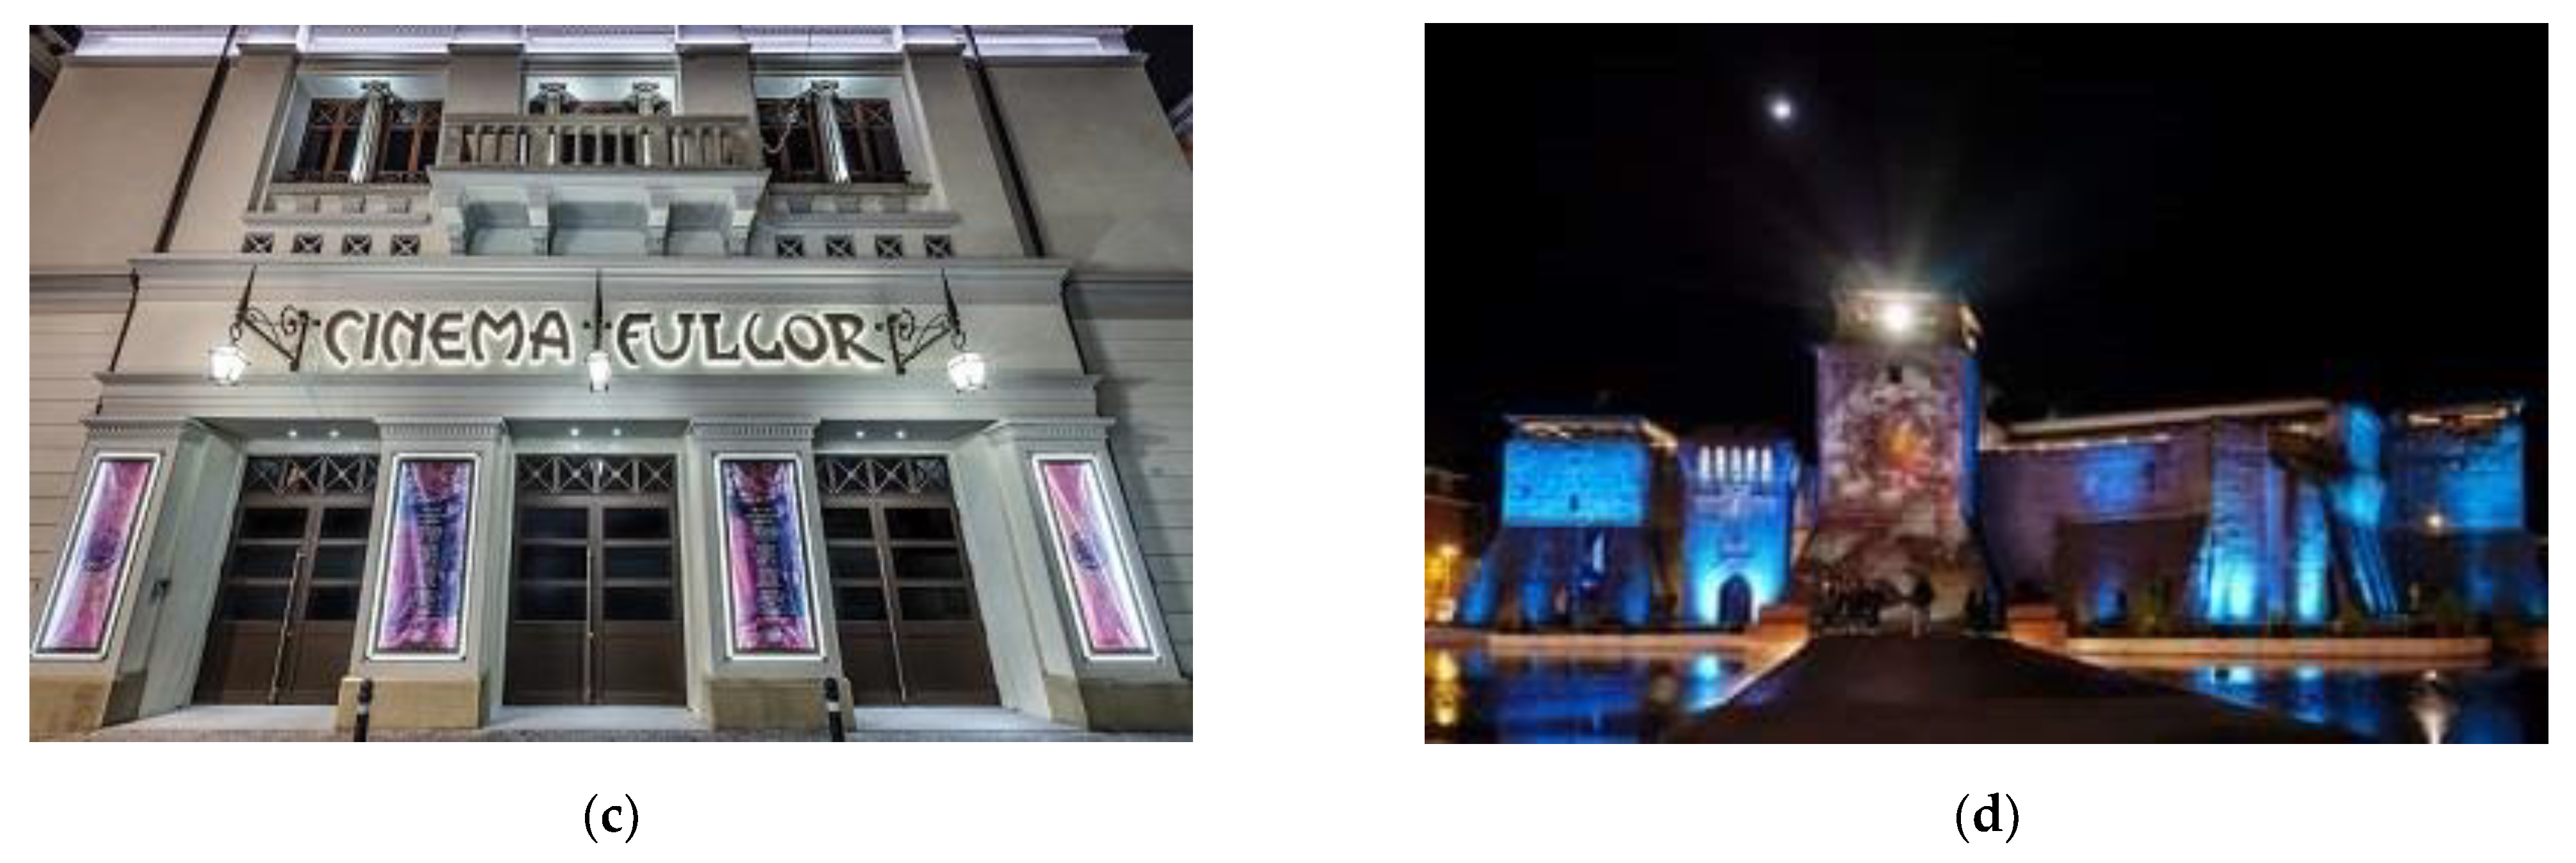
All the spaces of the museum have to be considered as a unique environment where, to go from Sismondo Castle to Fulgor Palace, it is necessary to walk through Malatesta square. Some pictures of the museum are shown in Figure 2 and Figure 3.
The Fellini Museum is a vibrant festival of the greatest legacy he left: the belief that “everything is imagined”, able to restore anything that cinema has wished to be since its beginning and that Fellini’s films communicate completely: wonder, imagination, live exhibits, delight. It is a museum capable of interpreting the Rimini director’s cinema not as a production finalized in itself, but as a fundamental element for combining tradition with contemporaneity [27].
3. Description of Integrated System and Installations
The integrated system is aimed at supporting security, safety, and all of the functionalities necessary to the management of the museum [1,2,3,4,5,6,7,8,9,10,11,12,13,14,15,16,17]. This section considers the design process in realizing a fully integrated system characterized by flexibility, scalability, and modularity, so that it is possible to adapt it to the typical needs of museums.
In [39,40], we considered a multidisciplinary model for security and safety management (IMMSSM) for the considered museum that includes:
- Impact assessment to assess the impact of the individuated hazards.
- Risks reduction. Risks reduction can be executed by means of essential Operative Tools (OTs), embodied by:
- Residue risks management. Residual risk management can be executed by means of important tools, supported by OTs embodied by: emergency management, service and business continuity, and disaster recovery.
The IMMSSM system is used as a use-case that eventually is designed towards a Smart Museum (IoT/IoE-SM). The design approach considers the inclusion of IoT/IoE technologies not only within the museum sections but is also extended to the surrounding open areas.
For confidentiality reasons, only a generic set of security measures are considered in this work. Some of the objectives of the integrated system are as follows:
- Guarantee the highest degree of security and safety to people and physical and nonphysical assets.
- Guarantee minimal energy consumption.
- Guarantee maximum easiness of operation by means of local and remote automation systems.
- Reduce the maintenance expenses.
- Guarantee the highest degree of reliability, flexibility, and resilience.
- Guarantee the highest degree of modularity and expandability, together with IoT/IoE facilities.
To meet the above objectives, the following devices and installations were required and implemented:
- A Building Management System (BMS) which utilizes two detached wired networks and Wi-Fi networks to provide a separation between the security, safety, and control services of the infrastructure versus the visitors’ services. It also provides a separation between the physical and logical devices that ensures the security of the telecommunications [54].
- Structured cabling.
- Intrusion detection installation.
- Access control installation.
- Video surveillance installation.
- Fire detection installation.
- Electrical installation.
- Lighting installation.
- Air conditioning installation.
- Public address installation.
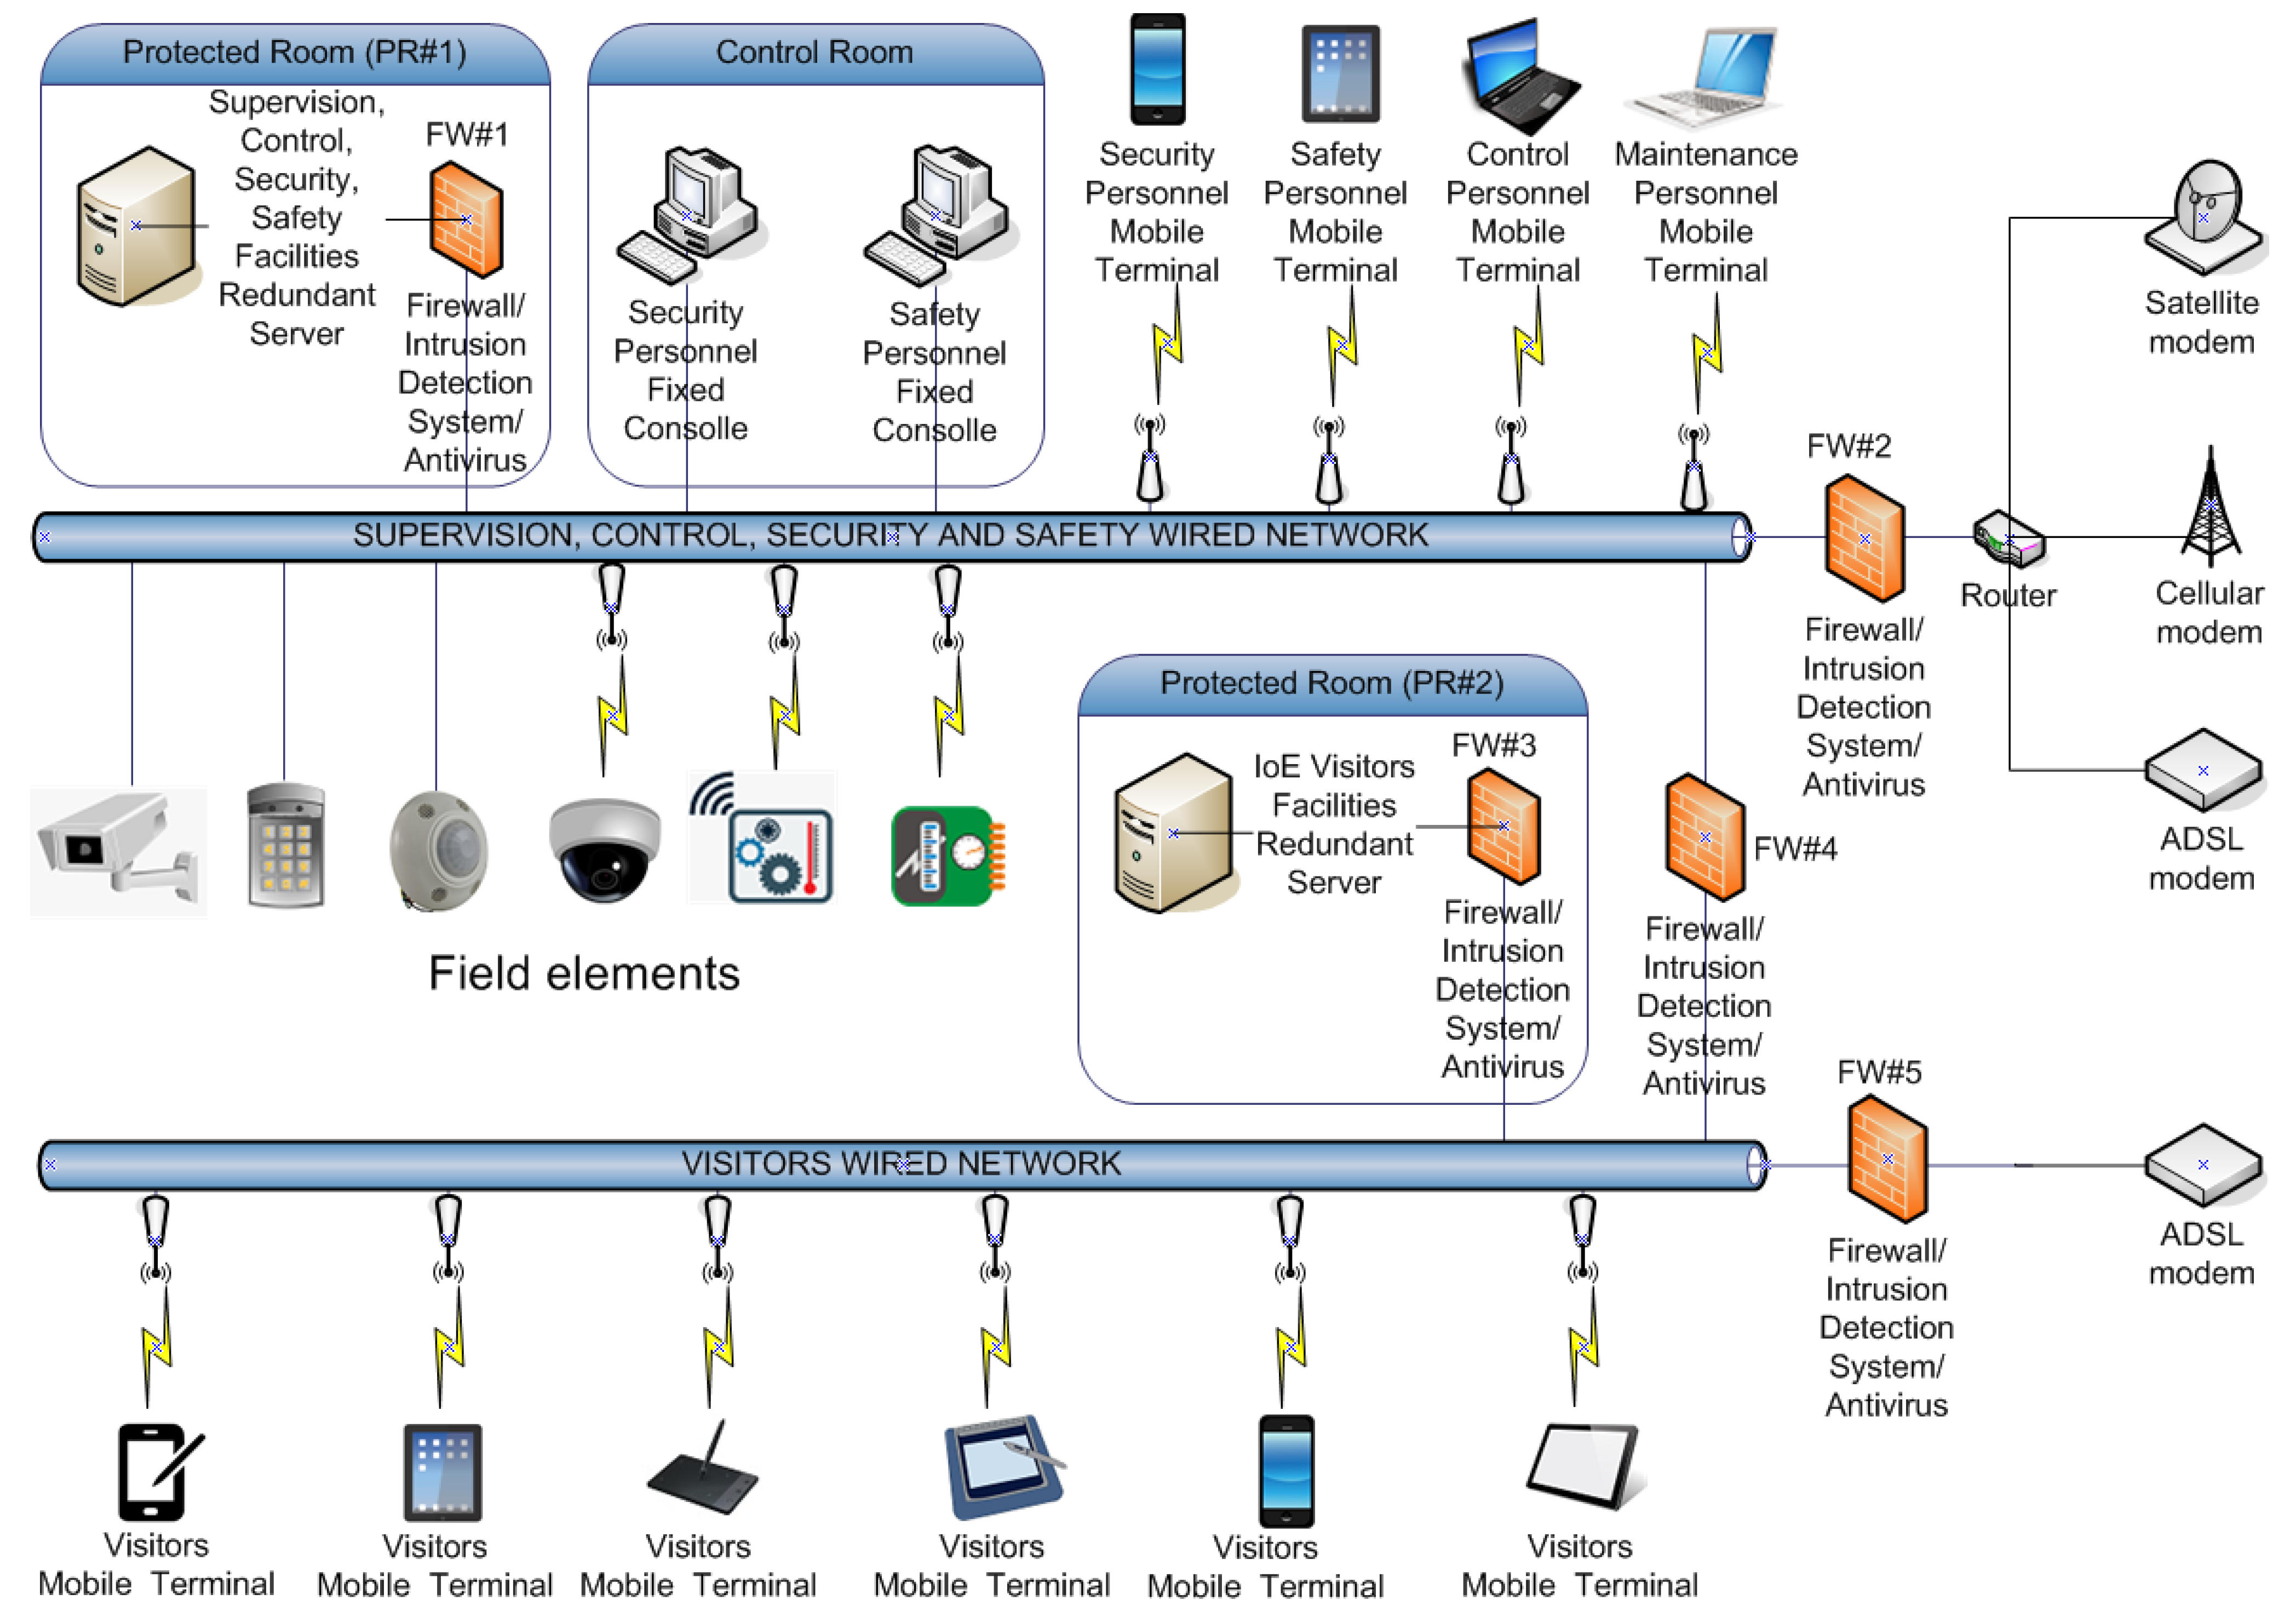
With reference to Figure 4, the system that supports the IMMSSM is divided into the following physical segments for operational purpose. First of all, it is divided by two separate backbone networks: namely, one for the purpose of administration and the other for the purpose of visitors. The network configurations are as follows:
(a) Protected Room Network
- A Protected Room (PR#1) comprising a server for supervision, control, security, safety, and also serving as a redundant server.
- A Control Room comprising a set of fixed consoles used by security personnel.
- A set of mobile terminals used by security and maintenance personnel from different mobile devices including mobile phones, tabs, and desktops.
- A set of devices for supervision, control, security, and safety named “field elements”.
- A firewall (FW#1) that protects communication between the server and the wired network.
- A set of communication networks including satellites, cellular, and modems are connected through a firewall (FW#2) to this administrative network.
(b) Visitor’s Network
To the visitors’ network, the following are connected:
- A Protected Room (PR#2) with a server which serves visitors’ facilities as well as acting as a redundant server for this segment. This server has a firewall protection system (FW#3) for any intrusion and virus detection.
- A set of visitors’ electronic gadgets including mobile phones, tabs, and desktops.
- A second firewall (FW#5) connects a modem and the network.
(c) Interconnection
Yet another firewall (FW#4) that connects the above two wired networks.
The system is characterized by a great level of modularity, which permits adding, whenever necessary, any device, installation, subsystem, etc., that need to be integrated in the IoT/IoE system. It is characterized by a general framework that merges all the best practices and technologies used up till now [1,2,3,4,5,6,7,8,9,10,11,12,13,14,15,16,17] to reach the desired objectives. The framework of the system is illustrated in Figure 4.
The system is created using a dual ring wired optical fiber backbone network to guarantee a physical and logical split between the integrated system facilities and visitors’ facilities. The distinct wired networks serve up the distinct access points that guarantee Wi-Fi facilities to security, safety, and control personnel and visitors, improving the security degree of the transmission and the defense of the system against cyber-attacks [54].
A multidisciplinary approach was utilized to design the integrated system, taking care also of the human factor and psychological aspects [55] of security and risk personnel and visitors [39,40]. These aspects are not illustrated due to the restricted space available.
The IoT/IoE based system, thanks to its framework utilizing wired and wireless networks, is capable of linking people, devices, data/information/knowledge and procedures, actual and futures, ensuring a high level of modularity and expandability, seeing them as “IoT/IoE objects” (IoT/IoE-Os). The system is capable of connecting with all the IoT/IoE-Os, indicating every hazardous or critical condition, immediately, by means of any sort of transmission way.
A suitable privacy-conforming app, created for the location, is set up by security personnel, which visitors can access on their mobile devices on arrival or prior to their arrival at the location. This app allows the use of all the facilities designed for different user profiles such as: ordinary/augmented reality information, security and safety information, positioning facilities valuable for emergency administration, VoIP facilities for normal, security and safety, and emergency telecommunication with the associated personnel, etc. It also allows the system to handle the mobile devices as part of the IoT/IoE-Os to achieve the exact and required set of objectives of the museums. Thanks to the app, it is possible to detect people utilizing both the GPS of mobile devices and the Wi-Fi positioning capacity of the system that runs well even at underground locations where the GPS signal is sheltered or inadequate. In this manner, it is possible to collect information related to location statistics typically used for visiting itineraries, permanency time, etc. It facilitates handling an emergency by communicating immediately with security personnel, if required, utilizing the text and VoIP functionalities of the app.
With the help of cyber-security tools, the integrated system is equipped with all the defenses required to block cyber-attacks, utilizing a firewall, the intrusion detection system, and anti-virus tools. The IoT/IoE redounded server is suitably sheltered while it handles all the IoT/IoE facilities. For protection motives [54], the IoT/IoE visitor facilities are hosted by a distinct redounded server linked, in a protected manner, to the IoT/IoE server. In this manner, the central IoT/IoE server does not permit visitor access, decreasing the chance of cyber-attacks against it. The primary server has access to the visitors’ server and the visitors’ networks in a protected manner through cyber-security tools.
The system is also equipped with a trustworthy and resilient remote telecommunication system utilizing satellite and cellular networks that can communicate under disastrous situations such as earthquake, flood, fire, etc.
3.1. The Building Management System
The BMS is intended as a distributed intelligence framework, administered by a main system hosted on a dedicated redounded server. The distributed intelligence framework is a fault-tolerant system which enables modules to operate in a fail-safe mode against a security attack. This is possible with suitable smart units such as sensors, field automation servers, I/O modules, gateways, and software/hardware interfaces that come together towards a resilient system without interruption.
The BMS is composed of an open platform that can be connected with any kind of IoT/IoE applications. Furthermore, the data from alarms, videos, actions, trimming, graphs, etc., can be read, edited, and handled depending on the operator profile based on their security credentials. It can be managed via fixed consoles positioned in the control room or via mobile devices connected via GUIs that can be customized by the operators. These options can be retrieved from any console or mobile device from a remote environment. The BMS can control every type of device and installation linked to its wired or wireless network and security and safety of people and physical/non-physical resources, as it is also capable of managing emergency conditions.
The main system, hosted as a dedicated server, is placed in a suitable sheltered area and it collects and stores all of the information related to the location. This configuration permits an easy and direct access by operators and monitors self-governing applications. Its modular structure allows adding newer such applications in the future. Using innovative functionalities, it can generate any report.
After an initial risk assessment related to the IMMSSM [39,40,41,42,43,44,45,46,47,48,49,50,51,52,53] was made, the design and implementation of a safe and reliable architecture was introduced into the system. This includes placement of sensors for intrusion detection, access control, and video surveillance. These modules were integrated to deliver an innovative, interconnected, and trustworthy system.
The Building Management System (BMS) was then extended as appropriate to meet the future needs of the museum, guaranteeing:
- the highest degree of security and safety to people and physical/non-physical resources.
- a simple and detailed management of the museum by personnel, with the provision of fixed consoles or mobile devices for their use.
- the complete operation of all the components, appliances, and systems.
- the optimal use and the decrease of energy expenditures.
- an optimal reduction of maintenance costs.
- the highest degree of trustworthiness, resistance, and flexibility.
3.2. The Intrusion Detection, Access Control and Video Surveillance Systems
The Intrusion Detection System, the Access Control System, and the Video Surveillance System are aimed at guaranteeing the highest degree of security. They are extended to all internal and external parts of the museum that are exposed to the threats individuated and evaluated by means of the initial risk assessment.
3.3. The Electrical and Air Conditioning Installations
In addition to the data wired network, the two other main installations considered are the electrical installation and air conditioning installation. The electrical installation is composed of a series of switchboards, whose position is fixed due to the architectural restrictions, that powers the different devices, high efficiency lamps, plugs, etc.
The air conditioning installation is composed of a series of fan coils and main air ducts that ensures the correct temperature and relative humidity degree, guaranteeing comfort to visitors and cultural heritage preservation. It represents a vital installation due to the presence of several multimedia devices and projectors which produce a certain amount of heat that must be properly controlled to always guarantee the correct temperature.
Care was given to soundproofing all over the museum, due to the presence of multimedia devices and related loudspeakers. It is therefore necessary to limit sound emission only where it is exactly necessary, allowing visitors to enjoy the sound experience where needed and avoid any undesired noise pollution.
4. The Genetic Algorithm-Based Optimization/Design Technique for Integrated Systems and Installations
GAs have been used for the optimization of a wired data network [16,56,57,58,59], wireless communication [60,61,62,63], IoT applications [64,65,66,67], electronics circuit [68,69,70], power electronics [71,72], general power distribution [73,74,75,76,77], air conditioning [78,79,80,81], but not specifically for optimizing the design of a wired network, electrical power network, and air conditioning network as a multiple-objectives function of a GA, which represents the scope of the second part of the present paper.
Other possible optimization techniques useful for the considered problem include Particle Swarm (PS) [82,83], Simulated Annealing (SA) [84,85], Tabu Search (TS) [86,87], Ant Colony (AC) [88,89], etc., but they are not considered here as they do not represent the main scope of the present paper.
The use of technology and ITS needs a proper communication system that in some cases can also be wired, which could present an issue in an already existing historical building due to the architectonic and aesthetic restrictions and vincula. The same problem manifests in the design and the realization of other installations such as the electrical power and the air conditioning ones. For this reason, it is very important to find a way to optimize these networks and, since this represents a typical nonlinear and multigoal problem, GAs are found to be very useful when properly utilized.
GAs provide the great benefit of evolving their behavior to match with the behavior of the final users, using a mechanism that is very similar to the one used by nature. Different genetic algorithms can be utilized to reach the desired target, each characterized by specific features. GAs use the natural processes of evolution and genetic recombination. Thanks to their versatility, they can be utilized in various application fields.
GAs are particularly useful when the goal is to find an approximate global minimum in a high-dimension, multi-modal function domain, in a near-optimal manner. Unlike most optimization methods, they can easily handle discontinuous and non-differentiable functions.
Due to the above considerations, a suitable GA is designed and tested to plan an integrated system comprising the wired network, the electrical power network, and the air conditioning network, with the objectives of minimization of cost of installation.
At this point, some introductory reasonings are necessary to develop a broad methodology which can be effective in building the integrated system.
A significant factor to be studied in this type of problem is embodied by the number of network links, NL. Let ND be the number of devices to be linked. We would like to optimize NL to reduce, as much as possible, the total cost of links. The worst-case scenario will allow at most one device with one node, and the total expense of the links remains fixed as it is determined by the minimum number of devices, ND. A more optimal solution is given by NDNN and it implies that every device can be linked with all the other nodes if configured properly. Such a configuration leads to a minimum expense of the network links. It is therefore clear that to obtain a suitable and optimizable solution, ND ≤ NL ≤ NDNN.
Let us consider these aspects below:
(1) Positioning security devices and communication nodes. Given a specific location and having completed the risk assessment related to the IMMSSM [39,40,41,42,43,44,45,46,47,48,49,50,51,52,53], it is required to determine where to mount the security devices, including intrusion detection sensors, video cameras, Wi-Fi access points, etc. Similarly, it is required to locate where best to mount the communication nodes that consist of the wired network communicating with the associated devices.
(2) Positioning electrical power devices such as lamps, plugs, etc. Given a specific location and having evaluated the electrical energy requirements, it is required to determine where it is to be installed. Similarly, it is required to locate where best to mount the electrical power nodes (switchboards) that comprise the power network to supply the associated devices.
(3) Positioning air conditioning units. Given a specific site and having evaluated the heat needs in winter and the cooling needs in summer, it is required to determine where to install the fan coils. Similarly, it is required to locate where best to install the air conditioning nodes that distribute the thermal fluids which comprise the air conditioning fluids network to supply the related fan coils.
It is evident that each device is characterized by specific requirements such as bandwidth for security devices, power for electrical devices, and thermal power for fan coils. It is also evident that each node (communication, electrical power, thermal power) is characterized by a maximum supply capacity.
The GAs encode each parameter of the problem to be optimized into a proper sequence (where the alphabet used is generally binary) called a gene, and combine the different genes to constitute a chromosome. A proper set of chromosomes, called a population, undergoes the Darwinian processes of natural selection, mating and mutation, creating new generations, until it reaches the final optimal solution under the selective pressure of the desired fitness function.
Terminologies related to GAs are:
- Population—a subset of possible solutions
- Chromosomes—one of the solutions in the population
- Gene—an element in the chromosome
- Fitness Function—a function using a specific input to arrive at an improved output.
- Genetic operators—the best individuals mate to reproduce an offspring that is better than the parents. Genetic operators are used to change the genetic composition of the next generation.
GA steps involved in solving complex optimization problems include (Figure 5):
(1) Initialization—GAs start with an initial population encoded as random binary strings that consist of all the probable solutions of a given problem.
The encoding represents a mapping from the parameters space to the chromosomes space and it transforms the set of parameters, which is generally composed by real numbers, in a string characterized by a finite length (Figure 6). The parameters are encoded into genes of the chromosome that allows the GA to evolve independently of the parameters themselves and therefore, of the solution space.
Once the chromosomes are created, it is necessary to choose a number of them that composes the initial population. This number strongly influences the efficiency of the algorithm in finding the optimal solution: a great number provides a better sampling of the solution space but slows the convergence. The initial population can be chosen at random or it can be properly biased according to specific features of the considered problem.
(2) Fitness Evaluation—A fitness function establishes the fitness of all individuals in the population using a fitness score which indicates a probability of being chosen for reproduction.
Fitness function, or cost function, or objective function provides a measure of the goodness of a certain chromosome and therefore, the goodness of an individual within a population. Since the fitness function acts on the parameters themselves, it is necessary to decode the genes composing a given chromosome to evaluate the fitness function of a certain individual of the population.
(3) Reproduction—This stage involves creating a child population using variation operators to the parent population.
The reproduction takes place using a suitable selection strategy which utilizes the fitness function to choose a certain number of good candidates. The individuals are assigned a space of a roulette wheel that is proportional to their fitness: the higher the fitness, the larger the space assigned on the wheel and the higher the probability is to be selected at every wheel tournament. The tournament process is repeated until a reproduced population of N individuals is formed.
Two main operators include:
- Crossover—this operator swaps the genetic information of two randomly chosen parents to produce a child population of equal size to the parent.
The recombination process selects at random two individuals of the reproduced population, called parents, crossing them to generate two new individuals called children. The easiest technique is represented by the single-point crossover, where, if the crossover probability overcome a fixed threshold, a random location in the parent’s chromosome is selected and the portion of the chromosome preceding the selected point is copied from parent A to child A, and from parent B to child B, while the portion of chromosome of parent A following the random selected point is placed in the corresponding positions in child B, and vice versa for the remaining portion of the parent B chromosome.
If the crossover probability is below a fixed threshold, the whole chromosome of parent A is copied into child A, and the same happens for parent B and child B. The crossover is useful to rearrange genes to generate better combinations of them and therefore, more fitting individuals. The recombination process has been demonstrated to be very important and it has been found that it should be applied with a probability varying between 0.6 and 0.8 to obtain the best results [18,19,20,21,22,23,24,25,26].
- Mutation—this operator adds new genetic information to a child population to enhance diversification and avoid the common problem of local minima in optimization techniques. This is achieved by simply flipping some bits in the population.
The mutation is used to survey parts of the solution space that are not represented by the current population. If the mutation probability overcomes a fixed threshold, an element in the string composing the chromosome is chosen at random and it is changed from 1 to 0 or vice versa, depending on its initial value. To attain good results, it has been demonstrated that mutations must occur with a low probability varying between 0.01 and 0.1 [18,19,20,21,22,23,24,25,26].
(4) New Generation—A replacement of the old population by a new one with a higher fitness score ensuring an improved solution has been generated.
(5) Convergence Check—The termination of the process using a stopping criterion, typically when the fitness threshold has been reached. The corresponding solution forms the best solution in the population.
The converge check can use different criteria such as the absence of further improvements, the reaching of the desired goal, or the reaching of a fixed maximum number of generations.
Initially, the devices are placed on the plant. The aim now is to determine to which of the nodes the devices must be linked. The number of nodes that have to be utilized is related to the sum of the capacity of the nodes themselves. A good choice consists in selecting a number of nodes so that the sum of all their capacities is nearly 150% of the total requirements of the devices. The genetic algorithm will determine the distance between every device and node and the related cost of their connection.
Afterwards a decision is made on the localization of nodes followed by an estimate on the distance between every device and every node, and the related cost that depends on the kind of available connection path. The cost of each such connection can be listed as shown in Table 1 (named cost/link table or CLT) of dimension ND × NN where ND is the number of devices and NN is the number of nodes. There are some nodes to which certain devices cannot be connected due to the sensitivity of the locations of the cultural heritage site.
The information related to the requirements of the devices is stored in a proper array RD whose dimension is ND × 1 while the information related to the capacities of the nodes and the related costs is stored in a proper array CCN whose dimension is NN × 2.
The data structure for the GA consists of the following:
- The chromosome is composed of a number of genes which is identical to the number of devices ND. Every gene, associated with a precise link, is encoded as the number of source devices and the number of destination nodes of the links. The first parameter varies between 1 and the maximum number of devices ND while the second parameter varies between 1 and the maximum number of nodes NN.
The number of successfully used nodes is clearly smaller than the maximum number of nodes. The number of nodes depends on the sum of the requirements of devices RDtot = Σk,1 ND RDk to be connected and their number ND. If CNmin is the minimum node capacity between all the considered nodes (that can be the same for all of them, if they are characterized by the same features), the minimum number NNMIN of nodes necessary is therefore equal to Int ((RDTot/CNmin) + 1) where Int () is the integer operator, which is an operator that rounds the argument () to the nearest integer towards infinity.
Because of the design vincula imposed by an already existing heritage building, it is not achievable to get this number and it is necessary to contemplate a suitable multiplicative coefficient M so that the maximum number of nodes NN MAX is equal to M NN MIN. Good quality outcomes are achieved if M is variable between 1.5 and 2.
To permit the highest efficacy of the genetic process, the device/node links, represented as a pair of different numbers into the genes, are codified by means of a binary alphabet. If ND is the number of devices and NN is the number of nodes, the minimum number of bits required to encode them is Int (log2 (ND) + 1) and Int (log2 (NN) + 1), respectively.
In Table 2, the encoding of the genes and the associated chromosome is indicated.
Every chromosome, or individual I, indicating a possible solution of the problem, is comprised of a binary string which represents the ND links of the devices with the NN nodes. The overall length of each chromosome, or individual I of the population, is equivalent to ND * (Int (log2 (ND) + 1) + Int (log2 (NN) + 1)) bits.
At this point, it is needed to do some introductory reasonings to develop a broad methodology which can be effective and valuable in every kind of situation.
The general fitness function fG(I) (where I represents the general individual or chromosome of the population) for this type of problem is embodied by the totality of the costs of the various links and nodes which constitute the desired network:
where
fG(I) = argmin (α Σk,1 ND CLk + β Σk,1 NN CNk Ak)
CLk—the cost of network paths between nodes and devices, computed at the initial design stage,
CNk—cost of, at most, one device being connected to a node,
Ak—binary value depending on whether CNk exists or not.
α and β are two parameters that vary between 0 and 1, so that it is possible to give more importance to the first term (reduction of links cost) or to the second term (reduction of number of nodes and therefore, of the related total cost of the nodes) or to both of them if α and β are equal to 1.
The fitness function represented by Equation (1) can be computed only if the individual I represents an effective solution, which means that every device is linked to only one node and that the sum of the requirements of all the devices linked to each node does not exceed the maximum capacity of each related node. If this does not happen, it is forced to be equal to zero, as the individual I does not correspond to an effective solution for the considered problem.
To attain a normalized fitness function, it is required to compute the maximum expense Cmax of the network, represented by the sum of the most expensive links CLmax and the cost of all the nodes CNmax (that means the worst situation where all the nodes are used, since almost one device is connected to each of them), if it exists. The normalized fitness function f(I) can therefore be written as:
f(I) = argmin (α Σk,1 ND CLk/CLmax + β Σk,1 NN CNk/CNmax)
The fitness function represented by Equation (2) can be evaluated only if the individual I represents an acceptable solution, according to the criteria indicated previously. If not, it is equivalent to zero, as the individual I does not embody an effective solution for the considered problem.
The initial population is created randomly and, as it is illustrated in the following, the number of individuals of populations influences the number of generations needed to get the ultimate optimum solution and hence, the convergence time. Once the population is recombined and mutated, the fitness function of the population is computed with the fitness function expressed by Equation (2), considering only suitable individuals I of the population. The convergence assessment is done, calculating if the difference between the mean value of fitness functions of the acceptable individuals belonging to the actual generation and the mean values of the last NG generations is smaller than a definite percentage rate pstop that can be chosen.
5. Results
The proposed GAs-based technique has been trained on more than 400 real and random sites, to achieve widespread mean results valid for every kind of site. It was then applied to the considered test site to achieve an optimal design of an integrated data network, electrical installation, and air conditioning installation. The GA produces a fast convergence, as described in the following paragraphs, and attained convergence assessment parameters NG and pstop equal to 30 and 0.2, respectively. Because of the large volume of data attained and the number of outcomes that can be obtained from this large quantity of solution sets, only the most significant outcomes are discussed for brevity.
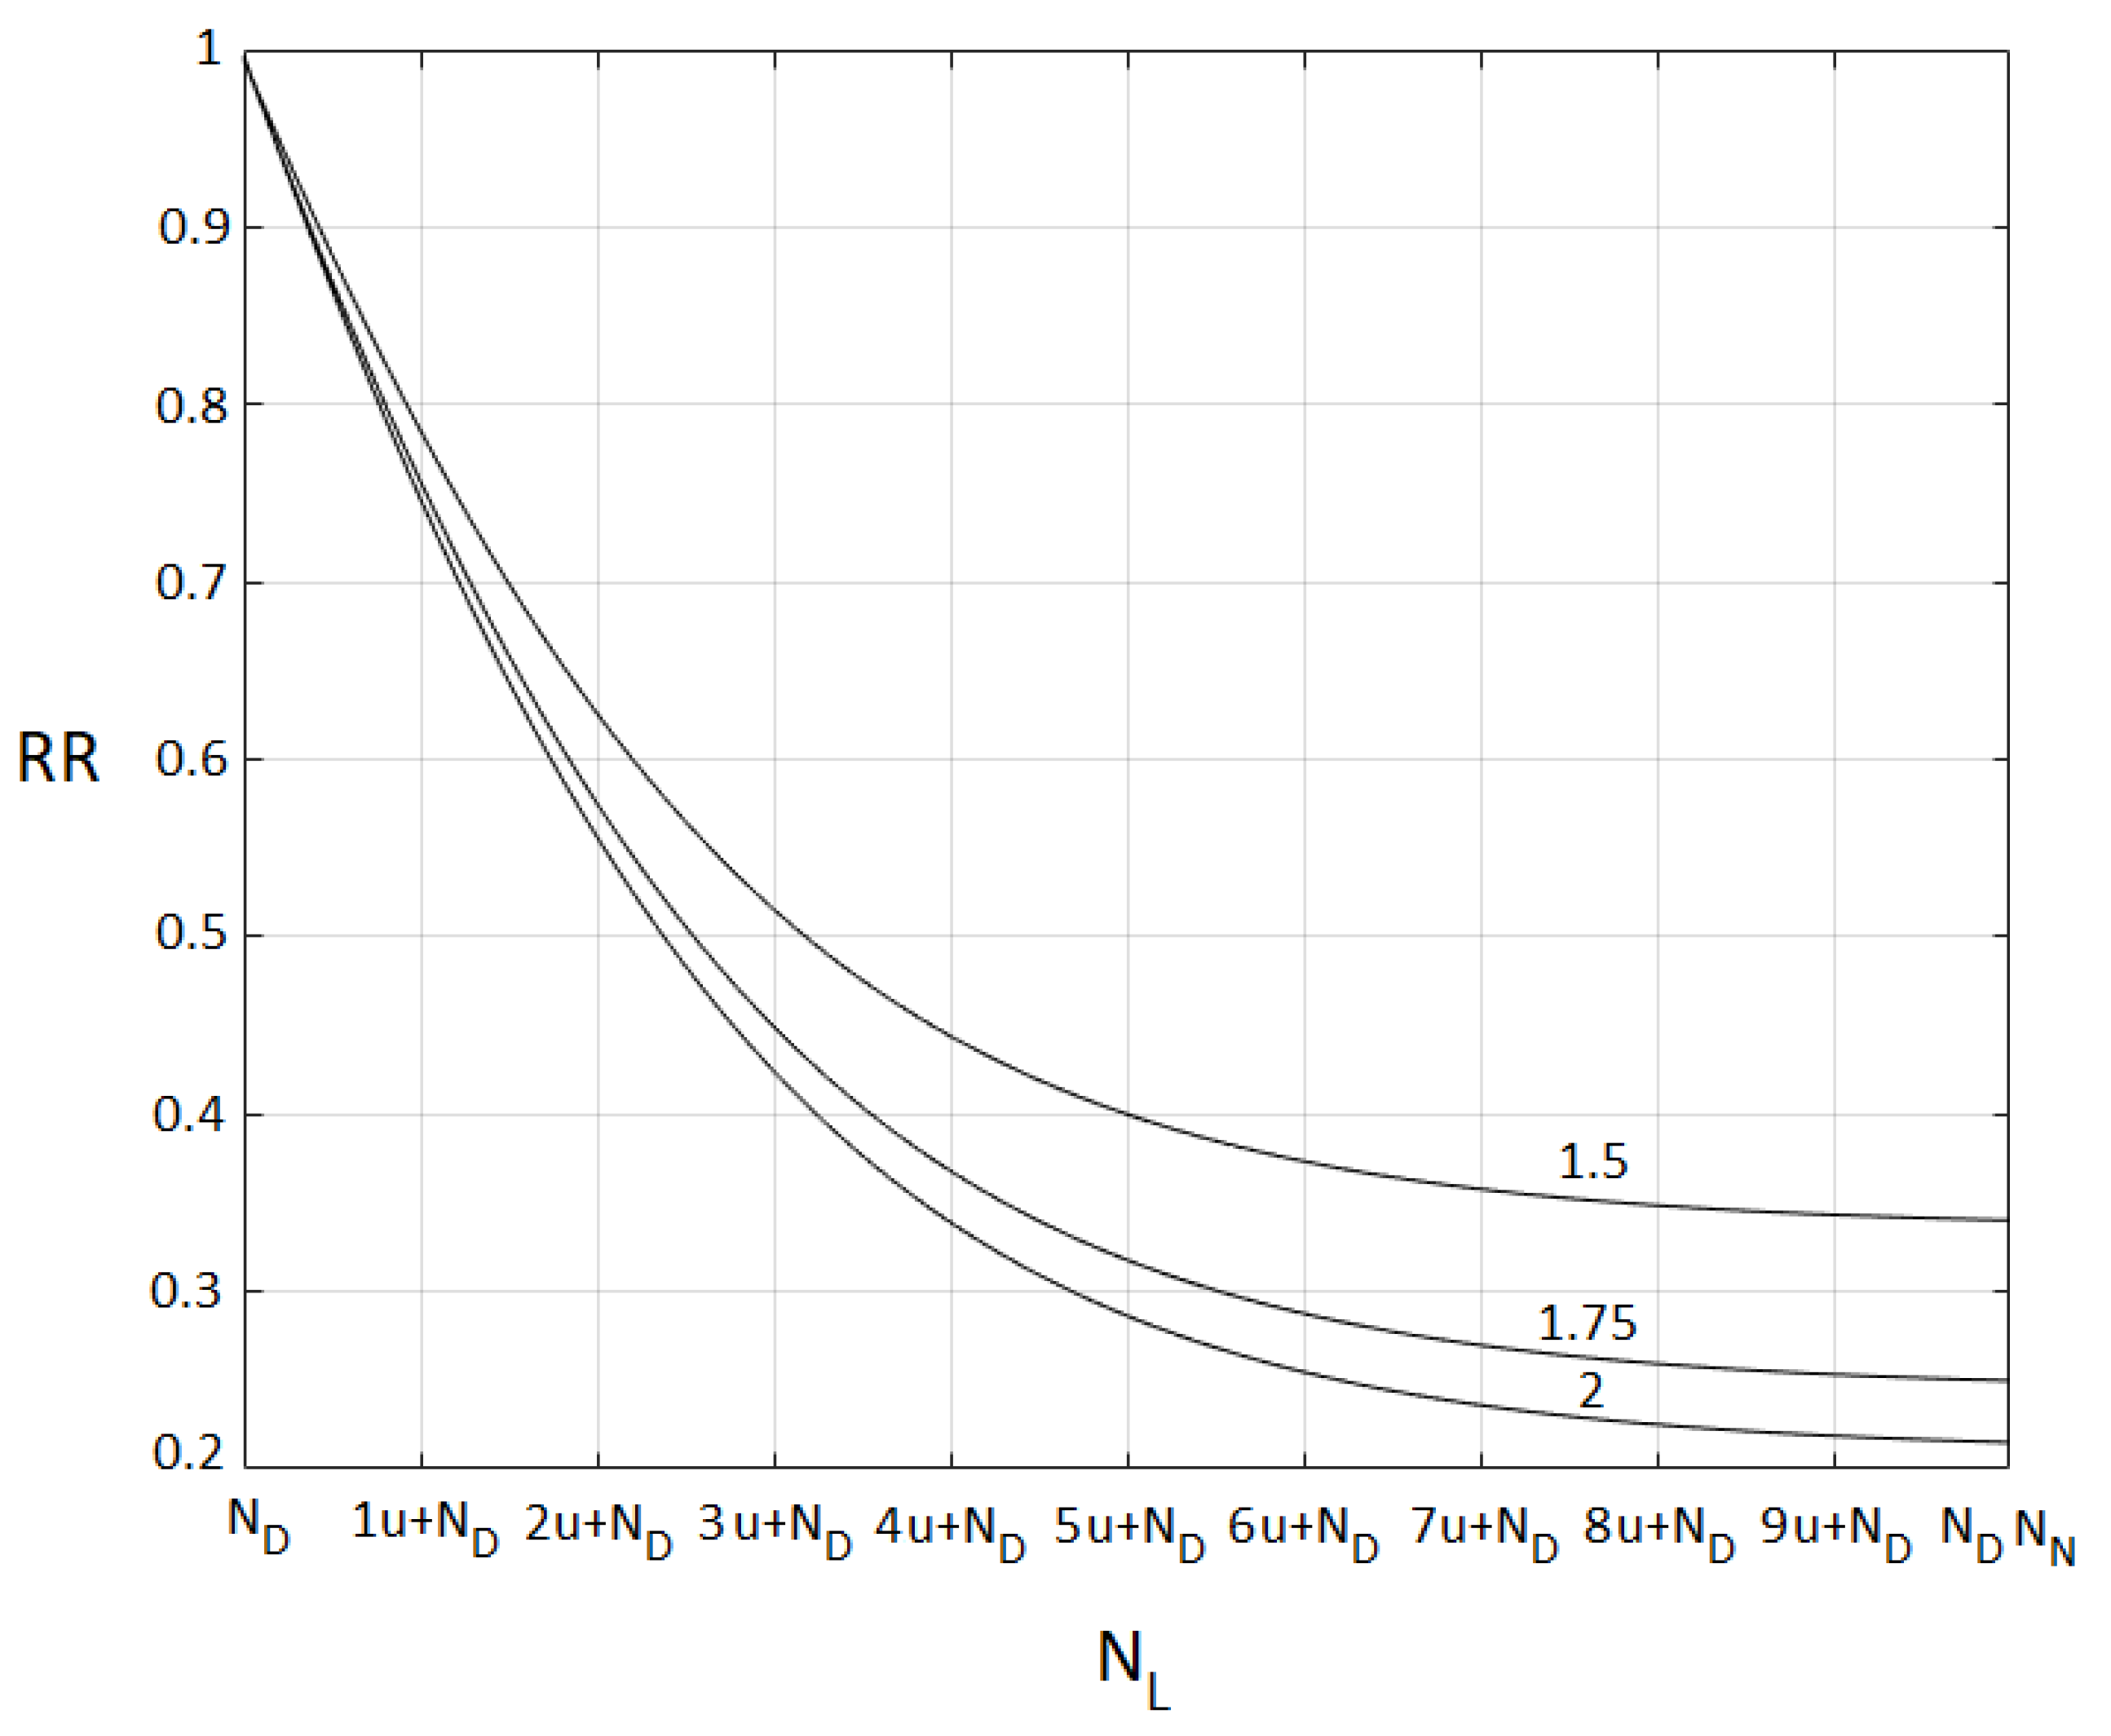
A significant parameter to be evaluated to obtain considerable data is embodied by Reduction Ratio (RR), stated by the ratio between the cost of the ultimate optimum solution Copt of the considered problem and the maximum cost of the network Cmax, which corresponds to the worst-case scenario. It is clear that RR is equal to 1 if the number of links NL is equal to ND which indicates that each device can be linked to only one different node (if the considered context allows it). In this case, the links are set, and the cost of the network cannot vary. RR can diminish if the number of links NL is greater than ND, achieving eventually a value equivalent to ND NN, which means that every device can be linked with all the nodes, and it is conceivable to adjust the links to achieve the minimum cost of the network. It is thus important to estimate RR as a function of NL when ND ≤ NL ≤ ND NN (splitting this range into 10 identical parts u equal to (ND NN − ND)/10), for different values of multiplicative coefficient M, related to NN MAX = M NN MIN, as shown in Figure 7.
From Figure 7, it is possible to see how the GAs-based technique is capable of achieving reductions in the cost with respect to the maximum expense of the network Cmax when NL rises, since the GA has more links available to achieve its optimization abilities.
Further, it is possible to see that the reduction of the costs depends on the value of the M coefficient: the greater this coefficient, the greater the cost reduction with respect to the maximum expense of the network Cmax. This shows that the GA has several optimal solutions from which we can choose any to reduce the network cost.
The number of generations required for the GA to achieve the final optimum solution embodies a significant parameter, together with the initial population, as it provides information related to the calculation commitment that, once correlated to the calculation resources used, offers the precise amount of time required to achieve the required optimal solution.
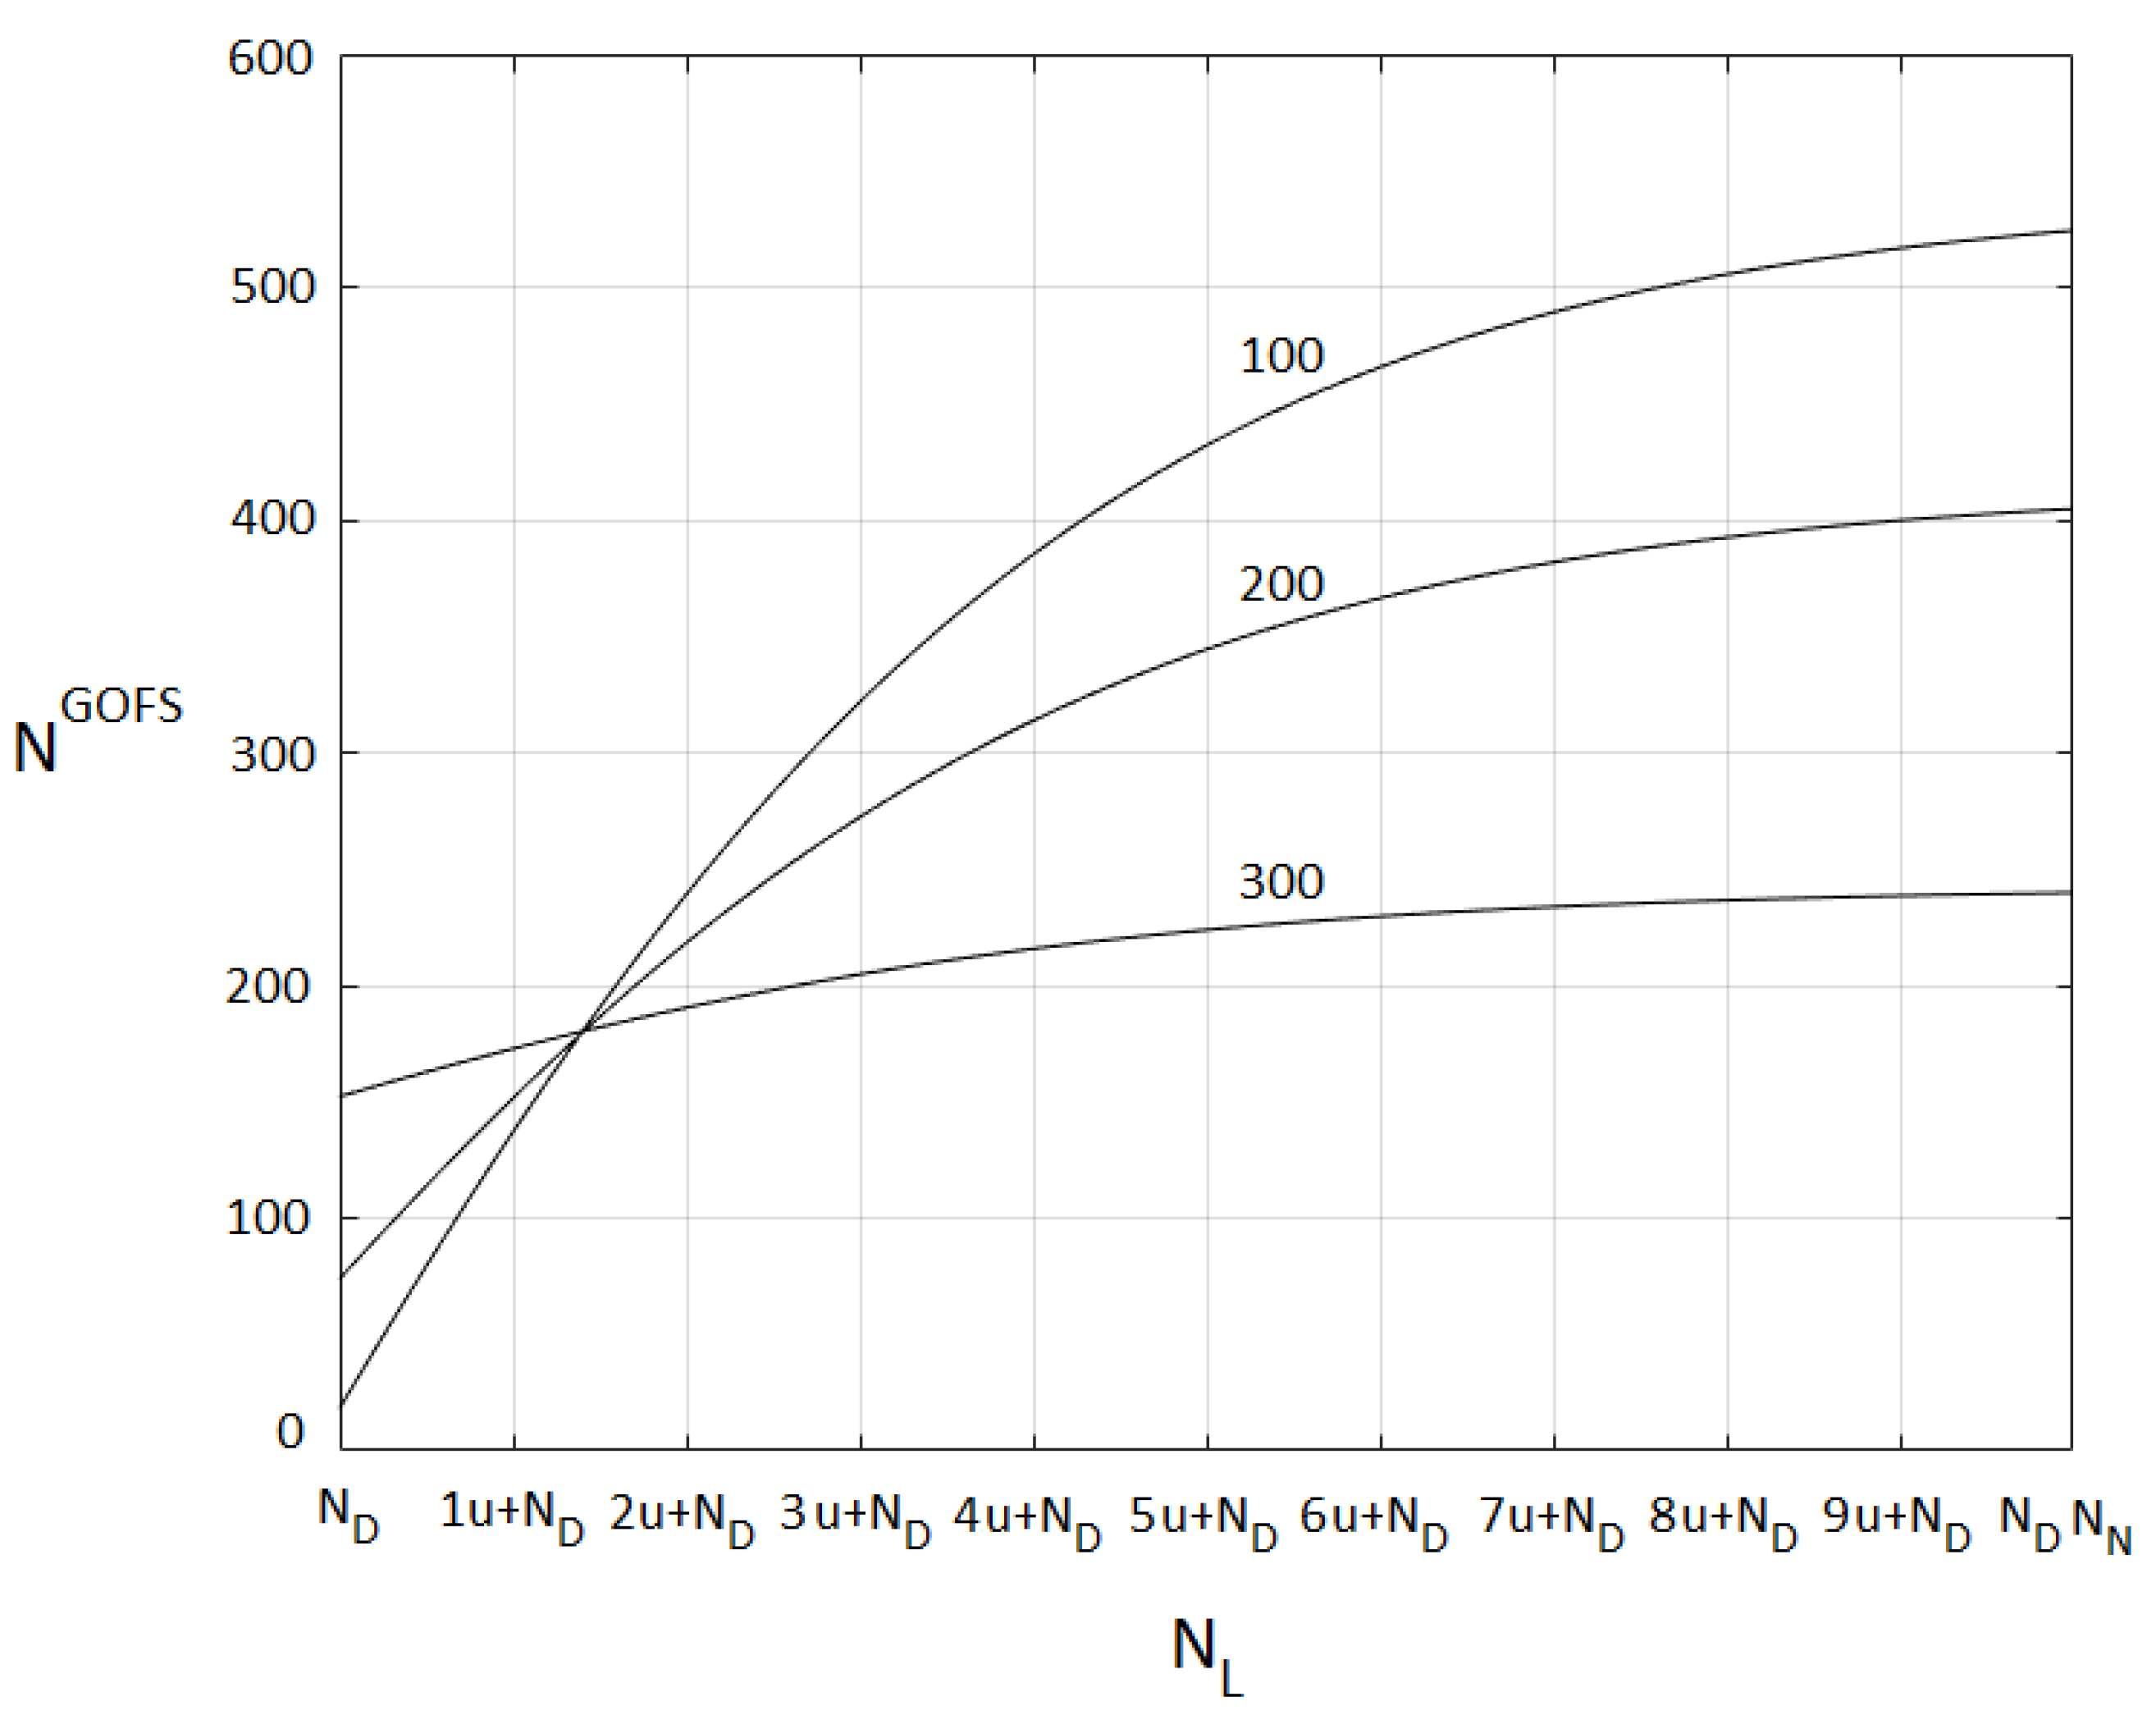
In Figure 8 the number of generations the GA needs to achieve the end optimum solution (NGOFS) as a function of number of existing links NL for various values of individuals I of starting population (where the multiplicative coefficient M, related to NN MAX = M NN MIN, is equal to 1.5) is shown.
From Figure 8, it is possible to see that, in all the considered situations, the values of (NGOFS) rises with the growth of the number of links NL. This rise begins from relatively small starting values but grows up, following diverse slopes, as a function of the number of individuals of the population (NIP).
The graphs begin from reduced values (≈25) for NIP equal to 100 and begin from greater values (≈160) for NIP equal to 300.
This performance can be justified according to the following reasoning:
- for smaller values of NL, the number of existing links, and which must be optimized to generate an optimized final network, is quite limited. This implies that the GA must run fewer generations and therefore, converge soon to achieve the final optimum solution, and thus:
- if NIP is equal to 300, it implies that the GA requires far more generations as it must handle a bigger number of individuals of population and thus, NGOFS is relatively high (≈160).
- if NIP is equal to 100, it implies that the GA must run fewer generations, as it can handle a smaller number of individuals of the population and thus, NGOFS is relatively low (≈25).
- for superior values of NL, the number of existing links, and which have to be improved to generate an optimized final network, is greater. This implies that the GA must run more to achieve the final optimum solution, and thus:
- if NIP is equal to 300, it implies that the GA must run fewer generations, as it must handle a greater number of individuals of the population, which offer a greater number of more performing solutions at every novel generation of the evolution development (letting one achieve the final optimum solution earlier) and consequently, NGOFS is quite small (≈240).
- If NIP is equal to 100, it implies that the GA must run generations, as it must handle a smaller number of individuals of the population, which offer a smaller number of more performing solutions at every novel generation of the evolution development (letting one achieve the final optimum solution later) and consequently, NGOFS is quite great (≈520).
The obtained results determine appropriate values of NIP as a function of the number of links NL (which is information available after the initial design job and therefore, existing before the beginning of the development of the GA). This acts as a warning signal about the calculation load in terms of the number of generations that, once correlated to the calculation means available, offers the precise amount of time required to scope the wanted final optimum solution.
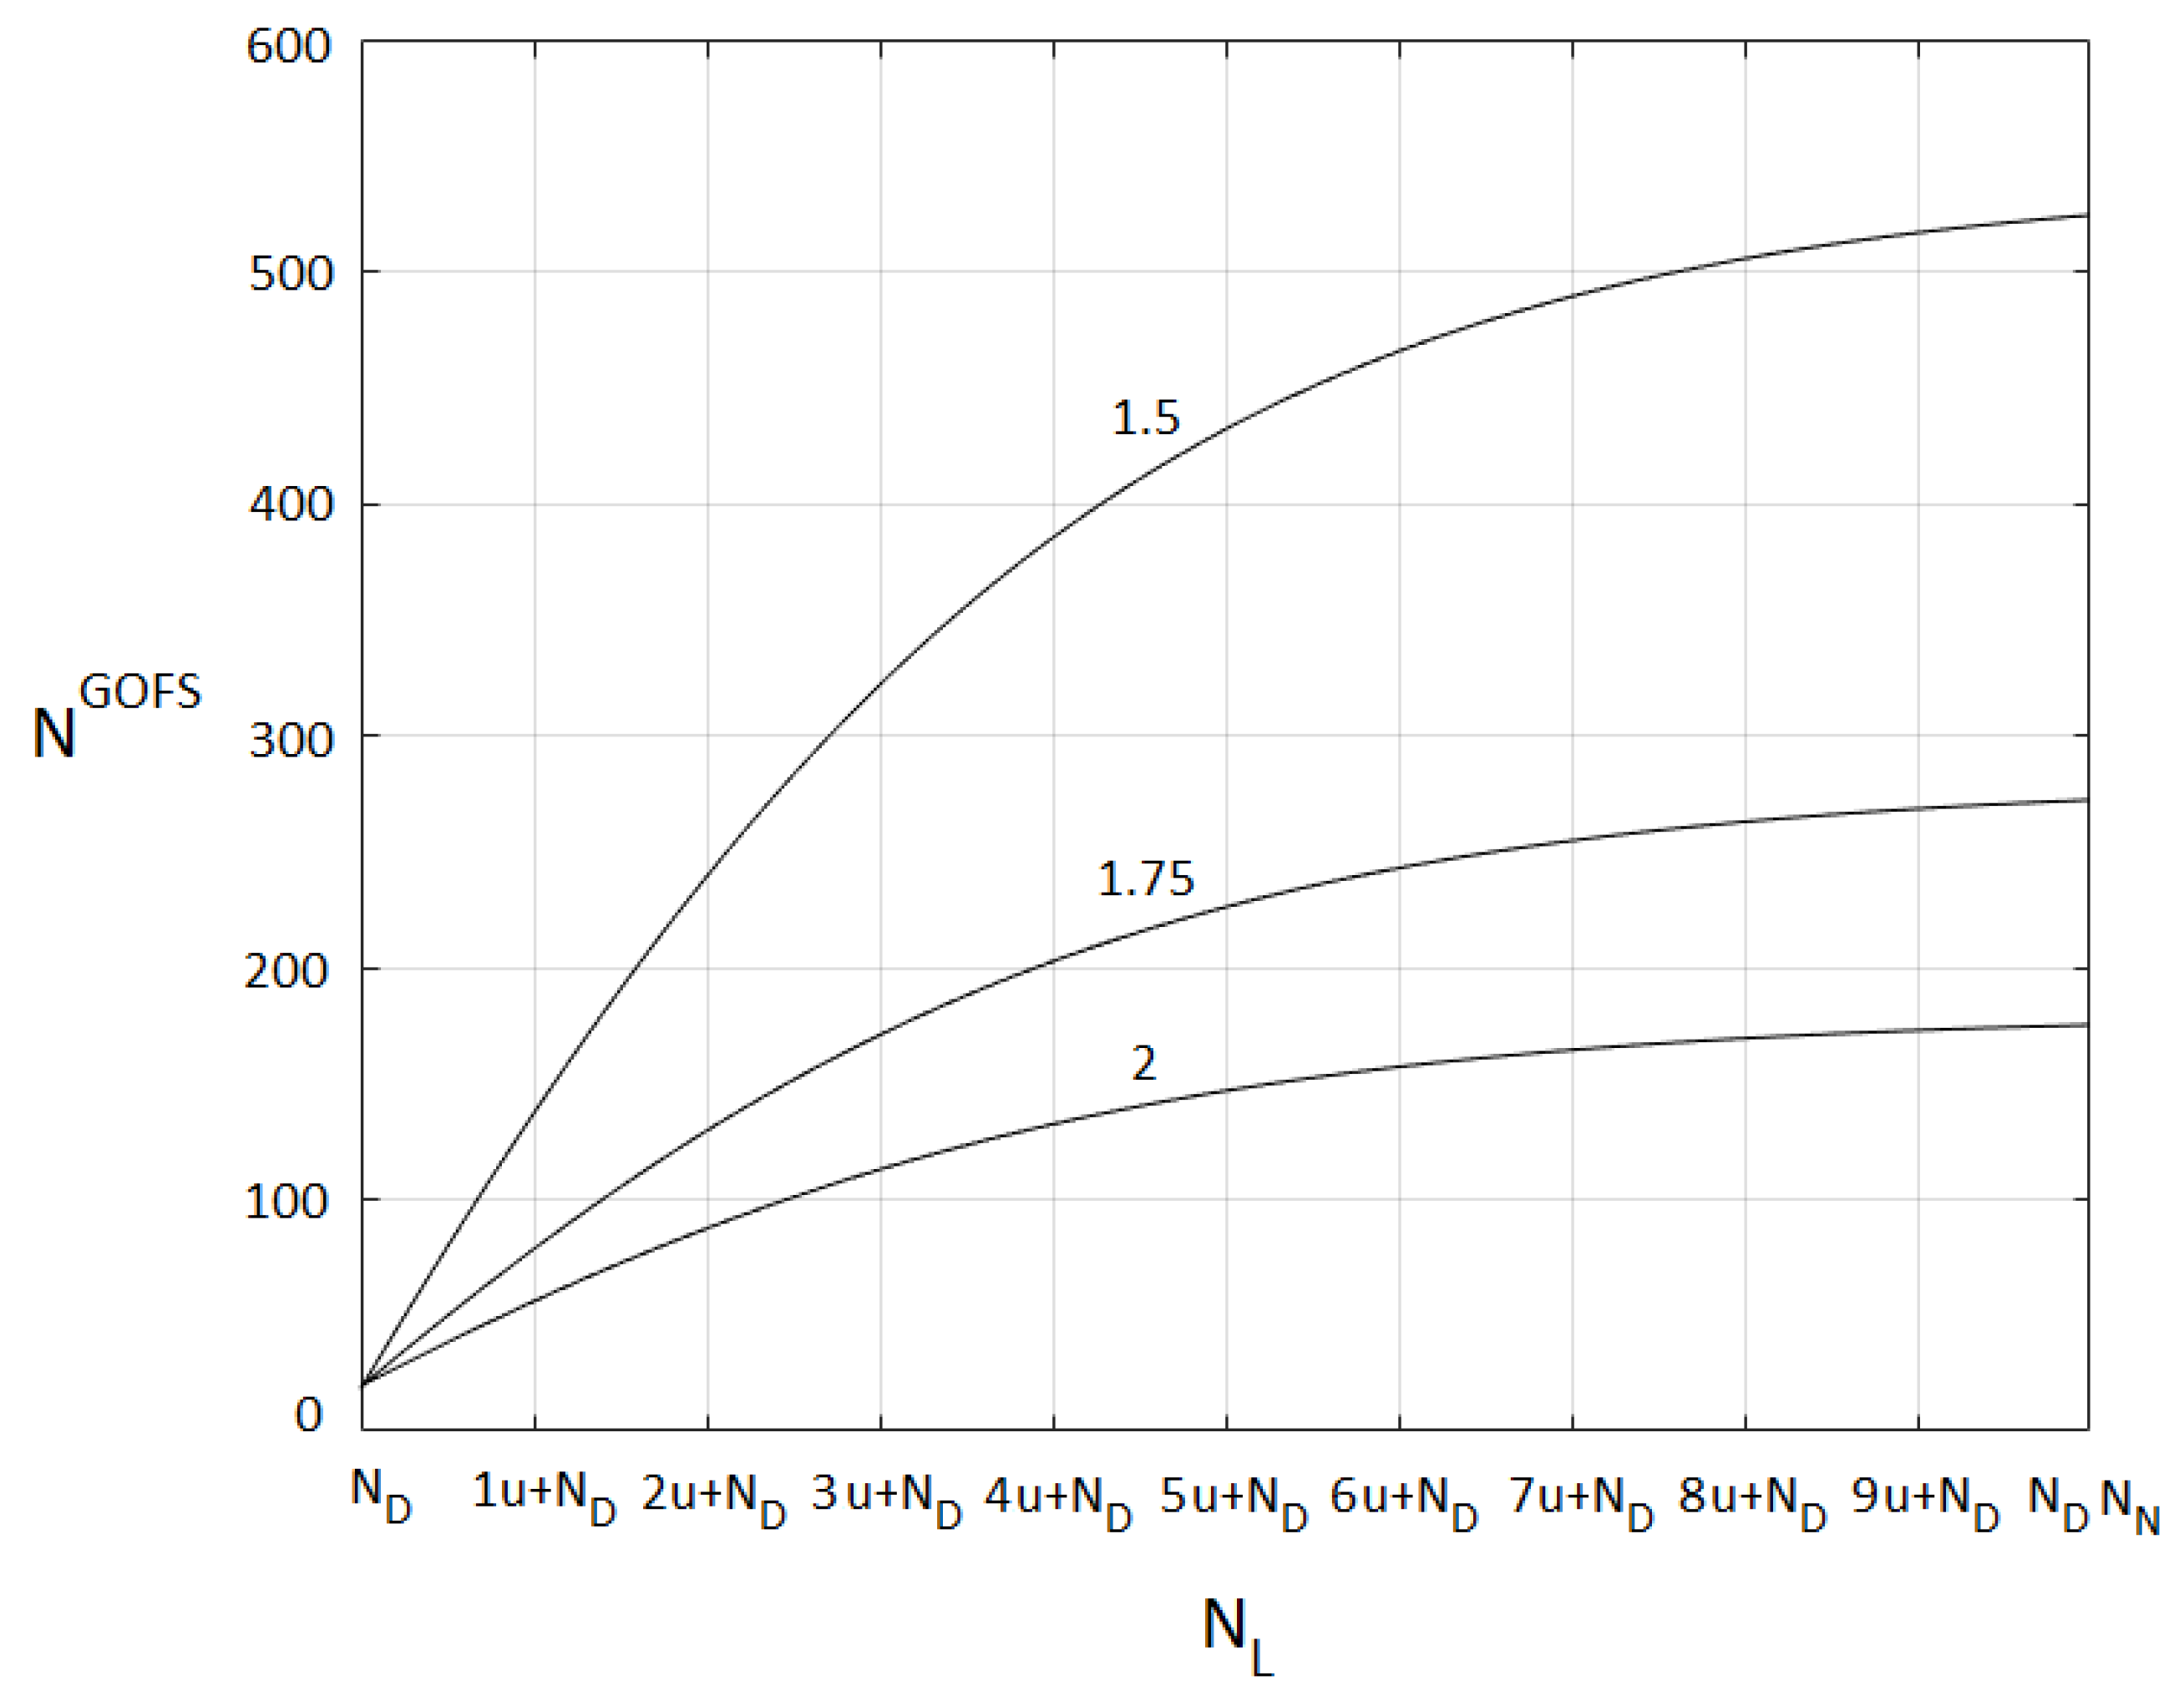
In Figure 9, the number of generations needed for the GA to achieve the ending optimum solution NGOFS as a function of the number of available links NL for different values of the multiplicative coefficient M, related to NN MAX = M NN MIN, for a number of individuals of population (NIP) equal to 100, is shown.
As it is possible to see from Figure 9, and as expected, the multiplicative coefficient M, related to NN MAX = M NN MIN, impacts the number of generations needed to attain the end solution. The larger the value of M, the lower the number of generations required for the GA to achieve convergences; its value is greater than 1.5 (or equal) and less than 2.
This supposed behavior is obvious as the number of generations rises with NL, because the GA requires one to execute a bigger number of processes to discover the optimum solution. The number of generations to achieve the final optimal solution NGOFS generations achieves, nevertheless, smaller asymptotic values when M tends to 2, as the GA can utilize a greater number of nodes to perform its optimization goal and therefore, must execute fewer evolution processes. On the contrary, NGOFS achieves greater asymptotic values when M tends to 1.5, as the GA can utilize a smaller number of nodes to perform its optimization goal and therefore, must execute more evolution processes.
Similar behaviors are attained if different values of NIP are considered.
6. Discussion
The proposed algorithm represents a first basic proposal for the optimization of the data network, the electricity network, and the air conditioning network, taking into account the constraints existing in historical buildings.
Its limit is represented by wanting to optimize, using the same algorithm, the three different networks. The method can be further improved by considering three separate GA systems for each of the tasks, namely, optimizing the communication network, the electrical network, and the air conditioning network, which are networks characterized by different functions and use.
It can further be improved by taking into account other parameters specific and common to the three types of network, which could lead to a higher level of optimization.
Other possible optimization techniques that could be considered for future developments of the considered problem are represented by Particle Swarm (PS) [82,83], Simulated Annealing (SA) [84,85], Tabu Search (TS) [86,87], Ant Colony (AC) [88,89], etc., that have not been considered here as they do not represent the main scope of the present paper.
Anyway, the obtained results have demonstrated the efficiency of the proposed technique that has been applied to design data network, electrical installation, and air conditioning installation of the considered museum, providing optimal results from the cost/benefit ratio point of view, considering also the goal and the limit of operability indicated above.
7. Conclusions
The innovative integrated systems and installations of the Fellini Museum in Italy have been presented jointly with the Genetic Algorithms (GAs)-based methodology used to design them.
In this way, it has been possible to obtain design solutions characterized by an optimal value of the cost/benefit ratio, considering the complexity of the environment and the need to respect the typical architectural/historical heritage that must be always considered in this kind of context.
Thanks to their flexibility, the illustrated GAs-based technique and methods can be utilized, as a first level of design optimization, in various type of museum or cultural site, to create a smart museum or a smart cultural heritage site by means of a proper IoT/IoE integrated system.
Funding
This research received no external funding.
Data Availability Statement
The data presented in this study are available on request from the corresponding author. The data are not publicly available due to confidentiality reasons.
Conflicts of Interest
The author declares no conflict of interest.
References
- Garau, C. Smart paths for advanced management of cultural heritage. Reg. Stud. Reg. Sci. 2014, 1, 286. [Google Scholar] [CrossRef] [Green Version]
- Lin, F.; Lin, Y. An ontology-based expert system for representing cultural meanings: An example of an Art Museum. In Proceedings of the Pacific Neighborhood Consortium Annual Conference and Joint Meetings (PNC), Tainan, Taiwan, 7 November 2017. [Google Scholar] [CrossRef]
- Chen, C.Y.; Chang, B.R.; Huang, P.S. Multimedia augmented reality information system for museum guidance. Pers. Ubiquit. Comput. 2014, 18, 315. [Google Scholar] [CrossRef]
- Mora, R.; Sánchez-Aparicio, L.J.; Maté-González, M.A.; García-Álvarez, J.; Sánchez-Aparicio, M.; González-Aguilera, D. An historical building information modelling approach for the preventive conservation of historical constructions: Application to the Historical Library of Salamanca. Autom. Constr. 2021, 121, 103449. [Google Scholar] [CrossRef]
- Balocco, C.; Vicario, M.; De Vita, M. An experimental methodological approach aimed to preventive conservation and sustainable adaptive use of the cultural heritage. Procedia Struct. Integr. 2020, 29, 25–33. [Google Scholar] [CrossRef]
- Suroto, P.Z.; Dewantara, M.H.; Wiradarmo, A.A. The application of technology in museums. Int. J. Appl. Sci. Tour. Events 2020, 4, 170. [Google Scholar] [CrossRef]
- Bezas, K.; Komianos, V.; Koufoudakis, G.; Tsoumanis, G.; Kabassi, K.; Oikonomou, K. Structural Health Monitoring in Historical Buildings: A Network Approach. Heritage 2020, 3, 796–818. [Google Scholar] [CrossRef]
- Garzia, F.; Sammarco, E.; Cusani, R. The integrated security system of the Vatican City State. Int. J. Saf. Secur. Eng. 2011, 1, 1. [Google Scholar] [CrossRef]
- Contardi, G.; Garzia, F.; Cusani, R. The integrated security system of the Senate of the Italian Republic. Int. J. Saf. Secur. Eng. 2011, 1, 219. [Google Scholar] [CrossRef]
- Alletto, S.; Cucchiara, R.; Fiore, G.D.; Mainetti, L.; Mighali, V.; Patrono, L.; Serra, G. An Indoor Location-Aware System for an IoT-Based Smart Museum. IEEE Internet Things J. 2016, 3, 244. [Google Scholar] [CrossRef]
- Ke, G.; Jiang, Q. Application of Internet of Things technology in the construction of wisdom museum. Concurr. Computat. Pr. Exp. 2019, 31, 4680. [Google Scholar] [CrossRef]
- Khan, M.N.; Rahman, H.U.; Faisal, M.; Khan, F.; Ahmad, S. An IoT-Enabled Information System for Smart Navigation in Museums. Sensors 2022, 22, 312. [Google Scholar] [CrossRef] [PubMed]
- Pierdicca, R.; Marques-Pita, M.; Paolanti, M.; Malinverni, E.S. IoT and Engagement in the Ubiquitous Museum. Sensors 2019, 19, 1387. [Google Scholar] [CrossRef] [PubMed] [Green Version]
- Piccialli, F.; Benedusi, P.; Carratore, L.; Colecchia, G. An IoT data analytics approach for cultural heritage. Pers. Ubiquit. Comput. 2020, 24, 429. [Google Scholar] [CrossRef]
- Ma, S.; Liu, Q.; Sheu, P.C.Y. Foglight: Visible Light-Enabled Indoor Localization System for Low-Power IoT Devices. IEEE Internet Things J. 2017, 5, 175–185. [Google Scholar] [CrossRef]
- Garzia, F.; Sant’Andrea, L. The Internet of Everything based integrated security system of the World War I museum of Fogliano Redipuglia in Italy. In Proceedings of the IEEE International Carnahan Conference on Security Technology, Orlando, FL, USA, 24 October 2016. [Google Scholar] [CrossRef]
- Garzia, F. Implementing an Internet of Everything system in the archaeological area of Quintili’s Villa in the Ancient Appia route park in Rome. In Proceedings of the SAFE 2017—International Conference on Safety & Security Engineering, Rome, Italy, 6 September 2017. [Google Scholar] [CrossRef] [Green Version]
- Goldberg, D.E. Genetic Algorithms in Search, Optimisation and Machine Learning, 1st ed.; Addison-Wesley: New York, NY, USA, 1989. [Google Scholar]
- Goldberg, D.E.; Deb, K. Foundations of Genetic Algorithms, 1st ed.; Morgan Kaufmann: New York, NY, USA, 1991. [Google Scholar]
- De Jong, K.A. Evolutionary Computation: A Unified Approach, 1st ed.; The MIT Press: Cambridge, MA, USA, 2006. [Google Scholar]
- Eiben, A.E.; Smith, J.E. Introduction to Evolutionary Computation, 2nd ed.; Springer: Berlin, Germany, 2015. [Google Scholar]
- Michalewcz, Z. Genetic Algorithms + Data Structures= Evolution Programs, 3rd ed.; Springer: Berlin, Germany, 1996. [Google Scholar]
- Mitchell, M. An Introduction to Genetic Algorithms, 1st ed.; The MIT Press: Cambridge, MA, USA, 1998. [Google Scholar]
- Cormen, T.H.; Leiserson, C.E.; Rivest, R.L.; Stein, C. Introduction to Algorithms, 3rd ed.; The MIT Press: Cambridge, MA, USA, 2009. [Google Scholar]
- Hassanat, A.; Almohammadi, K.; Alkafaween, E.; Abunawas, E.; Hammouri, A.; Prasath, V.B.S. Choosing Mutation and Crossover Ratios for Genetic Algorithms—A Review with a New Dynamic Approach. Information 2019, 10, 390. [Google Scholar] [CrossRef] [Green Version]
- Srinivas, M.; Patnaik, L.M. Genetic algorithms: A survey. Computer 1994, 27, 17. [Google Scholar] [CrossRef]
- Fellini Museum. Available online: https://www.fellinimuseum.it/en/ (accessed on 12 March 2022).
- Fellini, F.; Tofetti, S.; Laudadio, F.; Farinelli, G.L. Federico Fellini: The Book of Dreams; Rizzoli: Segrate, Italy, 2020. [Google Scholar]
- Fellini, F.; Calvino, I.; Betti, L. Making a Film; Contra Mundum Press: New York, NY, USA, 2015. [Google Scholar]
- Fellini, F. Fellini on Fellini; Capo Press: Boston, MA, USA, 1996. [Google Scholar]
- Fellini, F. I, Fellini; Cooper Square Press: New York, NY, USA, 2001. [Google Scholar]
- Kezich, T. Federico Fellini; Faber & Faber: London, UK, 2007. [Google Scholar]
- Kezich, T. Federico Fellini: The Films; Rizzoli: Segrate, Italy, 2010. [Google Scholar]
- Aldouby, H. Federico Fellini: Painting in Film, Painting on Film; University of Toronto Press: Toronto, ON, Canada, 2013. [Google Scholar]
- Stubbs, J.C. Federico Fellini as Auteur: Seven Aspects of His Films; Southern Illinois University Press: Carbondale, IL, USA, 2006. [Google Scholar]
- Mollica, V.; Fellini, F. Fellini; Skira Editore: Milano, Italy, 2004. [Google Scholar]
- Waller, M.; Gubareva, M.; Burke, F. A Companion to Federico Fellini; John Wiley and Sons Ltd.: Hoboken, NJ, USA, 2020. [Google Scholar]
- Fellini Museum. Available online: https://www.facebook.com/FelliniMuseum/ (accessed on 12 March 2022).
- Garzia, F. An Integrated Multidisciplinary Model for Security Management—Optimized Implementation Technique and Related Supporting Technological System Framework. In Proceedings of the IEEE International Carnahan Conference on Security Technology, Orlando, FL, USA, 24 October 2016. [Google Scholar] [CrossRef]
- Garzia, F.; Lombardi, M. Safety and security management through an integrated multidisciplinary model and related integrated technological framework. In Proceedings of the SAFE 2017—International Conference on Safety & Security Engineering, Rome, Italy, 6 September 2017. [Google Scholar] [CrossRef] [Green Version]
- Broder, J.F.; Tucker, E. Risk Analysis and the Security Survey, 1st ed.; Butterworth Heinemann: New York, NY, USA, 2012. [Google Scholar]
- Norman, T.L. Risk Analysis and Security Countermeasure Selection, 1st ed.; CRC Press: Boca Raton, FL, USA, 2010. [Google Scholar]
- CCI/ICC & ICCROM. The ABC Method: A Risk Management Approach to the Preservation of Cultural Heritage, 1st ed.; Canadian Conservation Institute: Ottawa, ON, Canada, 2016. [Google Scholar]
- Garzia, F. Novel risk assessment methodology for cultural heritage sites. In Proceedings of the STREMAH 2021—17th International Conference on Structural Studies, Repairs and Maintenance of Heritage Architecture, online, 26 May 2021. [Google Scholar] [CrossRef]
- Runhovde, S.R. Risking Munch. The art of balancing accessibility and security in museums. J. Risk Res. 2021, 24, 1113. [Google Scholar] [CrossRef]
- Atkinson, C.; Yates, D.; Brooke, N. ‘Now that you mention it, museums probably are a target’: Museums, terrorism and security in the United Kingdom. Mus. Manag. Curatorship 2020, 35, 109. [Google Scholar] [CrossRef]
- Bülow, A.E. Collection management using preservation risk assessment. J. Inst. Conserv. 2010, 33, 65. [Google Scholar] [CrossRef] [Green Version]
- Brokerhof, A.W.; Bülow, A.E. The QuiskScan—a quick risk scan to identify value and hazards in a collection. J. Inst. Conserv. 2016, 39, 18. [Google Scholar] [CrossRef] [Green Version]
- Elkin, L.K.; Nunan, E.; Fenkart-Froeschl, D. The “Collections Risk Management” Program at the American Museum of Natural History. Collections 2013, 9, 125. [Google Scholar] [CrossRef] [Green Version]
- Lee, K.; Castles, D. Collections Risk Assessment at the Royal BC Museum and Archives. Collections 2013, 9, 9. [Google Scholar] [CrossRef]
- Southward, J.; Thorwald, H.; Muething, G.; Waller, R. Collections Risk Assessment at the Denver Museum of Nature & Science. Collections 2013, 9, 71. [Google Scholar] [CrossRef]
- Matthews, G.; Smith, Y.; Knowles, G. Disaster Management in Archives, Libraries and Museums: An International Overview. Alexandria 2007, 19, 1. [Google Scholar] [CrossRef]
- Pinheiro, A.C.; Macedo, M.F. Risk assessment: A comparative study of archive storage rooms. J. Cult. Herit. 2009, 10, 428. [Google Scholar] [CrossRef]
- Garzia, F. Handbook of Communication Security, 1st ed.; WIT Press: Southampton, UK, 2013. [Google Scholar]
- Borghini, F.; Garzia, F.; Borghini, A.; Borghini, G. The Psychology of Security, Emergency and Risk, 1st ed.; WIT Press: Southampton, UK, 2016. [Google Scholar]
- Poon, K.F.; Conway, A.; Wardrop, G.; Mellis, J. Successful Application of Genetic Algorithms to Network Design and Planning. BT Technol. J. 2000, 18, 32. [Google Scholar] [CrossRef]
- Cortés, P.; Larrañeta, J.; Onieva, L.; García, J.M.; Caraballo, M.S. Genetic algorithm for planning cable telecommunication networks. Appl. Soft Comput. 2001, 1, 21. [Google Scholar] [CrossRef]
- Balubal, C.B.; Bernardo, A.R.D.; Lasheras, B.L.L.; Uyehara, R.A.; Bandala, A.A.; Dadios, E.P. Cabling and cost optimization system for IP based networks through Genetic Algorithm. In Proceedings of the 2014 IEEE Region 10 Symposium, Kuala Lumpur, Malaysia, 14 April 2014. [Google Scholar] [CrossRef]
- Vanhatupa, T.; Hannikainen, M.; Hamalainen, T.D. Genetic Algorithm to Optimize Node Placement and Configuration for WLAN Planning. In Proceedings of the 4th International Symposium on Wireless Communication Systems, Trondheim, Norway, 17 October 2007. [Google Scholar] [CrossRef]
- Yun, Z.; Lim, S.; Iskander, M.F. An Integrated Method of Ray Tracing and Genetic Algorithm for Optimizing Coverage in Indoor Wireless Networks. IEEE Antennas Wirel. Propag. Lett. 2008, 7, 145–148. [Google Scholar] [CrossRef]
- Lee, J.; Han, B.; Lim, H.; Kim, Y.; Saxena, N.; Chung, T. Optimizing Access Point Allocation Using Genetic Algorithmic Approach for Smart Home Environments. Comput. J. 2009, 52, 938–949. [Google Scholar] [CrossRef]
- Weicker, N.; Szabo, G.; Weicker, K.; Widmayer, P. Evolutionary multiobjective optimization for base station transmitter placement with frequency assignment. IEEE Trans. Evol. Comput. 2003, 7, 189–203. [Google Scholar] [CrossRef]
- Liu, Y.; Wei, H.; Zhang, H.; Wang, H.; An, W.; Long, K. An Efficient Geometry-Induced Genetic Algorithm for Base Station Placement in Cellular Networks. IEEE Access 2019, 7, 108604. [Google Scholar] [CrossRef]
- Xue, Z. Routing Optimization of Sensor Nodes in the Internet of Things Based on Genetic Algorithm. IEEE Sens. J. 2021, 21, 25142–25150. [Google Scholar] [CrossRef]
- Fan, Q.; Wu, S.; Zhou, X.; Li, L.; Wang, Z. A Genetic Algorithm Based on Auxiliary-Individual-Directed Crossover for Internet-of-Things Applications. IEEE Internet Things J. 2021, 8, 5518. [Google Scholar] [CrossRef]
- Li, X.; Liu, Y.; Ji, H.; Zhang, H.; Leung, V.C.M. Optimizing Resources Allocation for Fog Computing-Based Internet of Things Networks. IEEE Access 2019, 7, 64907. [Google Scholar] [CrossRef]
- Zhang, Y.; Yu, W.; Chen, X.; Jiang, J. Parallel Genetic Algorithm to Extend the Lifespan of Internet of Things in 5G Networks. IEEE Access 2020, 8, 149630. [Google Scholar] [CrossRef]
- De Oliveira, A.C.M.; Lorena, L.A.N. A constructive genetic algorithm for gate matrix layout problems. IEEE Trans. Comput. Aided Des. Integr. Circuits Syst. 2002, 21, 969–974. [Google Scholar] [CrossRef] [Green Version]
- Yang, C. Genetic Algorithm Based Faulty Parameter Identification for Linear Analog Circuit. IEEE Access 2020, 8, 213357. [Google Scholar] [CrossRef]
- Saha, D.; Sur-Kolay, S. Guided GA-Based Multiobjective Optimization of Placement and Assignment of TSVs in 3-D ICs. IEEE Trans. Very Large Scale Integr. (VLSI) Syst. 2019, 27, 1742–1750. [Google Scholar] [CrossRef]
- Zhang, J.; Chung, H.S.H.; Lo, W.L.; Hui, S.Y.; Wu, A.K.M. Implementation of a decoupled optimization technique for design of switching regulators using genetic algorithms. IEEE Trans. Power Electron. 2001, 16, 752–763. [Google Scholar] [CrossRef] [Green Version]
- Zhang, J.; Chung, H.S.H.; Lo, W.L. Pseudocoevolutionary genetic algorithms for power electronic circuits optimization. IEEE Trans. Syst. Man Cybern. Part C (Appl. Rev.) 2006, 36, 590–598. [Google Scholar] [CrossRef]
- Delbem, A.C.B.; de Carvalho, A.C.P.L.F.; Bretas, N.G. Main chain representation for evolutionary algorithms applied to distribution system reconfiguration. IEEE Trans. Power Syst. 2005, 20, 425–436. [Google Scholar] [CrossRef]
- Carrano, E.G.; Soares, L.A.E.; Takahashi, R.H.C.; Saldanha, R.R.; Neto, O.M. Electric distribution network multiobjective design using a problem-specific genetic algorithm. IEEE Trans. Power Deliv. 2006, 21, 995–1005. [Google Scholar] [CrossRef]
- Hong, Y.Y.; Ho, S.Y. Determination of network configuration considering multiobjective in distribution systems using genetic algorithms. IEEE Trans. Power Syst. 2005, 20, 1062–1069. [Google Scholar] [CrossRef]
- Celli, G.; Ghiani, E.; Mocci, S.; Pilo, F. A multiobjective evolutionary algorithm for the sizing and siting of distributed generation. IEEE Trans. Power Syst. 2005, 20, 750–757. [Google Scholar] [CrossRef]
- Wang, C.; Gao, Y. Determination of Power Distribution Network Configuration Using Non-Revisiting Genetic Algorithm. IEEE Trans. Power Syst. 2013, 28, 3638–3648. [Google Scholar] [CrossRef]
- Mossolly, M.; Ghali, K.; Ghaddar, N. Optimal control strategy for a multi-zone air conditioning system using a genetic algorithm. Energy 2009, 34, 58. [Google Scholar] [CrossRef]
- Wang, S.; Jin, X. Model-based optimal control of VAV air-conditioning system using genetic algorithm. Build. Environ. 2000, 35, 471. [Google Scholar] [CrossRef]
- Seong, N.C.; Kim, J.H.; Choi, W. Optimal Control Strategy for Variable Air Volume Air-Conditioning Systems Using Genetic Algorithms. Sustainability 2019, 11, 5122. [Google Scholar] [CrossRef] [Green Version]
- Chang, Y.C. Genetic algorithm based optimal chiller loading for energy conservation. Appl. Therm. Eng. 2005, 25, 2800. [Google Scholar] [CrossRef]
- Poli, R.; Kennedy, J.; Blackwell, T. Particle swarm optimization. Swarm Intell. 2007, 1, 33. [Google Scholar] [CrossRef]
- Bratton, D.; Kennedy, J. Defining a Standard for Particle Swarm Optimization. In Proceedings of the 2007 IEEE Swarm Intelligence Symposium, Honolulu, Hawaii, 1 April 2007. [Google Scholar] [CrossRef]
- Rutenbar, R.A. Simulated annealing algorithms: An overview. IEEE Circuits Devices Mag. 1989, 5, 19–26. [Google Scholar] [CrossRef]
- Granville, V.; Krivanek, M.; Rasson, J.P. Simulated annealing: A proof of convergence. IEEE Trans. Pattern Anal. Mach. Intell. 1994, 16, 652–656. [Google Scholar] [CrossRef]
- Hanafi, S. On the Convergence of Tabu Search. J. Heuristics 2001, 7, 47. [Google Scholar] [CrossRef]
- Glover, F.; Hanafi, S. Tabu search and finite convergence. Discret. Appl. Math. 2002, 119, 3. [Google Scholar] [CrossRef] [Green Version]
- Dorigo, M.; Birattari, M.; Stutzle, T. Ant colony optimization. IEEE Comput. Intell. Mag. 2006, 1, 28–39. [Google Scholar] [CrossRef]
- Martens, D.; De Backer, M.; Haesen, R.; Vanthienen, J.; Snoeck, M.; Baesens, B. Classification with Ant Colony Optimization. IEEE Trans. Evol. Comput. 2007, 11, 651–665. [Google Scholar] [CrossRef]
Figure 1.
Map of Fellini’s Museum where Sismondi Castel (A), Malatesta square (B), and Fulgor Palace (C) are shown.
Figure 1.
Map of Fellini’s Museum where Sismondi Castel (A), Malatesta square (B), and Fulgor Palace (C) are shown.

Figure 2.
Pictures of interior Fellini’s Museum; (a–d) interior exhibit rooms of Sismondo Castle [38].
Figure 2.
Pictures of interior Fellini’s Museum; (a–d) interior exhibit rooms of Sismondo Castle [38].

Figure 3.
Pictures of exterior of Fellini’s Museum: (a,d) Sismondo Castle; (b) Malatesta square; (c) Fulgor Palace [38].
Figure 3.
Pictures of exterior of Fellini’s Museum: (a,d) Sismondo Castle; (b) Malatesta square; (c) Fulgor Palace [38].


Figure 4.
Framework of the integrated IoT/IoE system.

Figure 5.
Base cycle of a Genetic Algorithm.

Figure 6.
Encoding of the solution parameters into genes of a chromosome.

Figure 7.
Reduction Ratio (RR), expressed in a percentage, as a function of the number of available links NL, for diverse values of multiplicative coefficient M, related to NN MAX = M NN MIN. u = (ND NN − ND)/10.
Figure 7.
Reduction Ratio (RR), expressed in a percentage, as a function of the number of available links NL, for diverse values of multiplicative coefficient M, related to NN MAX = M NN MIN. u = (ND NN − ND)/10.

Figure 8.
Number of generations needed to attain the optimal ending solutions (NGOFS) as a function of the number of available links NL for diverse values of number individuals I of population (NIP) (u = (ND NN − ND)/10), where the multiplicative coefficient M, related to NN MAX = M NN MIN, is equal to 1.5.

Figure 9.
Number of generations needed to attain the optimal ending solutions (NGOFS) as a function of the number of available links NL for diverse values of the multiplicative coefficient M, related to NN MAX = M NN MIN, for a quantity of individuals of the population (NIP) equal to 100 (u = (ND NN − ND)/10).


Table 1.
Instance of a cost/link table (CLT). Ci,j embodies the cost of the link between device i and node j.
Table 1.
Instance of a cost/link table (CLT). Ci,j embodies the cost of the link between device i and node j.
| Device | Node 1 | Node 2 | …… | Node NN−1 | Node NN |
|---|---|---|---|---|---|
| Device 1 | C1, 1 | C1, 2 | C1, Nn−1 | C1, Nn | |
| Device 2 | C2, 1 | C1, 2 | C1, Nn−1 | C1, Nn | |
| ………….. | |||||
| Device ND−1 | C Nd−1, 1 | C Nd−1, 2 | C Nd-1, Nn−1 | C Nd−1, Nn | |
| Device ND | C Nd, 1 | C Nd, 2 | C Nd, Nn−1 | C Nd, Nn |
Table 2.
Encoding scheme of the gene.
| Gene | Considered Variable | Variability Interval | Kind of Variable | Number of Bits |
|---|---|---|---|---|
| 1 | Link 1: source device, destination node | 1 ÷ ND, 1 ÷ NN, | Integer, Integer | Int (log2 (ND) + 1), Int (log2 (NN) + 1). |
| 2 | Link 2: source device, destination node | 1 ÷ ND, 1 ÷ NN, | Integer, Integer | Int (log2 (ND) + 1), Int (log2 (NN) + 1). |
| …… | …… | …… | …… | …… |
| ND−1 | Link ND−1: source device, destination node | 1 ÷ ND, 1 ÷ NN, | Integer, Integer | Int (log2 (ND) + 1), Int (log2 (NN) + 1). |
| ND | Link ND: source device, destination node | 1 ÷ ND, 1 ÷ NN, | Integer, Integer | Int (log2 (ND) + 1), Int (log2 (NN) + 1). |
Publisher’s Note: MDPI stays neutral with regard to jurisdictional claims in published maps and institutional affiliations. |
© 2022 by the author. Licensee MDPI, Basel, Switzerland. This article is an open access article distributed under the terms and conditions of the Creative Commons Attribution (CC BY) license (https://creativecommons.org/licenses/by/4.0/).
Share and Cite
MDPI and ACS Style
Garzia, F. The Fellini Museum of Rimini in Italy and the Genetic Algorithms-Based Method to Optimize the Design of an Integrated System Network and Installations. Heritage 2022, 5, 1310-1329. https://doi.org/10.3390/heritage5020068
AMA Style
Garzia F. The Fellini Museum of Rimini in Italy and the Genetic Algorithms-Based Method to Optimize the Design of an Integrated System Network and Installations. Heritage. 2022; 5(2):1310-1329. https://doi.org/10.3390/heritage5020068
Chicago/Turabian StyleGarzia, Fabio. 2022. "The Fellini Museum of Rimini in Italy and the Genetic Algorithms-Based Method to Optimize the Design of an Integrated System Network and Installations" Heritage 5, no. 2: 1310-1329. https://doi.org/10.3390/heritage5020068