
Chemical and Laser Cleaning of Corrosion Encrustations on Historical Stained Glass: A Comparative Study
 , , , , ,
Abstract
:1. Introduction
2. Materials and Methods
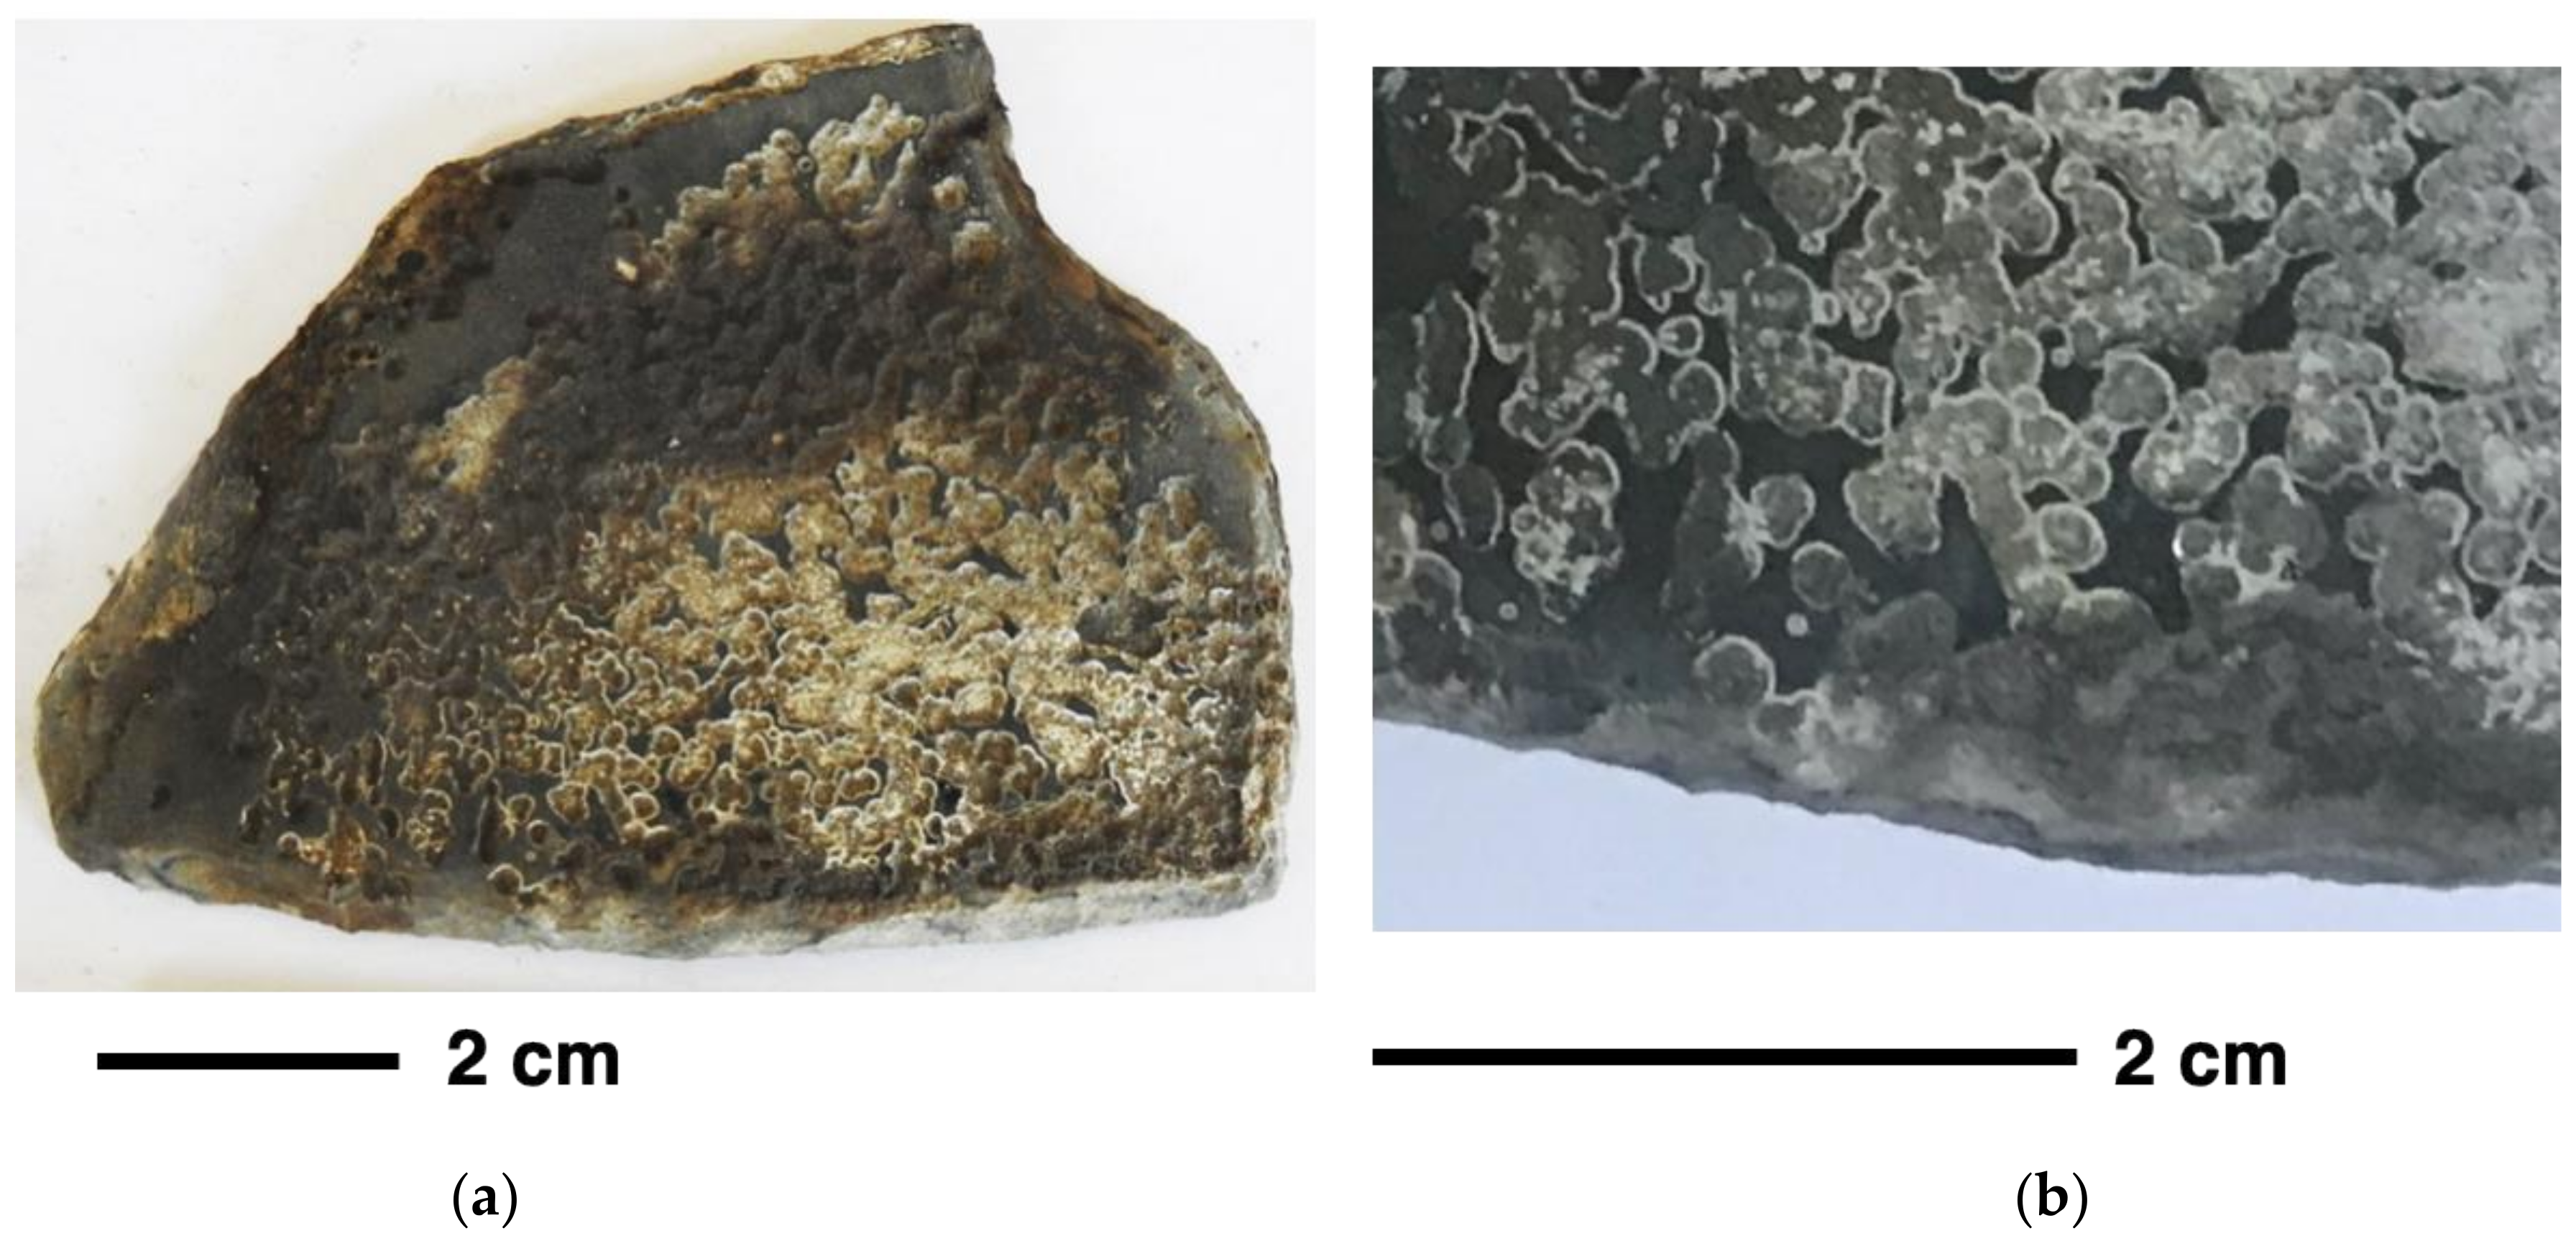
2.1. Historical Glass Sample
2.2. Chemical Cleaning Agents
2.3. Laser System Used in the Cleaning Process
2.4. Surface Analytical Techniques
3. Results
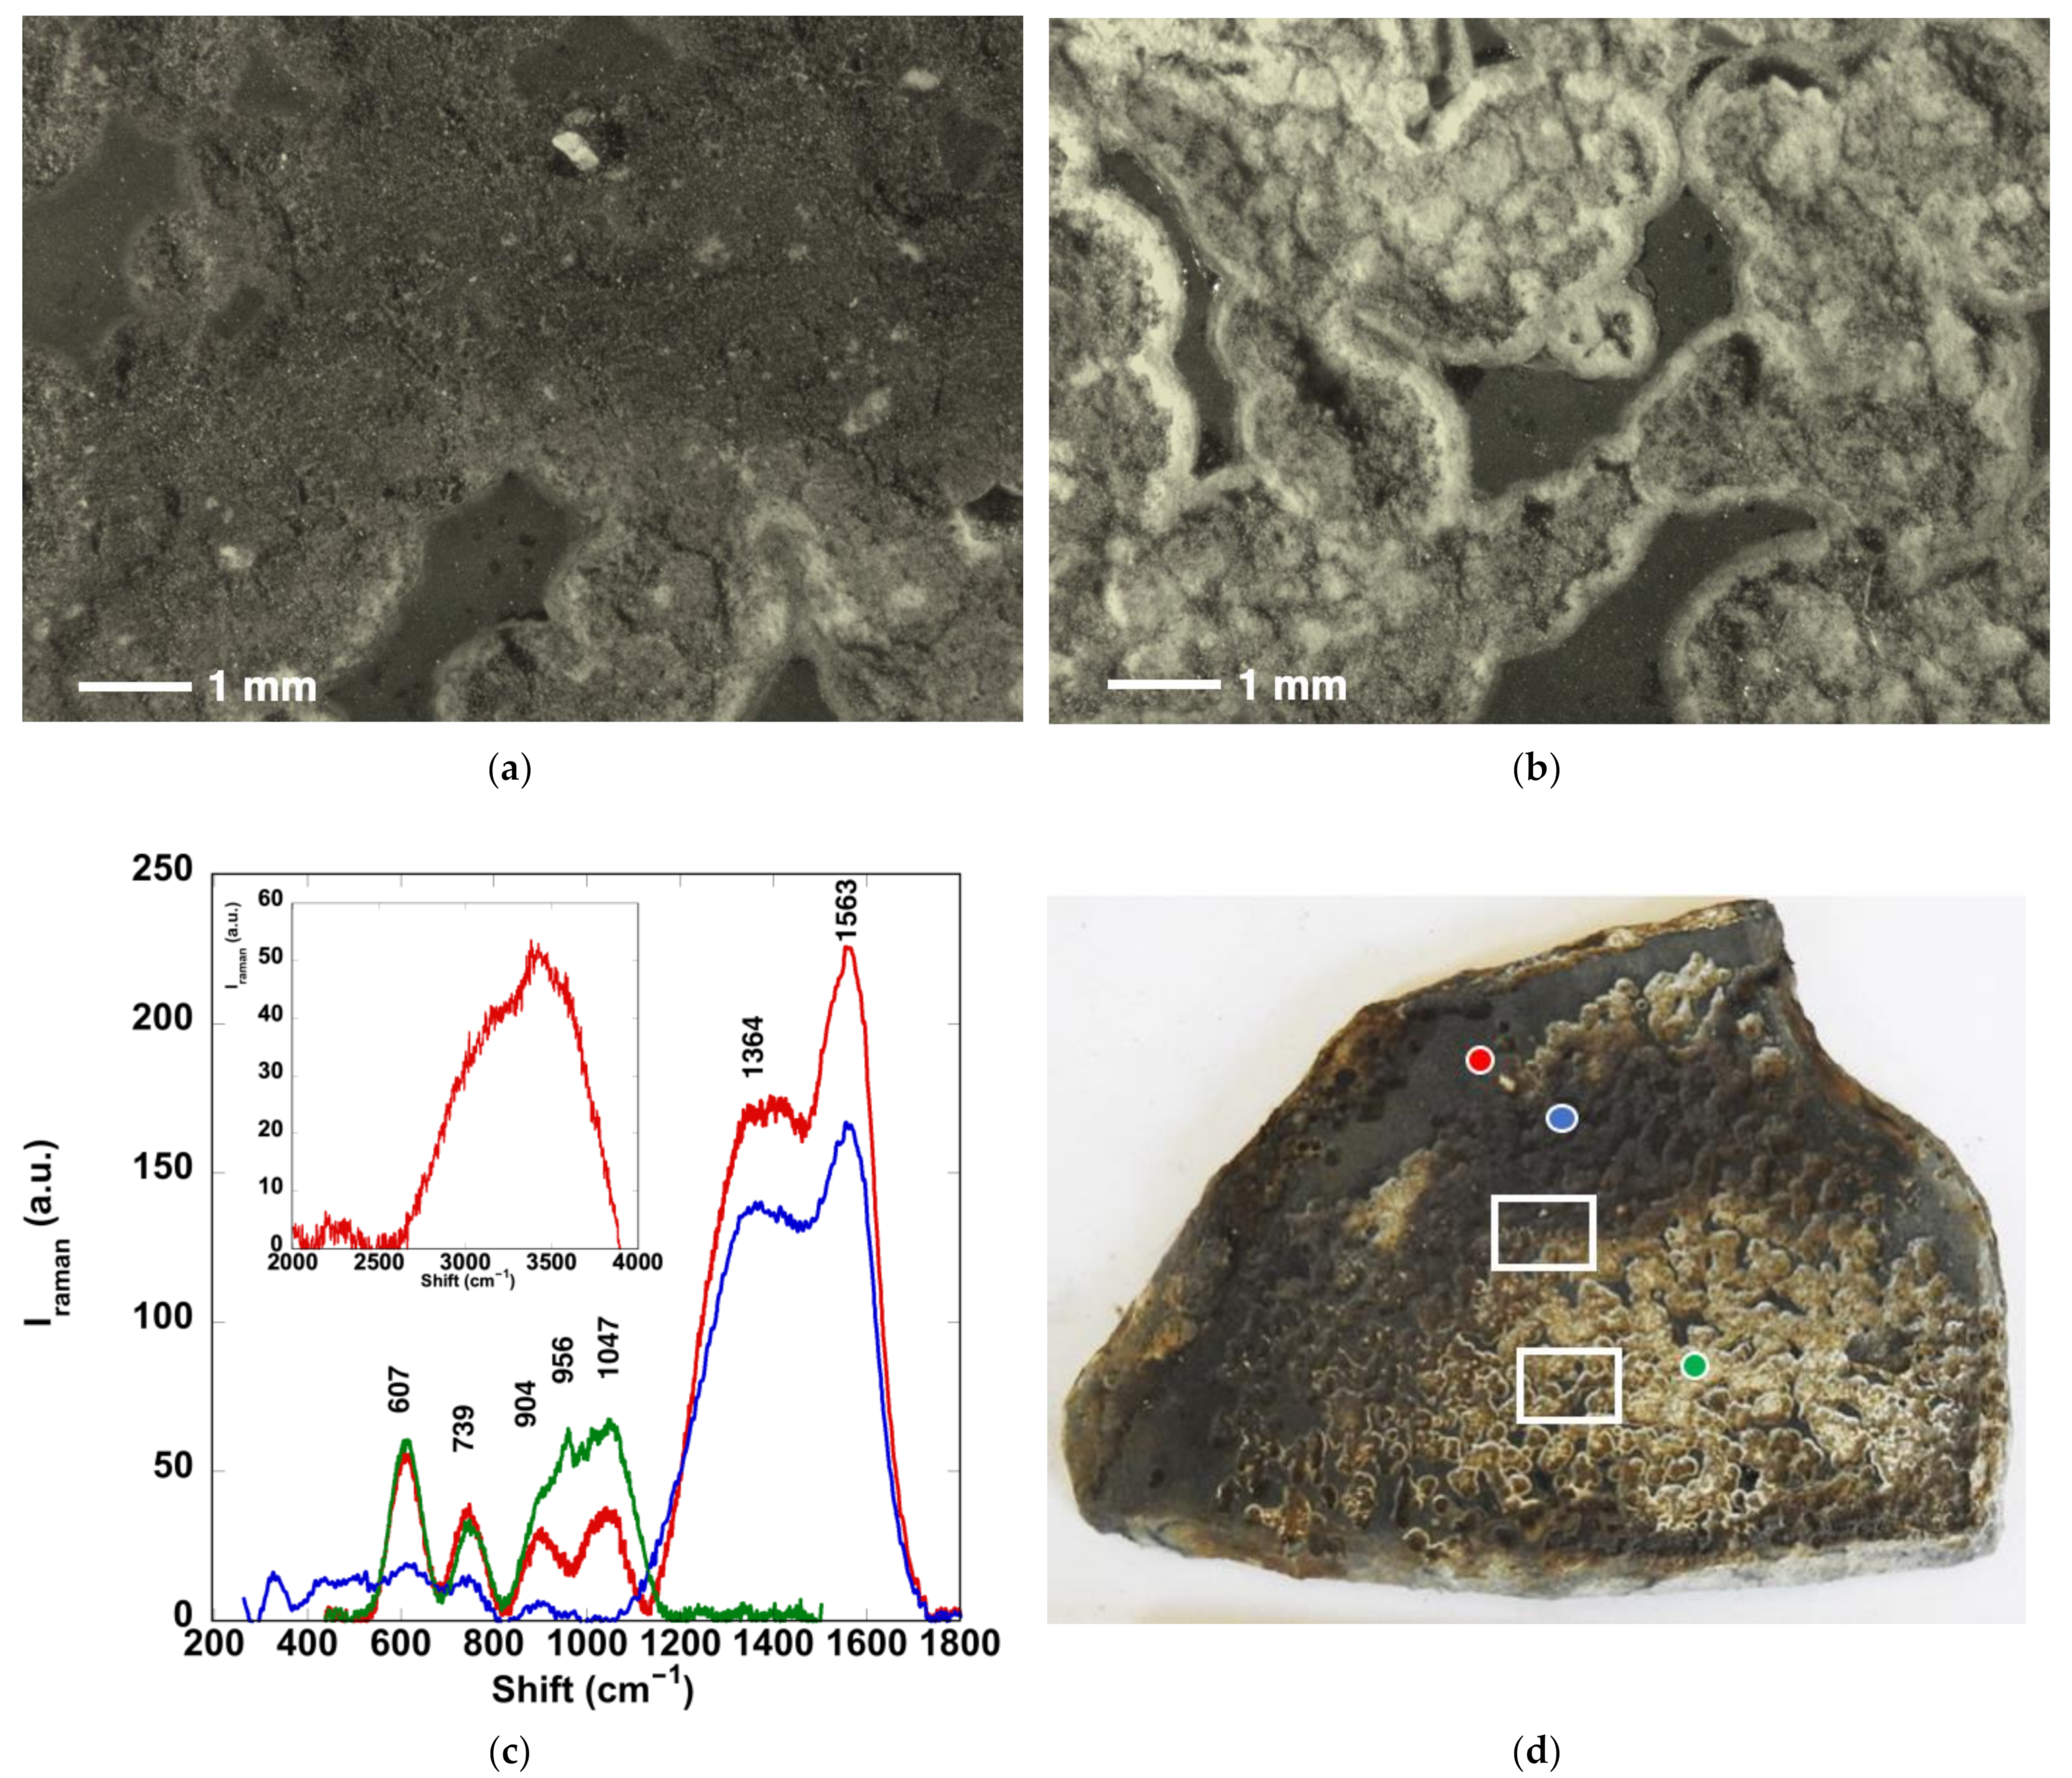
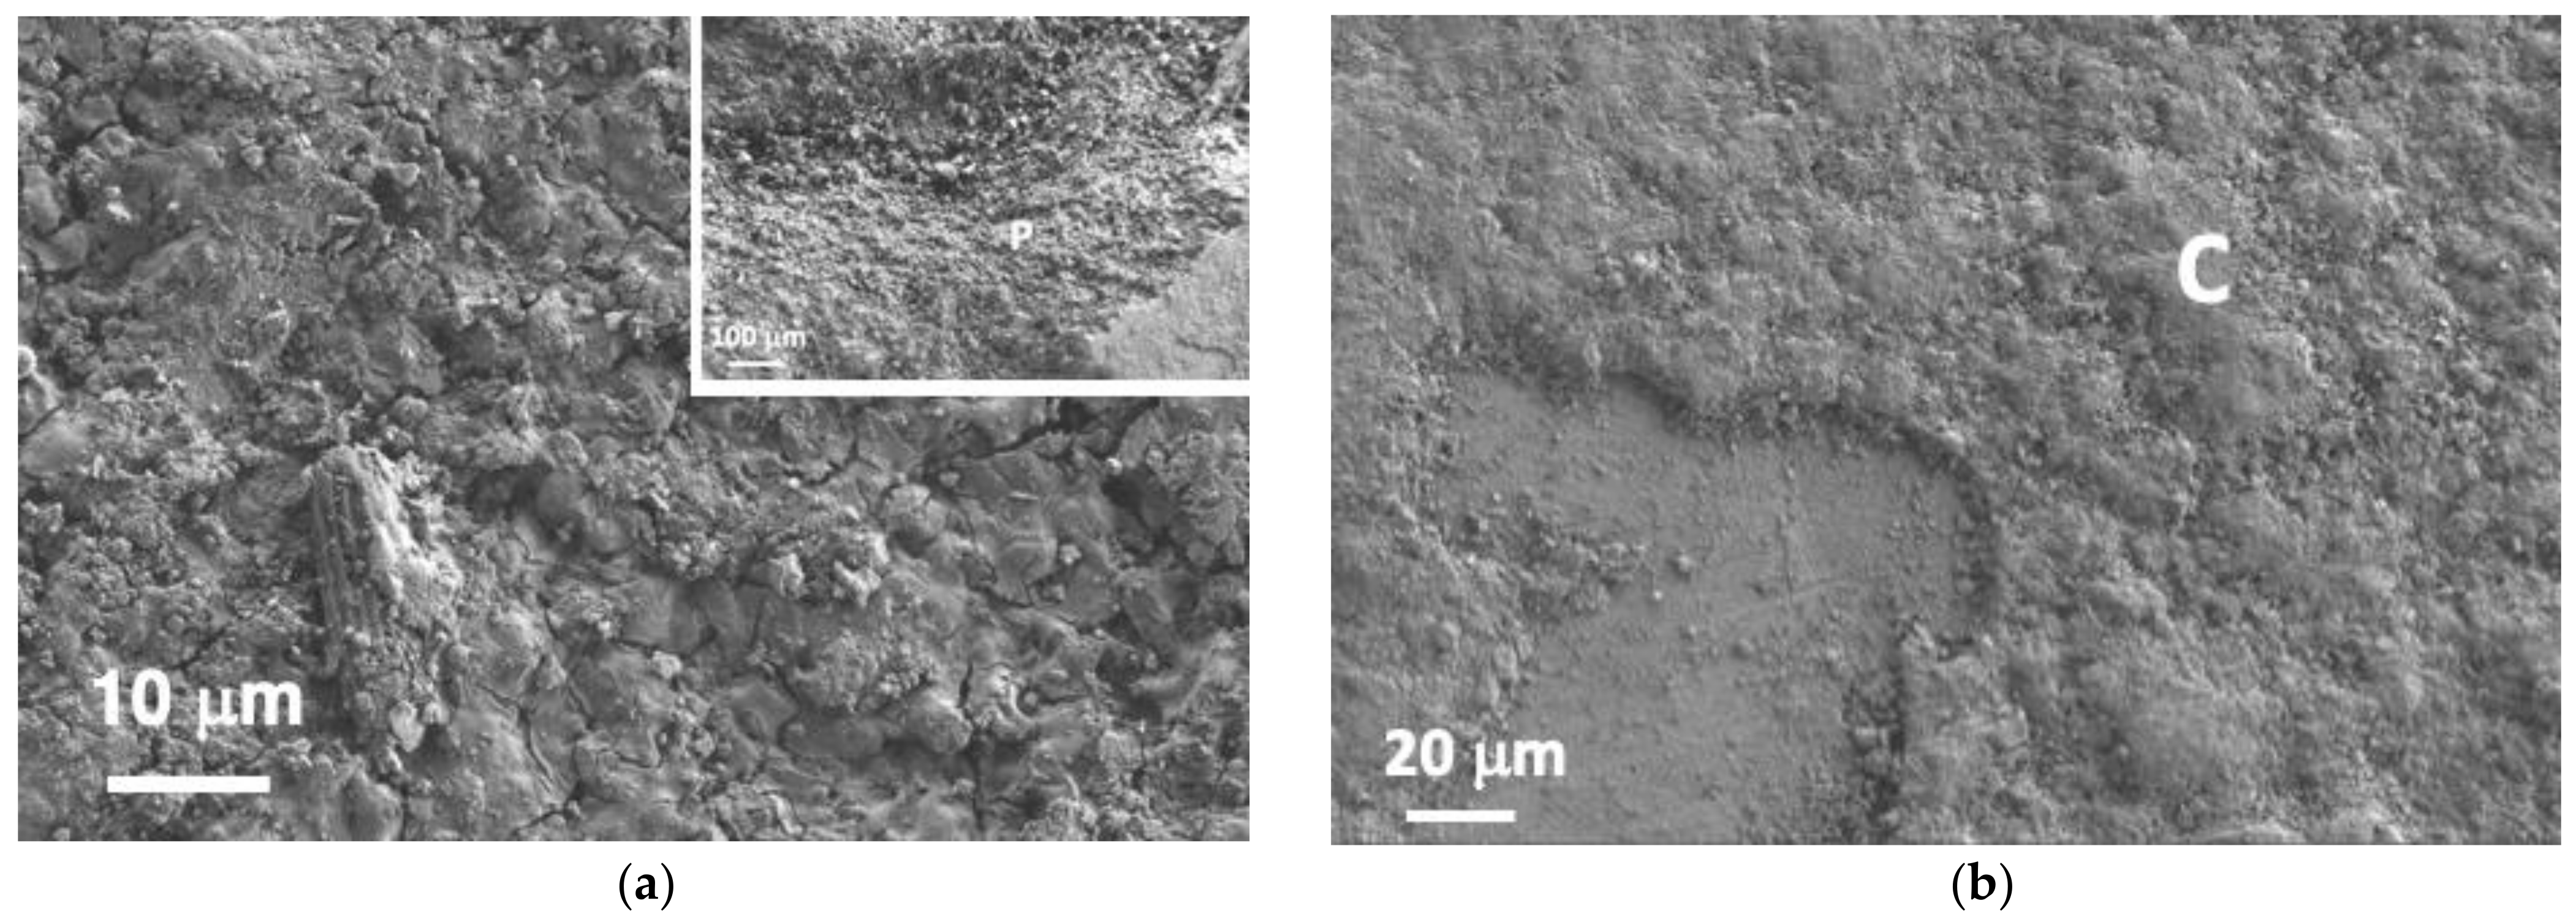
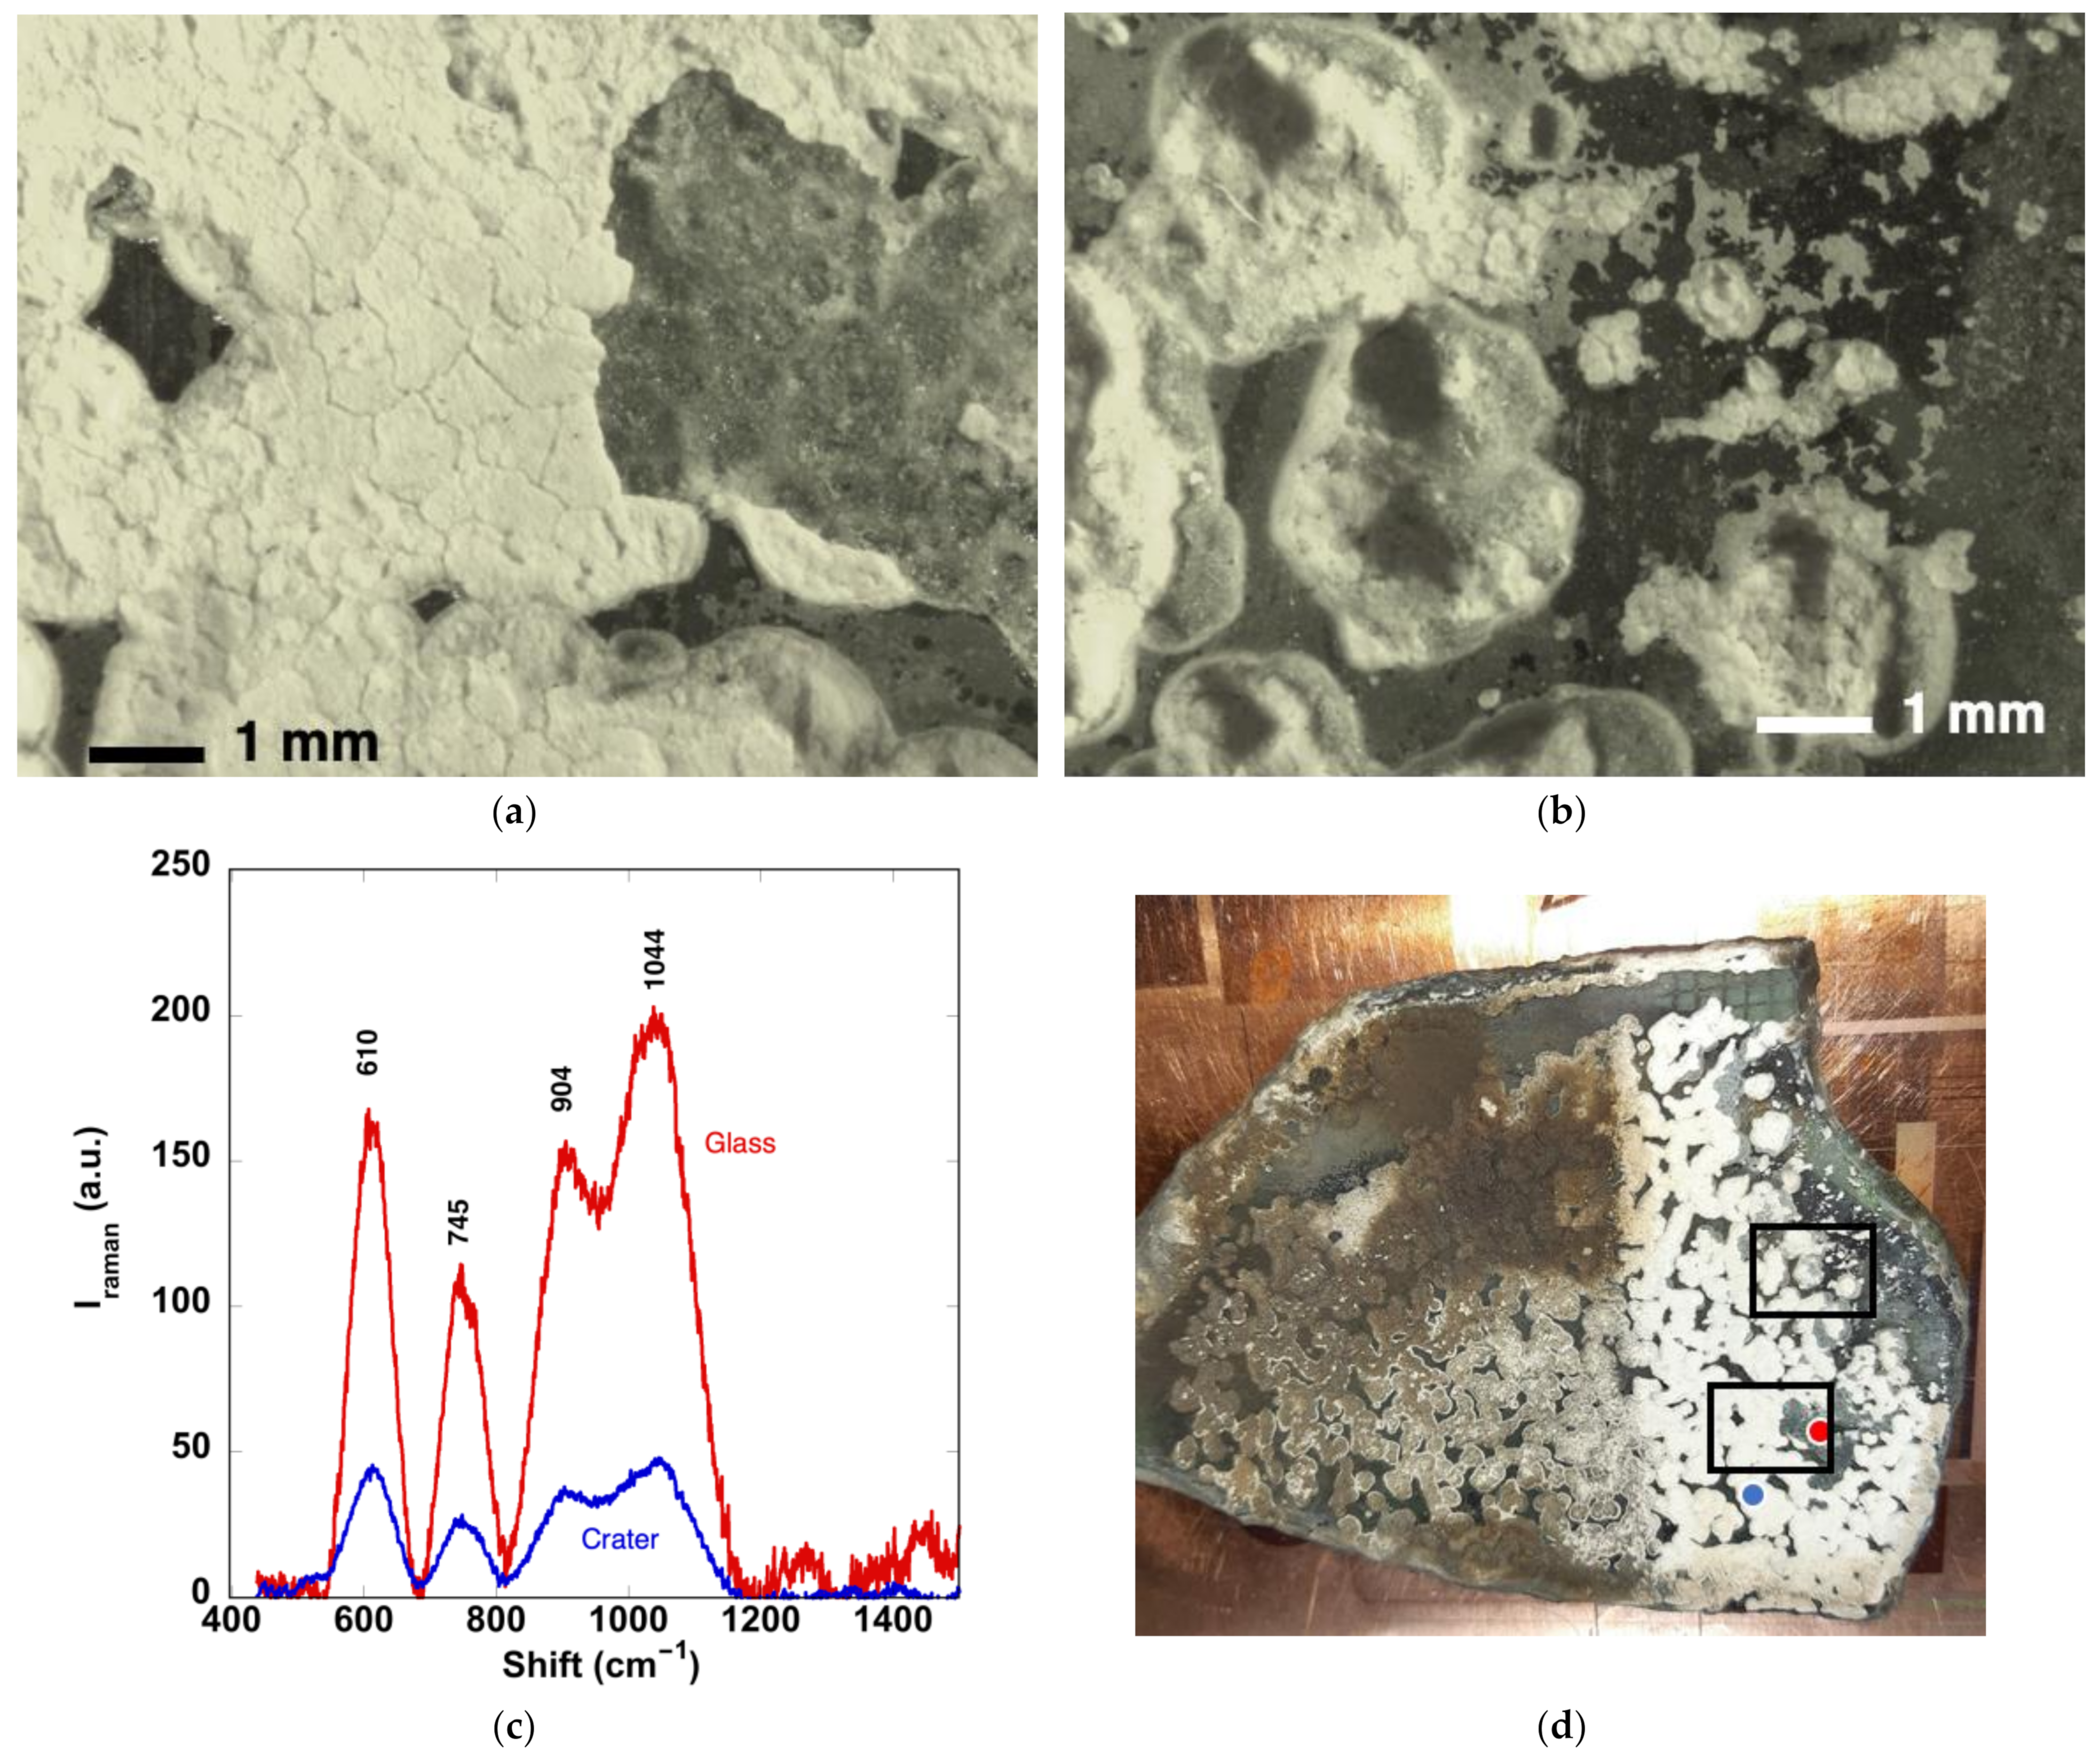
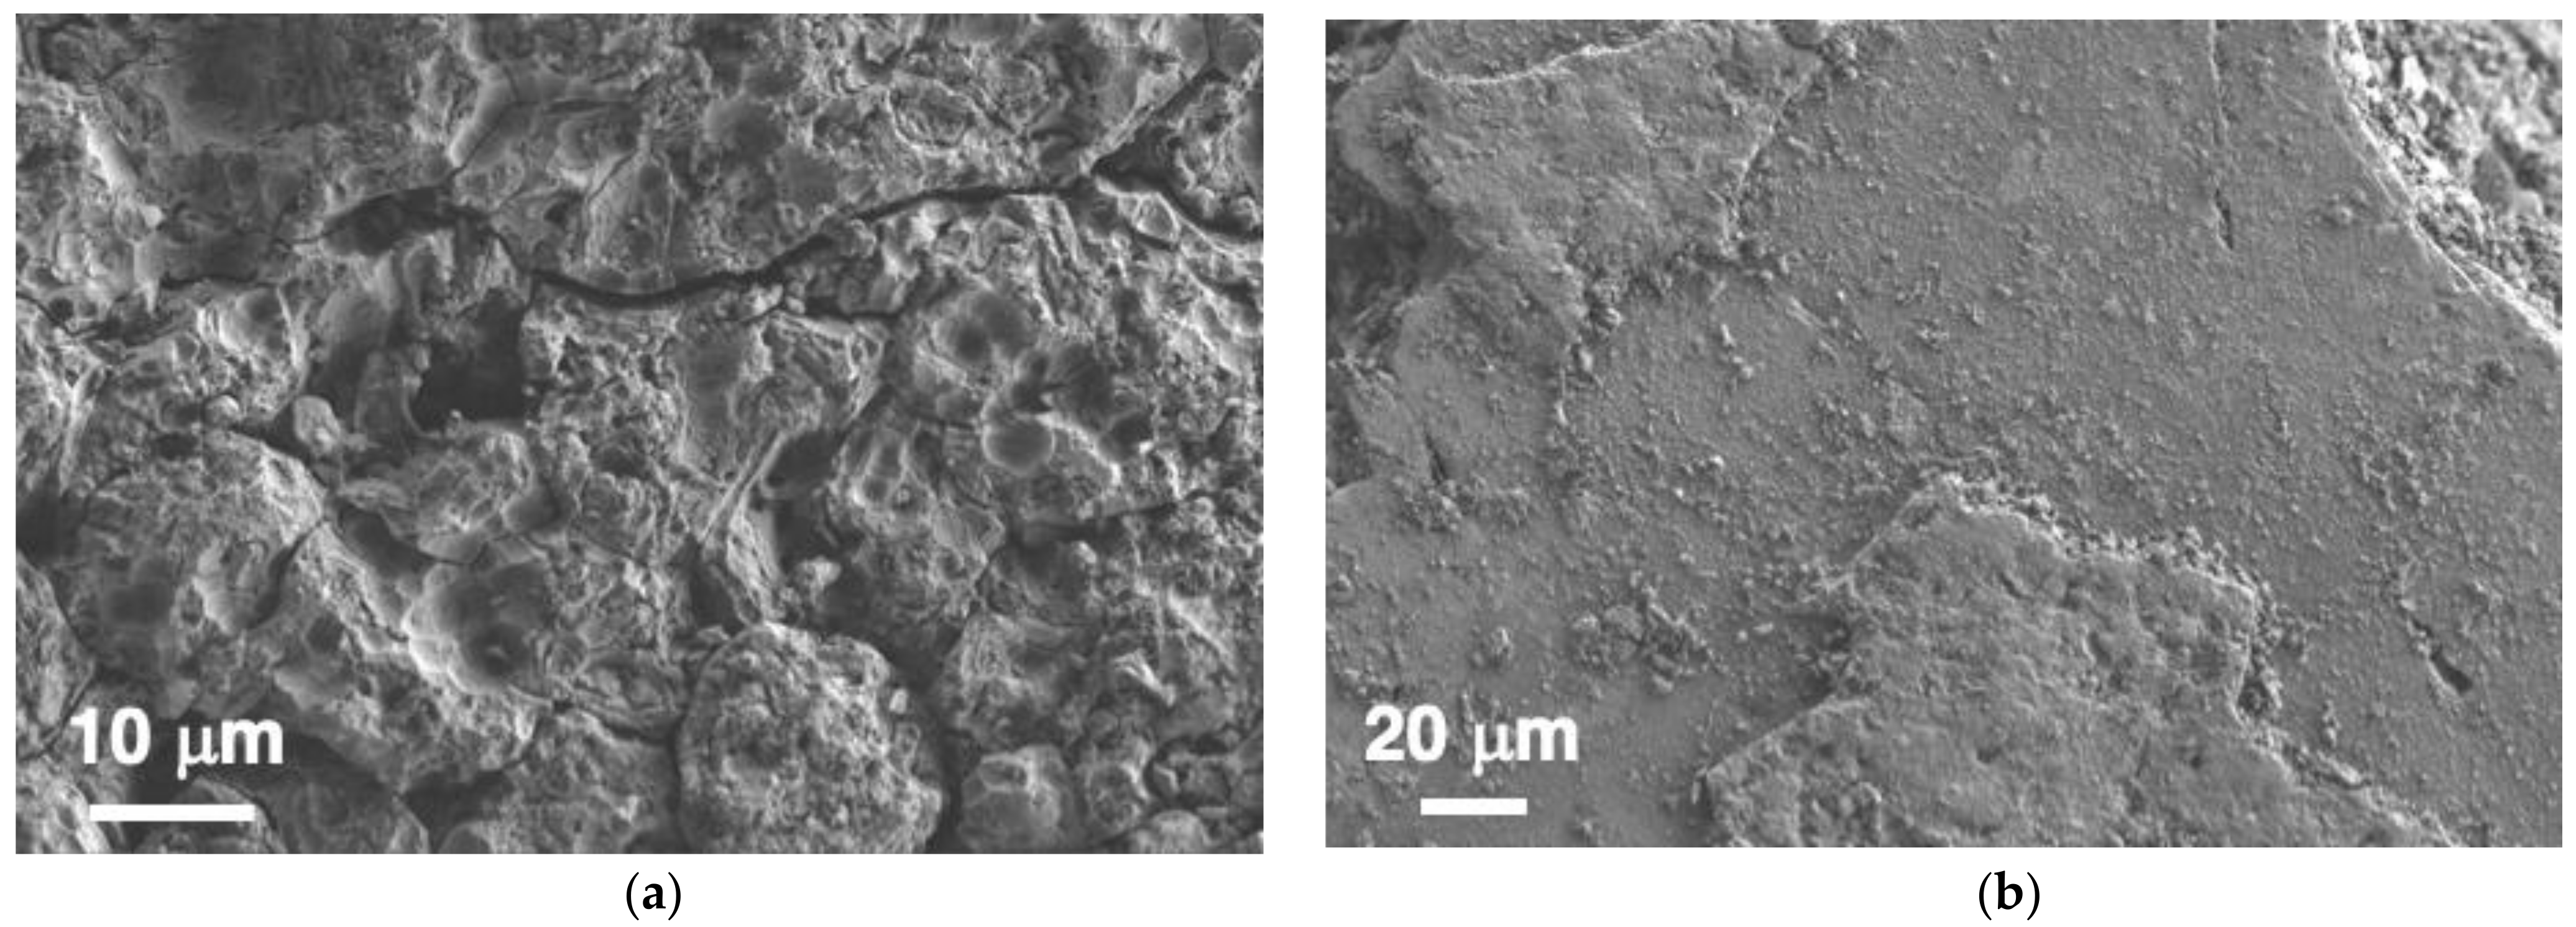
3.1. Original Glass Surface Observations and Analysis
3.2. Chemically Cleaned Surfaces
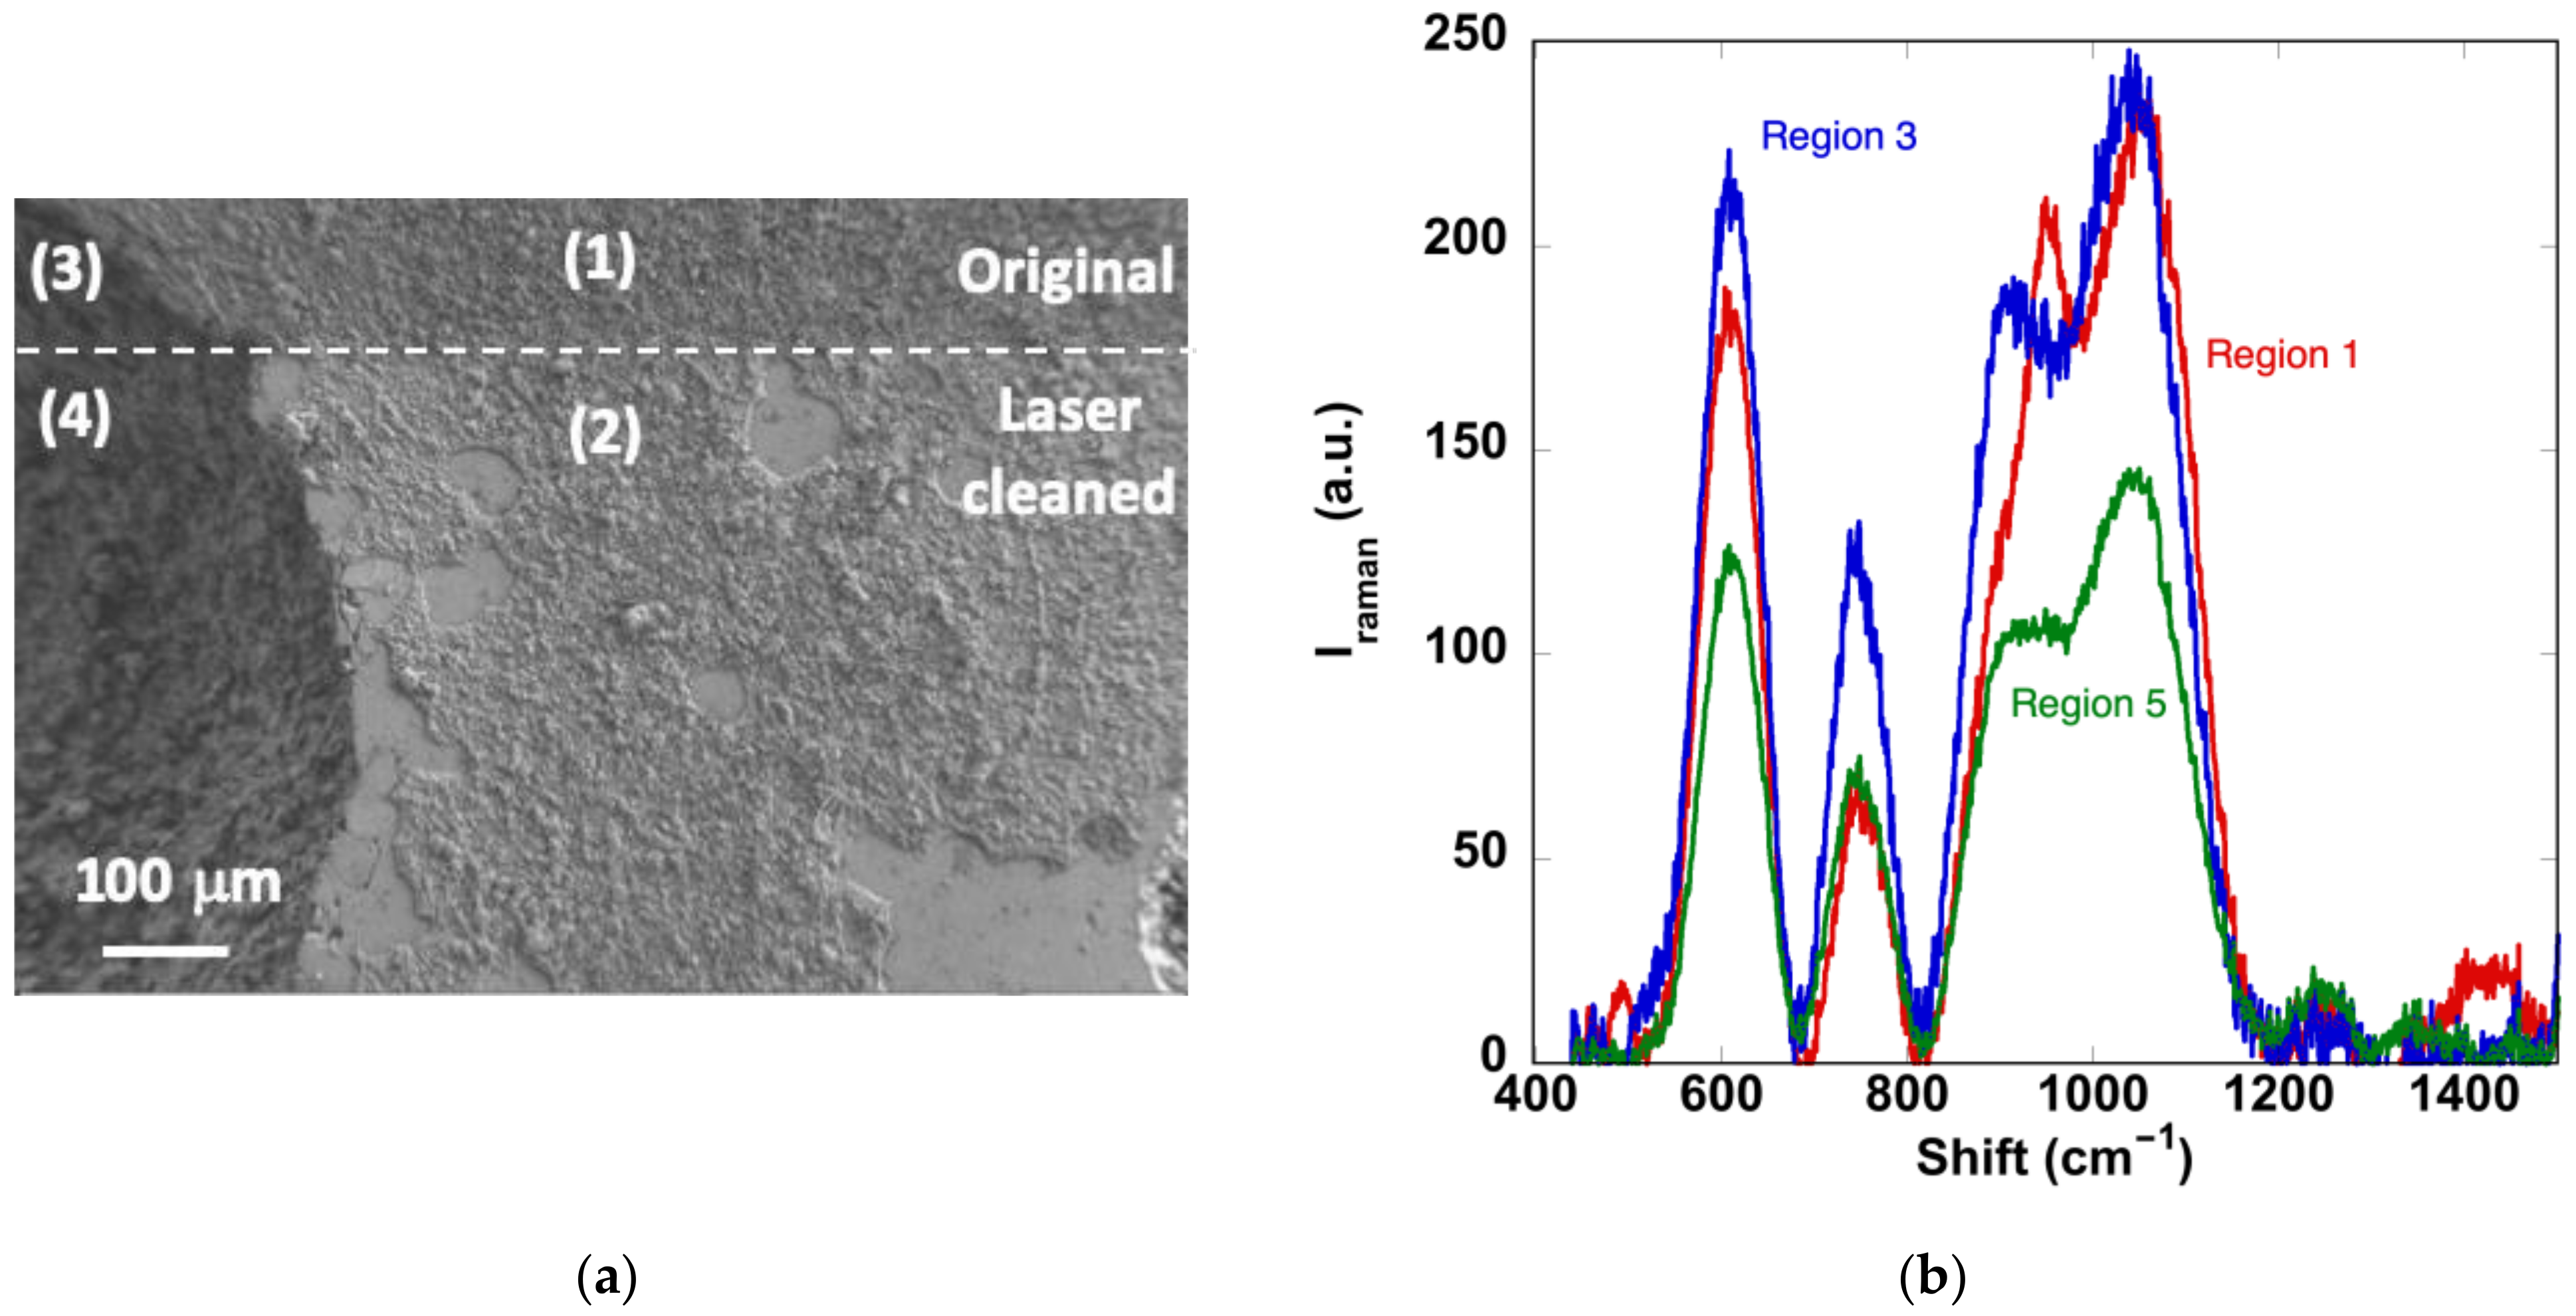
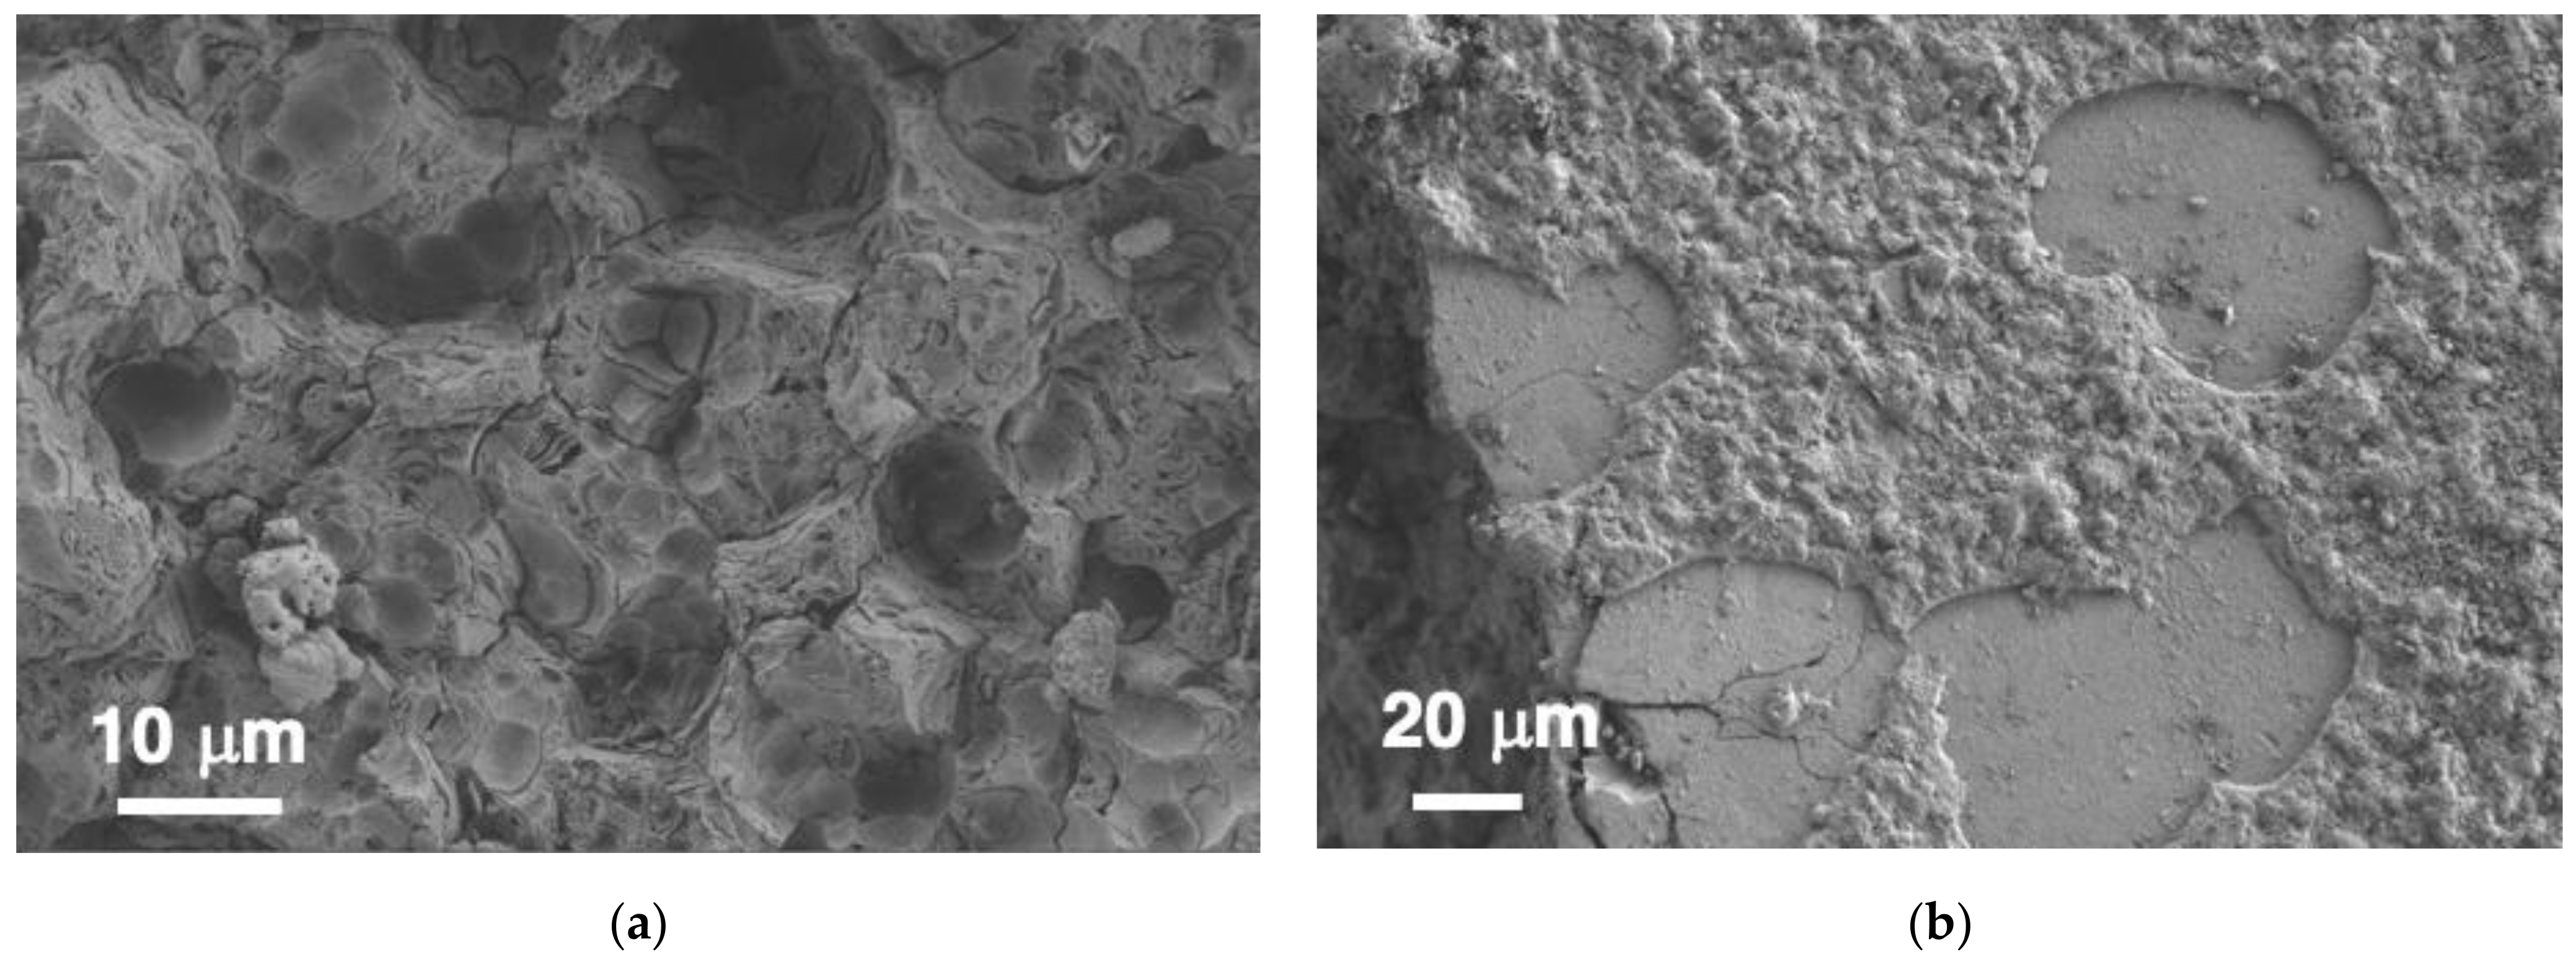
3.3. Laser-Cleaned Surfaces
4. Discussion
5. Conclusions
Supplementary Materials
Author Contributions
Funding
Data Availability Statement
Acknowledgments
Conflicts of Interest
References
- Altavilla, C.; Ciliberto, E.; La Delfa, S.; Panarello, S.; Scandurra, A. The Cleaning of Early Glasses: Investigation about the Reactivity of Different Chemical Treatments on the Surface of Ancient Glasses. Appl. Phys. A 2008, 92, 251–255. [Google Scholar] [CrossRef]
- Abd-Allah, R. Chemical Cleaning of Soiled Deposits and Encrustations on Archaeological Glass: A Diagnostic and Practical Study. J. Cult. Herit. 2013, 14, 97–108. [Google Scholar] [CrossRef]
- Murcia-Mascarós, S.; Foglia, P.; Santarelli, M.L.; Roldán, C.; Ibañez, R.; Muñoz, A.; Muñoz, P. A New Cleaning Method for Historic Stained Glass Windows. J. Cult. Herit. 2008, 9, e73–e80. [Google Scholar] [CrossRef]
- Römich, H.; Mottner, P.; Hildenhagen, J.; Dickmann, K.; Hettinger, G.; Bornschein, F. Comparison of Cleaning Methods for Stained Glass Windows. In Lasers in the Conservation of Artworks; Dickmann, K., Fotakis, C., Asmus, J.F., Eds.; Springer Proceedings in Physics; Springer: Berlin/Heidelberg, Germany, 2005; pp. 157–161. [Google Scholar] [CrossRef]
- Römich, H.; Dickmann, K.; Mottner, P.; Hildenhagen, J.; Müller, E. Laser Cleaning of Stained Glass Windows—Final Results of a Research Project. J. Cult. Herit. 2003, 4 (Suppl. 1), 112–117. [Google Scholar] [CrossRef]
- Striova, J.; Fontana, R.; Barbetti, I.; Pezzati, L.; Fedele, A.; Riminesi, C. Multisensorial Assessment of Laser Effects on Shellac Applied on Wall Paintings. Sensors 2021, 21, 3354. [Google Scholar] [CrossRef]
- Delgado, J.M.; Nunes, D.; Fortunato, E.; Laia, C.A.T.; Branco, L.C.; Vilarigues, M. The Effect of Three Luminescent Ionic Liquids on Corroded Glass Surfaces—A First Step into Stained-Glass Cleaning. Corros. Sci. 2017, 118, 109–117. [Google Scholar] [CrossRef]
- Fekrsanati, F.; Klein, S.; Hildenhagen, J.; Dickmann, K.; Marakis, Y.; Manousaki, A.; Zafiropulos, V. Investigations Regarding the Behaviour of Historic Glass and Its Surface Layers towards Different Wavelengths Applied for Laser Cleaning. J. Cult. Herit. 2001, 2, 253–258. [Google Scholar] [CrossRef]
- Carmona, N.; Villegas, M.A.; Fernández Navarro, J.M. Corrosion Behaviour of R2O–CaO–SiO2 Glasses Submitted to Accelerated Weathering. J. Eur. Ceram. Soc. 2005, 25, 903–910. [Google Scholar] [CrossRef]
- Majérus, O.; Lehuédé, P.; Biron, I.; Alloteau, F.; Narayanasamy, S.; Caurant, D. Glass Alteration in Atmospheric Conditions: Crossing Perspectives from Cultural Heritage, Glass Industry, and Nuclear Waste Management. NPJ Mater. Degrad. 2020, 4, 27. [Google Scholar] [CrossRef]
- Rodrigues, A.; Fearn, S.; Vilarigues, M. Historic K-Rich Silicate Glass Surface Alteration: Behaviour of High-Silica Content Matrices. Corros. Sci. 2018, 145, 249–261. [Google Scholar] [CrossRef]
- Garcia-Vallès, M.; Gimeno-Torrente, D.; Martínez-Manent, S.; Fernández-Turiel, J.L. Medieval Stained Glass in a Mediterranean Climate: Typology, Weathering and Glass Decay, and Associated Biomineralization Processes and Products. Am. Mineral. 2003, 88, 1996–2006. [Google Scholar] [CrossRef]
- Brill, R.H. Crizzling—A Problem in Glass Conservation. Stud. Conserv. 1975, 20, 121–134. [Google Scholar] [CrossRef]
- Palomar, T.; Chabas, A.; Bastidas, D.M.; de la Fuente, D.; Verney-Carron, A. Effect of Marine Aerosols on the Alteration of Silicate Glasses. J. Non-Cryst. Solids 2017, 471, 328–337. [Google Scholar] [CrossRef]
- Hench, L.L. Physical Chemistry of Glass Surfaces. J. Non-Cryst. Solids 1977, 25, 343–369. [Google Scholar] [CrossRef]
- Vilarigues, M.; Redol, P.; Machado, A.; Rodrigues, P.A.; Alves, L.C.; da Silva, R.C. Corrosion of 15th and Early 16th Century Stained Glass from the Monastery of Batalha Studied with External Ion Beam. Mater. Charact. 2011, 62, 211–217. [Google Scholar] [CrossRef]
- Gentaz, L.; Lombardo, T.; Loisel, C.; Chabas, A.; Vallotto, M. Early Stage of Weathering of Medieval-like Potash–Lime Model Glass: Evaluation of Key Factors. Environ. Sci. Pollut. Res. 2011, 18, 291–300. [Google Scholar] [CrossRef]
- Dal Bianco, B.; Bertoncello, R.; Milanese, L.; Barison, S. Glass corrosion across the alps: A surface study of chemical corrosion of glasses found in marine and ground environments. Archaeometry 2005, 47, 351–360. [Google Scholar] [CrossRef]
- Melcher, M.; Schreiner, M. Leaching Studies on Naturally Weathered Potash-Lime–Silica Glasses. J. Non-Cryst. Solids 2006, 352, 368–379. [Google Scholar] [CrossRef]
- Krumbein, W.E.; Urzì, C.E.; Gehrmann, C. Biocorrosion and Biodeterioration of Antique and Medieval Glass. Geomicrobiol. J. 1991, 9, 139–160. [Google Scholar] [CrossRef]
- Gorbushina, A.A.; Palinska, K.A. Biodeteriorative Processes on Glass: Experimental Proof of the Role of Fungi and Cyanobacteria. Aerobiologia 1999, 15, 183–192. [Google Scholar] [CrossRef]
- Lombardo, T.; Ionescu, A.; Lefèvre, R.A.; Chabas, A.; Ausset, P.; Cachier, H. Soiling of Silica-Soda-Lime Float Glass in Urban Environment: Measurements and Modelling. Atmos. Environ. 2005, 39, 989–997. [Google Scholar] [CrossRef]
- Kontozova-Deutsch, V.; Deutsch, F.; Godoi, R.H.M.; Van Grieken, R.; De Wael, K. Urban Air Pollutants and Their Micro Effects on Medieval Stained Glass Windows. Microchem. J. 2011, 99, 508–513. [Google Scholar] [CrossRef]
- Valinoti, A.; Neves, B.; da Silva, E.; Maia, L. Surface Degradation of Composite Resins by Acidic Medicines and PH-Cycling. J. Appl. Oral Sci. Rev. FOB 2008, 16, 257–265. [Google Scholar] [CrossRef]
- Tournié, A.; Ricciardi, P.; Colomban, P. Glass Corrosion Mechanisms: A Multiscale Analysis. Solid State Ion. 2008, 179, 2142–2154. [Google Scholar] [CrossRef]
- Iglesias-Campos, M.A. Effects of Mechanical Cleaning by Manual Brushing and Abrasive Blasting on Lime Render Coatings on Architectural Heritage. Mater. Constr. 2014, 64, e039. [Google Scholar] [CrossRef]
- Ibrahim, H.I.; Hamoudi, W.K.; Edan, M.S. Nanosecond Nd: YAG Laser Surface Cleaning of Metals and Marbles. Iraqi J. Laser 2015, 14, 21–26. [Google Scholar]
- Pouli, P.; Paun, I.-A.; Bounos, G.; Georgiou, S.; Fotakis, C. The Potential of UV Femtosecond Laser Ablation for Varnish Removal in the Restoration of Painted Works of Art. Appl. Surf. Sci. 2008, 254, 6875–6879. [Google Scholar] [CrossRef]
- Nevin, A.; Pouli, P.; Georgiou, S.; Fotakis, C. Laser Conservation of Art. Nat. Mater. 2007, 6, 320–322. [Google Scholar] [CrossRef]
- Teule, R.; Scholten, H.; van den Brink, O.F.; Heeren, R.M.A.; Zafiropulos, V.; Hesterman, R.; Castillejo, M.; Martín, M.; Ullenius, U.; Larsson, I.; et al. Controlled UV Laser Cleaning of Painted Artworks: A Systematic Effect Study on Egg Tempera Paint Samples. J. Cult. Herit. 2003, 4, 209–215. [Google Scholar] [CrossRef]
- Miller, J.C. 1. Introduction to Laser Desorption and Ablation. In Laser Ablation and Desorption; Miller, J.C., Haglund, R.F., Eds.; Experimental Methods in the Physical Sciences; Academic Press: Cambridge, MA, USA, 1997; Volume 30, pp. 1–13. [Google Scholar] [CrossRef]
- Siano, S.; Agresti, J.; Cacciari, I.; Ciofini, D.; Mascalchi, M.; Osticioli, I.; Mencaglia, A.A. Laser Cleaning in Conservation of Stone, Metal, and Painted Artifacts: State of the Art and New Insights on the Use of the Nd:YAG Lasers. Appl. Phys. A 2012, 106, 419–446. [Google Scholar] [CrossRef]
- Esbert, R.M.; Grossi, C.M.; Rojo, A.; Alonso, F.J.; Montoto, M.; Ordaz, J.; de Andrés, M.C.P.; Escudero, C.; Barrera, M.; Sebastián, E.; et al. Application Limits of Q-Switched Nd:YAG Laser Irradiation for Stone Cleaning Based on Colour Measurements. J. Cult. Herit. 2003, 4, 50–55. [Google Scholar] [CrossRef]
- Maingi, E.M.; Alonso, M.P.; Angurel, L.A.; Rahman, M.A.; Chapoulie, R.; Dubernet, S.; de la Fuente, G.F. Historical Stained-Glass Window Laser Preservation: The Heat Accumulation Challenge. Bol. Soc. Esp. Ceram. Vidr. 2022, 61, S69–S82. [Google Scholar] [CrossRef]
- Rahman, M.A.; de la Fuente, G.F.; Carretero, J.M.; Maingi, E.M.; Alonso Abad, M.P.; Alonso Alcalde, R.; Chapoulie, R.; Schiavon, N.; Angurel, L.A. Sub-Ns-Pulsed Laser Cleaning of an Archaeological Bone from the Sierra de Atapuerca, Spain: A Case Study. SN Appl. Sci. 2021, 3, 865. [Google Scholar] [CrossRef]
- Lahoz, R.; Angurel, L.A.; Brauch, U.; Estepa, L.C.; de la Fuente, G. Laser Applications in the Preservation of Cultural Heritage: An Overview of Fundamentals and Applications of Lasers in the Preservation of Cultural Heritage. In Con-Servation Science for the Cultural Heritage: Applications of Instrumen; Varella, E.A., Ed.; Springer: Berlin/Heidelberg, Germany, 2013; pp. 294–332. [Google Scholar] [CrossRef]
- Maingi, E.M. Laser Based Intervention in Historical Stained-Glasses. Ph.D. Thesis, University of Burgos, Burgos, Spain, University of Bordeaux Montaigne, Bordeaux, France, 2022. [Google Scholar]
- Papanikolaou, A.; Siozos, P.; Philippidis, A.; Melessanaki, K.; Pouli, P. Towards the Understanding of the Two Wavelength Laser Cleaning in Avoiding Yellowing on Stonework: A Micro-Raman and LIBS Study; Nicolaus Copernicus University Press: Toruń, Poland, 2017; pp. 95–104. [Google Scholar] [CrossRef]
- Vergès-Belmin, V.; Rolland, O.; Jourd’heuil, I.; Guiavarc’h, M.; Zanini, A. Nd:YAG Long Q-Switched versus Short Free-Running Laser Cleaning Trials at Chartres Cathedral, France. Stud. Conserv. 2015, 60, S12–S18. [Google Scholar] [CrossRef]
- Zanini, A.; Trafeli, V.; Bartoli, L. The Laser as a Tool for the Cleaning of Cultural Heritage. IOP Conf. Ser. Mater. Sci. Eng. 2018, 364, 012078. [Google Scholar] [CrossRef]
- Fekrsanati, F.; Hildenhagen, J.; Dickmann, K.; Troll, C.; Drewello, U.; Olaineck, C. UV-Laser Radiation: Basic Research of the Potential for Cleaning Stained Glass. J. Cult. Herit. 2000, 1, S155–S160. [Google Scholar] [CrossRef]
- Römich, H.; Weinmann, A. Laser Cleaning of Stained Glass Windows. Overview on an Interdisciplinary Project. J. Cult. Herit. 2000, 1, S151–S154. [Google Scholar] [CrossRef]
- Ueda, M.; Makino, R.; Kagawa, K.; Nishiyama, B. Laser Cleaning of Glass. Opt. Lasers Eng. 1991, 15, 275–278. [Google Scholar] [CrossRef]
- Matteini, M.; Lalli, C.; Tosini, I.; Giusti, A.; Siano, S. Laser and Chemical Cleaning Tests for the Conservation of the Porta Del Paradiso by Lorenzo Ghiberti. J. Cult. Herit. 2003, 4, 147–151. [Google Scholar] [CrossRef]
- Drewello, U.; Weißmann, R.; Rölleke, S.; Müller, E.; Wuertz, S.; Fekrsanati, F.; Troll, C.; Drewello, R. Biogenic Surface Layers on Historical Window Glass and the Effect of Excimer Laser Cleaning. J. Cult. Herit. 2000, 1, S161–S171. [Google Scholar] [CrossRef]
- Echlin, M.P.; Straw, M.; Randolph, S.; Filevich, J.; Pollock, T.M. The TriBeam System: Femtosecond Laser Ablation in Situ SEM. Mater. Charact. 2015, 100, 1–12. [Google Scholar] [CrossRef]
- Wu, J.; Zhang, Y.; Li, L.; Ren, Y.; Lu, Q.; Wang, L.; Chen, F. Raman Spectra Study on Modifications of BK7 Glass Induced by 1030-nm and 515-nm Femtosecond Laser. Results Phys. 2021, 21, 103814. [Google Scholar] [CrossRef]
- Pouli, P.; Bounos, G.; Georgiou, S.; Fotakis, C. Femtosecond Laser Cleaning of Painted Artefacts; Is This the Way Forward? In Lasers in the Conservation of Artworks; Nimmrichter, J., Kautek, W., Schreiner, M., Eds.; Springer: Berlin/Heidelberg, Germany, 2007; pp. 287–293. [Google Scholar]
- Zhang, H.; Eaton, S.M.; Li, J.; Herman, P.R. Heat Accumulation during High Repetition Rate Ultrafast Laser Interaction: Waveguide Writing in Borosilicate Glass. J. Phy. Conf. Ser. 2007, 59, 682–686. [Google Scholar] [CrossRef]
- Weber, R.; Graf, T.; Berger, P.; Onuseit, V.; Wiedenmann, M.; Freitag, C.; Feuer, A. Heat Accumulation during Pulsed Laser Materials Processing. Opt. Express 2014, 22, 11312. [Google Scholar] [CrossRef]
- Silverson. Dispersion and Hydration of Carbopol. Available online: https://www.silverson.com/us/resource-library/application-reports/dispersion-and-hydration-of-carbopol (accessed on 1 February 2023).
- C.T.S. España S.L. Available online: https://shop-espana.ctseurope.com/234-carbogel (accessed on 1 February 2023).
- Tomasini, E.P.; Gómez, B.; Halac, E.B.; Reinoso, M.; Di Liscia, E.J.; Siracusano, G.; Maier, M.S. Identification of Carbon-Based Black Pigments in Four South American Polychrome Wooden Sculptures by Raman Microscopy. Herit. Sci. 2015, 3, 19. [Google Scholar] [CrossRef] [Green Version]
- Robinet, L.; Neff, D.D.; Bouquillon, A.; Pagès-Camagna, S.; Verney-Carron, A.; Etcheverry, M.-P.; Tate, J. Raman Spectrometry, a Non-Destructive Solution to the Study of Glass and Its Alteration. Glass Ceram. 2008, 1, 190–197. [Google Scholar]


| %wt | SiO2 | CaO | Na2O | K2O | MgO | Al2O3 | P2O5 |
|---|---|---|---|---|---|---|---|
| 59.3 | 10.3 | 3.1 | 14.9 | 7.6 | 1.8 | 3.3 |
| % at | C | O | Si | Ca | K | Al | Na | Mg | Fe | Pb | S | P |
|---|---|---|---|---|---|---|---|---|---|---|---|---|
| Crust (Region C) | 25.4 | 51.9 | 13.1 | 2.2 | 0.4 | 2.3 | 0.5 | 1.6 | 0.7 | 1.5 | 0.5 | |
| Pitting (Region P) | 12.3 | 59.6 | 22.9 | 2.3 | 0.4 | 1.0 | 1.1 | |||||
| Glass | 60.6 | 21.4 | 4.0 | 6.8 | 0.7 | 2.2 | 4.1 | 1.0 |
| % at | C | O | Si | Ca | K | Al | Mg | Fe | Pb | S | P |
|---|---|---|---|---|---|---|---|---|---|---|---|
| Crust region | 14.0 | 57.6 | 21.0 | 1.4 | 0.5 | 2.7 | 0.3 | 1.3 | 0.5 | 0.7 | |
| Pitting | 13.5 | 57.8 | 26.9 | 0.7 | 1.1 |
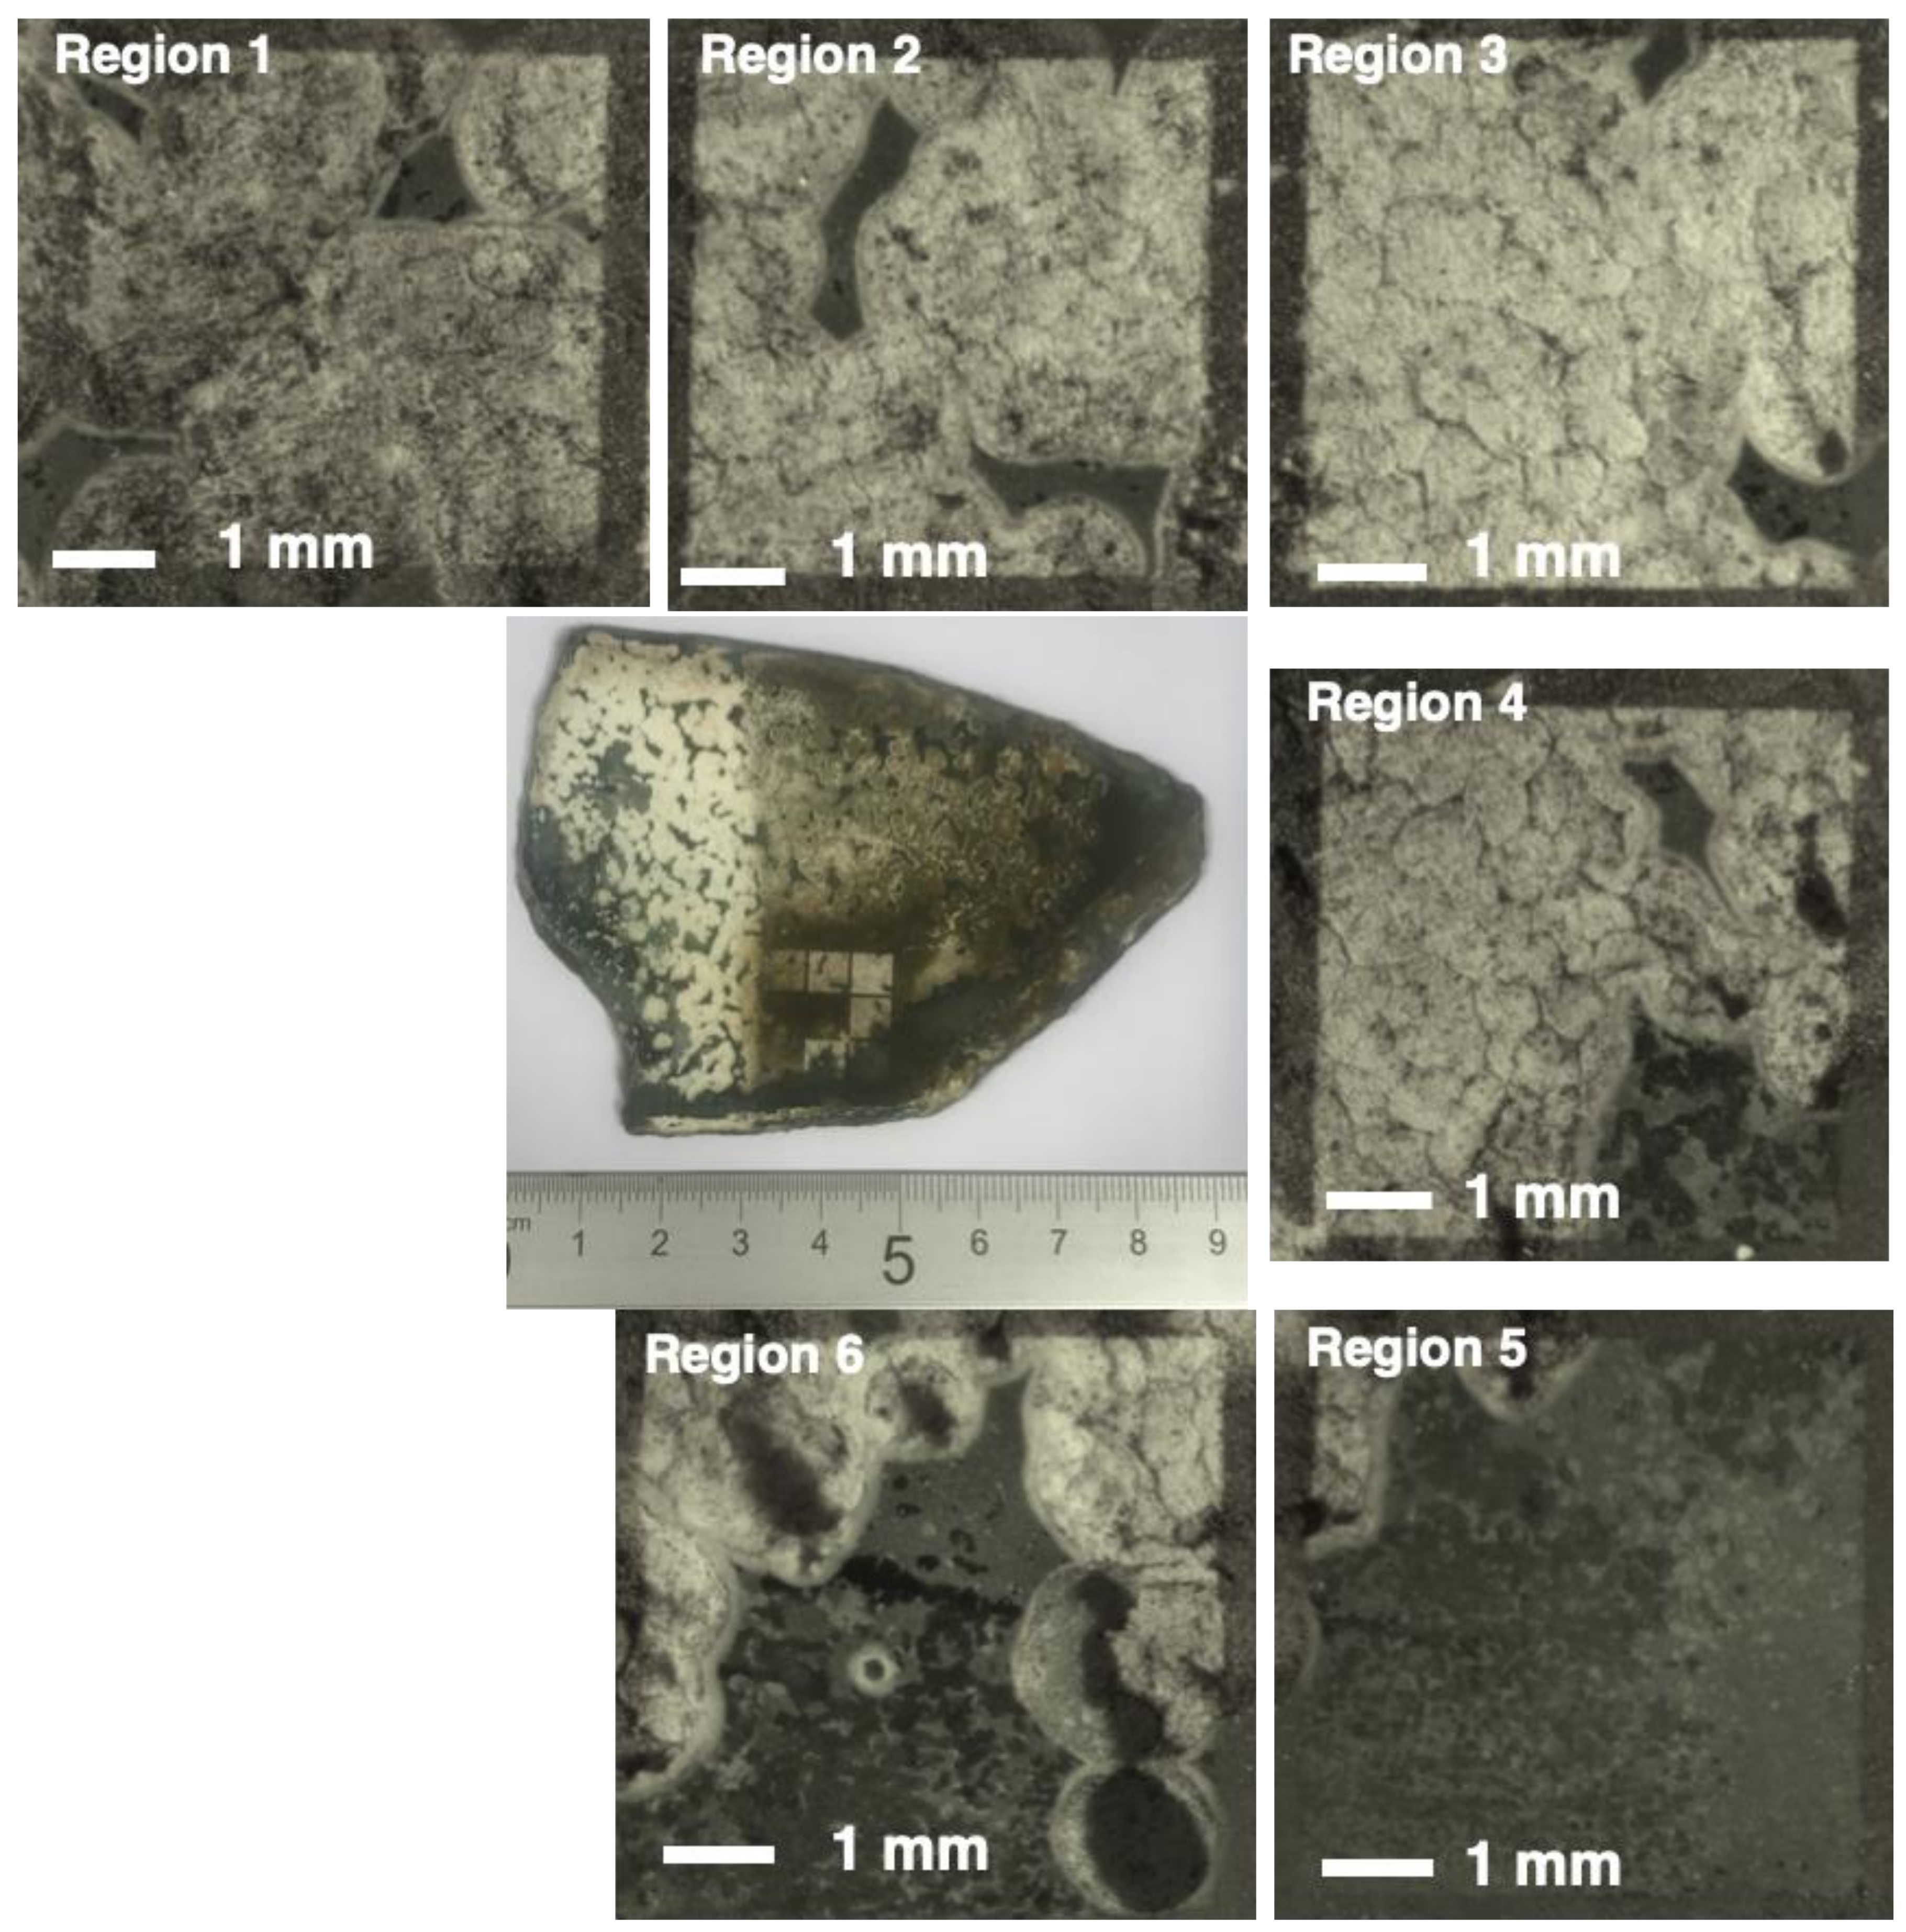
| Region 1 | Region 2 | Region 3 | Region 4 | Region 5 | Region 6 | |
|---|---|---|---|---|---|---|
| Number of scans | 5 | 20 | 100 | 20 | 20 | 50 |
| % at | C | O | Si | Ca | K | Al | Mg | Fe | Pb | S | P |
|---|---|---|---|---|---|---|---|---|---|---|---|
| No laser (7.1) | 45.7 | 43.2 | 6.7 | 1.0 | 1.1 | 0.3 | 1.2 | 0.2 | 0.4 | ||
| Cleaned (7.2) | 5.8 | 63.0 | 25.1 | 1.1 | 0.4 | 2.6 | 0.6 | 1.4 | |||
| Pitting no laser (7.3) | 49.4 | 42.2 | 4.4 | 1.9 | 0.9 | 0.3 | 0.9 | ||||
| Pitting cleaned (7.4) | 6.3 | 56.8 | 31.3 | 2.5 | 0.4 | 1.5 | 1.1 |
Disclaimer/Publisher’s Note: The statements, opinions and data contained in all publications are solely those of the individual author(s) and contributor(s) and not of MDPI and/or the editor(s). MDPI and/or the editor(s) disclaim responsibility for any injury to people or property resulting from any ideas, methods, instructions or products referred to in the content. |
© 2023 by the authors. Licensee MDPI, Basel, Switzerland. This article is an open access article distributed under the terms and conditions of the Creative Commons Attribution (CC BY) license (https://creativecommons.org/licenses/by/4.0/).
Share and Cite
Maingi, E.M.; Alonso, M.P.; Angurel, L.A.; de la Fuente, G.F.; Dubernet, S.; Chapoulie, R.; Mellouët, O.; Vally, E. Chemical and Laser Cleaning of Corrosion Encrustations on Historical Stained Glass: A Comparative Study. Heritage 2023, 6, 1942-1957. https://doi.org/10.3390/heritage6020104
Maingi EM, Alonso MP, Angurel LA, de la Fuente GF, Dubernet S, Chapoulie R, Mellouët O, Vally E. Chemical and Laser Cleaning of Corrosion Encrustations on Historical Stained Glass: A Comparative Study. Heritage. 2023; 6(2):1942-1957. https://doi.org/10.3390/heritage6020104
Chicago/Turabian StyleMaingi, Evan Maina, María P. Alonso, Luis A. Angurel, German F. de la Fuente, Stéphan Dubernet, Rémy Chapoulie, Oriane Mellouët, and Elodie Vally. 2023. "Chemical and Laser Cleaning of Corrosion Encrustations on Historical Stained Glass: A Comparative Study" Heritage 6, no. 2: 1942-1957. https://doi.org/10.3390/heritage6020104