
Increased Hg Methylation Risks in Management-Induced Terrain Depressions in Forests with Organic-Matter-Rich Soils


Latvian State Forest Research Institute “Silava”, Riga Street 111, LV-2169 Salaspils, Latvia
*
Author to whom correspondence should be addressed.
Hydrology 2024, 11(2), 26; https://doi.org/10.3390/hydrology11020026
Submission received: 17 January 2024
/
Revised: 7 February 2024
/
Accepted: 9 February 2024
/
Published: 13 February 2024
Abstract
:Mercury (Hg) is a toxic contaminant that bioaccumulates in trophic chains in its organic form—methylmercury (MeHg). Hg methylation is driven by microorganisms in favourable conditions, stagnant water pools being among potential methylation hotspots. In the present study, we estimated the total Hg and MeHg concentrations in the sediments of water-filled management-induced terrain depressions (ruts, mounding pits and a partly functional drainage ditch) and in nearby undisturbed soil in six hemiboreal forest sites with organic-matter-rich soils in Latvia. Environmental samples were taken in the spring, summer and autumn of 2022. Furthermore, we evaluated the risks of element leaching from the depressions using high-resolution digital terrain models (DTM) and meteorological data. The results suggested a possible leaching of Hg in the past as THg concentrations in the sediments of the depressions were significantly lower than in the surrounding soil. Furthermore, significantly higher MeHg and %MeHg concentrations were found in the sediments than in the surrounding soil identifying the management-induced depressions as Hg methylation hotspots. Spatial analysis of the DTMs pointed to a very likely periodical leaching of elements from the depressions during high precipitation episodes as well as during snowmelts. Moreover, it was observed that ruts left by heavy machinery often channel surface runoff.
Keywords:
mercury; methylmercury; ruts; mounding pits; soil disturbance; sediments; soil; remote sensing1. Introduction
Mercury (Hg), a highly toxic, mobile and bioaccumulative contaminant, poses serious threats to environment; furthermore, Hg has no biological function nor role in ecosystems [1]. Even low doses of Hg are harmful to plants [2], it adversely affects animals, especially in aquatic environments [3], and poses serious health concerns globally (e.g., [4,5,6]. The Minamata Convention on Mercury, adopted in 2013, draws attention to human health and environmental quality risks related to Hg exposure, highlights its sources and distribution pathways and foresees measures to reduce and control Hg emissions [7].
Hg is released in the environment naturally, e.g., via volcanic activity [8,9], soil and aquatic microbial processes [10,11] and vegetation turnover [12,13,14,15], and as a result of human activity, such as mining, smelting and fossil fuel combustion [16,17]. Anthropogenic Hg emissions with the major contribution of fossil-fuel fired power plants [18] significantly outweigh natural emissions [19].
Monomethylmercury (MeHg) production is the main link between the input of inorganic Hg and health risks [20]. Methylation of Hg is a microorganism-driven process, mainly depending on the structure of the microbial community, the amount of organic matter and the availability of nutrients and electron acceptors (e.g., sulphate and iron) [21].
Climate change certainly plays a significant role in magnifying Hg-related risks [22]. On a global scale, Arctic warming is predicted to increase Hg fluxes and alter their direction [10]. There are concerns that an increasing amount of precipitation [23] may bring larger amounts of Hg to the soil in the form of wet deposition, as well as enhance surface runoff, thus favouring Hg mobility, while increasing air and soil temperatures may shift the composition of microbial communities towards ones that enhance MeHg production [24].
Among vegetated areas, forests have the highest Hg concentrations in the soil [25] as well as higher Hg emissions [16]. According to Jiskra et al., 2015 [26], the majority of Hg in boreal forest soils originates from litter deposition, and Hg concentrations in lichen and mosses exceed those in vascular plants [15].
By mobilizing Hg from the soil, forest management operations, such as clearfelling, drainage network maintenance and soil preparation, may contribute to increases in the loads and concentrations of Hg in surface waters [27]. A study from Sweden highlights an increasing trend in Hg concentrations in fish from freshwater lakes after adjacent forest harvesting [28]; however, the results display high variation by location and treatment. The results of an overall assessment of terrestrial Hg cycling suggest that, depending on the region, the influence of forestry on surface water Hg content is small to medium, with a trend to increase towards northern latitudes [10]. Forestry operations may especially enhance MeHg formation and exports (e.g., [29,30,31,32]). Previous research suggests that logging-related soil disturbance, excessive soil moisture and increased organic matter content may create Hg methylation hotspots in managed forest landscapes (e.g., [33,34]).
Generally, forestry impacts on Hg mobilization are manifested either by changes in site hydrology or conditions for methylators [35]. The formation of ruts following the movement of heavy forest machinery, especially in fine-textured, waterlogged soils, has an impact on both these aspects [36]. Due to soil compaction, the ruts often form pools of stagnant, oxygen-poor water that, often together with decomposing logging residues, create favourable conditions for methylating microorganisms [37]. Ruts may also function as pathways for water movement, and, especially in case of extreme precipitation events, enhance the overland flow and Hg export to waterbodies [38].
Since 2010, the quantity of published studies regarding forestry’s effects on Hg and MeHg cycling has doubled, encompassing a broader spectrum of focused, process-oriented investigations. However, the variation in Hg response to forestry activities still exhibits significant diversity [10]. The understanding of how harvesting affects Hg methylation and MeHg concentrations in forest soils and stream sediment remains incomplete [39]. Topography and hydrological connectivity are key factors influencing Hg responses to forest disturbances [10]. Hydrological connectivity plays a crucial role in MeHg transport, highlighting the importance of considering landscape dynamics in forest management strategies [32,33]. Considering the above, a better understanding of the factors driving the methylation processes and Hg spatial movement is needed.
In the present study, we tested water, sediment and nearby soil samples for Hg, MeHg and various other chemical and physical parameters related to forestry management-induced terrain depressions such as ruts made by heavy forestry machinery, mounding pits and a drainage ditch in organic-matter-rich soils in hemiboreal conditions. Furthermore, we obtained and used high-resolution digital terrain models (DTM) for the analysis of hydrological connectivity. The aim of our study was (1) to compare total Hg, MeHg as well as percent MeHg of THg (%MeHg) in the sediments of forest management-induced terrain depressions and nearby undisturbed soil and potentially identify the drivers of Hg methylation and (2) to explore the increased risks of MeHg leaching into watercourses related to water movement pathways on a local scale. We tested the hypothesis that management-induced terrain depressions where the presence of stagnant water is a common occurrence even during summer months provide more suitable conditions to form Hg methylation hotspots than undisturbed soil.
2. Materials and Methods
2.1. Study Sites
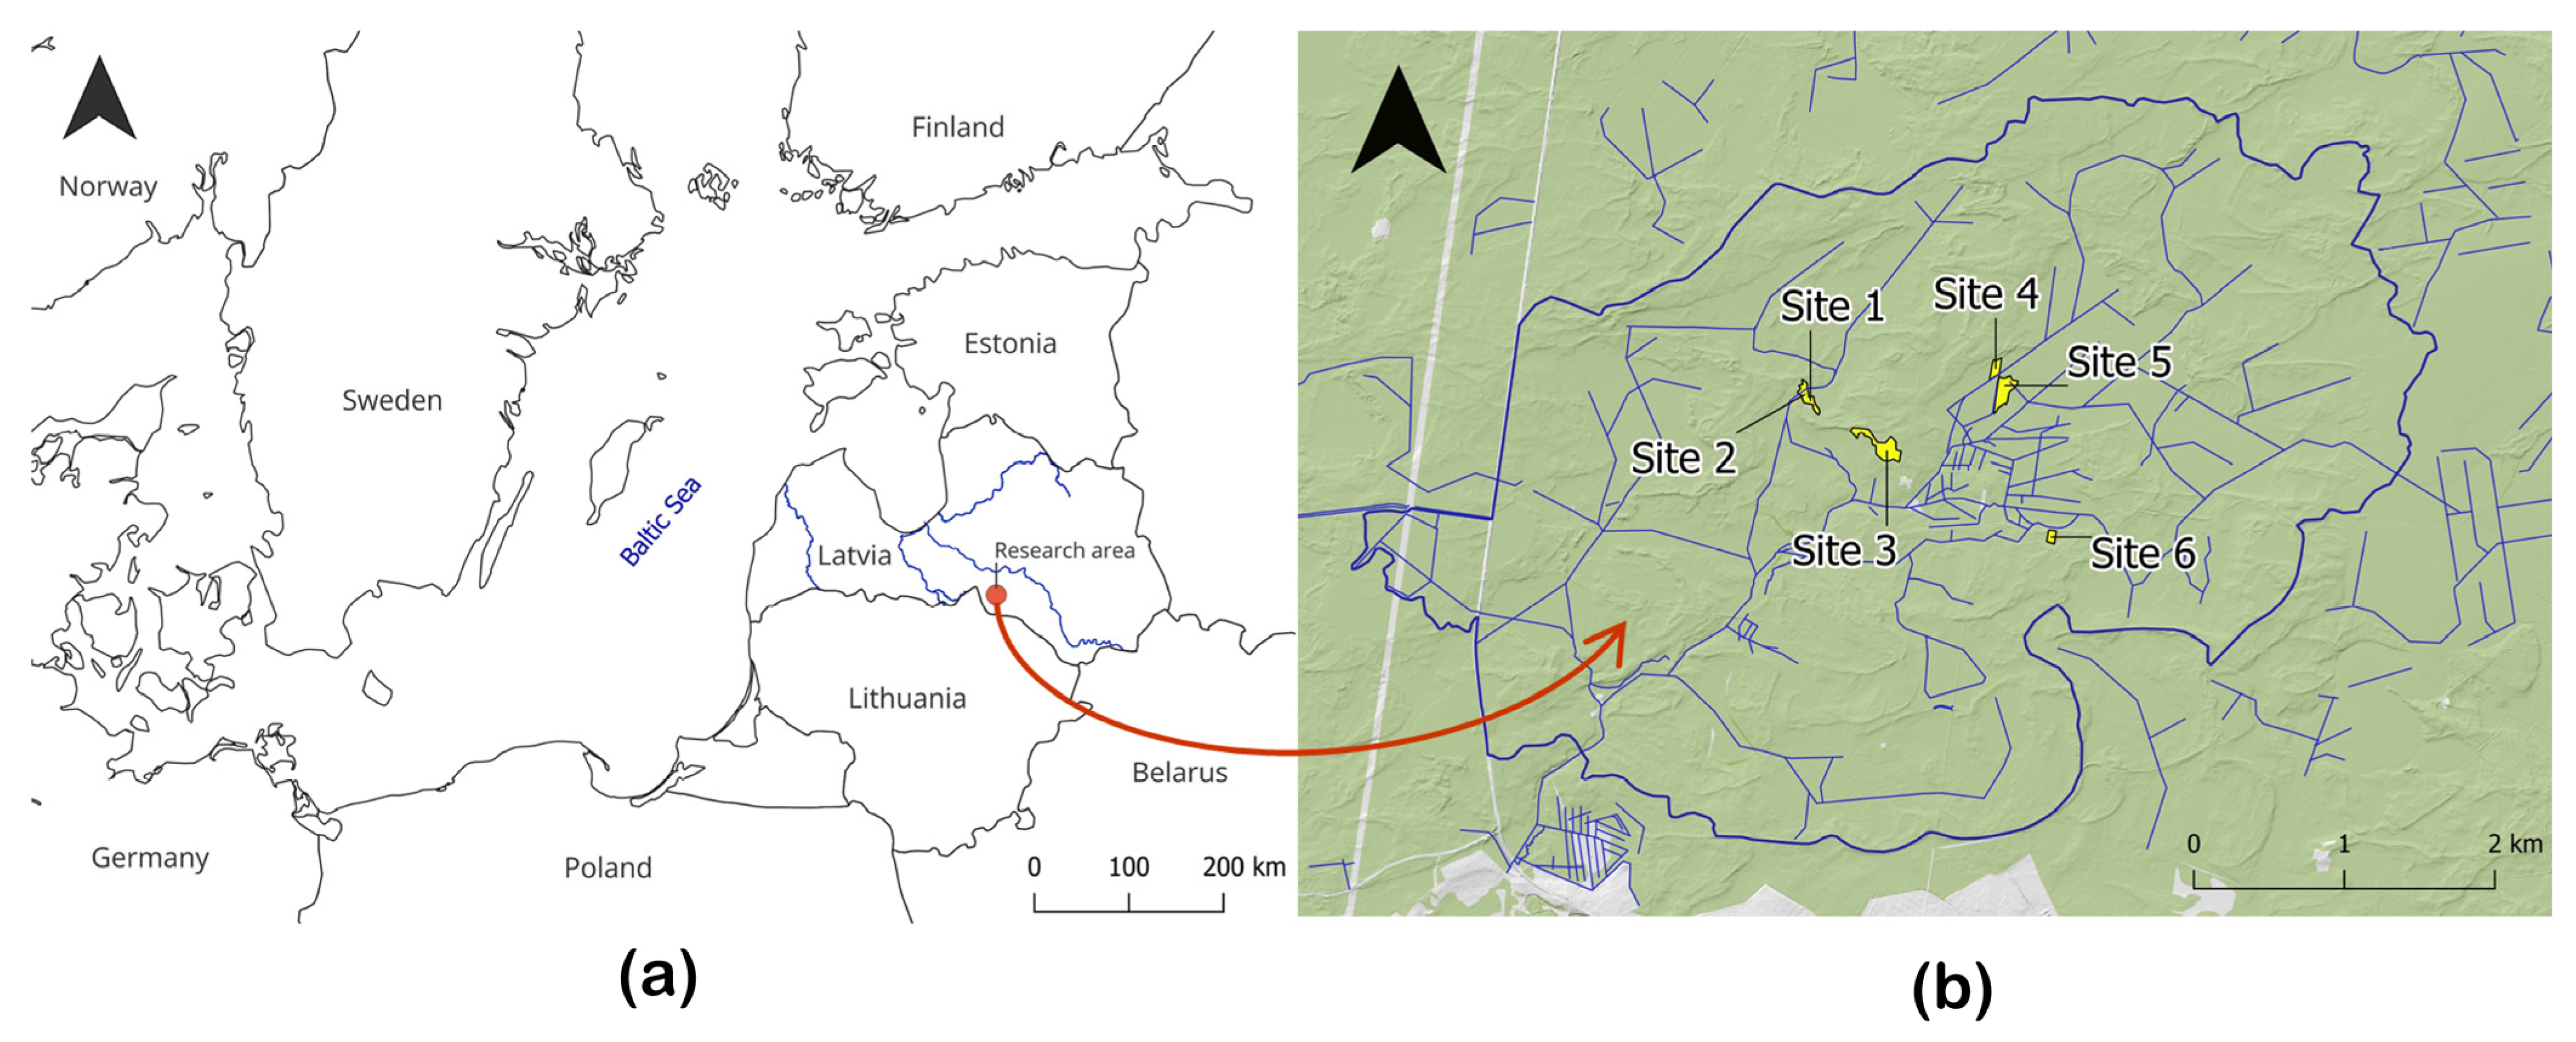
This study was conducted in the Zalvīte stream catchment located in a forested area in central Latvia (Aizkraukles novads, Zalves pagasts) (Figure 1) belonging to the hemiboreal region. Total area of the Zalvīte stream catchment is 2212.4 ha including 2141.8 ha (slightly more than 95% of total area) of forest land managed according to business-as-usual forestry practices. In the Zalvīte stream catchment, the dominant tree species in forest compartments are Scots pine (Picea abies (L.))—42%, Norway spruce (Pinus sylvestris (L.))—21% and silver birch (Betula pendula)—23% from the total forest area in the catchment.
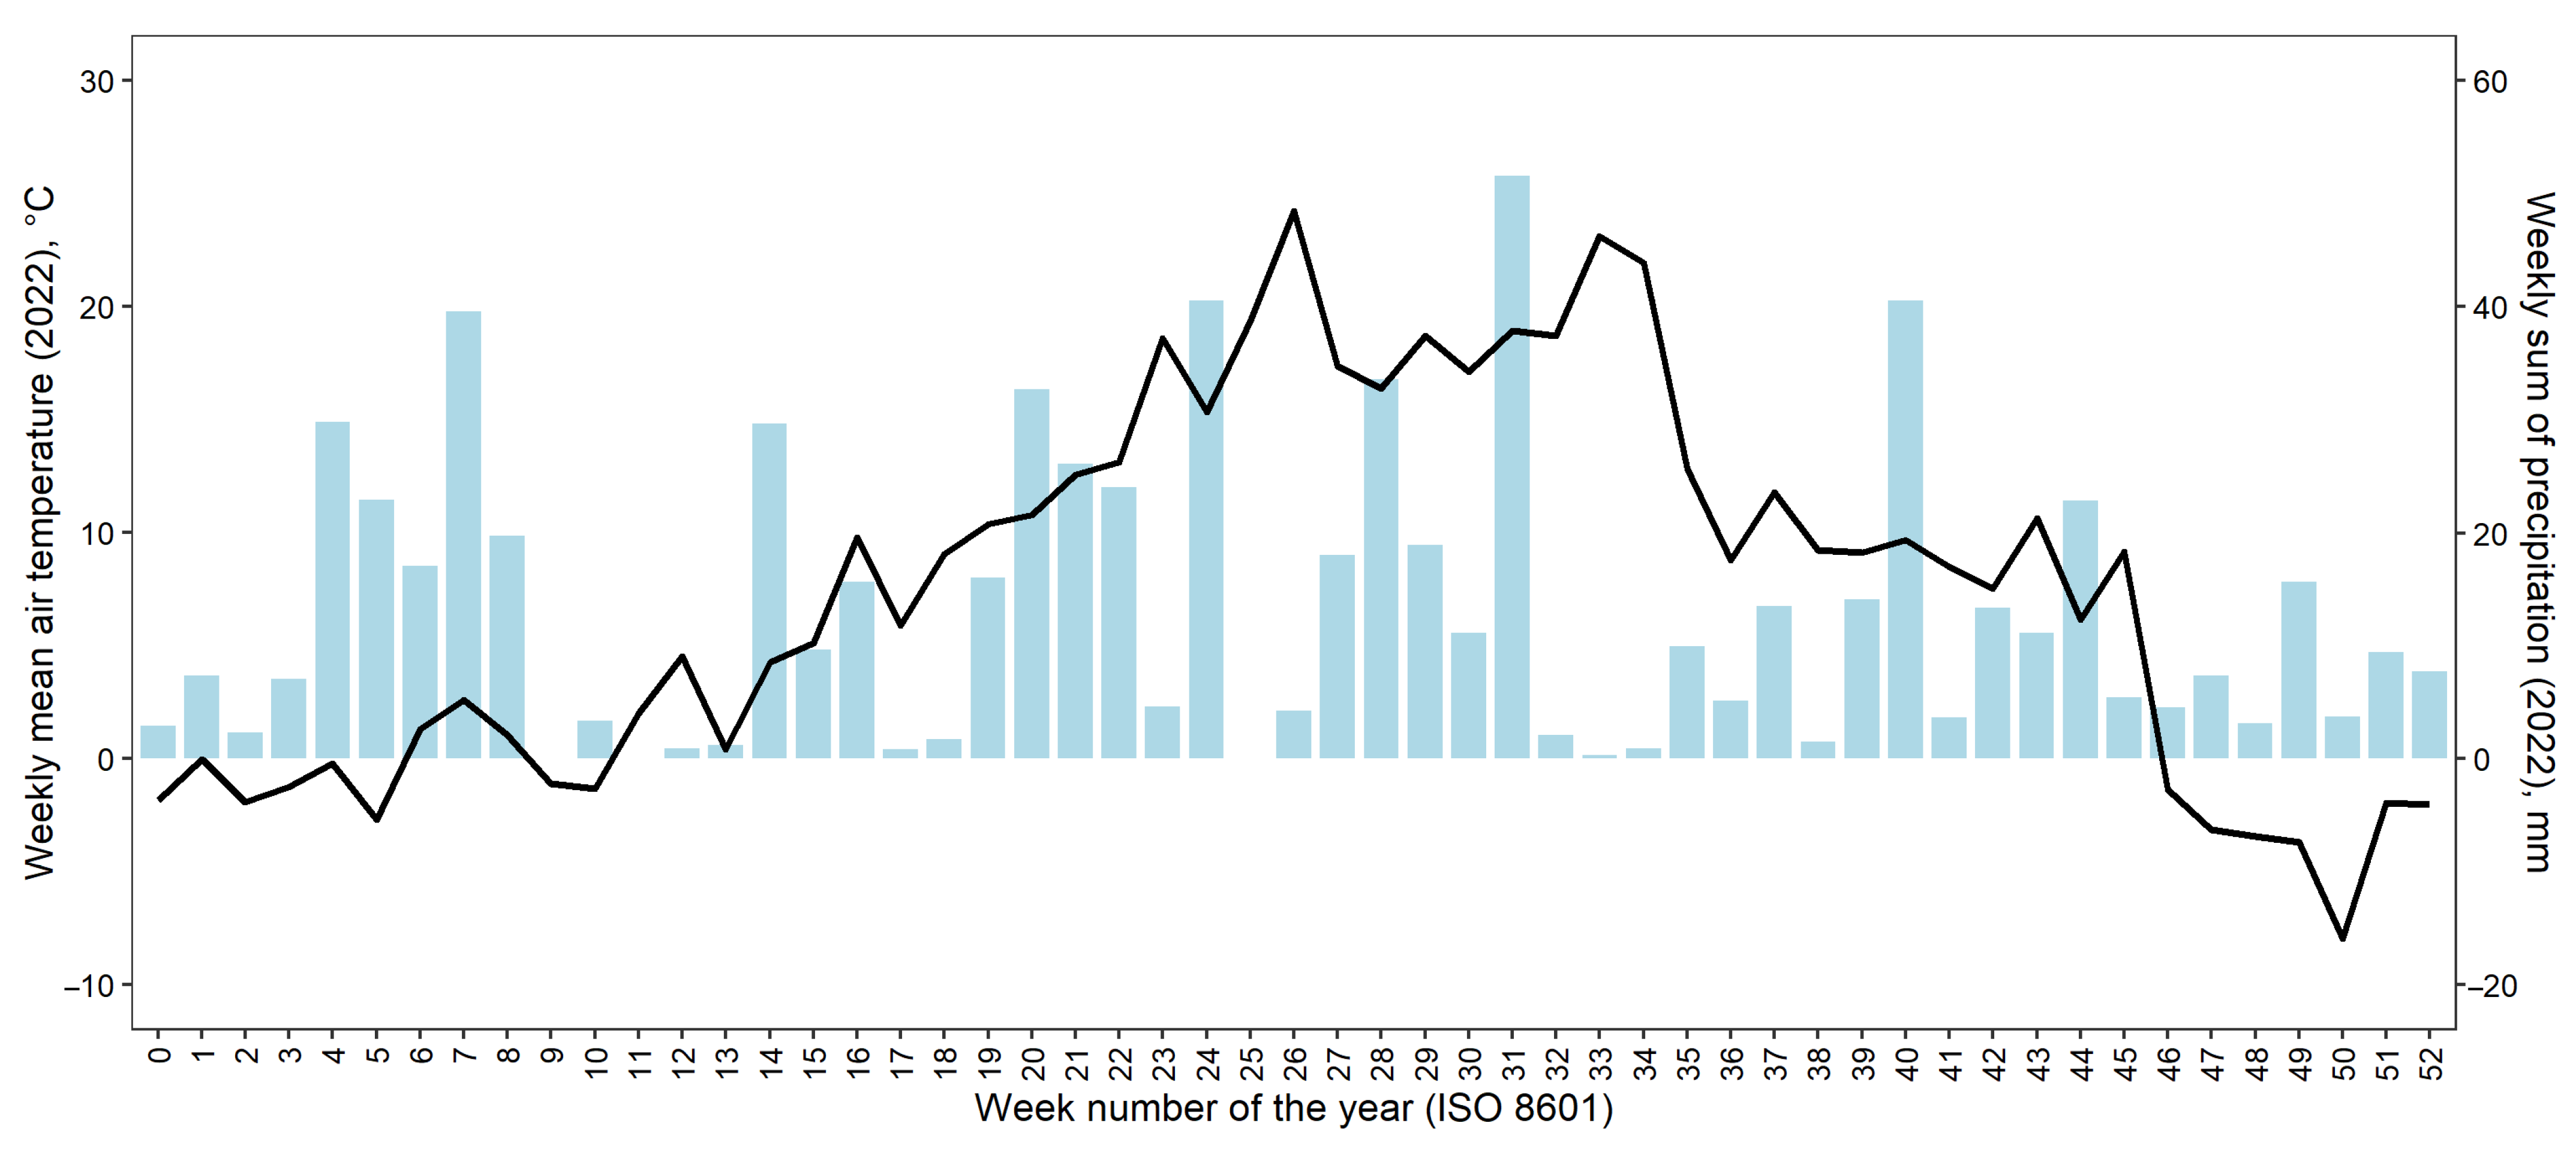
In the central part of the Zalvīte stream catchment, a local meteorological station was installed in 2018 to record hourly precipitation and temperature in an open field at a height of 10 m. In 2022, the mean annual precipitation in the study area was 688 mm, which is very close to climate normal for 1991–2020 (685 mm), and the mean annual air temperature was 7.6 °C, which is above the climate normal (6.8 °C) [40] (Figure 2). The minimum mean monthly temperature recorded was −4.4 °C (December 2022), and the maximum mean monthly temperature recorded was 20.3 °C (August 2022).
A total of six study sites with organic-matter-rich soils and management induced terrain depressions in forest compartments where clearfelling has recently been carried out were selected across the study area (Table 1). Three sampling points in heavy logging machinery ruts or mounding pits were selected at each site except for Site 2 where an additional point was placed in a partly functional drainage ditch.
2.2. Soil and Sediment Sampling and Analysis
At each study site, at each sampling point and sampling time, two samples were taken: (i) sediment samples from terrain depressions (mounding pit, heavy forest machinery rut, partly functional drainage ditch) filled with standing water; (ii) undisturbed soil samples taken right next to each terrain depression sampling point. Soil and sediment samples were taken from the upper soil/sediment layer (0–5 cm) three times a year: spring (12 May 2022), summer (11 August 2022) and autumn (2 November 2022). Before each soil and sediment sampling, the equipment was washed with deionized water. The sediment and soil samples were homogenized without hesitation and split into two subsamples: one subsample for total Hg (THg) and MeHg analyses, and the second subsample for analyses of general chemical characteristics.
Sediment and soil subsamples intended for THg and MeHg analysis (~80 mL) were immediately placed in sterile plastic containers, frozen and transported on dry ice to the Forest Environment Laboratory at the Latvian State Forest Research Institute “Silava” (LSFRI Silava) where they were stored at −80 °C until further processing, including freeze-drying for 72 h at −55 °C (STERIS GmbH, LYOVAC GT2-E). After freeze-drying, the sediment and soil subsamples were transported to the Jožef Stefan Institute in Ljubljana, Slovenia, where THg and MeHg analysis were performed. THg concentrations in sediment and soil subsamples were determined using a Hg analyser RA-915M with a PYRO-915+ thermal decomposition attachment (Lumex Scientific, St. Petersburg, Russia) that is based on differential Zeeman atomic absorption spectrometry using high frequency modulation of light polarization; limit of detection (LOD) was 1.00 ng g−1. MeHg concentration in sediment and soil subsamples was determined using method that includes acid leaching, solvent extraction, ethylation and isothermal GC/CV AFS detection (TEKRAN 2700 Automated Methyl Mercury Analysis System); limit of detection (LOD) was 0.05 ng g−1. All samples were measured in triplicates (both for THg and MeHg).
Sediment and soil subsamples intended for general chemistry analysis (~500 mL) were placed in plastic bags and transported to the LVS EN ISO 17025:2018 accredited laboratory at the LSFRI Silava where they were pre-treated and processed for further analysis according to the LVS ISO 11464:2005 standard. Reaction of sediment and soil samples (pH in a 1:5 (volume fraction) suspension of sample in 0.01 mol L−1 calcium chloride (CaCl2) solution) was analysed according to ISO 10390:2021. Total carbon and total organic carbon (TC and TOC, respectively) and total nitrogen (TN) contents were determined using an elementary analysis method (Elementar El Cube, varioELcube 4.0.16.) according to LVS ISO 10694:2006 L and LVS ISO 13878:1998, respectively. The total phosphorus (TP), total sulphur (TS) and HNO3-extractable potassium (K), calcium (Ca), magnesium (Mg) and iron (Fe) concentrations were determined using microwave mineralization equipment CEM Mars 6 iWave and inductively coupled plasma-optical emission spectrometry (Thermo Fisher Scientific iCAP 7200 Duo, 2.10.3324.83, Thermo Fisher Scientific (Bremen, Germany), designed in Germany, assembled in China).
2.3. Water Sampling and Analysis
Before each sediment sampling from terrain depressions filled with standing water, water quality parameters including water temperature (T) and dissolved oxygen (DO) content were measured using a YSI ProDSS multiparameter water quality meter. In addition, water samples from terrain depressions were taken (1 L) and transported to the laboratory at the LSFRI Silava where they were stored and handled according to ISO 5667-3:2012. The reaction (pH) was determined using a Jenway 3510 pH-meter according to LVS EN ISO 10523:2012. Electrical conductivity (EC) was determined using a Jenway 470 conductometer according to LVS EN 27888:1993. The concentration of total nitrogen (TN) and dissolved organic carbon (DOC) in water samples were determined using a TOC/TN Analyser Elementar vario TOC (V4.0.15) according to LVS EN 1484:2000. Nitrate nitrogen (NO3−-N), phosphate-phosphorus (PO43−-P) and sulphate-sulphur (SO42−-S) concentrations were determined using the liquid chromatography method (Thermo Scientific Dionex Integrion HPIC, 7.2.10, Thermo Scientific, USA) according to LVS EN ISO 10304-1:2009. Ammonium nitrogen (NH4+-N) was determined using the spectrometric method (Shimadzu UV—1900) according to LVS ISO 7150-1:1984. Potassium (K), calcium (Ca), magnesium (Mg) and iron (Fe) concentrations in water samples were determined using inductively coupled plasma-optical emission spectrometry (Thermo Fisher Scientific iCAP 7200 Duo, 2.10.3324.83, Thermo Fisher Scientific (Bremen, Germany), designed in Germany, assembled in China) according to LVS EN ISO 11885:2009. Water samples were filtered before determination of physicochemical variables excluding pH and EC using a glass microfibres filter.
2.4. Assessment of Element Leaching Risks from Ruts and Mounding Pits Using Remote Sensing (LiDAR) Data
DTMs were captured using a LiDAR drone on 25 March 2023 for all sites when snow had melted, and hydrological conditions stabilized. Imagery of sites was captured in the areas of the forest compartments where the study sites are located, and a 50–100 m wide buffer zone surrounding the compartments. The resolution of the DTMs is 0.2 × 0.2 m allowing a detailed hydrological analysis of small relief forms and slopes. In Table 2, general characteristics derived from the DTMs of the studied forest compartments are summarized. The topography of the sites is generally flat. The groundwater level at the sites and corresponding forest compartments is relatively high (Table 3).
DTMs were manipulated and analysed in QGIS [42]. Prior to analysis, DTMs were processed to be hydrologically correct by filling depressions using fill sinks (Wang and Liu) [43]. To model surface flow accumulation and paths, flow accumulation (qm of esp) was used [44,45,46]. To estimate the amount of water needed to initiate surface runoff, DTMs were subtracted from filled DTMs. To model possible drainage paths from ruts or mounding pits, r.drain was used [47]. The amount of water needed to initiate runoff from ruts or mounding pits through the identified drainage paths was calculated using profiles obtained from DTMs and filled DTMs using profiles from lines [44]. For the identified drainage and flow accumulation paths to the borders of the forest compartments or drainage ditches, drainage catchments were delineated using upslope area [44,45]. All statistics of the raster layers were obtained using zonal statistics [42].
2.5. Data Analysis
All statistical analyses were carried out using R [48]. Wilcoxon signed rank exact test and pairwise comparisons using Wilcoxon rank sum test with continuity correction were used to evaluate possible differences in the mean values of THg, MeHg and %MeHg grouped by sample type (undisturbed soil and sediments of forest management induced terrain depressions) or season, with a significance level of 0.05. Correlations between selected soil, sediment and water chemistry variables were tested using Spearman’s ρ, using a significance level of 0.05. Partial least squares (PLS) regressions (R package mdatools [49,50]) were used to explain the variance of THg and MeHg concentrations in the sediments of terrain depressions and undisturbed soil; variables with VIP values (variables important for projection) exceeding 0.5 were used in PLS regression, variables with VIP values > 1.0 were considered as important variables. All results are shown as arithmetic means ± standard error (S.E.).
3. Results
3.1. Temporal and Spatial Variation in Hg Concentrations
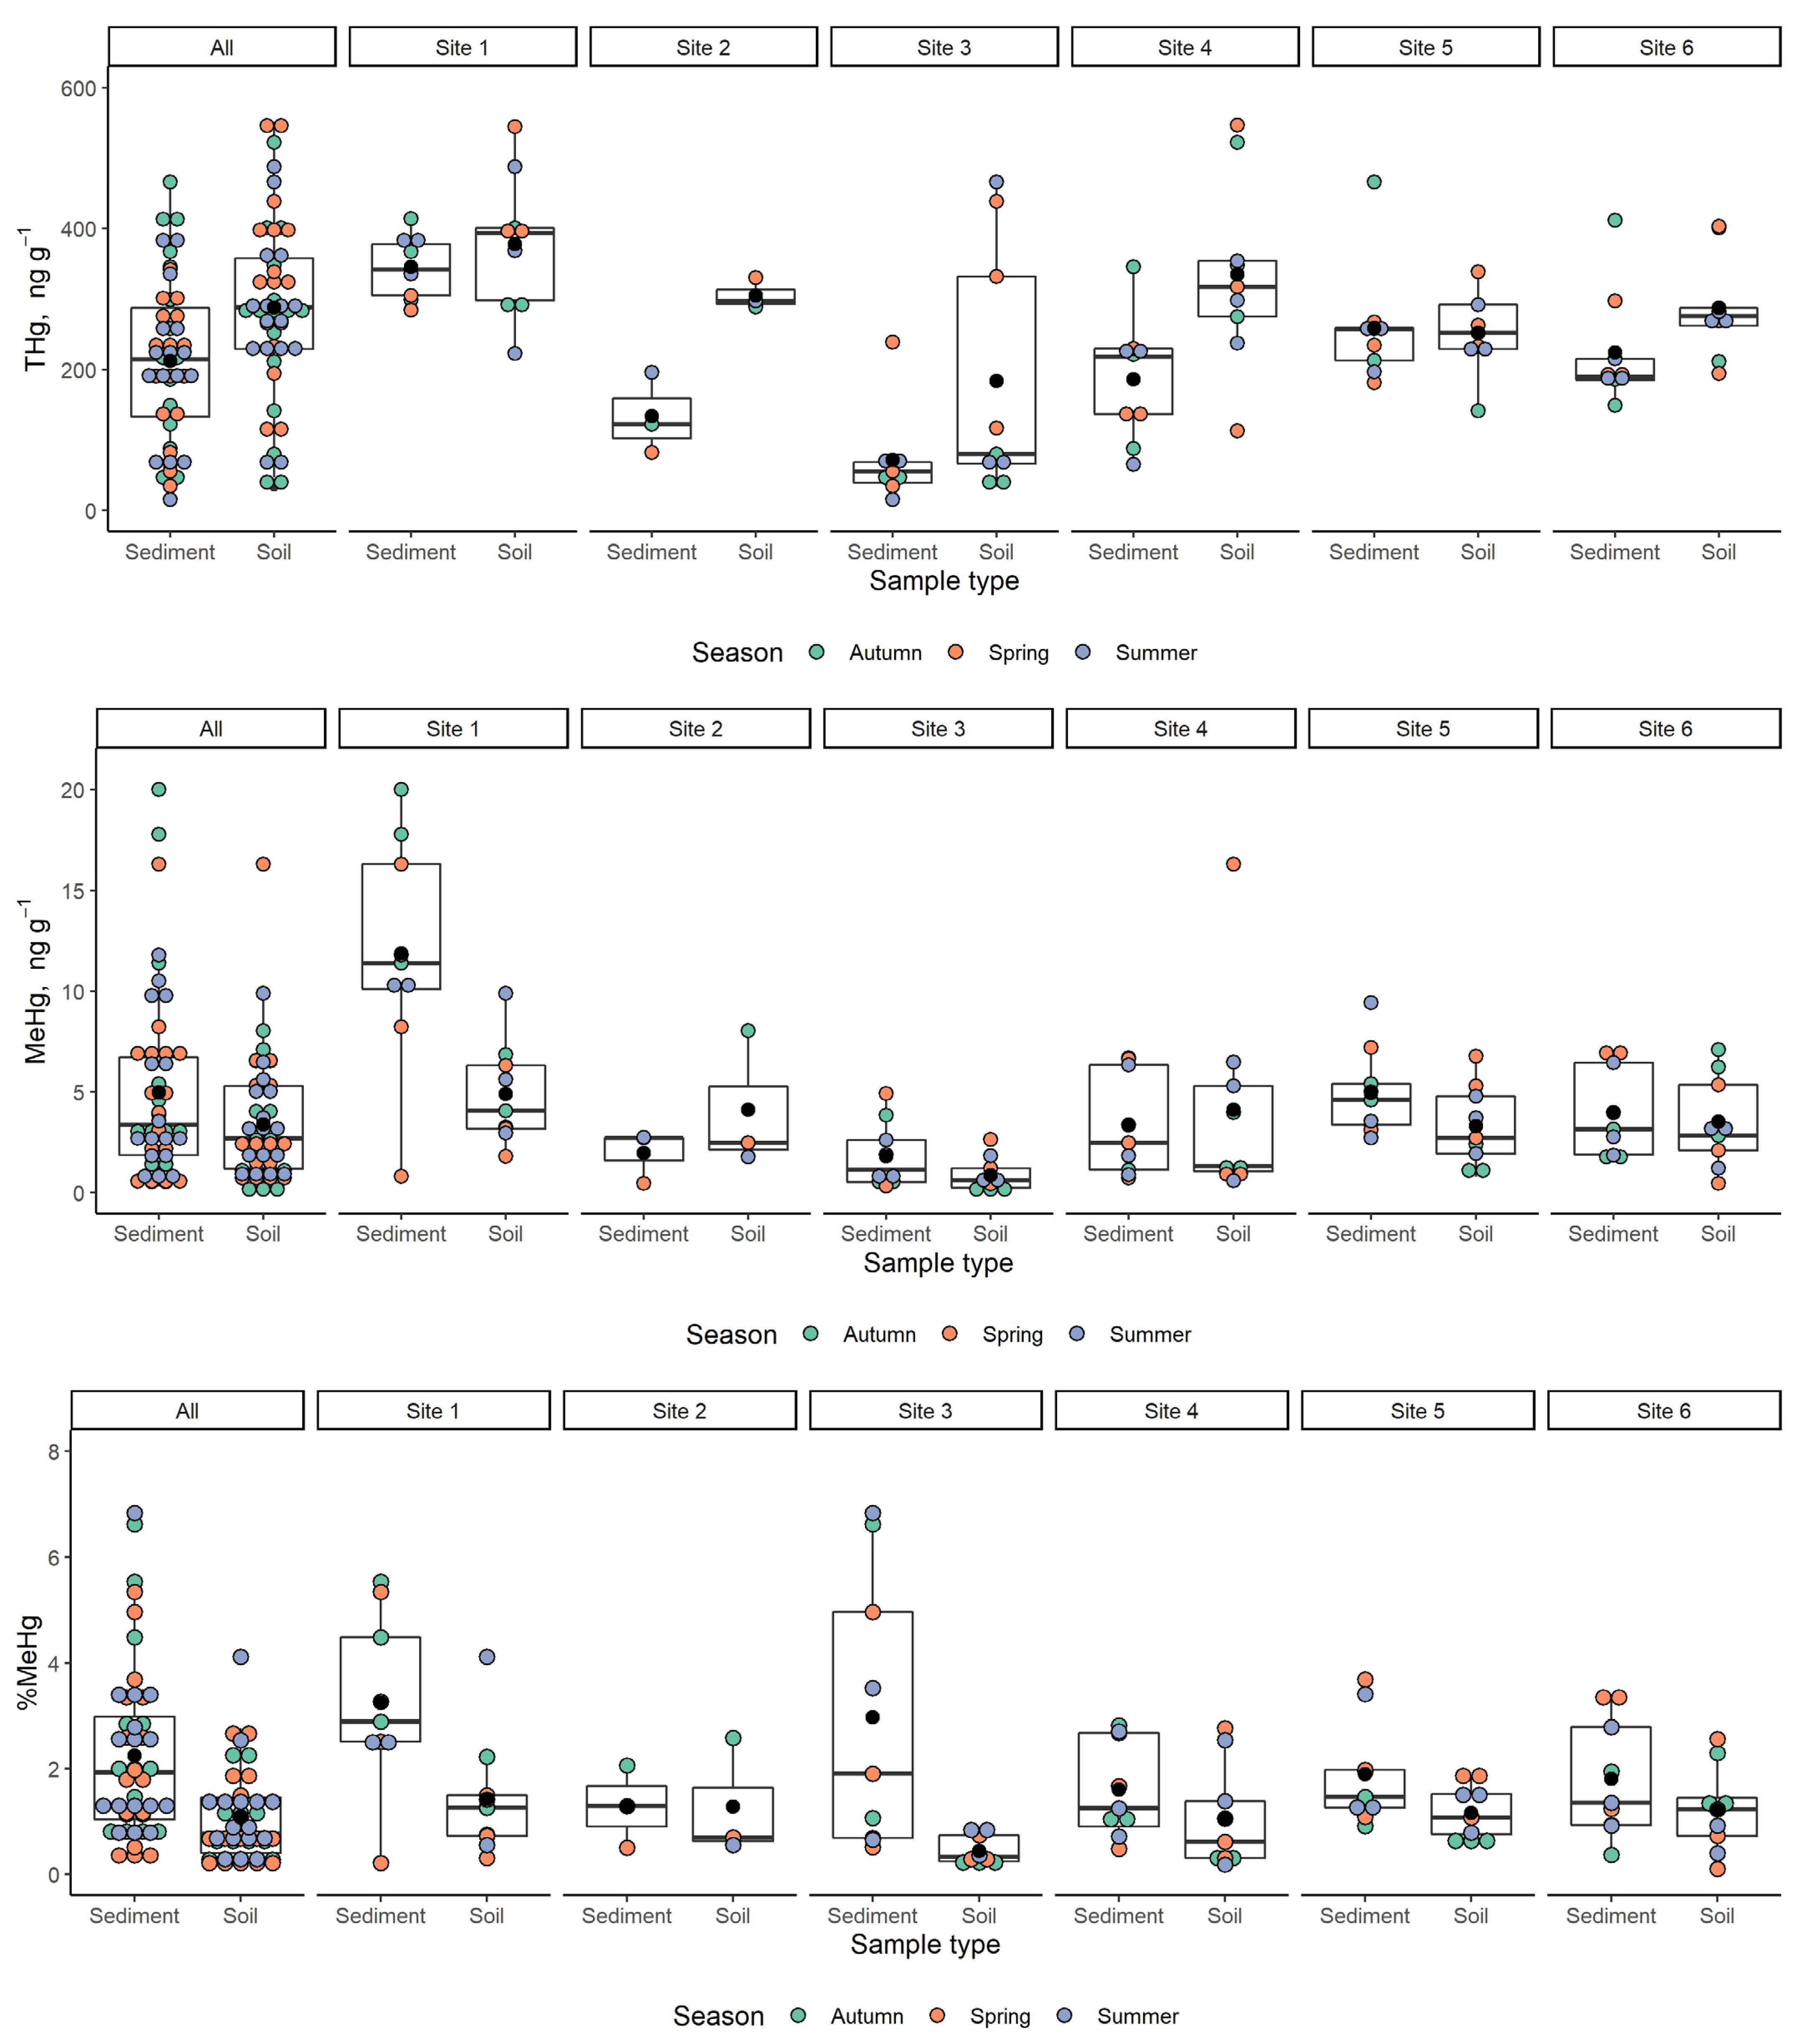
In the investigated sites, the THg concentration in the sediments of forest management induced terrain depressions ranged from 15.1 to 466 ng g−1 with a mean value of 212.2 ± 16.5 ng g−1, while the THg concentration in nearby undisturbed soil ranged from 33.4 to 547 ng g−1 with a mean value of 288.2 ± 18.2 ng g−1 (Figure 3, Table 4). Furthermore, the difference in the average THg concentrations between the sediments and nearby undisturbed soil (all sites pooled) was statistically significant (p = 0.002)—higher THg concentrations were observed in undisturbed soil. The variation in THg concentrations in undisturbed soil between different study sites was not significant, while THg concentrations in the sediments of terrain depressions varied significantly between the study sites. The highest study site mean value of THg concentration in the sediments of terrain depressions was found in Site 1 (346 ± 14.8 ng g−1).
Across all sites and seasons, the MeHg concentrations ranged from 0.29 to 20 ng g−1 (with mean value of 4.98 ± 0.67 ng g−1) in the sediments of forest management induced terrain depressions and from 0.07 to 16.3 ng g−1 (with mean value of 3.38 ± 0.44 ng g−1) in nearby undisturbed soil. In contrast to THg, significantly higher MeHg concentrations were found in the sediments of terrain depressions compared to nearby undisturbed soil (p = 0.044). MeHg concentrations both in the sediments of terrain depressions and in nearby undisturbed soil varied significantly between the study sites. The highest study site mean value of MeHg concentration both in the sediments of terrain depressions and in nearby undisturbed soil was found in Site 1 (11.9 ± 1.9 and 4.9 ± 0.8 ng g−1, respectively).
The mean %MeHg in the sediments of forest management induced terrain depressions was 2.24 ± 0.24%, while in nearby undisturbed soil it was 1.08 ± 0.12%; furthermore, the mean %MeHg in sediments was significantly higher (p = 0.001) than in nearby undisturbed soil. The variation in %MeHg between study sites was not significant. Also, higher concentrations of MeHg normalized to TOC in soil (MeHg/C ratios) were found in the sediments of forest management induced terrain depressions than in nearby undisturbed soil (p = 0.001).
No significant differences in THg and MeHg concentrations as well as in average %MeHg were found between different sampling seasons either in undisturbed soil or in the sediments of forest management induced terrain depressions.
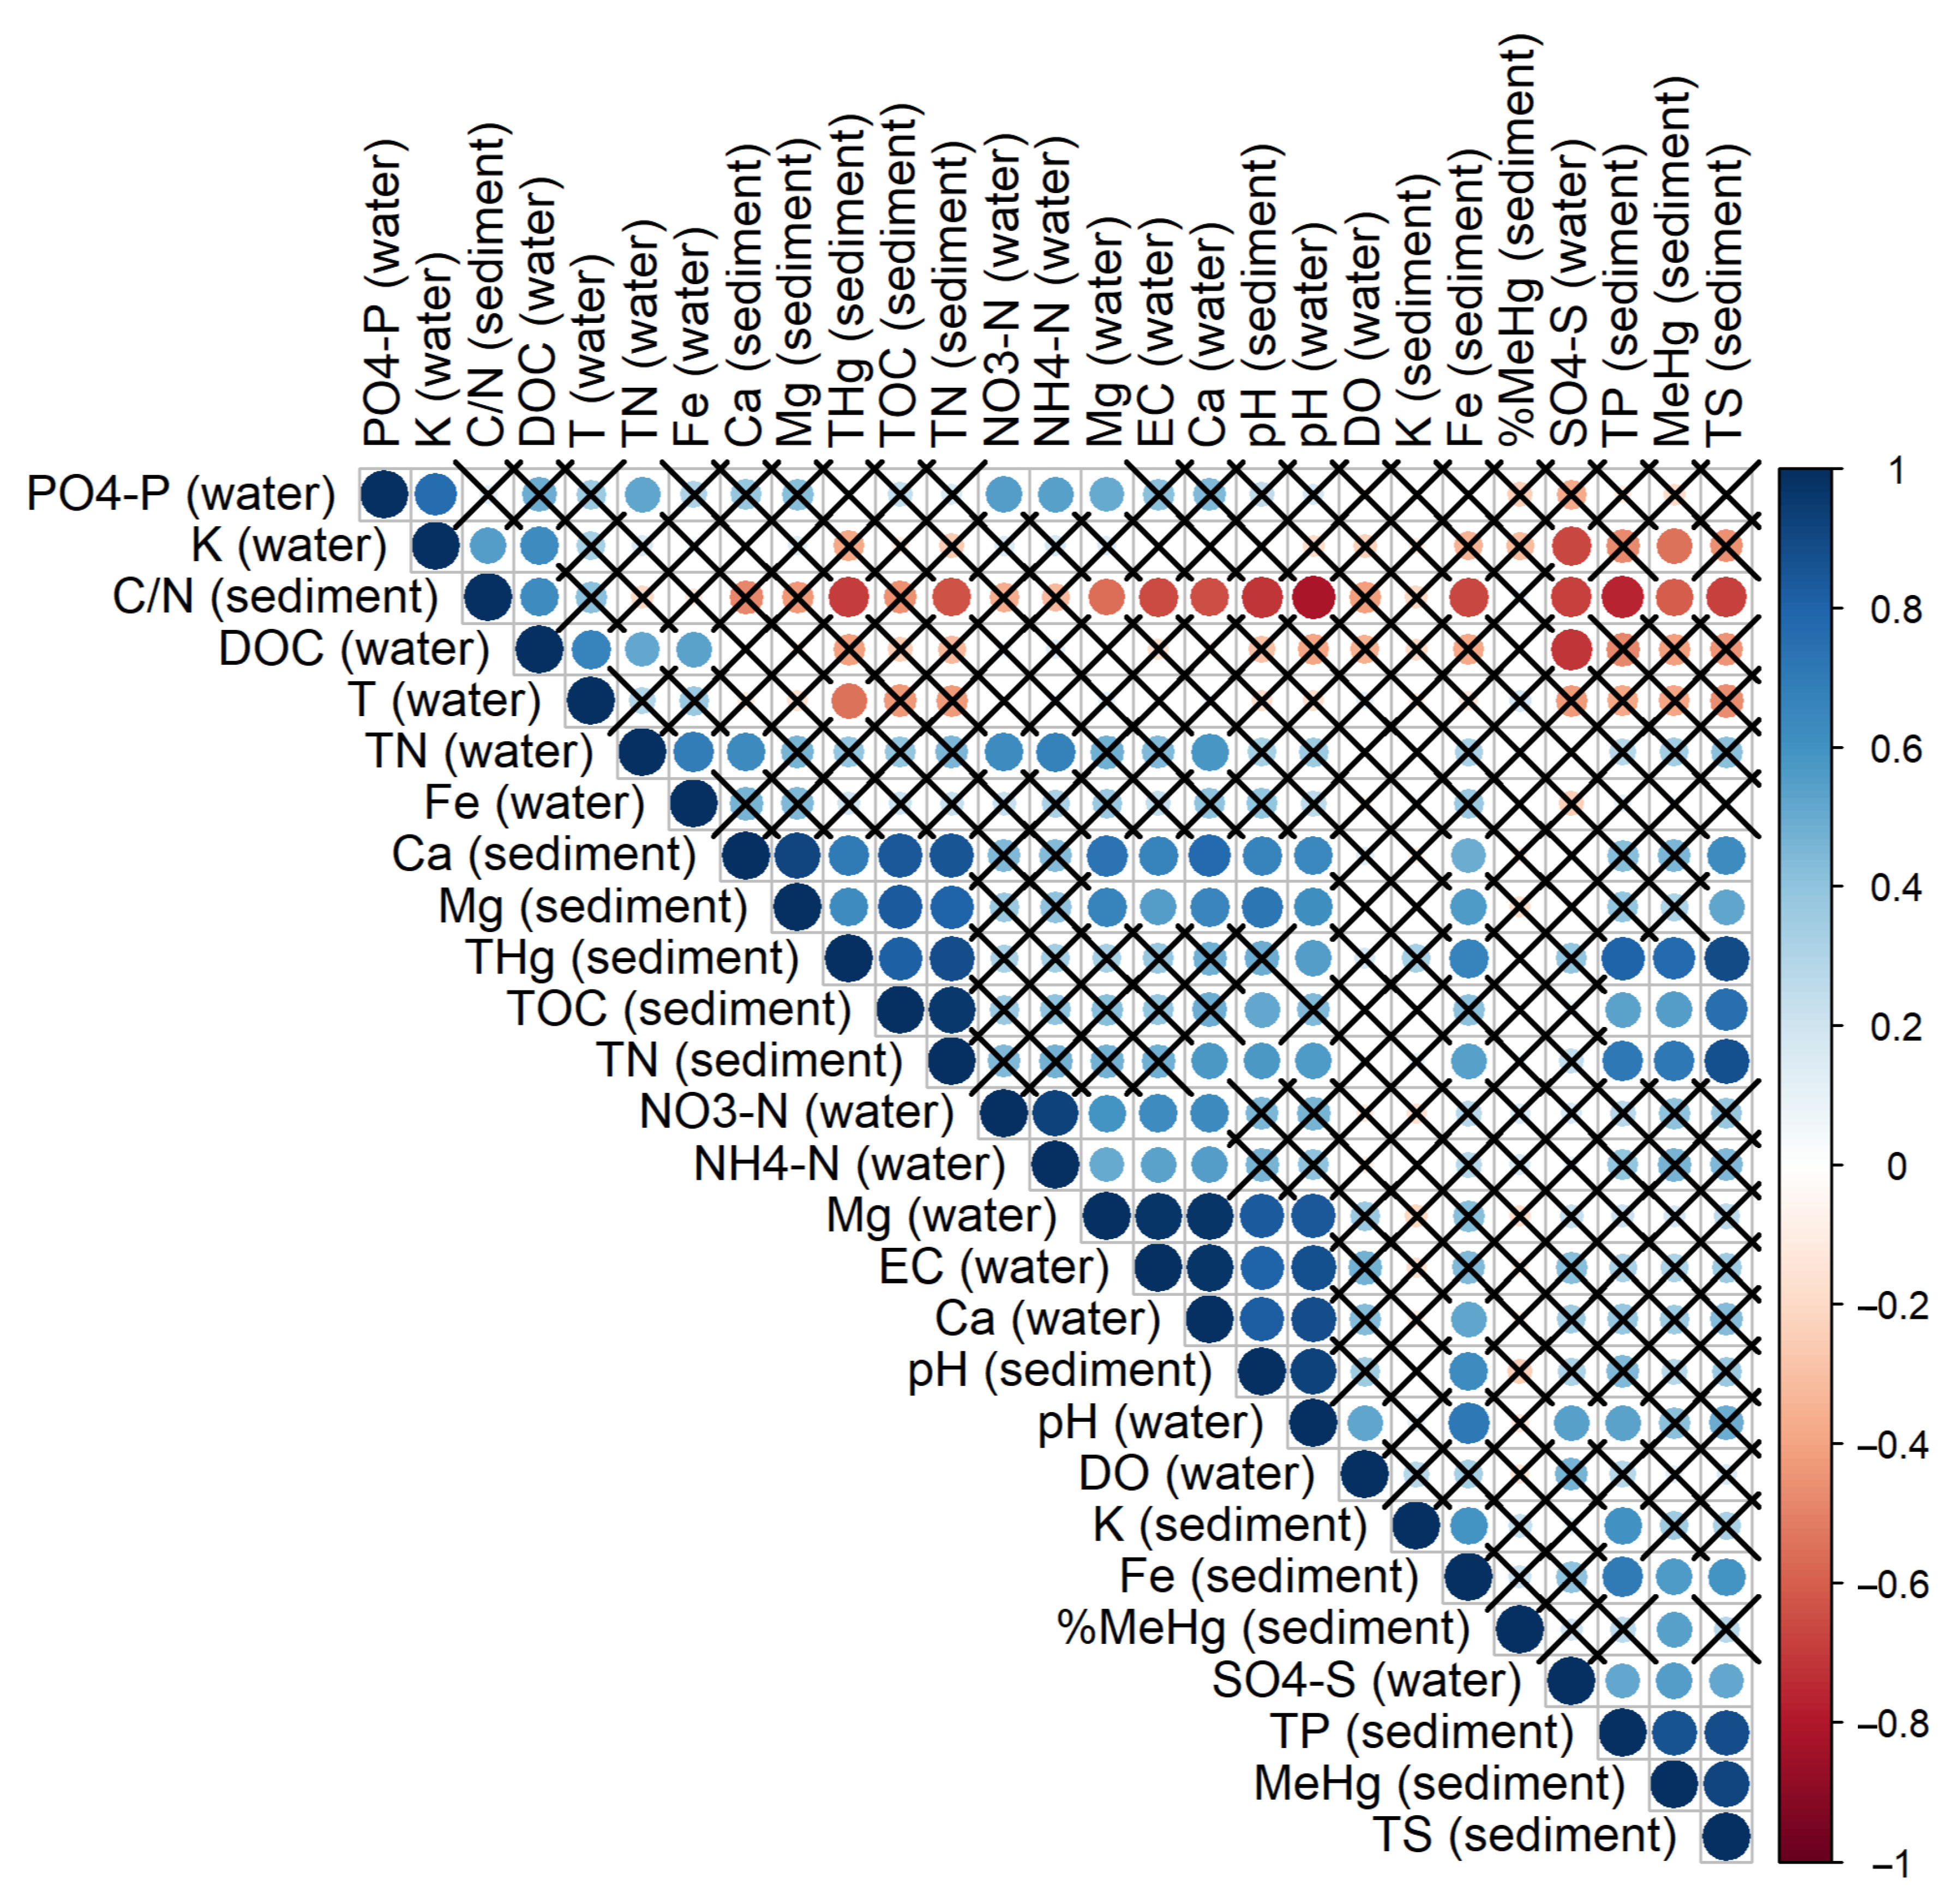
The physicochemical variables of sediment and water in forest management induced terrain depressions are summarized in Table 5. The THg concentration in the sediment of terrain depressions was positively correlated (p < 0.05) with TOC content (ρ = 0.82), TN content (ρ = 0.89), TP content (ρ = 0.80), S content (ρ = 0.89), Ca and Mg content (ρ = 0.71 and ρ = 0.62), Fe content (ρ = 0.66) in sediment and water pH (ρ = 0.56), and negatively correlated with sediment C/N (ρ = −0.70) and water temperature (ρ = −0.54) (Figure 4). The MeHg concentration in the sediment of terrain depressions was positively correlated (p < 0.05) with TOC content (ρ = 0.56), TN content (ρ = 0.71), TP content (ρ = 0.87), S content (ρ = 0.91), Fe content (ρ = 0.57) in sediment and SO42−-S concentration in water (ρ = 0.56), and negatively correlated with sediment C/N (ρ = −0.61) and K concentration in water (ρ = −0.55). Furthermore, a positive correlation between THg and MeHg concentration in sediment was found (ρ = 0.77). A PLS prediction model revealed that the variation in THg and MeHg concentration in the sediment of terrain depressions was explained by sediment chemistry parameters. For THg, the PLS model including variables with a VIP value > 1.0 (S, TN, TOC and TP content in sediments) as well as those with a 1.0 > VIP > 0.5 (pH, C/N ratio, Ca, Mg, Fe content in sediments) had a goodness of fit (R2) of 0.69 and a goodness of prediction (Q2, full cross-validation) of 0.60. For MeHg, the PLS model including variables with a VIP value > 1.1 (TS, TP, TN and THg content in sediments) as well as those with a 1.0 > VIP > 0.5 (C/N ratio, TOC, K, Ca, Mg and Fe content in sediments) had a goodness of fit (R2) of 0.61 and a goodness of prediction (Q2, full cross-validation) of 0.48.
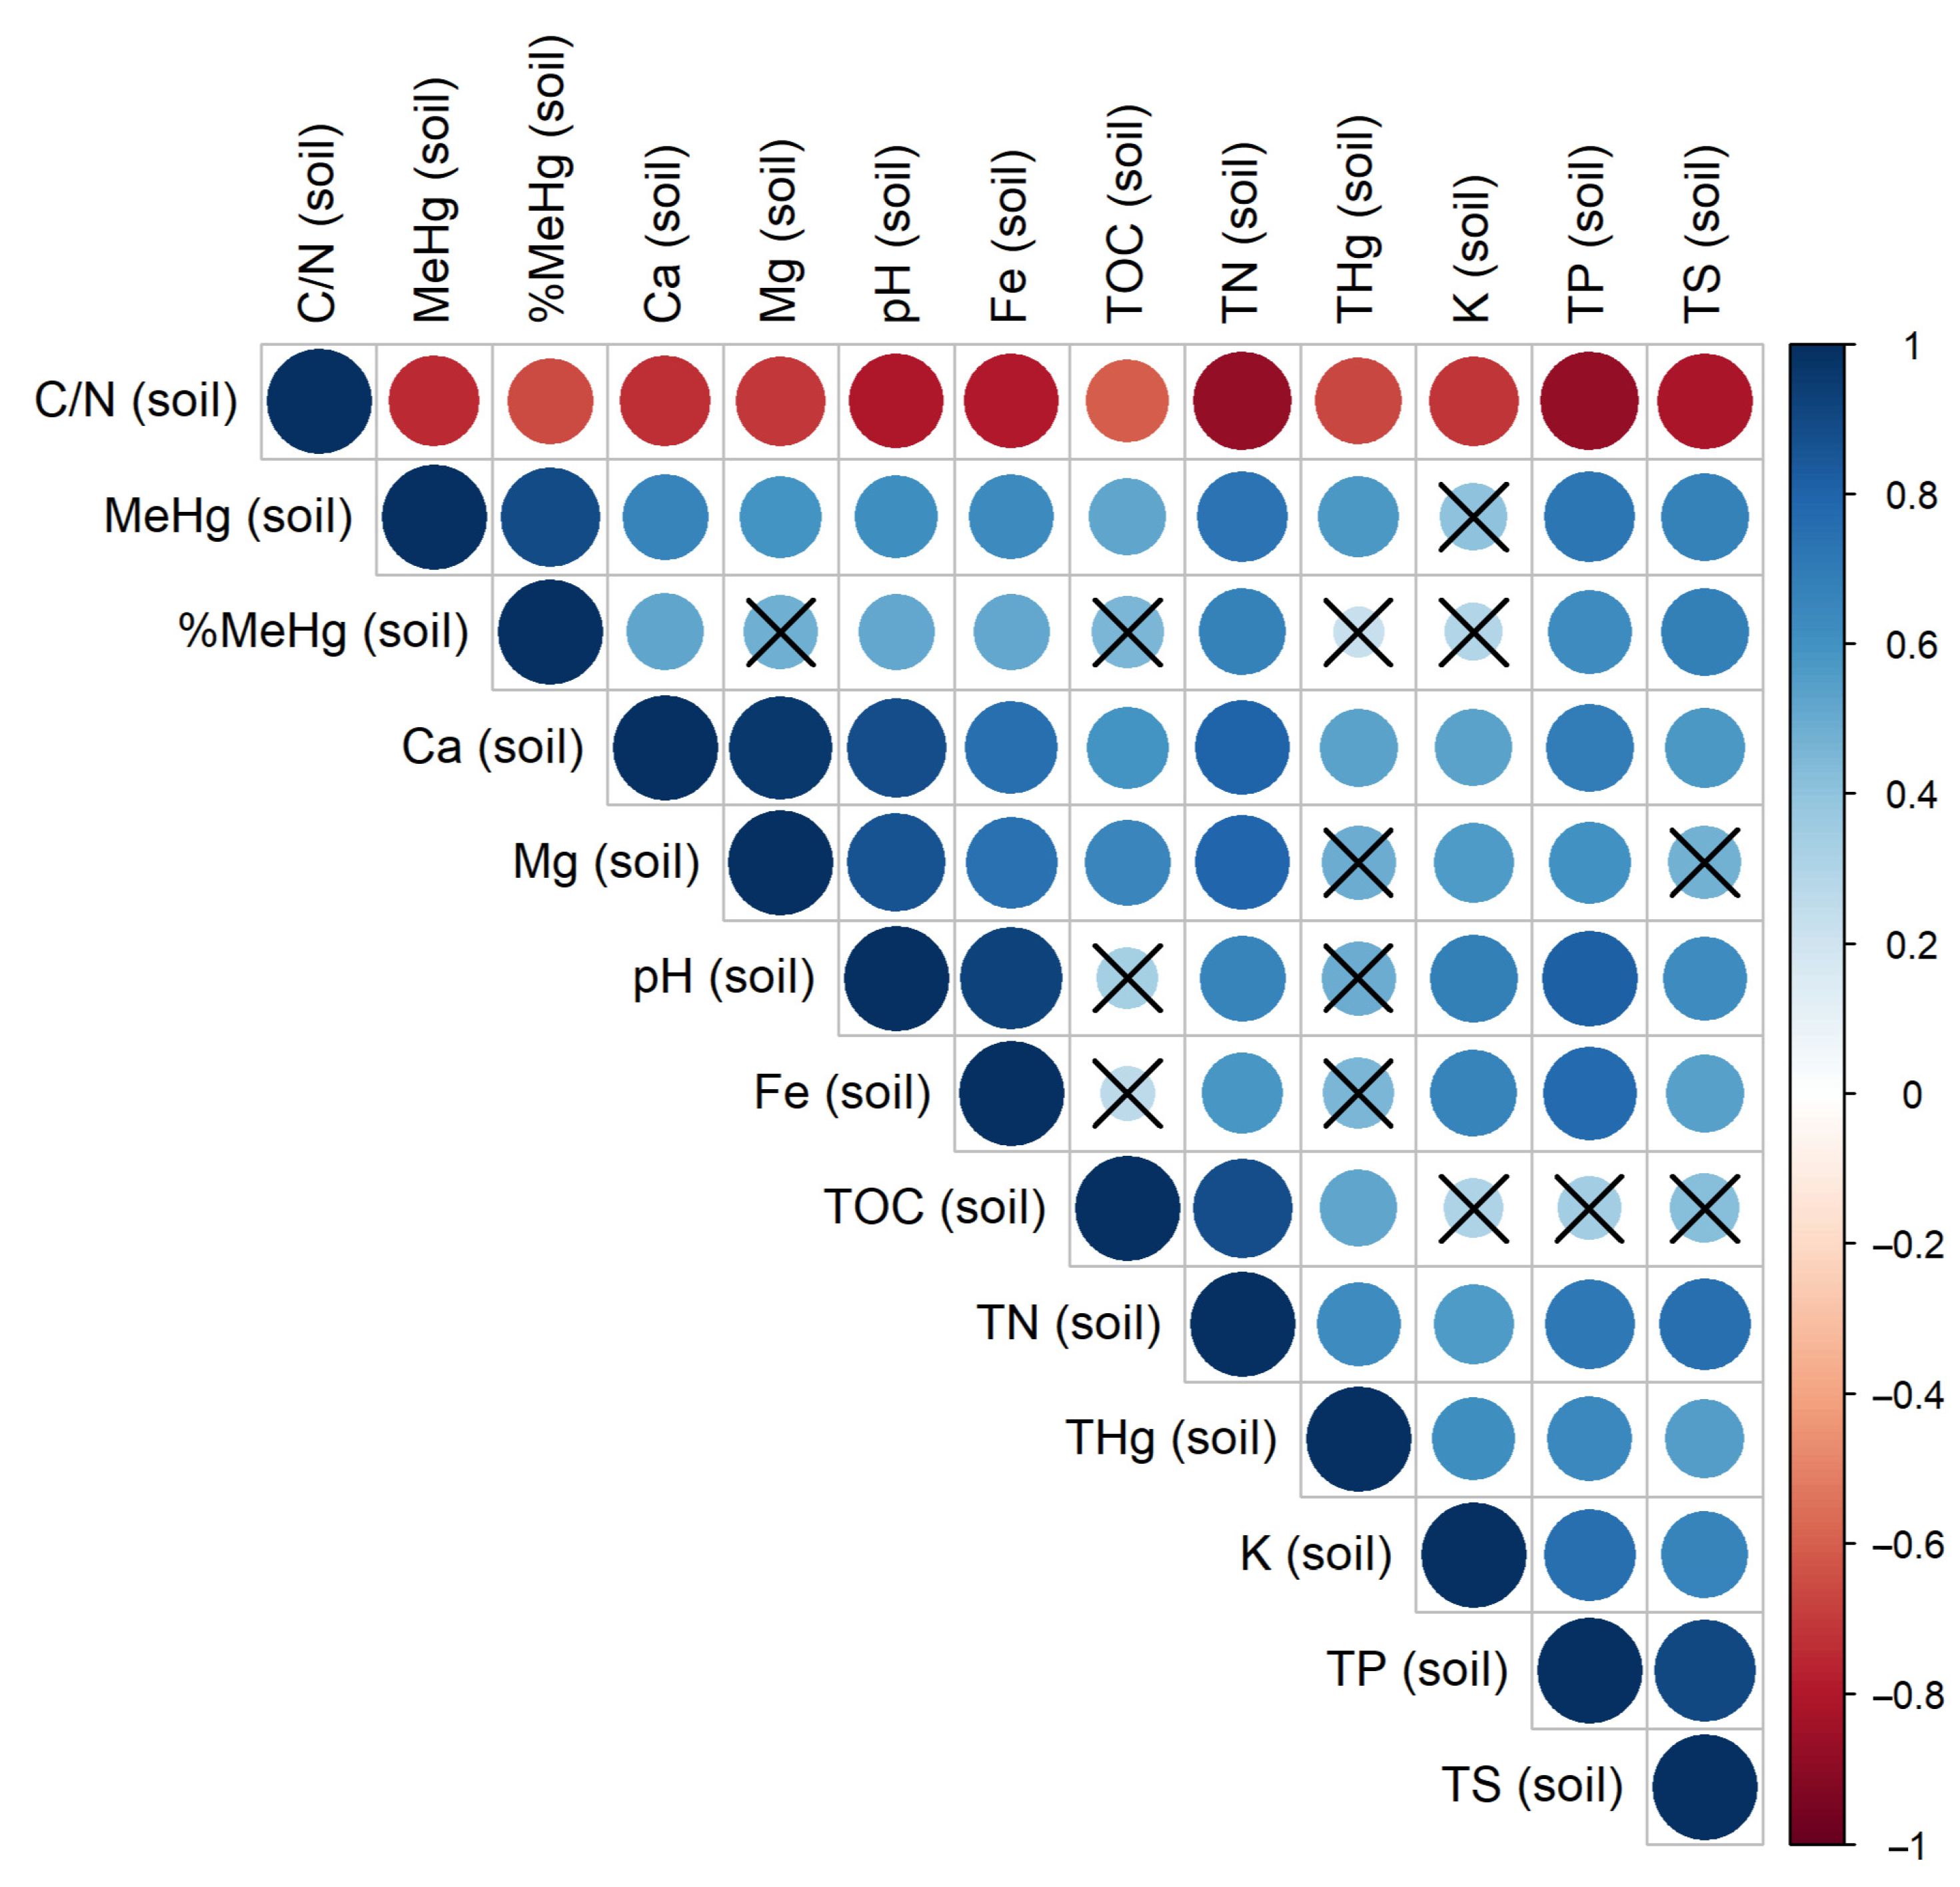
The physicochemical variables of undisturbed topsoil (0–5 cm) are summarized in Table 6. Both the THg and MeHg concentrations in undisturbed soil were positively correlated (p < 0.05) with most of the analysed elements (Figure 5) and negatively correlated with the soil C/N ratio. Similar to sediments, a positive correlation between the THg and MeHg concentration in soil was found (ρ = 0.58). In contrast to sediments, the PLS analyses conducted on the THg and MeHg concentration in undisturbed soil resulted in weak models (R2 < 0.5).
3.2. Assesment of Element Leaching Risks Using Remote Sensing (LiDAR) Data
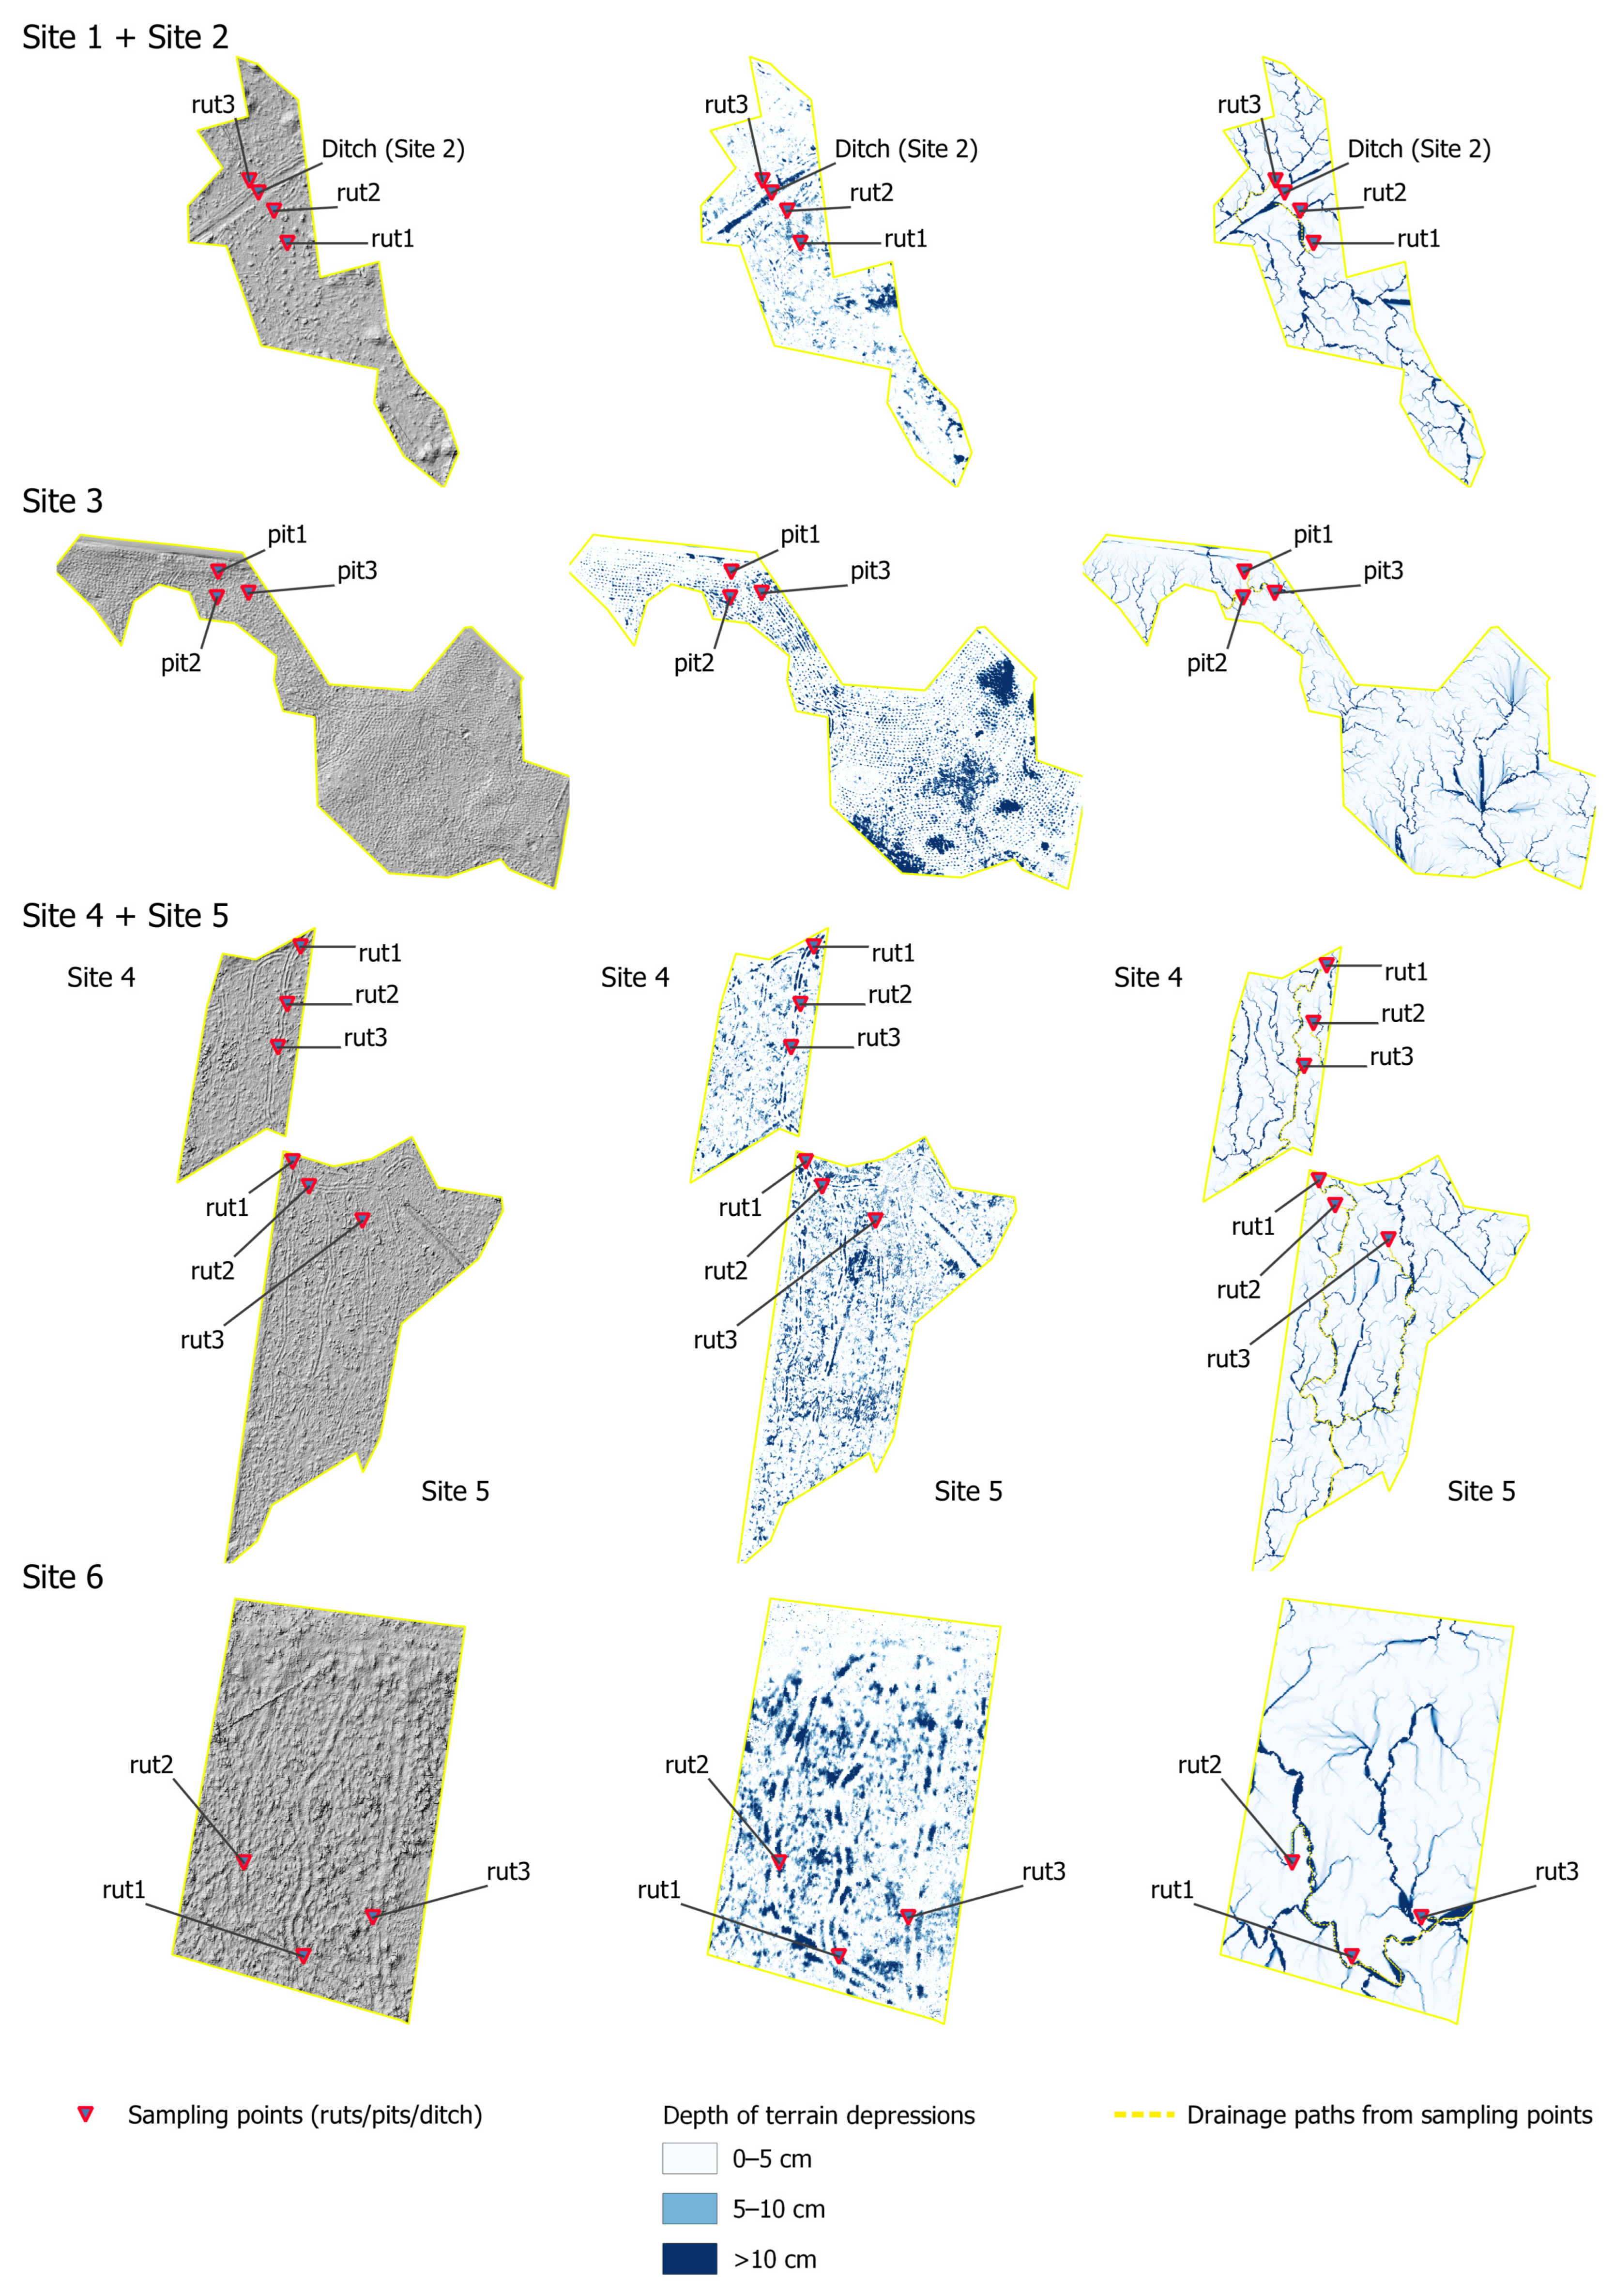
Occurrence of soil disturbance including ruts from heavy machinery is more likely in lower and wetter spots where the mechanical structure of soil is significantly weaker. In forest compartments with high groundwater levels, the differences often cannot be detected by visual observation. At our sites, the sampling points were selected based on a field assessment of ruts and pits that held water during the driest months. The remote sensing data confirmed the validity of the field assessment. It was found that generally all sampling points were closely related to the surface flow accumulation network and functioned as a part of it (Figure 6).
Analysis of the DTMs revealed the approximate water holding capacities of the forest compartments and drain paths (Table 7). When this capacity is reached, surface runoff is initiated. While some of the water from precipitation or snowmelt is retained and infiltrated in soil, the high groundwater level means that this process may be significantly impaired. The amount of water or precipitation needed to fill all the depressions in the forest compartments is lower than in the drain paths as water is drained from the higher spots to the lower parts. Consequently, it was calculated that a lot more water was needed for the drain paths as the surrounding areas were not accounted for and are located in surface flow accumulation (lower) areas. With the drain paths and flow accumulation networks identified, drainage micro-catchments were delineated. The amount of water needed to initiate surface flow in the corresponding micro-catchments is provided in Table 8. In 2022, the amount of daily precipitation in the study area exceeded 10 mm in 3.6% of days, exceeded 20 mm in 1.1% of days, exceeded 30 mm in 0.6% of days and even exceeded 40 mm in 0.3% of days.
4. Discussion
In European forest soils, the concentrations of Hg vary by several orders of magnitude and depend on the amount of Hg input from natural and anthropogenic sources, the soil capacity for Hg sequestration and storage, which is mostly related to soil organic matter and presence of soil C and N, soil texture, altitude and other factors including management [51,52,53,54,55]. Furthermore, tree species composition has a strong influence on Hg uptake by the foliage [56] and subsequent litterfall Hg deposition [57]. Previous studies show that mean Hg concentrations in European forest soils range from 0.16 to 0.46 mg kg−1 in mineral soils, from 0.14 to 0.23 mg kg−1 in peat soils and around 0.2 mg kg−1 in forest floors [1]. Åkerblom et al., 2008 [58] reported that the mean Hg concentration in the humus (mor) layer of boreal forests in Sweden ranged up to 0.41 mg kg−1 and the Hg concentration in topsoil varied between forest sites and was partly consistent with the patterns of Hg deposition. In forest soils in the Czech Republic, the site-specific means of Hg concentrations in soil O-horizon ranged from 0.277 to 0.393 mg kg−1, while in mineral soil—up to 0.095 mg kg−1 [54]. It should be mentioned that the median critical level for Hg set by different countries in Europe based on effect concentrations according to ecotoxicological and empirical studies is 2 mg kg−1 [1]. In general, in organic forest soils in Europe, Hg concentrations exceeding 1.6 mg Hg kg−1 are rarely found [59]. The estimates of our study show that the THg concentration in forest topsoil with a TOC concentration > 200 g kg−1 ranged up to 0.547 mg kg−1 with a mean value of 0.288 ± 0.018 mg kg−1, which is close to or slightly above the previously reported variations in uncontaminated European forest soils and does not approach the median critical value [1]. We found higher THg concentrations in undisturbed topsoil compared to the sediment in forest management induced terrain depressions (the mean Hg concentration in the sediments was 0.212 ± 0.017 mg kg−1). This is most likely related to higher the accumulation and storage of Hg deposited from the atmosphere in organic-matter-rich topsoil layers (as Hg is primarily complexed with the Cl−, OH−, S2− and S-containing functional groups of organic ligands, presumably in the form of thiols) [17,51,58,60,61], while lower THg concentrations in terrain depressions may be explained by conditions that have already promoted the transformation and mobility of THg and thus decreased concentrations compared to nearby undisturbed topsoil.
The close relation of THg to the soil and sediment components obtained within this study support previous findings that the concentrations of Hg in unpolluted forest soils (especially in acidic soils such as the soils included in this study) are linked to the content of soil organic matter [17,51,53,54]. This is confirmed by the positive correlations between the concentrations of THg and elements related to soil organic matter such as TOC, TN, TS and TP (elements whose functional groups provide sorption or bonding sites for Hg) [52,53].
The concentration of MeHg in the soil and sediments is the net result of the intensity of two counteracting biotic processes—Hg methylation or MeHg production and Hg demethylation or MeHg degradation, as well as MeHg input/output processes [62]. Freshly deposited Hg is initially more available for methylation than the ambient Hg of the sediments, while Hg freshly deposited into soils shows rather low methylation rates when compared to the ambient Hg. Furthermore, after a period of favourable conditions for net methylation, the elevated MeHg concentrations may still be present for several months for both soil and sediments [63]. Based on an evaluation of the global distribution of Hg methylation in sediments, it has been concluded that the MeHg concentration in sediments ranges from 0.009 to 55.7 μg kg−1 across different ecosystems [24]. Based on results of a study conducted in boreal pristine wetlands in Ontario (Canada), Heyes et al., 2000 [64] reported that MeHg concentrations in peat ranged from 0.1 to 60 μg kg−1. Skyllberg et al., 2003 [52] found that the MeHg concentration in soil in a boreal forest catchment in northern Sweden ranged up to 13.38 μg kg−1 (in the stream bank). Our results showed that the MeHg concentrations ranged up to 20 μg kg−1 (with a mean value of 4.98 ± 0.67 μg kg−1) in the sediments of forest management induced terrain depressions and up to 16.3 μg kg−1 (with mean value of 3.38 ± 0.44 μg kg−1) in nearby undisturbed soil.
Accumulating evidence shows that the main environmental drivers of MeHg production are the amount of the mean annual Hg precipitation, which is further related to Hg bioavailability, sediment and soil physico-geochemistry (e.g., pH, organic matter quality and TOC content, sulphur and iron concentrations, nutrient availability) as well as higher temperature possibly facilitating the activity of microbial methylators and thus accelerating MeHg production [21,24,33,52,65]. Previous findings that sulphur content and availability including presence of sulphate (acting as electron acceptor for anaerobic bacteria) can promote the biotic methylation of Hg by sulphate-reducing bacteria [24,52,66,67] is supported by correlations between MeHg and TS concentrations in the soil and the sediment as well as between the MeHg concentration in the sediment and SO42−-S concentration in the water in forest management induced terrain depressions found in our study. Within this study, no significant correlation was found between the MeHg concentration in the sediments and the DOC concentration in the water in the terrain depressions. However, the DOC is crucial in impacting aquatic Hg mobilisation and transformation [58,68], and areas with high DOC concentrations in water (including wetlands and forest land with organic-matter-rich soils) may be hotspots for MeHg production, although their THg concentrations are not the highest [68].
In the study sites, the soil and sediment C/N ratio, an important determinant of soil fertility and an indirect indicator of organic matter mineralization and the release of N [69,70,71], ranged from 15.3 to 30.5 in the soil and from 15.2 to 25.4 in the sediment. An increase in both THg and MeHg concentrations in the soil and the sediments followed a decrease in C/N. Thus, increases in THg and MeHg concentrations may also be linked to the increased decomposition of organic matter pointing out that THg and MeHg was efficiently stabilized by, for instance, additional sorption sites or functional groups within the remaining organic matter. Similar patterns between the Hg/TOC and C/N ratio were previously also observed [53,54,72].
The results of our study showed that %MeHg, a proxy for the Hg methylation rates [62], in the sediments of the terrain depressions ranged up to 6.84% (mean value 2.24 ± 0.24%), while in the nearby undisturbed soil—up to 4.13% (mean value 1.08 ± 0.12%). Skyllberg et al., 2003 [52] found that the MeHg/THg ratio varied between 0.3 and 17.2% in the soils in a boreal forest catchment in northern Sweden, underlining that the conditions for MeHg production were most beneficial in the discharge areas (riparian zones) close to streams. Grigal 2003 [51] reported that the MeHg/THg ratio ranged up to slightly more than 5%, but with more than 70% of the observations at <1%. In general, earlier studies have shown that forest operations can alter (mostly increase, but not always) the concentration and mobilization of MeHg to ground and surface waters in a boreal zone (e.g., [33,34,39]), especially in the first couple of years after, for instance, a forest is clearcut [30]. Saturated sediments [24] and wet organic-matter-rich soils with standing water, low oxygen and a high fresh organic carbon supply [33,35] are considered particularly favourable environments for primary Hg methylators (Hg methylating microorganisms including iron-reducing bacteria and sulphate-reducing bacteria), also providing an increased availability of electron donors for methylating bacteria [30]. On the other hand, wet soils with depleted oxygen levels may possess lower MeHg concentrations compared to soils with limited oxygen availability where microbial activity is higher [73]. Our results support previous findings regarding the favourable impact of various forest operations on Hg methylation and MeHg mobilization. For %MeHg, a significantly higher mean value in the sediments of forest management induced terrain depressions compared to nearby undisturbed soil was found, indicating that forest operations which resulted in soil disturbance and the formation of terrain depressions can further enhance Hg methylation. Harvesting itself interferes with the hydrological balance of a site causing decreased evapotranspiration. Furthermore, the creation of terrain depressions enhances the formation and presence of water-filled cavities, even during warm summer months. However, previous studies underline that the sensitivity of a catchment to MeHg related responses may widely vary after forestry operations [35] and the impacts on Hg methylation in forest soils and sediment still are not fully understood [39].
The statistical count of days with a high or very high amount of precipitation (>10 mm or >20 mm, respectively), maximum daily precipitation, maximum five-day precipitation as well as total yearly precipitation have been increasing in Latvia. Furthermore, climatic models forecast such tendencies for the future due to climate change [23]. With extreme precipitation events, runoff and nutrient losses increase. While forested areas are less exposed to precipitation intensity, management-affected lands such as farmlands (or in our case—clearcuts) are more significantly impacted [74]. Nutrient losses from forested areas are particularly high during snow melt seasons [75]. In general, a periodically high amount of precipitation may promote MeHg production and both Hg and MeHg movement to aquatic ecosystems through, firstly, increased deposition of Hg from the atmosphere (furthermore, freshly deposited Hg could be more reactive and bioavailable to methylators than aged Hg) and, secondly, exacerbated surface runoff [24]. Higher MeHg concentrations may occur near the transition zones between peatlands and mineral soil, where solutes are delivered by runoff from higher spots or areas [76]. Similar processes may be present in flooded soils and management induced terrain depressions with the likely vertical transport of solutes from the underlying mineral soil layers below peat. With high and temporarily varying groundwater levels, as in our sites, spots with high %MeHg may be found [33]. Significantly higher MeHg concentrations may be expected in drainage water or related streams after recent clearcutting [30]. Considering the mean annual precipitation, the occurrence of high and very high precipitation in Latvia, the meteorological data recorded in the study area in 2022, the high groundwater levels and the information obtained from the DTMs of the sites, element (including Hg and MeHg) runoff from ruts and pits is not permanent but very likely periodically. Furthermore, snowmelt may, in few days, supply water that has accumulated for several months, greatly contributing to the export of nutrients and Hg to related waterbodies.
The current research, while adding new information about the interactions of Hg with forest management-related changes in the soil, has limitations. For example, we did not sample microbial communities, and thus, cannot tell exactly which organism groups are responsible for the Hg methylation at our sites, and the groundwater level in our case was modelled, not measured. To advance the topic, a catchment-scale study, with careful consideration of all components of Hg cycling (including precipitation and Hg transport and transformations in the biota), coupled with climate models, should be conducted. Also, the temporal dynamics and duration of potential Hg methylation hotspots is of interest for future research.
5. Conclusions
The THg concentrations in ruts and pits indicated possible methylation and/or leaching in the past, as the concentrations in the sediments were significantly lower than in the surrounding soil. Significantly higher MeHg concentrations as well as %MeHg were observed in the sediments of management induced terrain depressions than in the surrounding soil, marking them as Hg methylation hotspots and supporting our hypothesis. At the same time, no significant seasonal variation in THg, MeHg and %MeHg was observed.
The levels of THg at the sites were found to be dependent on the content of organic matter in soil, which is in line with previous findings; this was indicated by positive correlations between THg and TOC, TN, TS and TP. Elevated THg and MeHg concentrations may be linked to the increased mineralization rates of organic matter in the soil and sediments after forestry activities. At the same time, the DOC concentrations in water did not show the expected correlation with the MeHg in the sediments. Correlations between the MeHg and TS concentrations in the soil and the sediment as well as between the MeHg concentration in the sediment and the SO42−-S concentration in the water pointed to promoted Hg methylation, most likely by sulphate-reducing bacteria.
Analysis of the digital terrain models of the sites indicated areas of the likely occurrence of ruts, showed that ruts often act as surface runoff pathways and validated the concern of element leaching. Digital terrain models and automated analysis on a local scale could improve the planning of forestry operations to cause less soil damage or at least to cause it in a controlled way to transform ruts from runoff pathways into improvised water protection structures containing the water with the elements on the sites (e.g., ruts perpendicular to flow accumulation pathways).
The Hg and MeHg concentrations in our study were not particularly high; however, considering the bioaccumulating nature of this pollutant and the predicted weather extremes caused by climate change (e.g., strong precipitation), we suggest planning and implementing forest management operations in a way that would limit the formation of favourable conditions for Hg methylation and further mobilization in surface runoff risk areas.
Author Contributions
Conceptualization, A.B. and Z.L.; data curation, I.K., A.B. and Z.L.; formal analysis, I.K. and A.B.; funding acquisition, Z.L.; investigation, I.K., A.B., Z.K. and Z.L.; methodology, I.K., A.B. and Z.L.; project administration, Z.L.; resources, I.K., A.B. and Z.L.; software, I.K. and A.B.; supervision, Z.L.; validation, I.K., A.B. and Z.L.; visualization, I.K., A.B. and Z.K.; writing—original draft, I.K., A.B., Z.K. and Z.L.; writing—review and editing, I.K., A.B., Z.K. and Z.L. All authors have read and agreed to the published version of the manuscript.
Funding
This research was funded by JSC “Latvia’s State Forests” within the frames of the research program “The impact of forest management on forest and related ecosystem services”, No 5-5.9.1_007n_101_21_76.
Data Availability Statement
The datasets are available upon reasonable request by contacting the corresponding author.
Conflicts of Interest
The authors declare no conflicts of interest.
References
- Bommarez, T.; Cools, N.; De Vos, B. Heavy Metals in Forest Floors and Topsoils of ICP Forests Level I Plots; Research Institute for Nature and Forest: Brussels, Belgium, 2021; p. 120. [Google Scholar] [CrossRef]
- Asati, A.; Pichhode, M.; Nikhil, K. Effect of Heavy Metals on Plants: An Overview. Int. J. Appl. Innov. Eng. Manag. 2016, 5, 56–66. [Google Scholar] [CrossRef]
- de Almeida Rodrigues, P.; Ferrari, R.G.; dos Santos, L.N.; Conte Junior, C.A. Mercury in Aquatic Fauna Contamination: A Systematic Review on Its Dynamics and Potential Health Risks. J. Environ. Sci. 2019, 84, 205–218. [Google Scholar] [CrossRef] [PubMed]
- Basu, N.; Horvat, M.; Evers, D.C.; Zastenskaya, I.; Weihe, P.; Tempowski, J. A State-of-the-Science Review of Mercury Biomarkers in Human Populations Worldwide between 2000 and 2018. Environ. Health Perspect. 2018, 126, 106001. [Google Scholar] [CrossRef] [PubMed]
- Basu, N.; Abass, K.; Dietz, R.; Krümmel, E.; Rautio, A.; Weihe, P. The Impact of Mercury Contamination on Human Health in the Arctic: A State of the Science Review. Sci. Total Environ. 2022, 831, 154793. [Google Scholar] [CrossRef] [PubMed]
- Fernández-Llamazares, Á.; Garteizgogeascoa, M.; Basu, N.; Brondizio, E.S.; Cabeza, M.; Martínez-Alier, J.; McElwee, P.; Reyes-García, V. A State-of-the-Art Review of Indigenous Peoples and Environmental Pollution. Integr. Environ. Assess. Manag. 2020, 16, 324–341. [Google Scholar] [CrossRef] [PubMed]
- United Nations. Minamata Convention on Mercury; United Nations: New York, NY, USA, 2013. [Google Scholar]
- Pyle, D.M.; Mather, T.A. The Importance of Volcanic Emissions for the Global Atmospheric Mercury Cycle. Atmos. Environ. 2003, 37, 5115–5124. [Google Scholar] [CrossRef]
- Edwards, B.A.; Kushner, D.S.; Outridge, P.M.; Wang, F. Fifty Years of Volcanic Mercury Emission Research: Knowledge Gaps and Future Directions. Sci. Total Environ. 2021, 757, 143800. [Google Scholar] [CrossRef] [PubMed]
- Bishop, K.; Shanley, J.B.; Riscassi, A.; de Wit, H.A.; Eklöf, K.; Meng, B.; Mitchell, C.; Osterwalder, S.; Schuster, P.F.; Webster, J.; et al. Recent Advances in Understanding and Measurement of Mercury in the Environment: Terrestrial Hg Cycling. Sci. Total Environ. 2020, 721, 137647. [Google Scholar] [CrossRef]
- Zhu, S.; Zhang, Z.; Žagar, D. Mercury Transport and Fate Models in Aquatic Systems: A Review and Synthesis. Sci. Total Environ. 2018, 639, 538–549. [Google Scholar] [CrossRef]
- Lee, Y.H.; Bishop, K.H.; Munthe, J.; Iverfeldt, Å.; Verta, M.; Parkman, H.; Hultberg, H. An Examination of Current Hg Deposition and Export in Fenno-Scandian Catchments. Biogeochemistry 1998, 40, 125–135. [Google Scholar] [CrossRef]
- Grigal, D.F.; Kolka, R.K.; Fleck, J.A.; Nater, E.A. Mercury Budget of an Upland-Peatland Watershed. Biogeochemistry 2000, 50, 95–109. [Google Scholar] [CrossRef]
- Graydon, J.A.; St. Louis, V.L.; Lindberg, S.E.; Hintelmann, H.; Krabbenhoft, D.P. Investigation of Mercury Exchange between Forest Canopy Vegetation and the Atmosphere Using a New Dynamic Chamber. Environ. Sci. Technol. 2006, 40, 4680–4688. [Google Scholar] [CrossRef] [PubMed]
- Zhou, J.; Obrist, D.; Dastoor, A.; Jiskra, M.; Ryjkov, A. Vegetation Uptake of Mercury and Impacts on Global Cycling. Nat. Rev. Earth Environ. 2021, 2, 269–284. [Google Scholar] [CrossRef]
- Gworek, B.; Dmuchowski, W.; Baczewska-Dąbrowska, A.H. Mercury in the Terrestrial Environment: A Review. Environ. Sci. Eur. 2020, 32, 128. [Google Scholar] [CrossRef]
- Xu, J.; Bravo, A.G.; Lagerkvist, A.; Bertilsson, S.; Sjöblom, R.; Kumpiene, J. Sources and Remediation Techniques for Mercury Contaminated Soil. Environ. Int. 2015, 74, 42–53. [Google Scholar] [CrossRef]
- Pirrone, N.; Cinnirella, S.; Feng, X.; Finkelman, R.B.; Friedli, H.R.; Leaner, J.; Mason, R.; Mukherjee, A.B.; Stracher, G.B.; Streets, D.G.; et al. Global Mercury Emissions to the Atmosphere from Anthropogenic and Natural Sources. Atmospheric Chem. Phys. 2010, 10, 5951–5964. [Google Scholar] [CrossRef]
- Futsaeter, G.; Wilson, S. The UNEP Global Mercury Assessment: Sources, Emissions and Transport. E3S Web Conf. 2013, 1, 36001. [Google Scholar] [CrossRef]
- Driscoll, C.T.; Mason, R.P.; Chan, H.M.; Jacob, D.J.; Pirrone, N. Mercury as a Global Pollutant: Sources, Pathways, and Effects. Environ. Sci. Technol. 2013, 47, 4967–4983. [Google Scholar] [CrossRef]
- Bravo, A.G.; Cosio, C. Biotic Formation of Methylmercury: A Bio–Physico–Chemical Conundrum. Limnol. Oceanogr. 2020, 65, 1010–1027. [Google Scholar] [CrossRef]
- Obrist, D.; Kirk, J.L.; Zhang, L.; Sunderland, E.M.; Jiskra, M.; Selin, N.E. A Review of Global Environmental Mercury Processes in Response to Human and Natural Perturbations: Changes of Emissions, Climate, and Land Use. Ambio 2018, 47, 116–140. [Google Scholar] [CrossRef]
- Avotniece, Z.; Aņiskeviča, S.; Maļinovskis, E. Climate Change Scenarios for Latvia; Latvian Environment, Geology and Meteorology Centre: Riga, Latvia, 2017. [Google Scholar]
- Dai, S.-S.; Yang, Z.; Tong, Y.; Chen, L.; Liu, S.-Y.; Pan, R.; Li, Y.; Zhang, C.-J.; Liu, Y.-R.; Huang, Q. Global Distribution and Environmental Drivers of Methylmercury Production in Sediments. J. Hazard. Mater. 2021, 407, 124700. [Google Scholar] [CrossRef]
- Obrist, D.; Pearson, C.; Webster, J.; Kane, T.; Lin, C.-J.; Aiken, G.R.; Alpers, C.N. A Synthesis of Terrestrial Mercury in the Western United States: Spatial Distribution Defined by Land Cover and Plant Productivity. Sci. Total Environ. 2016, 568, 522–535. [Google Scholar] [CrossRef]
- Jiskra, M.; Wiederhold, J.G.; Skyllberg, U.; Kronberg, R.-M.; Hajdas, I.; Kretzschmar, R. Mercury Deposition and Re-Emission Pathways in Boreal Forest Soils Investigated with Hg Isotope Signatures. Environ. Sci. Technol. 2015, 49, 7188–7196. [Google Scholar] [CrossRef] [PubMed]
- Eklöf, K.; Schelker, J.; Sørensen, R.; Meili, M.; Laudon, H.; von Brömssen, C.; Bishop, K. Impact of Forestry on Total and Methyl-Mercury in Surface Waters: Distinguishing Effects of Logging and Site Preparation. Environ. Sci. Technol. 2014, 48, 4690–4698. [Google Scholar] [CrossRef] [PubMed]
- Wu, P.; Bishop, K.; Von Brömssen, C.; Eklöf, K.; Futter, M.; Hultberg, H.; Martin, J.; Åkerblom, S. Does Forest Harvest Increase the Mercury Concentrations in Fish? Evidence from Swedish Lakes. Sci. Total Environ. 2018, 622–623, 1353–1362. [Google Scholar] [CrossRef]
- Porvari, P.; Verta, M.; Munthe, J.; Haapanen, M. Forestry Practices Increase Mercury and Methyl Mercury Output from Boreal Forest Catchments. Environ. Sci. Technol. 2003, 37, 2389–2393. [Google Scholar] [CrossRef] [PubMed]
- Skyllberg, U.; Westin, M.B.; Meili, M.; Björn, E. Elevated Concentrations of Methyl Mercury in Streams after Forest Clear-Cut: A Consequence of Mobilization from Soil or New Methylation? Environ. Sci. Technol. 2009, 43, 8535–8541. [Google Scholar] [CrossRef] [PubMed]
- Eklöf, K.; Kraus, A.; Weyhenmeyer, G.A.; Meili, M.; Bishop, K. Forestry Influence by Stump Harvest and Site Preparation on Methylmercury, Total Mercury and Other Stream Water Chemistry Parameters Across a Boreal Landscape. Ecosystems 2012, 15, 1308–1320. [Google Scholar] [CrossRef]
- Kronberg, R.; Drott, A.; Jiskra, M.; Wiederhold, J.G.; Björn, E.; Skyllberg, U. Forest Harvest Contribution to Boreal Freshwater Methyl Mercury Load. Glob. Biogeochem. Cycles 2016, 30, 825–843. [Google Scholar] [CrossRef]
- Eklöf, K.; Bishop, K.; Bertilsson, S.; Björn, E.; Buck, M.; Skyllberg, U.; Osman, O.A.; Kronberg, R.-M.; Bravo, A.G. Formation of Mercury Methylation Hotspots as a Consequence of Forestry Operations. Sci. Total Environ. 2018, 613–614, 1069–1078. [Google Scholar] [CrossRef]
- Negrazis, L.; Kidd, K.A.; Erdozain, M.; Emilson, E.J.S.; Mitchell, C.P.J.; Gray, M.A. Effects of Forest Management on Mercury Bioaccumulation and Biomagnification along the River Continuum. Environ. Pollut. 2022, 310, 119810. [Google Scholar] [CrossRef] [PubMed]
- Eklöf, K.; Lidskog, R.; Bishop, K. Managing Swedish Forestry’s Impact on Mercury in Fish: Defining the Impact and Mitigation Measures. Ambio 2016, 45, 163–174. [Google Scholar] [CrossRef]
- Sirén, M.; Salmivaara, A.; Ala-Ilomäki, J.; Launiainen, S.; Lindeman, H.; Uusitalo, J.; Sutinen, R.; Hänninen, P. Predicting Forwarder Rut Formation on Fine-Grained Mineral Soils. Scand. J. For. Res. 2019, 34, 145–154. [Google Scholar] [CrossRef]
- Hall, B.D.; St. Louis, V.L.; Rolfhus, K.R.; Bodaly, R.A.; Beaty, K.G.; Paterson, M.J.; Cherewyk, K.A.P. Impacts of Reservoir Creation on the Biogeochemical Cycling of Methyl Mercury and Total Mercury in Boreal Upland Forests. Ecosystems 2005, 8, 248–266. [Google Scholar] [CrossRef]
- Bishop, K.; Allan, C.; Bringmark, L.; Garcia, E.; Hellsten, S.; Högbom, L.; Johansson, K.; Lomander, A.; Meili, M.; Munthe, J.; et al. The Effects of Forestry on Hg Bioaccumulation in Nemoral/Boreal Waters and Recommendations for Good Silvicultural Practice. AMBIO J. Hum. Environ. 2009, 38, 373–380. [Google Scholar] [CrossRef]
- Huang, H.; Mackereth, R.W.; Mitchell, C.P.J. Impacts of Forest Harvesting on Mercury Concentrations and Methylmercury Production in Boreal Forest Soils and Stream Sediment. Environ. Pollut. 2024, 341, 122966. [Google Scholar] [CrossRef] [PubMed]
- Latvian Environment, Geology and Meteorology Centre Climate in Latvia. Available online: https://videscentrs.lvgmc.lv/lapas/latvijas-klimats (accessed on 16 January 2024).
- Latvian State Forest Research Institute “Silava” Depth-to Water Map. Available online: https://www.silava.lv/pakalpojumi/kartografiskie-materiali (accessed on 16 January 2024).
- QGIS Development Team. QGIS Geographic Information System. Available online: https://www.qgis.org (accessed on 12 February 2024).
- Wang, L.; Liu, H. An Efficient Method for Identifying and Filling Surface Depressions in Digital Elevation Models for Hydrologic Analysis and Modelling. Int. J. Geogr. Inf. Sci. 2006, 20, 193–213. [Google Scholar] [CrossRef]
- Conrad, O.; Bechtel, B.; Bock, M.; Dietrich, H.; Fischer, E.; Gerlitz, L.; Wehberg, J.; Wichmann, V.; Böhner, J. System for Automated Geoscientific Analyses (SAGA) v. 2.1.4. Geosci. Model Dev. 2015, 8, 1991–2007. [Google Scholar] [CrossRef]
- Freeman, T.G. Calculating Catchment Area with Divergent Flow Based on a Regular Grid. Comput. Geosci. 1991, 17, 413–422. [Google Scholar] [CrossRef]
- Pelletier, J.D. Quantitative Modeling of Earth Surface Processes; Cambridge University Press: Cambridge, UK, 2008; ISBN 978-0-521-85597-6. [Google Scholar]
- GRASS Development Team. Geographic Resources Analysis Support System (GRASS) Software. Available online: https://grass.osgeo.org (accessed on 12 February 2024).
- R Core Team. R: A Language and Environment for Statistical Computing; R Core Team: Vienna, Austria, 2022. [Google Scholar]
- Kucheryavskiy, S. Mdatools—R Package for Chemometrics. Chemom. Intell. Lab. Syst. 2020, 198, 103937. [Google Scholar] [CrossRef]
- Eriksson, L.; Johansson, E.; Kettapeh-Wold, S.; Wold, S. Introduction to Multi- and Megavariate Data Analysis Using Projection Methods (PCA & PLS); Umetrics AB: Umea, Sweden, 1999. [Google Scholar]
- Grigal, D.F. Mercury Sequestration in Forests and Peatlands: A Review. J. Environ. Qual. 2003, 32, 393–405. [Google Scholar] [CrossRef]
- Skyllberg, U.; Qian, J.; Frech, W.; Xia, K.; Bleam, W.F. Distribution of Mercury, Methyl Mercury and Organic Sulphur Species in Soil, Soil Solution and Stream of a Boreal Forest Catchment. Biogeochemistry 2003, 64, 53–76. [Google Scholar] [CrossRef]
- Obrist, D.; Johnson, D.W.; Lindberg, S.E. Mercury Concentrations and Pools in Four Sierra Nevada Forest Sites, and Relationships to Organic Carbon and Nitrogen. Biogeosciences 2009, 6, 765–777. [Google Scholar] [CrossRef]
- Navrátil, T.; Shanley, J.; Rohovec, J.; Hojdová, M.; Penížek, V.; Buchtová, J. Distribution and Pools of Mercury in Czech Forest Soils. Water. Air. Soil Pollut. 2014, 225, 1829. [Google Scholar] [CrossRef]
- Gruba, P.; Socha, J.; Pietrzykowski, M.; Pasichnyk, D. Tree Species Affects the Concentration of Total Mercury (Hg) in Forest Soils: Evidence from a Forest Soil Inventory in Poland. Sci. Total Environ. 2019, 647, 141–148. [Google Scholar] [CrossRef]
- Fostier, A.H.; Amouroux, D.; Tessier, E.; Viana, J.L.M.; Richter, L. Methylmercury Content in Soil and Litter from the Amazonian Rainforest and Its Potential Fate during Forest Fires. Front. Environ. Chem. 2023, 4, 1242915. [Google Scholar] [CrossRef]
- Zhou, J.; Wang, Z.; Zhang, X. Deposition and Fate of Mercury in Litterfall, Litter, and Soil in Coniferous and Broad-Leaved Forests. J. Geophys. Res. Biogeosci. 2018, 123, 2590–2603. [Google Scholar] [CrossRef]
- Åkerblom, S.; Meili, M.; Bringmark, L.; Johansson, K.; Kleja, D.B.; Bergkvist, B. Partitioning of Hg Between Solid and Dissolved Organic Matter in the Humus Layer of Boreal Forests. Water. Air. Soil Pollut. 2008, 189, 239–252. [Google Scholar] [CrossRef]
- De Vos, B.; Cools, N. Second European Forest Soil Condition Report; Results of the BioSoil Soil Survey; Research Institute for Nature and Forest: Brussel, Belgium, 2011; Volume I. [Google Scholar]
- Skyllberg, U. Mercury Biogeochemistry in Soils and Sediments. In Developments in Soil Science; Elsevier: Amsterdam, The Netherlands, 2010; Volume 34, pp. 379–410. ISBN 978-0-444-53261-9. [Google Scholar]
- O’Connor, D.; Hou, D.; Ok, Y.S.; Mulder, J.; Duan, L.; Wu, Q.; Wang, S.; Tack, F.M.G.; Rinklebe, J. Mercury Speciation, Transformation, and Transportation in Soils, Atmospheric Flux, and Implications for Risk Management: A Critical Review. Environ. Int. 2019, 126, 747–761. [Google Scholar] [CrossRef]
- Skyllberg, U.; Drott, A.; Lambertsson, L.; Björn, E.; Karlsson, T.; Johnson, T.; Heinemo, S.-Å.; Holmström, H. Net Methylmercury Production as a Basis for Improved Risk Assessment of Mercury-Contaminated Sediments. AMBIO J. Hum. Environ. 2007, 36, 437–442. [Google Scholar] [CrossRef]
- Baptista-Salazar, C.; Liem-Nguyen, V.; Jonsson, S. Experiments Revealing the Formation of Refractory Methylmercury Pools in Natural Sediments and Soils. Geochim. Cosmochim. Acta 2022, 328, 76–84. [Google Scholar] [CrossRef]
- Heyes, A.; Moore, T.R.; Rudd, J.W.; Dugoua, J.J. Methyl Mercury in Pristine and Impounded Boreal Peatlands, Experimental Lakes Area, Ontario. Can. J. Fish. Aquat. Sci. 2000, 57, 2211–2222. [Google Scholar] [CrossRef]
- Bravo, A.G.; Bouchet, S.; Tolu, J.; Björn, E.; Mateos-Rivera, A.; Bertilsson, S. Molecular Composition of Organic Matter Controls Methylmercury Formation in Boreal Lakes. Nat. Commun. 2017, 8, 14255. [Google Scholar] [CrossRef]
- Branfireun, B.A.; Bishop, K.; Roulet, N.T.; Granberg, G.; Nilsson, M. Mercury Cycling in Boreal Ecosystems: The Long-term Effect of Acid Rain Constituents on Peatland Pore Water Methylmercury Concentrations. Geophys. Res. Lett. 2001, 28, 1227–1230. [Google Scholar] [CrossRef]
- Åkerblom, S.; Nilsson, M.B.; Skyllberg, U.; Björn, E.; Jonsson, S.; Ranneby, B.; Bishop, K. Formation and Mobilization of Methylmercury across Natural and Experimental Sulfur Deposition Gradients. Environ. Pollut. 2020, 263, 114398. [Google Scholar] [CrossRef] [PubMed]
- Wu, Z.; Li, Z.; Shao, B.; Zhang, Y.; He, W.; Lu, Y.; Gusvitskii, K.; Zhao, Y.; Liu, Y.; Wang, X.; et al. Impact of Dissolved Organic Matter and Environmental Factors on Methylmercury Concentrations across Aquatic Ecosystems Inferred from a Global Dataset. Chemosphere 2022, 294, 133713. [Google Scholar] [CrossRef]
- Watt, M.S.; Palmer, D.J. Use of Regression Kriging to Develop a Carbon:Nitrogen Ratio Surface for New Zealand. Geoderma 2012, 183–184, 49–57. [Google Scholar] [CrossRef]
- Watson, C.A.; Atkinson, D.; Gosling, P.; Jackson, L.R.; Rayns, F.W. Managing Soil Fertility in Organic Farming Systems. Soil Use Manag. 2006, 18, 239–247. [Google Scholar] [CrossRef]
- Brust, G.E. Management Strategies for Organic Vegetable Fertility. In Safety and Practice for Organic Food; Elsevier: Amsterdam, The Netherlands, 2019; pp. 193–212. ISBN 978-0-12-812060-6. [Google Scholar]
- Yu, X.; Driscoll, C.T.; Warby, R.A.F.; Montesdeoca, M.; Johnson, C.E. Soil Mercury and Its Response to Atmospheric Mercury Deposition across the Northeastern United States. Ecol. Appl. 2014, 24, 812–822. [Google Scholar] [CrossRef]
- Li, Z.; Wang, T.; Yang, X.; Wen, X.; Chen, W.; He, Y.; Yu, Z.; Zhang, C. Microbial Community Function and Methylmercury Production in Oxygen-Limited Paddy Soil. Ecotoxicol. Environ. Saf. 2023, 266, 115585. [Google Scholar] [CrossRef]
- Chang, D.; Li, S.; Lai, Z. Effects of Extreme Precipitation Intensity and Duration on the Runoff and Nutrient Yields. J. Hydrol. 2023, 626, 130281. [Google Scholar] [CrossRef]
- Cui, X.; Ouyang, W.; Liu, L.; Guo, Z.; Zhu, W. Nitrate Losses from Forest during Snowmelt: An Underestimated Source in Mid-High Latitude Watershed. Water Res. 2024, 249, 121005. [Google Scholar] [CrossRef] [PubMed]
- Mitchell, C.P.J.; Branfireun, B.A.; Kolka, R.K. Spatial Characteristics of Net Methylmercury Production Hot Spots in Peatlands. Environ. Sci. Technol. 2008, 42, 1010–1016. [Google Scholar] [CrossRef] [PubMed]
Figure 1.
Location of the research area in the Baltic Sea region, in the Daugava watershed (a) and location of the study sites in the Zalvīte stream catchment (b). The bold dark blue line represents the Zalvīte stream catchment boundaries, fine blue lines represent the hydrological network and the green fill represents forested areas (b).

Figure 2.
Weekly mean air temperature and weekly total precipitation in the Zalvīte stream catchment in 2022. The blue bars represent weekly sum of precipitation (right y axis) and the black line represents weekly mean air temperature (left y axis).
Figure 2.
Weekly mean air temperature and weekly total precipitation in the Zalvīte stream catchment in 2022. The blue bars represent weekly sum of precipitation (right y axis) and the black line represents weekly mean air temperature (left y axis).

Figure 3.
Variation in THg and MeHg concentrations and percentage of THg as MeHg (%MeHg) in the sediments of forest management induced terrain depressions and in nearby undisturbed soil among six study sites in hemiboreal forests with organic-matter-rich soil. In the boxplots, the median is shown by the bold line, the mean is shown by the black dot, the box corresponds to the lower and upper quartiles, the whiskers show the minimal and maximal values (within 150% of the interquartile range from the median) and the dots outside the box and whiskers represent the outliers of the datasets. Coloured dots represent different seasons (spring, summer and autumn).

Figure 4.
Spearman’s correlations between the physicochemical parameters of sediment and water in terrain depressions. Positive correlations are displayed in blue and negative correlations in red. Colour intensity and the size of the circle are proportional to the correlation coefficients. In the right side of the correlogram, the legend colour shows the Spearman’s correlation coefficients (ρ) and the corresponding colours. Correlations with p > 0.05 are considered as insignificant (crosses are added).

Figure 5.
Spearman’s correlations between topsoil physicochemical parameters. Positive correlations are displayed in blue and negative correlations in red. Colour intensity and the size of the circle are proportional to the correlation coefficients. In the right side of the correlogram, the legend colour shows the correlation coefficients and the corresponding colours. Correlations with p > 0.05 are considered as insignificant (crosses are added).

Figure 6.
Sites with sampling points in forest compartments. Left column—digital terrain models, middle column—depth of terrain depressions (sinks), right column—surface runoff accumulation networks with drainage paths from sampling points.
Figure 6.
Sites with sampling points in forest compartments. Left column—digital terrain models, middle column—depth of terrain depressions (sinks), right column—surface runoff accumulation networks with drainage paths from sampling points.


Table 1.
Description of study sites in the Zalvīte stream catchment in Latvia.
| Site | Forest Type | Soil Type and Moisture Condition | Characterization of Terrain Depressions | Coordinates | |
|---|---|---|---|---|---|
| Type | Age | ||||
| Site 1 | Dryopterioso-caricosa | Organic soil, undrained (naturally wet) | Ruts due to movement of heavy forest machinery | 2018 | 25.2403° N; 56.3739° E |
| Site 2 | Dryopterioso-caricosa | Organic soil, undrained (naturally wet) | Partly functional drainage ditch | Renovated in 2019 | 56.3740° N, 25.2402° E |
| Site 3 | Hylocomiosa | Mineral soil, naturally dry | Mounding pits | 2020 | 56.3714° N; 25.2470° E |
| Site 4 | Oxalidosa turf. mel. | Organic soil, drained | Ruts due to movement of heavy forest machinery | 2018 | 56.3754° N; 25.2613° E |
| Site 5 | Dryopterioso-caricosa | Organic soil, undrained (naturally wet) | Ruts due to movement of heavy forest machinery | 2018 | 56.3744° N; 25.2616° E |
| Site 6 | Myrtillosa turf. mel. | Organic soil, drained | Ruts due to movement of heavy forest machinery | 2018 | 56.3648° N; 25.2665° E |
Table 2.
Topographic characteristics of the forest compartments derived from digital terrain models.
Table 2.
Topographic characteristics of the forest compartments derived from digital terrain models.
| Site | Mean Elevation, m a. s. l. | Min Elevation, m a. s. l. | Max Elevation, m a. s. l. | Max Relative Elevation, m | Area of Studied Forest Compartments, ha |
|---|---|---|---|---|---|
| Site 1 | 77.1 | 76.4 | 79.6 | 3.2 | 1.0 |
| Site 3 | 80.3 | 78.0 | 82.1 | 4.1 | 2.6 |
| Site 4 | 78.8 | 78.1 | 80.5 | 2.4 | 0.7 |
| Site 5 | 78.0 | 76.9 | 79.3 | 2.4 | 1.9 |
| Site 6 | 79.5 | 79.1 | 81.1 | 2.0 | 0.4 |
Table 3.
Groundwater levels of the studied forest compartments and sites according to Depth-to-water map for Baltic states [41].
Table 3.
Groundwater levels of the studied forest compartments and sites according to Depth-to-water map for Baltic states [41].
| Site | Mean Groundwater Level in Forest Compartments, m | Groundwater Level at Rut1/Pit1, m | Groundwater Level at Rut2/Pit2, m | Groundwater Level at Rut3/Pit3, m |
|---|---|---|---|---|
| Site 1 | 0.26 | 0.02 | 0 | 0.26 |
| Site 3 | 1.01 | 1.24 | 0.14 | 1.01 |
| Site 4 | 0.60 | 1.09 | 0.48 | 0.60 |
| Site 5 | 0.13 | 0.17 | 0.12 | 0.13 |
| Site 6 | 0.17 | 0.09 | 0 | 0.17 |
Table 4.
THg and MeHg concentrations in the sediments of forest management induced terrain depressions and in nearby undisturbed soil among six study sites in hemiboreal forests with organic-matter-rich soil.
Table 4.
THg and MeHg concentrations in the sediments of forest management induced terrain depressions and in nearby undisturbed soil among six study sites in hemiboreal forests with organic-matter-rich soil.
| Parameter, Unit | Value | Site 1 | Site 2 | Site 3 | Site 4 | Site 5 | Site 6 |
|---|---|---|---|---|---|---|---|
| Sediment | |||||||
| THg, ng g−1 | Mean ± S.E. | 346.0 ± 14.8 | 133.4 ± 33.3 | 71.4 ± 21.8 | 186.2 ± 29.1 | 259.1 ± 27.8 | 224.3 ± 27.0 |
| Min | 284 | 82.2 | 15.1 | 65.4 | 181 | 149 | |
| Max | 414 | 196 | 239 | 346 | 466 | 412 | |
| MeHg, ng g−1 | Mean ± S.E. | 11.9 ± 1.9 | 2.0 ± 0.8 | 1.8 ± 0.6 | 3.3 ± 0.8 | 4.9 ± 0.7 | 4.0 ± 0.7 |
| Min | 0.8 | 0.5 | 0.3 | 0.7 | 2.7 | 1.7 | |
| Max | 20.0 | 2.7 | 4.9 | 6.7 | 9.4 | 7.1 | |
| Soil | |||||||
| THg, ng g−1 | Mean ± S.E. | 378.1 ± 33.4 | 305.3 ± 12.5 | 183.4 ± 58.9 | 334.6 ± 44.8 | 252.2 ± 18.5 | 287.2 ± 24.1 |
| Min | 223 | 289 | 33.4 | 113 | 141 | 194 | |
| Max | 545 | 330 | 466 | 547 | 339 | 403 | |
| MeHg, ng g−1 | Mean ± S.E. | 4.9 ± 0.8 | 4.1 ± 2.0 | 0.9 ± 0.3 | 4.1 ± 1.7 | 3.3 ± 0.7 | 3.5 ± 0.8 |
| Min | 1.8 | 1.8 | 0.1 | 0.6 | 0.8 | 0.5 | |
| Max | 9.9 | 8.0 | 2.6 | 16.3 | 6.8 | 7.1 | |
Table 5.
General physicochemical parameters of sediment and water in terrain depressions.
| Parameter, Unit | Site 1 | Site 2 | Site 3 | Site 4 | Site 5 | Site 6 |
|---|---|---|---|---|---|---|
| Sediment | ||||||
| TOC, g kg−1 | 405.9 ± 135.3 | 110.4 ± 63.7 | 60.4 ± 20.1 | 371.3 ± 123.8 | 370.3 ± 123.4 | 367.1 ± 122.4 |
| TN, g kg−1 | 25.2 ± 0.9 | 7.3 ± 4.0 | 2.3 ± 0.6 | 18.1 ± 3.0 | 20.3 ± 1.1 | 18.1 ± 1.8 |
| C/N ratio | 16.1 ± 0.3 | 15.2 ± 0.2 | 25.4 ± 0.9 | 21.4 ± 0.8 | 18.2 ± 0.3 | 20.0 ± 1.0 |
| TS, g kg−1 | 6.29 ± 0.50 | 1.14 ± 0.26 | 0.41 ± 0.10 | 2.38 ± 0.38 | 3.03 ± 0.18 | 2.94 ± 0.31 |
| TP, g kg−1 | 1.86 ± 0.11 | 0.73 ± 0.11 | 0.40 ± 0.07 | 0.83 ± 0.08 | 0.94 ± 0.06 | 0.99 ± 0.16 |
| K, g kg−1 | 0.81 ± 0.11 | 0.47 ± 0.04 | 0.57 ± 0.08 | 0.53 ± 0.08 | 0.51 ± 0.04 | 0.60 ± 0.07 |
| Ca, g kg−1 | 16.15 ± 1.96 | 4.50 ± 1.91 | 0.64 ± 0.19 | 17.67 ± 3.79 | 18.89 ± 1.63 | 7.32 ± 1.25 |
| Mg, g kg−1 | 1.45 ± 0.11 | 0.61 ± 0.12 | 0.40 ± 0.08 | 1.86 ± 0.30 | 1.74 ± 0.19 | 1.34 ± 0.12 |
| Fe, g kg−1 | 11.21 ± 1.18 | 7.23 ± 0.36 | 3.56 ± 1.23 | 5.94 ± 0.98 | 9.67 ± 1.10 | 6.74 ± 1.31 |
| Reaction, pH | 4.8 ± 0.2 | 5.4 ± 0.1 | 3.6 ± 0.1 | 5.2 ± 0.1 | 5.3 ± 0.1 | 4.5 ± 0.1 |
| Water | ||||||
| Reaction, pH | 6.4 ± 0.1 | 7.2 ± 0.1 | 4.4 ± 0.1 | 6.1 ± 0.2 | 6.5 ± 0.1 | 5.3 ± 0.2 |
| EC, µS cm−1 | 129.4 ± 11.3 | 203.9 ± 7.8 | 47.6 ± 3.1 | 135.2 ± 22.6 | 141.5 ± 9.7 | 55.1 ± 6.6 |
| DOC, mg L−1 | 52.0 ± 1.5 | 33.6 ± 1.0 | 88.1 ± 5.0 | 76.3 ± 6.8 | 81.4 ± 3.5 | 48.2 ± 5.0 |
| TN, mg L−1 | 2.36 ± 0.37 | 1.03 ± 0.23 | 1.67 ± 0.18 | 2.01 ± 0.19 | 2.86 ± 0.20 | 1.18 ± 0.16 |
| NO3--N, mg L−1 | 0.15 ± 0.13 | 0.07 ± 0.05 | <LOD | 0.07 ± 0.04 | 0.22 ± 0.12 | <LOD |
| NH4+-N, mg L−1 | 0.35 ± 0.22 | 0.03 ± 0.01 | 0.06 ± 0.01 | 0.22 ± 0.06 | 0.36 ± 0.11 | 0.10 ± 0.02 |
| PO43--P, mg L−1 | 0.07 ± 0.03 | 0.03 ± 0.02 | 0.10 ± 0.02 | 0.19 ± 0.13 | 0.18 ± 0.08 | 0.06 ± 0.01 |
| K, mg L−1 | 0.35 ± 0.06 | 0.35 ± 0.07 | 2.09 ± 0.12 | 3.16 ± 0.87 | 1.45 ± 0.55 | 1.14 ± 0.14 |
| Ca, mg L−1 | 23.4 ± 1.9 | 31.5 ± 1.6 | 4.6 ± 0.7 | 24.0 ± 4.3 | 28.2 ± 2.0 | 6.0 ± 1.0 |
| Mg, mg L−1 | 5.28 ± 0.48 | 8.81 ± 0.40 | 2.05 ± 0.24 | 7.21 ± 1.22 | 7.41 ± 0.51 | 2.47 ± 0.36 |
| Fe, mg L−1 | 1.49 ± 0.26 | 0.77 ± 0.14 | 1.48 ± 0.33 | 1.66 ± 0.16 | 2.53 ± 0.39 | 1.11 ± 0.16 |
| SO42−-S, mg L−1 | 2.15 ± 1.08 | 3.32 ± 1.15 | 0.07 ± 0.05 | 0.03 ± 0.01 | 0.76 ± 0.48 | 0.92 ± 0.38 |
| DO, mg L−1 | 5.58 ± 0.87 | 9.69 ± 0.63 | 2.28 ± 0.38 | 4.07 ± 0.63 | 2.90 ± 0.67 | 1.98 ± 0.37 |
Table 6.
General physicochemical parameters of undisturbed topsoil (0–5 cm).
| Parameter, Unit | Site 1 | Site 2 | Site 3 | Site 4 | Site 5 | Site 6 |
|---|---|---|---|---|---|---|
| TOC, g kg−1 | 372.8 ± 27.7 | 326.9 ± 26.6 | 200.5 ± 63.0 | 395.4 ± 37.4 | 459.2 ± 10.7 | 489.4 ± 15.3 |
| TN, g kg−1 | 24.4 ±2.0 | 20.3 ± 0.9 | 7.2 ± 2.4 | 19.9 ± 2.5 | 25.5 ± 0.8 | 22.7 ± 0.7 |
| C/N ratio | 15.3 ± 0.2 | 16.0 ± 0.7 | 30.5 ± 1.8 | 20.8 ± 1.1 | 18.1 ± 0.5 | 21.8 ± 1.2 |
| TS, g kg−1 | 6.42 ± 0.76 | 4.14 ± 0.50 | 0.80 ± 0.25 | 2.29 ± 0.36 | 3.25 ± 0.23 | 3.11 ± 0.42 |
| TP, g kg−1 | 1.97 ± 0.17 | 1.60 ± 0.17 | 0.53 ± 0.12 | 1.02 ± 0.13 | 1.29 ± 0.09 | 0.84 ± 0.06 |
| K, g kg−1 | 0.83 ± 0.11 | 0.91 ± 0.05 | 0.51 ± 0.09 | 0.63 ± 0.06 | 0.71 ± 0.10 | 0.62 ± 0.05 |
| Ca, g kg−1 | 17.3 ± 2.8 | 14.6 ± 2.4 | 1.7 ± 0.7 | 17.5 ± 4.2 | 23.0 ± 1.5 | 6.3 ± 0.8 |
| Mg, g kg−1 | 1.68 ± 0.20 | 1.97 ± 0.20 | 0.56 ± 0.18 | 1.85 ± 0.40 | 2.37± 0.20 | 1.10 ± 0.13 |
| Fe, g kg−1 | 9.99 ± 1.20 | 15.05 ± 3.32 | 2.48 ± 0.56 | 7.20 ± 1.62 | 11.21 ± 1.39 | 3.68 ± 0.80 |
| Reaction, pH | 5.2 ± 0.1 | 5.7 ± 0.2 | 3.5 ± 0.1 | 4.7 ± 0.3 | 5.3 ± 0.1 | 3.5 ± 0.1 |
Table 7.
Water holding capacities of the forest compartments of the sites and modelled drain paths.
| Site | Water Needed to Fill All Depressions of the Forest Compartment, mm | Water Needed to Fill Drain1 Path, mm | Water Needed to Fill Drain2 Path, mm | Water Needed to Fill Drain3 Path, mm |
|---|---|---|---|---|
| Site 1 | R * 6, L 12 | L 35 | L 28 | R 25 |
| Site 3 | 24 | 31 | 38 | 32 |
| Site 4 | 15 | 47 | 29 | 85 |
| Site 5 | 17 | 42 | 40 | 37 |
| Site 6 | 18 | 35 | 38 | 33 |
* R—right bank of the drainage ditch, L—left bank of the drainage ditch.
Table 8.
Water holding capacities of the related drainage micro-catchments of the modelled drain paths.
Table 8.
Water holding capacities of the related drainage micro-catchments of the modelled drain paths.
| Site; Drainage Catchment for Drain Paths of the Sites (If More than One) | Water Needed to Fill All the Depressions of the Drainage Catchment, mm | Area of the Drainage Catchment, ha |
|---|---|---|
| Site 1; drain3 (R *) | 13 | 0.99 |
| Site 1; drain1, drain2 (L) | 36 | 1.89 |
| Site 3 | 29 | 1.42 |
| Site 4; drain1, drain3 | 13 | 1.61 |
| Site 4; drain2 | 12 | 0.05 |
| Site 5 | 25 | 2.56 |
| Site 6 | 13 | 0.99 |
* R—right bank of the drainage ditch, L—left bank of the drainage ditch.
Disclaimer/Publisher’s Note: The statements, opinions and data contained in all publications are solely those of the individual author(s) and contributor(s) and not of MDPI and/or the editor(s). MDPI and/or the editor(s) disclaim responsibility for any injury to people or property resulting from any ideas, methods, instructions or products referred to in the content. |
© 2024 by the authors. Licensee MDPI, Basel, Switzerland. This article is an open access article distributed under the terms and conditions of the Creative Commons Attribution (CC BY) license (https://creativecommons.org/licenses/by/4.0/).
Share and Cite
MDPI and ACS Style
Kļaviņš, I.; Bārdule, A.; Kļaviņa, Z.; Lībiete, Z. Increased Hg Methylation Risks in Management-Induced Terrain Depressions in Forests with Organic-Matter-Rich Soils. Hydrology 2024, 11, 26. https://doi.org/10.3390/hydrology11020026
AMA Style
Kļaviņš I, Bārdule A, Kļaviņa Z, Lībiete Z. Increased Hg Methylation Risks in Management-Induced Terrain Depressions in Forests with Organic-Matter-Rich Soils. Hydrology. 2024; 11(2):26. https://doi.org/10.3390/hydrology11020026
Chicago/Turabian StyleKļaviņš, Ivars, Arta Bārdule, Zane Kļaviņa, and Zane Lībiete. 2024. "Increased Hg Methylation Risks in Management-Induced Terrain Depressions in Forests with Organic-Matter-Rich Soils" Hydrology 11, no. 2: 26. https://doi.org/10.3390/hydrology11020026
Note that from the first issue of 2016, this journal uses article numbers instead of page numbers. See further details here.