Article

Fresh and Recirculated Submarine Groundwater Discharge Evaluated by Geochemical Tracers and a Seepage Meter at Two Sites in the Seto Inland Sea, Japan

1
Faculty of Marine Biosciences, Fukui Prefectural University, Obama, Fukui 917-0003, Japan
2
Research Institute for Humanity and Nature, Kyoto 603-8047, Japan
3
Graduate School of Biosphere Science, Hiroshima University, Hiroshima 739-8528, Japan
4
Atmosphere and Ocean Research Institute, University of Tokyo, Kashiwa, Chiba 277-8564, Japan
*
Author to whom correspondence should be addressed.
Hydrology 2018, 5(4), 61; https://doi.org/10.3390/hydrology5040061
Submission received: 4 September 2018 / Revised: 27 October 2018 / Accepted: 30 October 2018 / Published: 1 November 2018
(This article belongs to the Special Issue Submarine Groundwater Discharge and Its Effects)

Abstract

:
Submarine groundwater discharge (SGD) consists of fresh submarine groundwater discharge (FSGD) and recirculated submarine groundwater discharge (RSGD). In this study, we conducted simultaneous 25-hour time-series measurements of short-lived 222Rn and 224Ra activities at two sites with differing SGD rates in the central Seto Inland Sea of Japan to evaluate SGD rates and their constituents. At both sites, we also quantified the total SGD, FSGD, and RSGD using a seepage meter to verify the water fluxes estimated with 222Rn and 224Ra. SGD rates estimated using 222Rn and 224Ra at the site with significant SGD approximated the total SGD and RSGD measured by the seepage meter. However, SGD rates derived using 222Rn at the site with minor SGD were overestimated, since 222Rn activity at the nearshore mooring site was lower than that in the offshore area. These results suggest that the coupling of short-lived 222Rn and 224Ra is a powerful tool for quantification of FSGD and RSGD, although it is important to confirm that tracer activities in coastal areas are higher than those in offshore.

1. Introduction

Submarine groundwater discharge (SGD) is a common hydrological process in coastal seas. In recent years, SGD has been recognized as one of the important pathways transporting carbon, dissolved nutrients, and trace metals from land to the sea [1]. Quantification of the SGD rate is an essential step in evaluating fluxes of terrestrial materials from local to global scales. SGD includes the discharge of fresh groundwater (fresh submarine groundwater discharge: FSGD) as well as saline groundwater (recirculated submarine groundwater discharge: RSGD) [2]. FSGD is generally driven by hydraulic gradients, whereas many factors including wave setup, tidal pumping, and density-driven convection drive RSGD [3]. Because temporal changes of each driving force complicate the determination of the SGD rate and its constituents, it is very important to quantify the total rates of SGD as well as identify its constituents spatially and temporally.
SGD can be quantified using several approaches. One approach is direct measurement with a seepage meter. Several types of seepage meters are available, including the Lee type [4], the continuous-heat type automated seepage meter [5], and the electromagnetic seepage meter [6]. Seepage meters can divide total SGD into FSGD and RSGD when combined with a salinity sensor [7,8]. Although this approach enables reliable evaluation of FSGD and RSGD rates in a local area, seepage meters have disadvantages when expanding the scale from local to regional, unless a sufficient number of seepage meters is used [9].
The other approach used to quantify SGD rates is the use of geochemical tracers such as radioisotopes and methane [10]. In particular, 222Rn (t1/2 = 3.84 days) and Ra isotopes (223Ra; t1/2 = 11.4 days, 224Ra; t1/2 = 3.66 days, 226Ra; t1/2 = 1600 years, 228Ra; t1/2 = 5.75 years) have been used in many SGD studies [11,12,13,14]. An advantage of this approach is that these tracers indicate an integrated SGD signal flowing into the water column from a variety of aquifers [15], and thus have been used to evaluate SGD rates at local [16,17], embayment [18,19], and global scales [20,21]. 222Rn is generally enriched in groundwater regardless of its constitution (fresh or saline) relative to surface water [22]. Ra isotopes are enriched in saline groundwater, as Ra exists attached to particles in freshwater and dissolves in saline water through ion exchange [23]. Therefore, an estimate of SGD rate using 222Rn activity is thought to represent the total flux of SGD including FSGD and RSGD, while that based on Ra isotopes is likely to represent the RSGD flux. Thus, combining the 222Rn and Ra isotope approaches can provide fluxes of total SGD, RSGD, and FSGD.
In this study, we conducted 25-hour time-series measurements of short-lived 222Rn and 224Ra activities simultaneously at two sites with different SGD rates in the central Seto Inland Sea, Japan (Figure 1), where the maximum tidal amplitude reaches 4 m during spring tide. The non-steady mass balance model proposed by Burnett and Dulaiova [16] was applied to quantify SGD rates. Furthermore, SGD rates were measured directly using an automated seepage meter to verify the SGD rates including total SGD, FSGD, and RSGD using the mass balance model of radioisotopes.

2. Materials and Methods
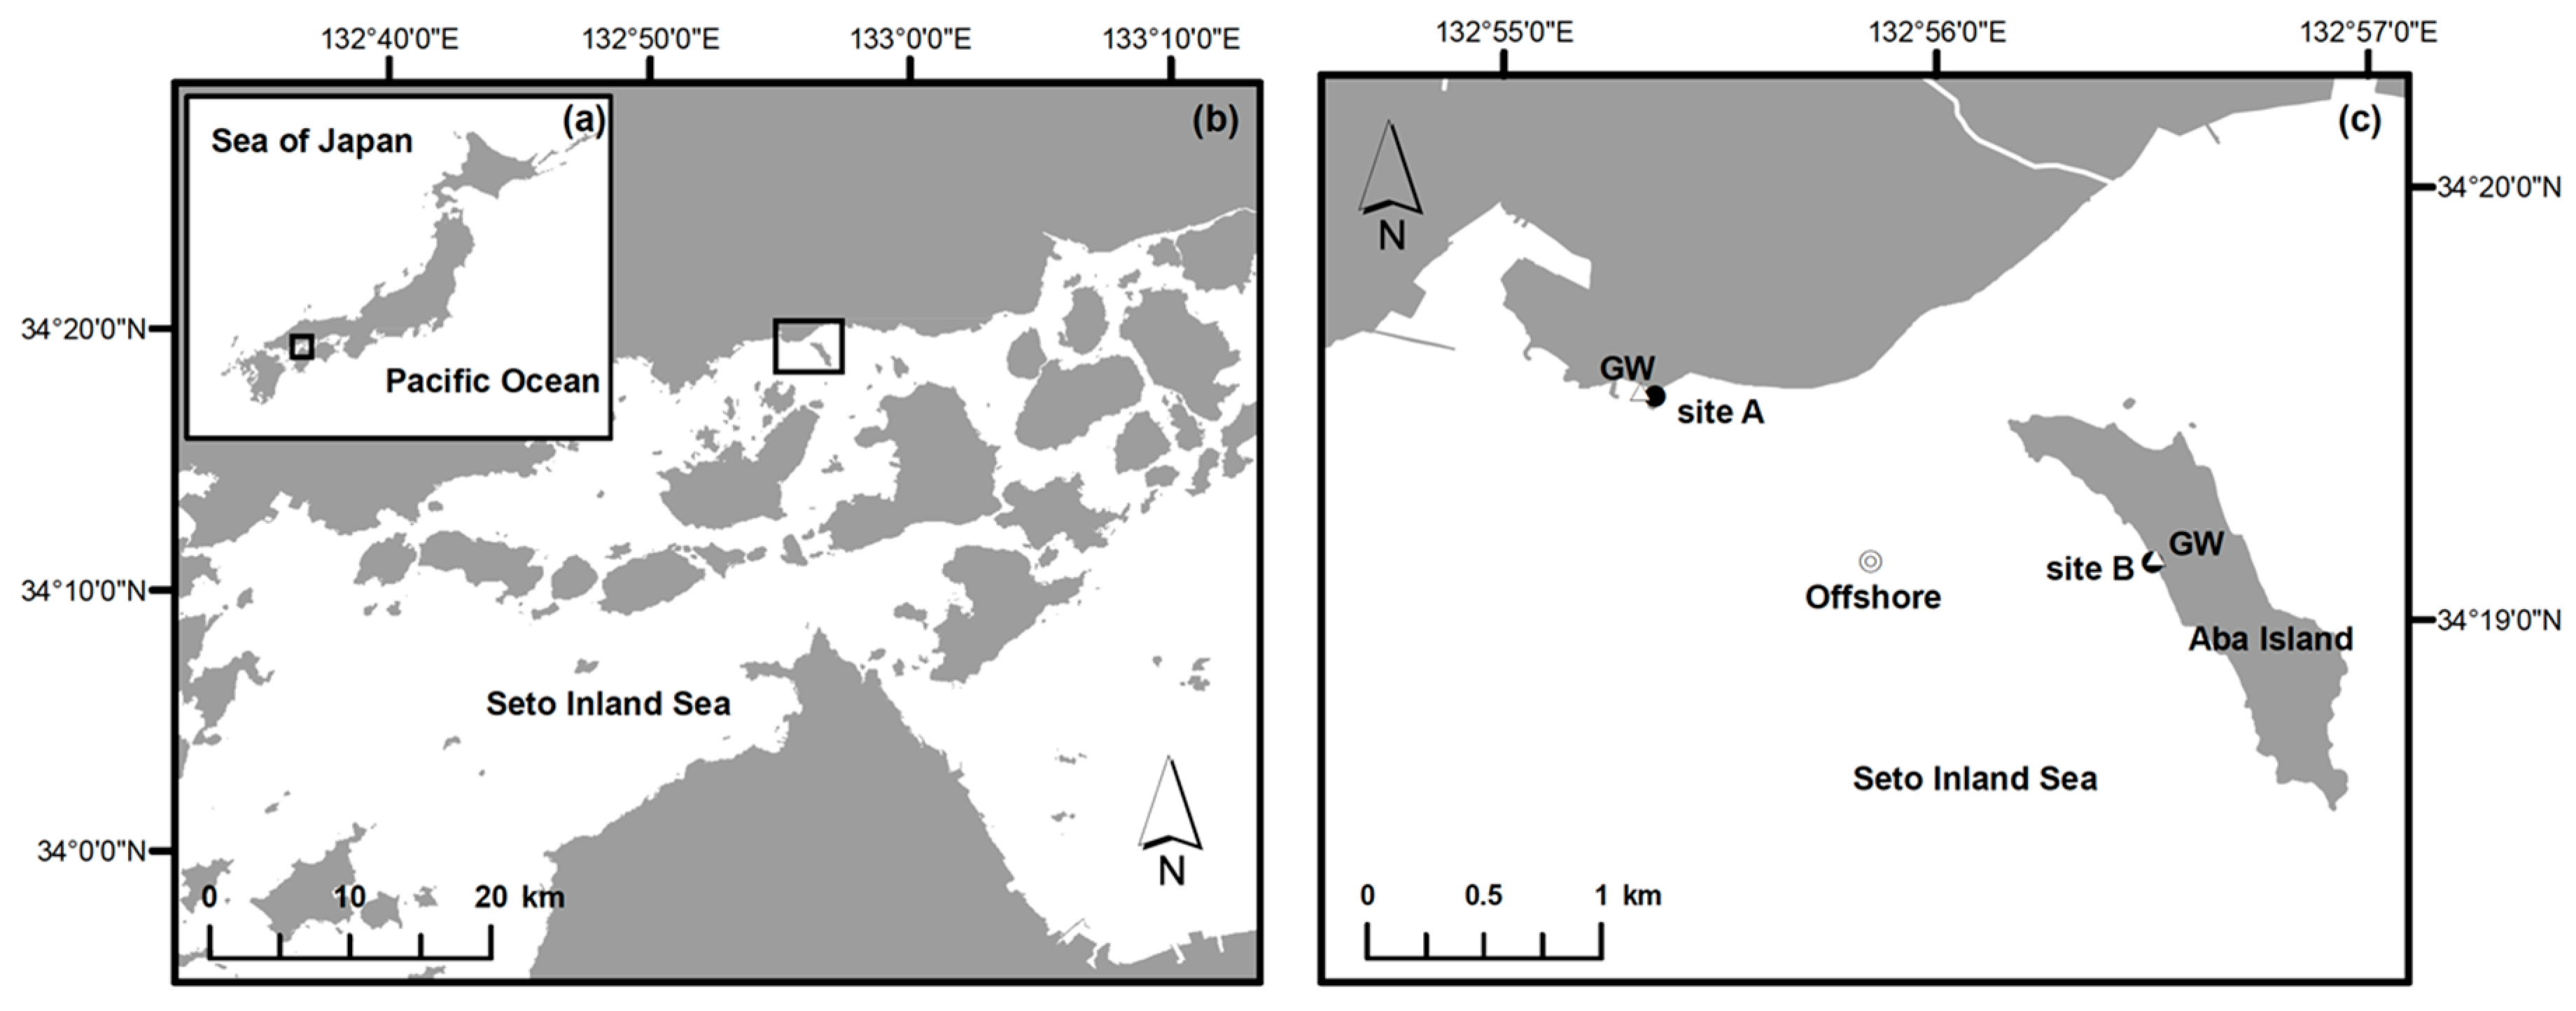
2.1. Field Survey

We deployed mooring systems at two sites, Takehara (site A) and Aba Island (site B) (Figure 1). The former is located in alluvium on the coastal plain where there are abundant groundwater resources. Groundwater in this plain supplies 75% of domestic water use in Takehara city. On the contrary, the latter is located in small island made up biotite granite [24]. According to the preliminary 222Rn survey, it was anticipated that site A has significant SGD, while site B is thought to have only minor SGD [25,26].
The survey was conducted simultaneously from 16:00 on June 6 to 16:00 on June 7 2017, covering a diel tidal cycle at both sites. Continuous heat-type automated seepage meters [5,8] were deployed on the sandy sediment at both sites a few hours before the measurements. Temperature and salinity loggers (MDS Mk-V or A7CT2-USB, JFE Advantech, Hyogo, Japan) were attached inside and outside the chamber. Loggers for water depth (DEFI2-D5HG, JFE Advantech) were also deployed outside the chamber. To determine the water column is well mixed, temperature and salinity loggers were deployed in the surface layer at both sites. Seawater near the seepage meter was continuously pumped via submersible pump and flowed into an air/water exchanger (RAD AQUA, Durridge, Inc., Billerica, MA, USA). 222Rn in the equilibrated air was measured at 20-minute intervals using a radon detector (RAD7, Durridge, Inc.). Exhaust seawater from the exchanger was continuously filtered using an MnO2-impregnated acrylic fiber (Mn-fiber) at <1 L min−1. The Mn-fibers were exchanged every 2 h and the total volumes filtered ranged from 61–72 L. Additionally, atmospheric 222Rn activity for calculation of radon atmospheric evasion was measured at 20-minute intervals using the RAD7 during mooring survey. Data obtained from the loggers and 222Rn data were averaged hourly to eliminate short-term variability.
To use as the end members for the groundwater fluxes calculations, we dug holes in beaches using a hand auger inland from the tide line at each mooring site. Shallow groundwater was collected for 222Rn analysis in 250-mL gas-tight glass vials using a peristaltic pump. Additionally, 10–40 L of groundwater for 224Ra samples was filtered through an Mn-fiber. Three groundwater samples for 222Rn and 224Ra were collected at each site. Offshore seawater was collected during the mooring surveys to measure 222Rn and 224Ra activities. Surface seawater was collected into a 7-L high-density polyethylene (HDPE) bottle for 222Rn and into a barrel for Ra isotopes. A total of 130 L was filtered through an Mn-fiber for Ra isotopes.

2.2. Analytical Methods

Each Mn-fiber was rinsed with radium-free water and then partially dried following the method of Kim et al. [27]. Activity of 224Ra was immediately measured using the RAD7 [28]. Briefly, air involving 220Rn regenerated from 224Ra in Mn-fiber was measured for 6 h with 15 min cycle via open loop system for each sample. 228Th activity was measured with the same method used for 224Ra analysis, >2 weeks after the sampling date. 226Ra activity of offshore seawater was measured with the RAD7 after secular equilibrium between 222Rn and 226Ra was reached in a gas-tight cartridge to estimate excess 222Rn in the field [28].
Groundwater samples for measuring 222Rn were maintained at room temperature and analyzed using the RAD H2O system (Durridge, Inc.). This system equilibrates 222Rn in air with that in water by degassing radon samples through a closed loop for 5 min. The equilibrated air flows into the RAD7 through a desiccant, and 222Rn activity in the air is analyzed and averaged. Offshore seawater samples were kept in the 7-L HDPE bottle at room temperature and analyzed using the Big-Bottle RAD H2O system (Durridge, Inc.). The sample was aerated at room temperature for 45 min to equilibrate 222Rn in the air with that in water through a closed loop, and then the equilibrated air was measured by RAD7 for 6 h after flowing through desiccant.

2.3. Estimates of SGD Rates by Seepage Meters and Radioisotopes

Total rates of SGD (cm d−1) were measured directly using a seepage meter. The contribution rates of fresh and recirculated SGD can be estimated based on temporal changes in salinity inside and outside the chamber:
dC/dt = Q/V (Ci − C)
where C is the salinity inside the chamber after t hours, Ci is the salinity of groundwater flowing into the chamber, Q is the total SGD rate after t hours, and V is the volume of the chamber. Equation (1) can be modified to Equation (2):
C = Cs exp (−Qt/V) + Ci (1 − exp (−Qt/V))
where Cs is the salinity outside the chamber. Thus, the FSGD and RSGD rates are estimated using the salinity ratio of Ci to Cs along with the total SGD rate as follows:
FSGD = Q × (1 − Ci/Cs)
RSGD = Q × (Ci/Cs)
Variations in the time-series of 222Rn and 224Ra were used to estimate SGD rates with a non-steady mass balance model [16,29]:
FbenthicRnFatm ± FhorRn = 0
FbenthicRa ± FhorRn = 0
where FbenthicRn and FbenthicRa are the combined advective and diffusive fluxes of 222Rn and 224Ra to the overlying water column. λRn and λRa are the decay constants of 222Rn (=0.181 d−1) and 224Ra (=0.189 d−1), IRn and IRa are the inventory of excess 222Rn (=222Rn − 226Ra) and excess 224Ra (=224Ra − 228Th), Fatm is the flux of 222Rn to the atmosphere, and FhorRn and FhorRa are the horizontal mixing factors of 222Rn and 224Ra into or out of the mooring site. Decay within the water column was not considered because fluxes were evaluated on a very short time scale (1−2 h) relative to the half-lives of 222Rn and 224Ra. Fatm was determined based on molecular diffusion and the turbulent transfer model [30,31,32], and detailed calculations were modeled after those of Sugimoto et al. [19]. To calculate SGD rates, we simply divided FbenthicRn and FbenthicRa by the activities of 222Rn and 224Ra in shallow groundwater. We ignored diffusive flux, because flux from the seafloor is usually dominated by SGD [16,33]. 222Rn-derived SGD rates were thus estimated by dividing 222Rn advection by the 222Rn activity of groundwater. 224Ra-derived SGD rates were estimated by dividing 224Ra advection by the activities of 224Ra in groundwater. In this study, we present all fluxes as 1-hour average rates, except for 224Ra (2-hour average).

3. Results

3.1. Characteristics of Groundwater and Offshore Seawater

Table 1 lists salinity and the 222Rn and 224Ra activities of groundwater and offshore seawater. At site A, salinity ranged from 13.8–33.8, and the average 222Rn and 224Ra activities in groundwater were 20.7 ± 17.1 dpm L−1 and 175.2 ± 61.9 dpm 100 L−1, respectively. 222Rn and 224Ra had negative and positive relationships with salinity, respectively (r2 > 0.95), indicating that the major sources of 222Rn and 224Ra were fresh and saline groundwater. In contrast, at site B groundwater salinity ranged from 31.1–33.7, and did not decrease from the tide line inland (Table 1). The average 222Rn and 224Ra activities in groundwater were 16.1 ± 1.3 dpm L−1 and 1042.7 ± 470.0 dpm 100 L−1, respectively. 222Rn, 224Ra, and 226Ra activities in offshore seawater were 3.3 ± 2.3 dpm L−1, 0.0 ± 1.3 dpm 100 L−1, and 7.4 ± 3.4 dpm 100 L−1, respectively.

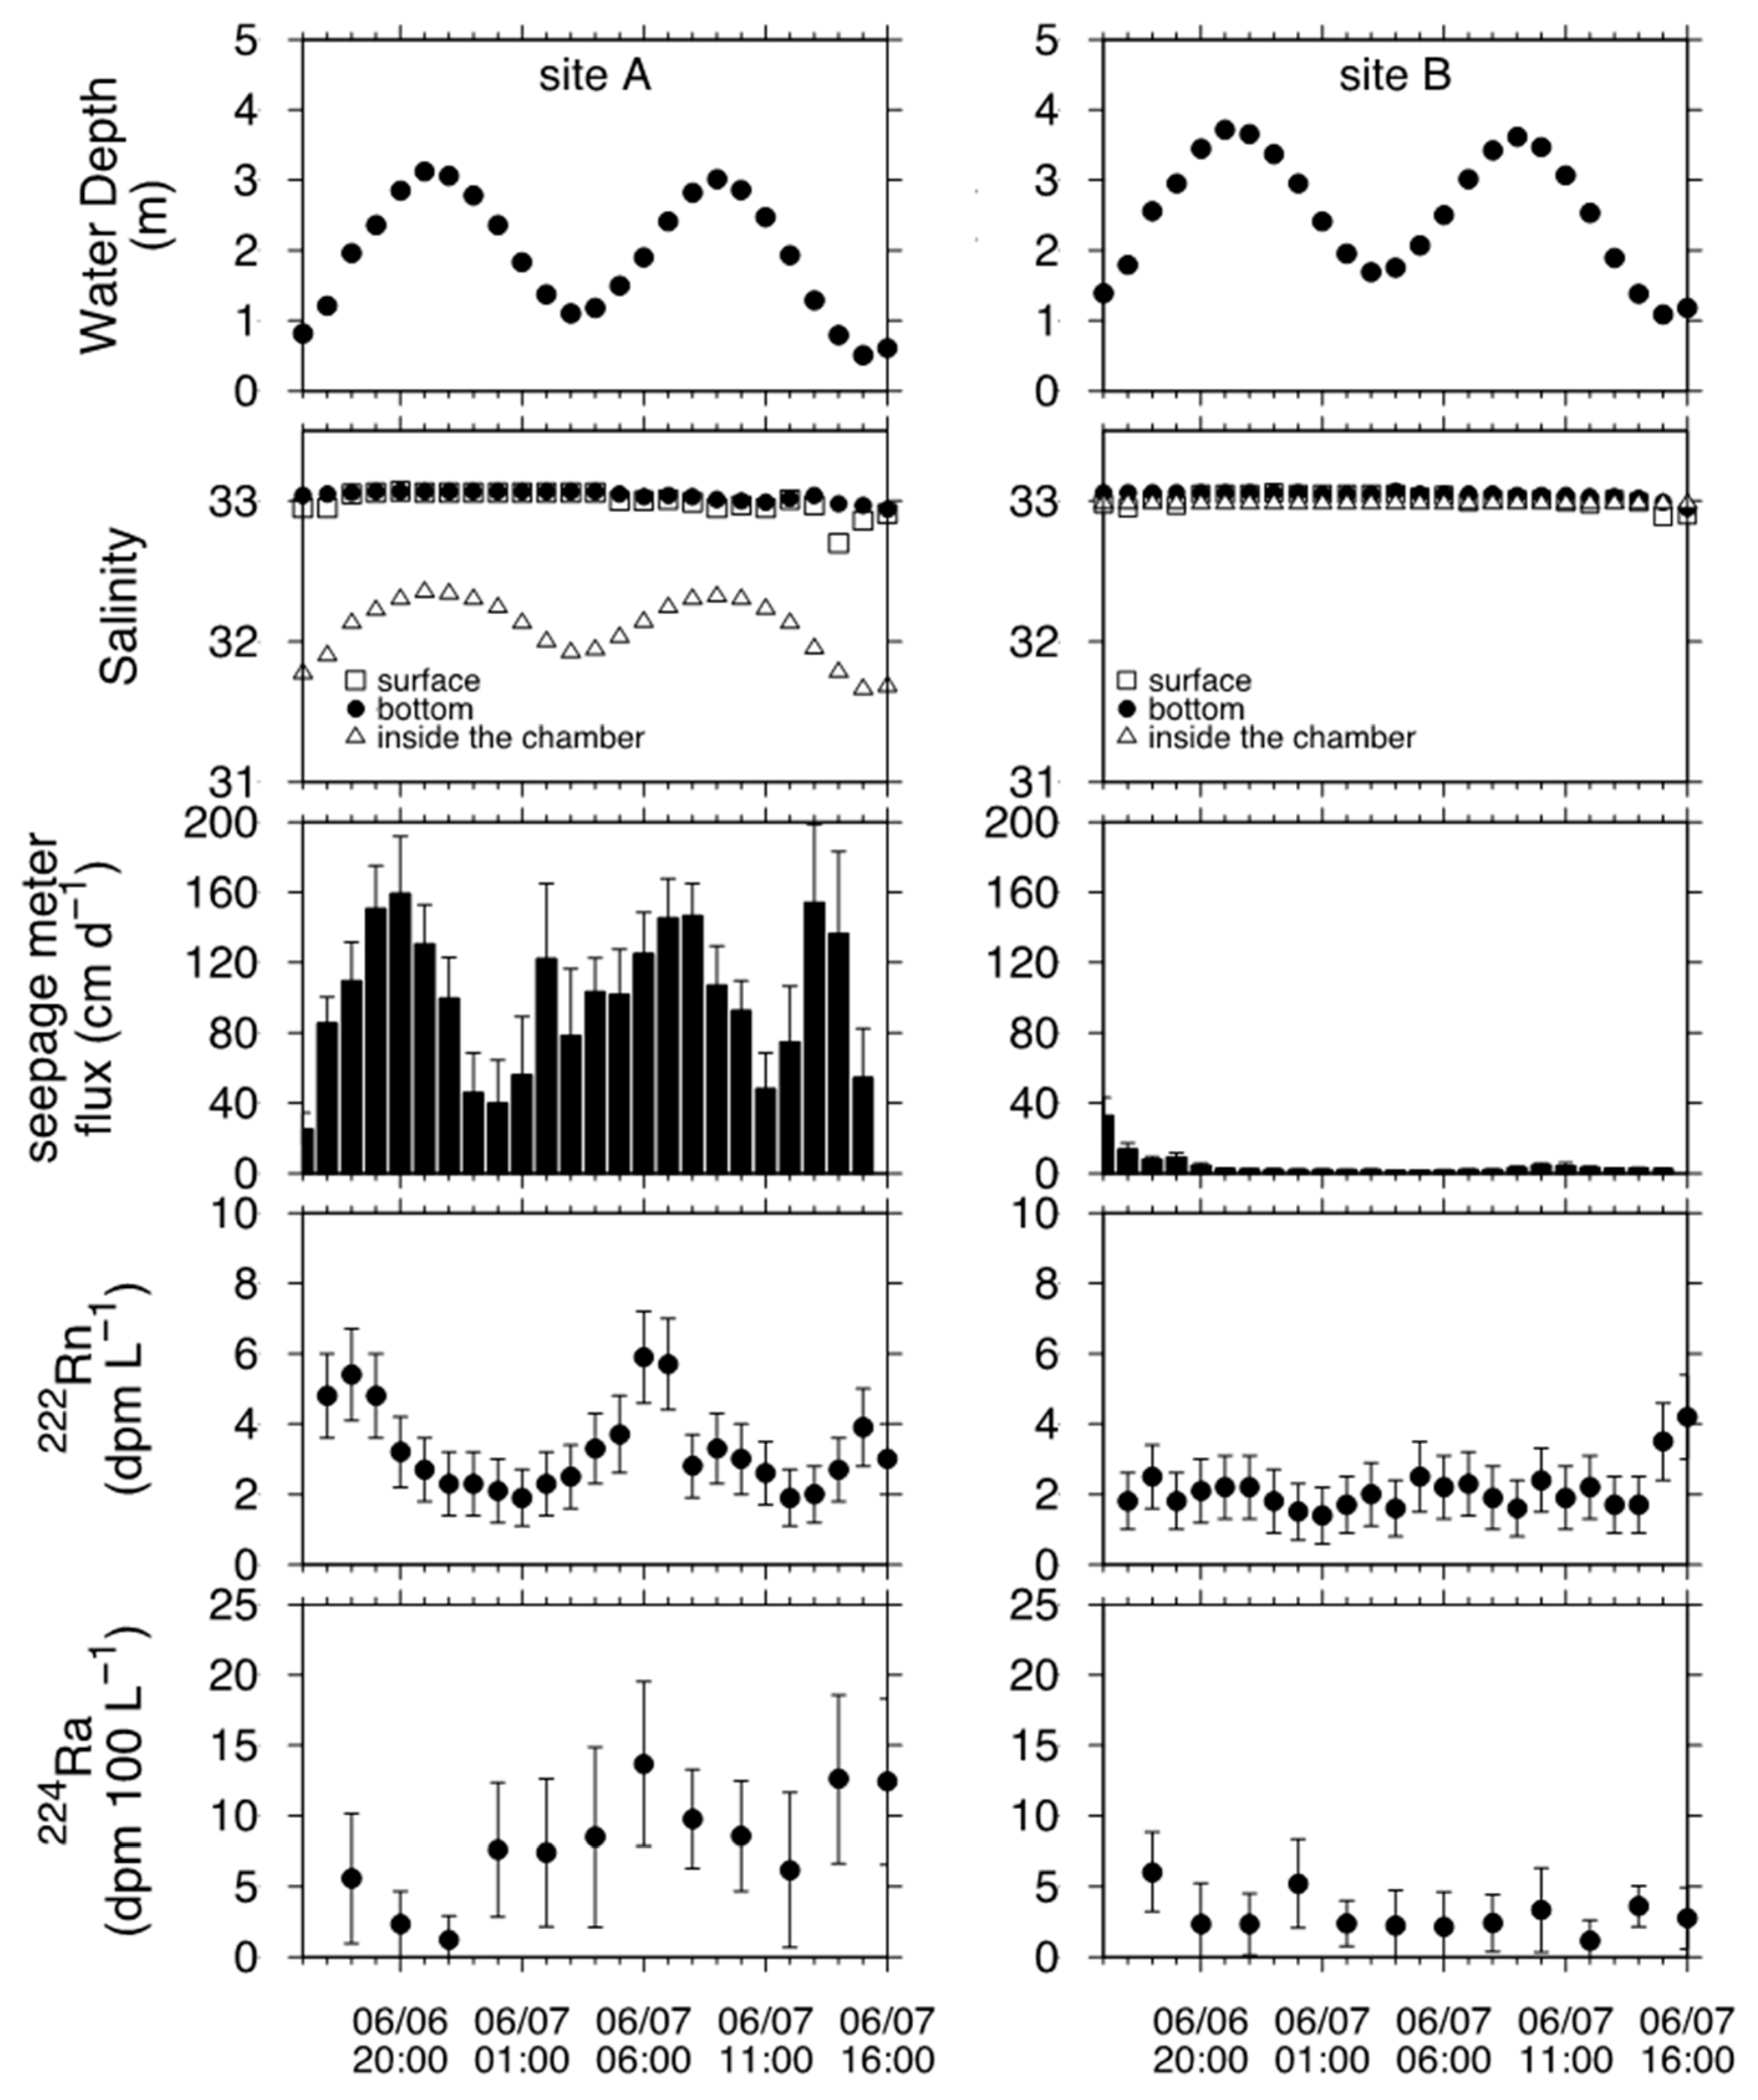
3.2. Temporal Changes in Total SGD Rates and Activities of Geochemical Tracers

Figure 2 presents the time series of water depth, salinity, SGD rates, 222Rn, and 224Ra. The average water depths at site A and site B were 2.0 ± 0.8 m and 2.5 ± 0.8 m, respectively, and the maximum tidal range was 2.7 m at both sites during the mooring. Few temporal changes were observed in the salinity of bottom and surface seawaters at site A, except in surface seawater at the end of the mooring duration, while salinity inside the chamber had a clear pattern of higher values during the high tide and lower values during the low tide. At site B, there were no obvious changes in the salinity of seawater at the bottom or surface measurement points or in the chamber.
SGD rates measured using a seepage meter at site A ranged from 25.3–159.3 cm d−1, with an average ± SD of 99.8 ± 39.3 cm d−1, and showed several peaks during the ebb and flood tides. In contrast, at site B, hourly-averaged SGD rates ranged from 1.9–32.8 cm d−1 (mean ± SD = 4.9 ± 6.4 cm d−1). Little temporal change was observed.
222Rn activity at site A exhibited temporal changes, and the highest peaks of 222Rn (>5 dpm L−1) were observed with a few hours lag after the ebb tide. Temporal changes in 224Ra activities were similar to 222Rn. The average 222Rn and 224Ra activities in seawater were 3.3 ± 1.3 dpm L−1 and 8.0 ± 3.7 dpm 100 L−1, respectively. At site B, there were no temporal changes in 222Rn and 224Ra compared to those at site A. The average 222Rn and 224Ra activities in seawater were 2.1 ± 0.8 dpm L−1 and 3.0 ± 1.3 dpm 100 L−1, respectively.

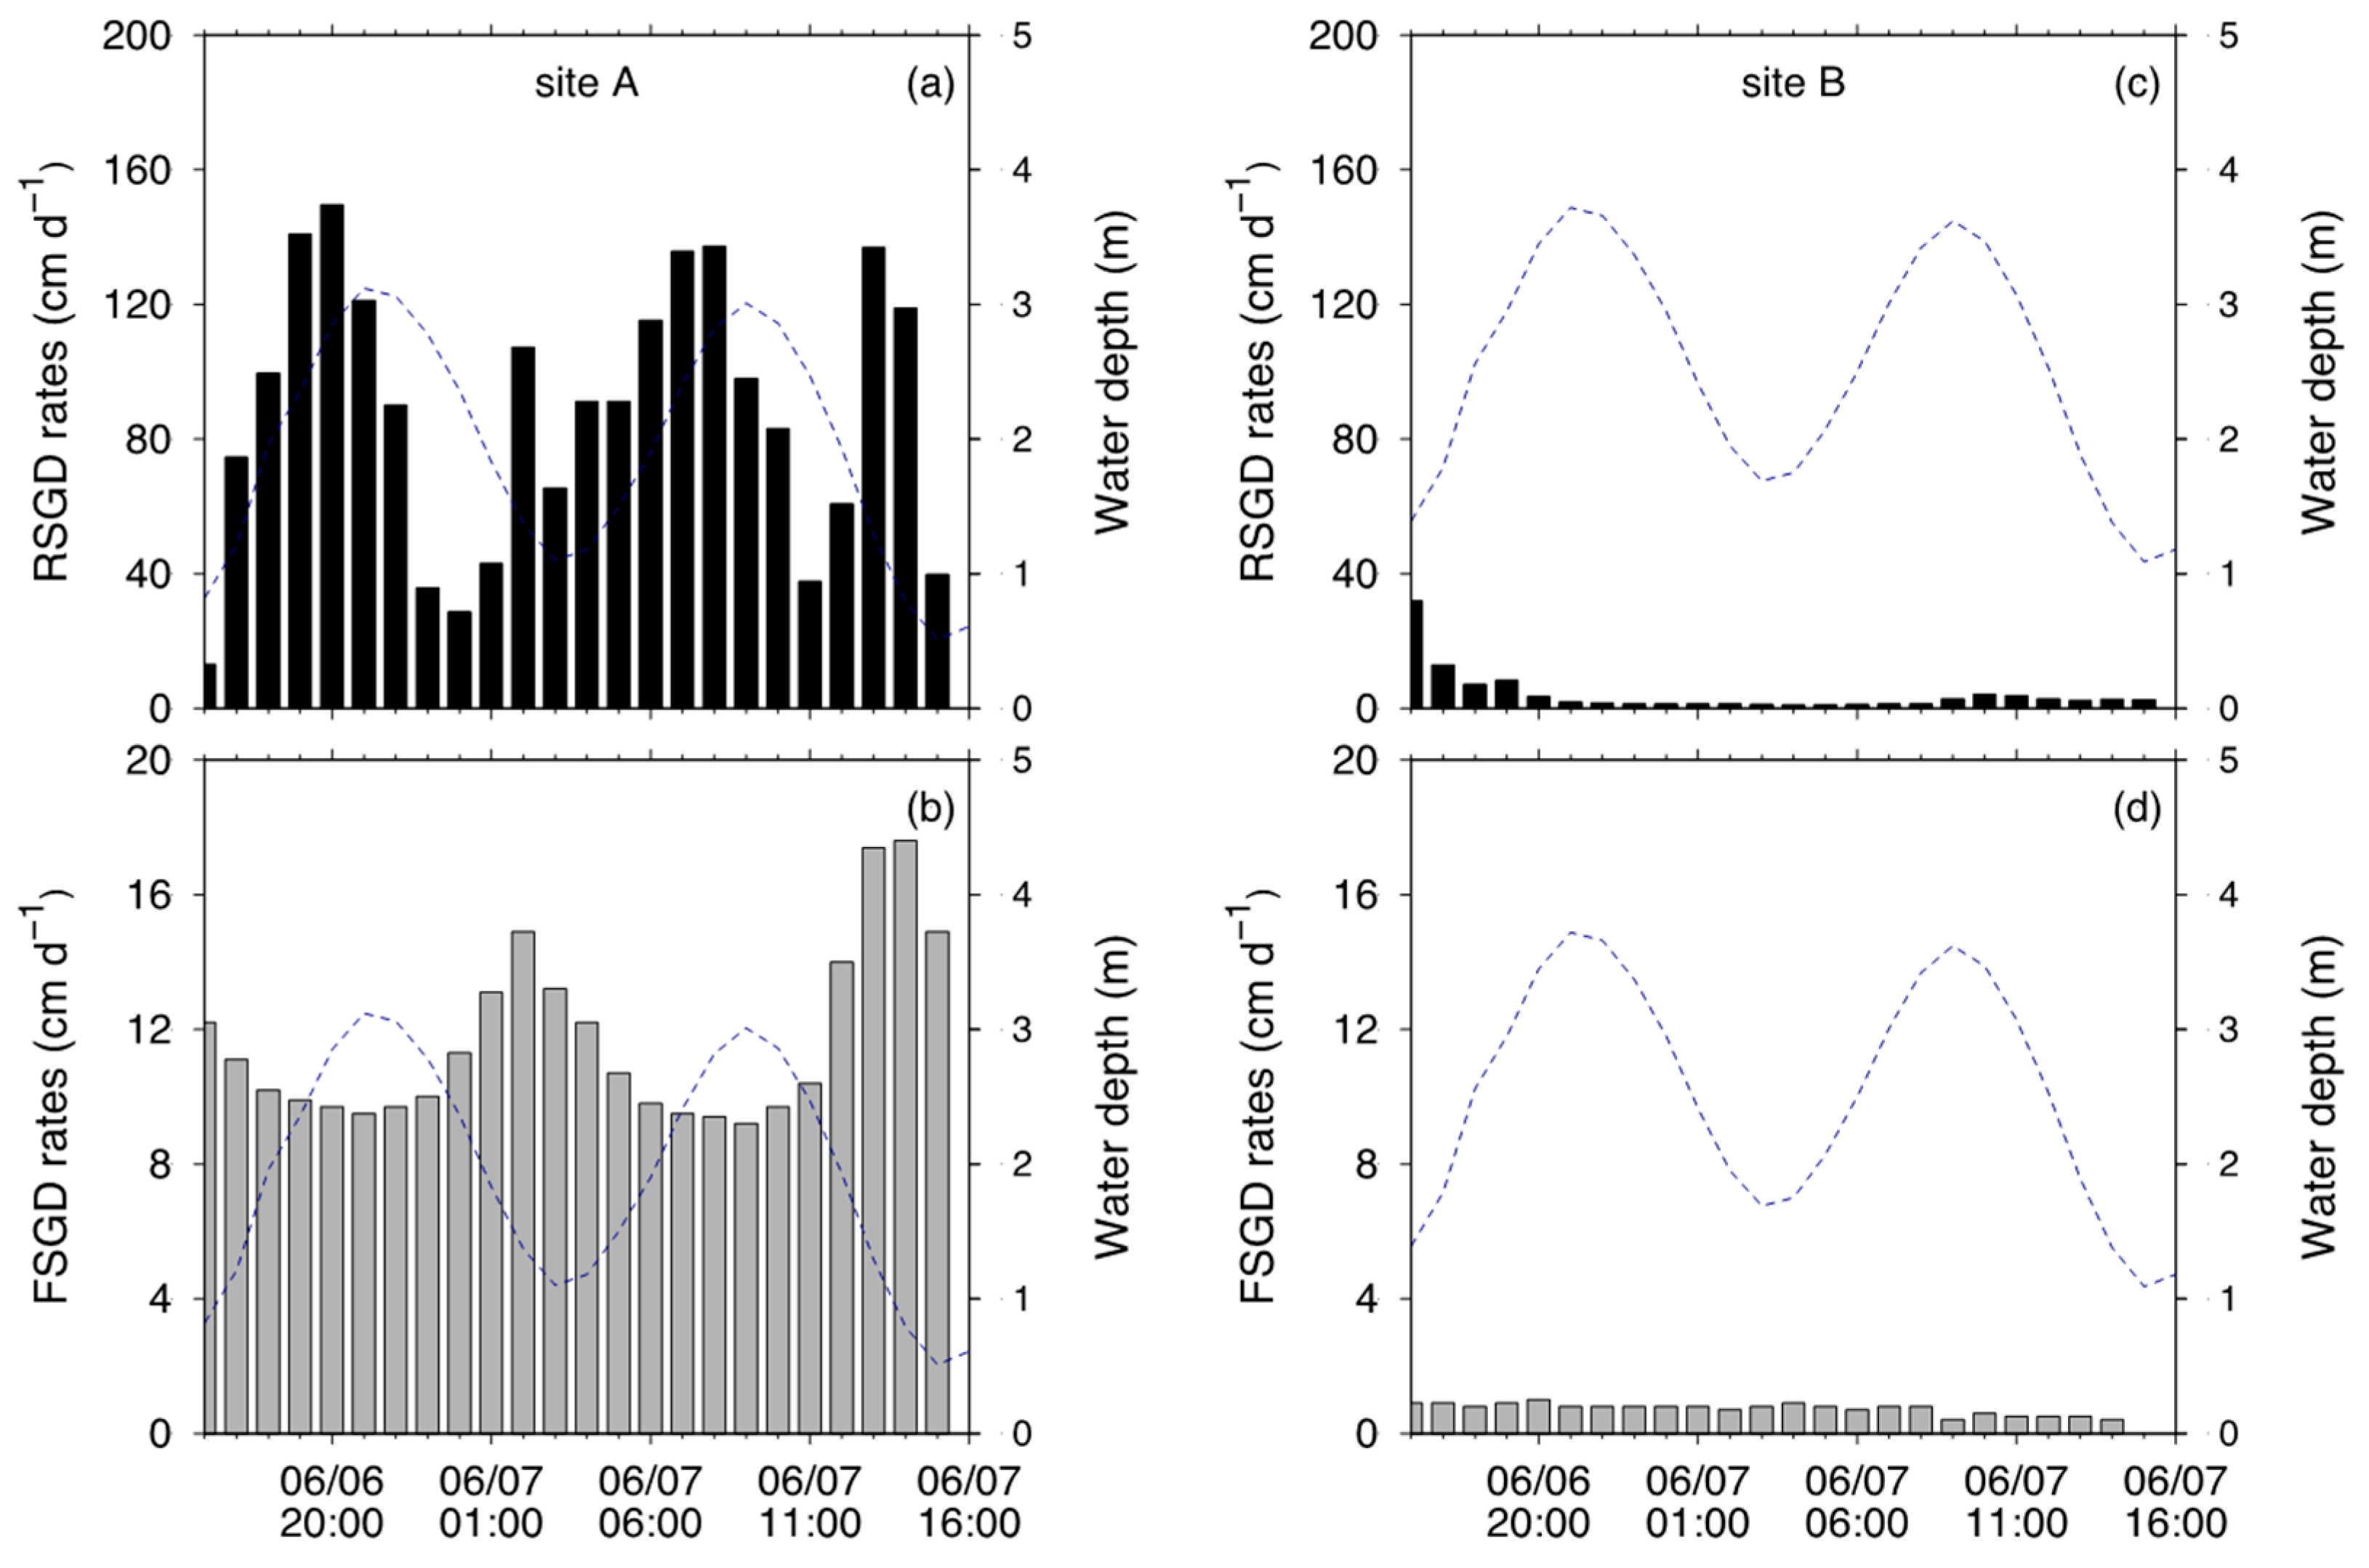
3.3. FSGD and RSGD Quantified via Seepage Meter

The temporal changes in RSGD rates at site A ranged from 13.0–149.6 cm d−1, increasing from the lowest tide to the highest tide and then decreasing from the highest tide to the lowest tide (Figure 3a). In contrast, approximately 10 cm d−1 of FSGD was observed throughout the mooring duration, and FSGD exhibited clear peaks (ca. 15 cm d−1) during ebb tides (Figure 3b). The average rates of FSGD and RSGD were 11.6 ± 2.5 cm d−1 and 88.1 ± 39.4 cm d−1, respectively. Although RSGD was a major component of SGD and accounted for 85.1% of the average SGD rate, the fraction of FSGD increased to approximately 20% during the ebb tides.
At site B, the rates of FSGD and RSGD ranged from 0.0–1.0 cm d−1 and from 1.0–31.9 cm d−1, respectively, and the average ± SD of each flux was 0.7 ± 0.2 cm d−1 and 4.2 ± 6.4 cm d−1 (Figure 3c,d). There were no obvious trends in FSGD and RSGD with the tidal cycle. At a daily scale, RSGD accounted for 75.5 % of the SGD rate at site B.

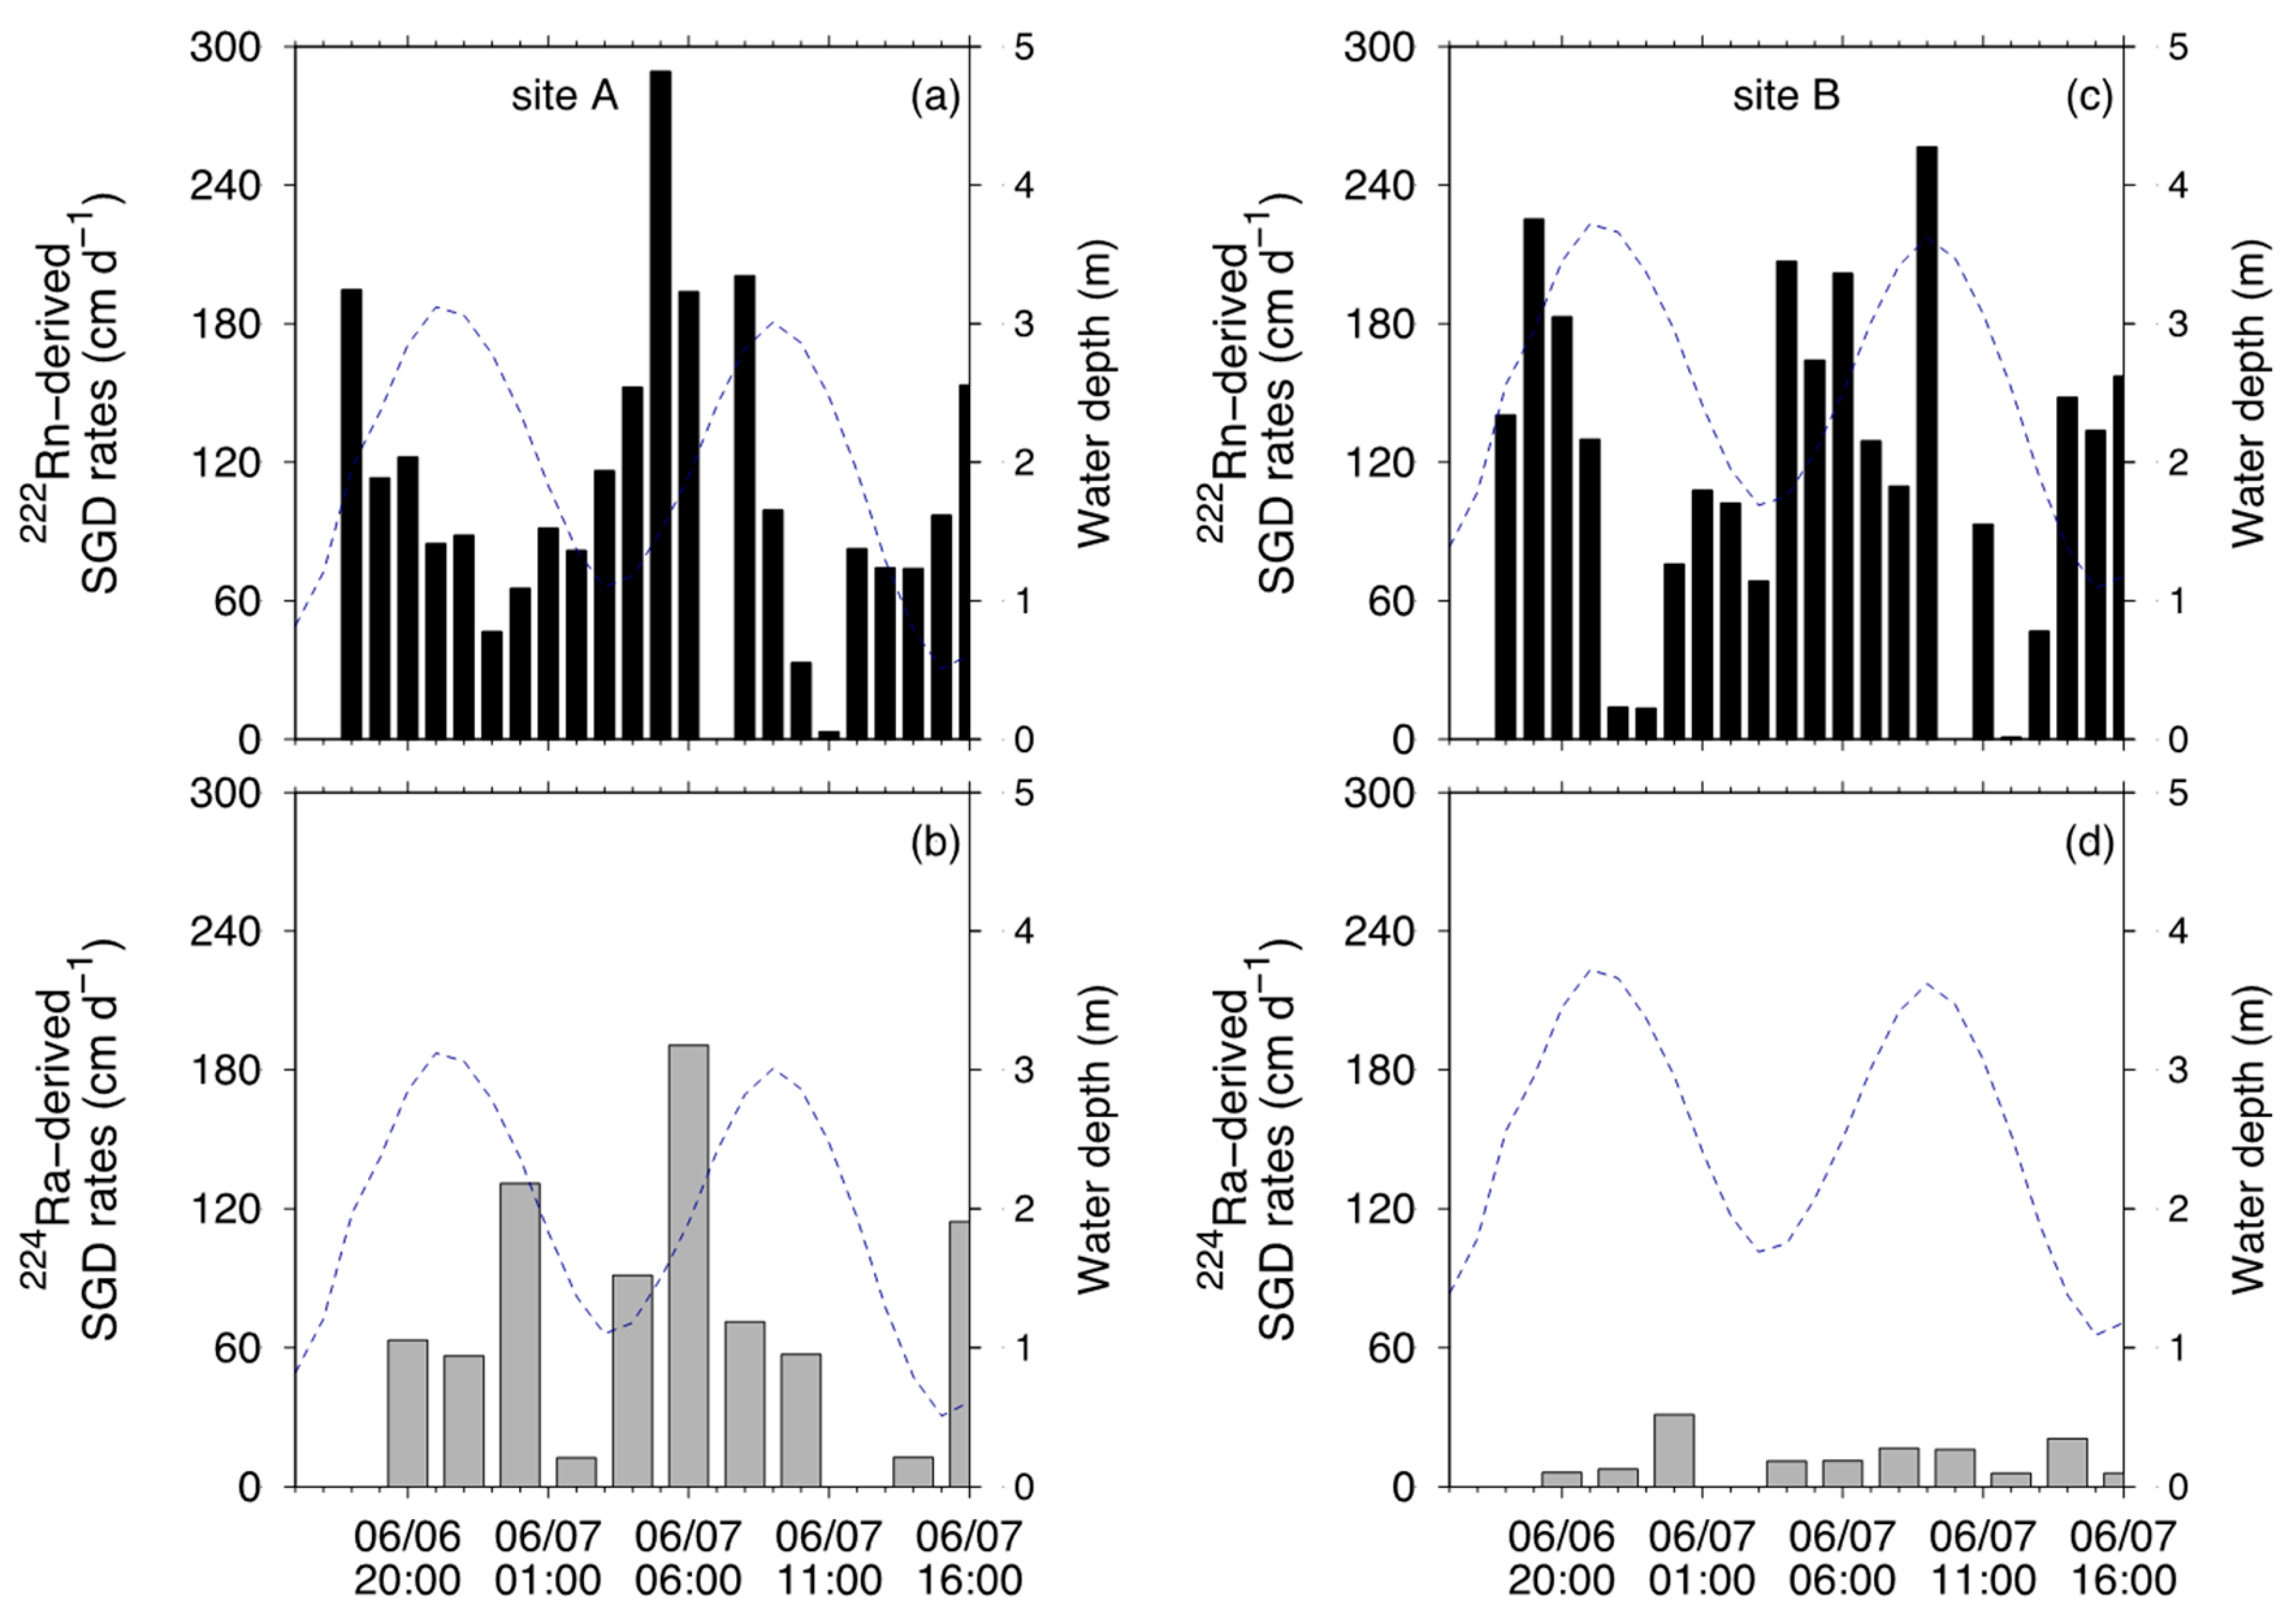
3.4. SGD Rates Quantified by 222Rn and 224Ra Mass Balance Model

To calculate the mass balance model for 224Ra, we used the average values (175.2 ± 61.9 dpm 100 L−1 at site A and 1042.7 ± 467.0 dpm 100 L−1 at site B, respectively) as saline groundwater end members. In contrast, we used the intercepts (=67.5 dpm L−1 at site A and 47.7 dpm L−1 at site B) obtained from mixing lines of 222Rn and salinity at both sites as end members for 222Rn-derived SGD rates. This is because 222Rn-derived SGD rates at site A were not calculated from mean value but the intercept showed good agreement with total SGD rates using seepage meter (see Section 4.2 and Section 4.3).
At site A, 222Rn-derived SGD rates ranged from 0.0–289.2 cm d−1 with an average of 106.9 ± 65.8 cm d−1 and 224Ra-derived rates ranged from 0.0–190.6 cm d−1 with an average of 72.7 ± 54.3 cm d−1 (Figure 4a,b). Several peaks were observed during the flood tide. In contrast, at site B, SGD rates ranged from 0.0–256.5 cm d−1 with an average of 117.8 ± 70.8 cm d−1 and from 0.0–31.1 cm d−1 with an average of 12.0 ± 8.3 cm d−1 as estimated by 222Rn and 224Ra, respectively (Figure 4c,d).

4. Discussion

4.1. Factors Controlling Temporal Changes in SGD Rates

SGD rates measured with seepage meters had marked temporal changes, particularly at site A. The semi-diurnal changes of tidal height are known to drive temporal changes in SGD rates [34,35,36]. In this study, FSGD rates at site A had a negative relationship with water depth (r2 = 0.57, p < 0.001: Figure 5), which can be explained through temporal changes in the hydraulic gradient between groundwater table and sea level. In contrast, we did not find a significant relationship between RSGD rates and water depth at site A (r2 = 0.07, p = 0.21), possibly due to complicated driving factors such as tidal pumping, wave setup, and density-driven convection [3,37,38]. In some cases, peaks of SGD rates have been observed a few hours after the lowest tide [7,39]. Taniguchi et al. [7] pointed out that time lags were predominately caused by recirculated saline groundwater. Considering the time lags between RSGD and water depth in this study, higher RSGD rates were found at lower water depths with a 2-hour lag (Figure 6), possibly due to tidal pumping that causes seawater infiltration at high tide and discharge at low tide. However, higher RSGD rates were also observed at greater water depths (Figure 6). Similar results have been reported from the Japanese coast [40], but the mechanism has not yet been clarified. In future, a long-term mooring survey will be needed to elucidate the driving forces behind RSGD during flood tides.

4.2. Comparison of SGD Rates Estimated using Geochemical Tracers and Seepage Meters

To verify the 222Rn-derived and 224Ra-derived SGD rates, we compared these rates with direct measurements of total SGD, RSGD, and FSGD obtained from seepage meters. Unfortunately, there were no clear relationships among hourly or bi-hourly SGD rates by 222Rn, 224Ra, and seepage meters (r2 < 0.06, p > 0.27). In this study, we therefore compared the average values from a 25-hour mooring survey.
Table 2 lists the daily mean SGD, FSGD, and RSGD rates measured via seepage meter and water fluxes estimated using short-lived radioisotopes 222Rn and 224Ra at both sites. We assumed that the water fluxes estimated from 222Rn and 224Ra represent the total SGD and RSGD rates, respectively. At site A, total SGD (=106.9 cm d−1) and RSGD rates (=72.7 cm d−1) estimated from 222Rn and 224Ra were in good agreement with total SGD (=99.8 cm d−1) and RSGD rates (=88.1 cm d−1) obtained from the seepage meter, respectively. The ratio of RSGD to total SGD based on geochemical tracers (=68.1%) was lower than that from the seepage meter (=88.3%). Thus, geochemical tracers give higher estimates of the FSGD fraction (=31.9%) compared to those from seepage meters (=11.7%). In contrast, at site B, RSGD estimated from 224Ra activity (=12.0 cm d−1) was slightly higher than RSGD quantified using a seepage meter (=4.2 cm d−1), whereas total SGD from 222Rn activity (=117.8 cm d−1) had considerably higher values relative to SGD rates from the seepage meter (=4.9 cm d−1). Because the average 222Rn activity in seawater at site B (2.1 ± 0.8 dpm L−1) was lower than that of offshore seawater (3.3 dpm L−1), overestimates of 222Rn-derived SGD rates at site B might be caused by lower 222Rn activity in seawater relative to offshore seawater.
Although several studies have estimated SGD rates by combining the approaches of seepage meters and geochemical tracers [16,39,41,42,43], few studies have focused on the differentiation of FSGD and RSGD using 222Rn and Ra isotopes with other techniques. Mulligan and Charette [44] compared the differences among total SGD estimated from 222Rn activity, FSGD estimated using Darcy’s law, and RSGD estimated from 226Ra. They concluded that hydrogeological estimation and 222Rn and Ra isotope methods complement each other in Cape Cod, where FSGD is the major component of SGD. In this study, we showed the validity of 222Rn and 224Ra estimates as compared with seepage meter estimates at a site where RSGD dominates total SGD, and demonstrated that coupling of short-lived 222Rn and 224Ra is a useful method for quantifying the constituents of SGD (FSGD versus RSGD). However, we must note that 222Rn and/or 224Ra activities had high values in seawater at the experimental site in comparison to offshore seawater in order to avoid erroneous estimates.

4.3. Uncertainties in SGD Rates Determined using Geochemical Tracers

The most serious uncertainties in SGD rates determined using geochemical tracers are caused by the definition of end member values [45]. In this study, we used the intercept of the mixing line between 222Rn and salinity to determine the 222Rn-derived SGD rate, which agreed well with the total SGD rate obtained using the seepage meter at site A (Table 2). This approach may be not common, because most of the similar studies used mean or median value [33,43,46]. Use of the mean value of 222Rn activity in groundwater (20.7 ± 17.1 dpm L−1) would result in an 222Rn-derived SGD rate approximately three times that determined using the seepage meter (349.4 ± 215.0 cm d−1). According to Cook et al. [47], end members for SGD flux calculations are represented as groundwater, shallow pore water, or a mixture of both. In this study, we have taken only shallow surface groundwater in the beach. In site A, the large SGD fluxes might indicate that mostly deeper groundwater (a couple of meters deep in the sediment) discharges. This deep groundwater represents fresh groundwater where 222Rn is in equilibrium with the sediment. Although we could not grasp this equilibrium value in site A, this value is expected to be higher than 222Rn activity in surface groundwater. This implicates that utilization of the intercept resulted in reasonable estimate for 222Rn-derived SGD to valid seepage SGD flux. On the other hand, 222Rn-derived SGD in site B represents a site where mostly pore water exchange takes place. The sampled 222Rn groundwater end members taken from the beach at site B may not be the representative end members in such a case and as a consequence yield wrong SGD fluxes, which were not supported by the seepage meter measurements.
We used mean Ra activities in saline groundwater to obtain 224Ra-derived SGD rates as RSGD. If we had used the lower (105.1 dpm 100 L−1 at site A and 685.7 dpm 100 L−1 at site B) or higher (245.3 dpm 100 L−1 at site A and 1399.7 dpm 100 L−1 at site B) values of the 95% confidence interval at both sites, the rates would have ranged from −29% to +67% at site A and from −26% to +52% at site B, indicating the need for a larger sample (i.e., >8 samples [14,41,48]) to reduce uncertainties.
Furthermore, analytical errors based on counting error (222Rn = 23.3% and 224Ra = 68.1%) resulted in large uncertainties in SGD estimates. In future work, we will use high-accuracy equipment such as the radium delayed coincidence counter for 224Ra.

5. Conclusions

In this study, we simultaneously quantified SGD rates and identified their constitution (FSGD and RSGD) at one site with significant SGD and one site with minor SGD using different approaches: a seepage meter and geochemical tracers (222Rn and 224Ra). At the site with significant SGD (ca. 100 cm d−1), the seepage meter results showed that the coupling of short-lived 222Rn and 224Ra isotopes is a powerful tool for the quantification of SGD and identification of its constitution, although several issues, such as end member determination, remain. At the site with minor SGD (<10 cm d−1), we could not obtain reasonable results by coupling 222Rn and 224Ra. To prevent estimation errors, we may have to consider the considerably higher activity of tracers in the water column at the target site than in offshore seawater.

Author Contributions

Conceptualization, R.S. and J.S.; Methodology, T.N., R.S. and O.T.; Formal Analysis, T.N. and M.T.; Investigation, T.N., R.S., M.T., H.H. and J. S.; Data Curation, T.N.; Writing-Original Draft Preparation, T.N.; Writing-Review & Editing, R.S., J.S. and M.T.; Visualization, T.N.; Funding Acquisition, R.S., J.S. and M.T.

Funding

This research was funded by JSPS KAKENHI Grant Number 16H06200 and 16H04971.

Acknowledgments

We express our thanks to members of the Research Center for Marine Bioresources, Fukui Prefectural University and the Takehara Marine Laboratory, Hiroshima University, for their assistance in the field experiment. We are grateful to three anonymous reviewers for their helpful comments and suggestions.

Conflicts of Interest

The authors declare no conflict of interest.

References

  1. Slomp, C.P.; Van Cappellen, P. Nutrient inputs to the coastal ocean through submarine groundwater discharge: controls and potential impact. J. Hydrol. 2004, 295, 64–86. [Google Scholar] [CrossRef] [Green Version]
  2. Taniguchi, M.; Burnett, W.C.; Cable, J.E.; Turner, J.V. Investigations of submarine groundwater discharge. Hydrol. Process. 2002, 16, 2115–2129. [Google Scholar] [CrossRef]
  3. Santos, I.R.; Eyre, B.D.; Huettel, M. The driving forces of porewater and groundwater flow in permeable coastal sediments: A review. Estuar. Coast. Shelf Sci. 2012, 98, 1–15. [Google Scholar] [CrossRef]
  4. Lee, D.R. A device for measuring seepage flux in lakes and estuaries. Limnol. Oceanogr. 1977, 22, 140–147. [Google Scholar] [CrossRef] [Green Version]
  5. Taniguchi, M.; Iwakawa, H. Measurements of submarine groundwater discharge rates by a continuous heat-type automated seepage meter in Osaka Bay, Japan. J. Groundw. Hydrol. 2001, 43, 271–277. [Google Scholar] [CrossRef] [Green Version]
  6. Rosenberry, D.O.; Morin, R.H. Use of an electromagnetic seepage meter to investigate temporal variability lake seepage. Groundwater 2004, 42, 140–147. [Google Scholar] [CrossRef]
  7. Taniguchi, M.; Ishitobi, T.; Shimada, J. Dynamics of submarine groundwater discharge and freshwater-seawater interface. J. Geophys. Res. 2006, 111. [Google Scholar] [CrossRef] [Green Version]
  8. Kobayashi, S.; Sugimoto, R.; Honda, H.; Miyata, Y.; Tahara, D.; Tominaga, O.; Shoji, J.; Yamada, M.; Nakada, S.; Taniguchi, M. High-resolution mapping and time-series measurements of 222Rn concentrations and biogeochemical properties related to submarine groundwater discharge along the coast of Obama Bay, a semi-enclosed sea in Japan. Prog. Earth Planet. Sci. 2017, 4, 6. [Google Scholar] [CrossRef]
  9. Michael, H.A.; Lubetsky, J.S.; Harvey, C.F. Characterizing submarine groundwater discharge: A seepage meter study in Waquoit Bay, Massachusetts. Geophys. Res. Lett. 2003, 30. [Google Scholar] [CrossRef] [Green Version]
  10. Cable, J.E.; Bugna, G.C.; Burnett, W.C.; Chanton, J.P. Application of 222Rn and CH4 for assessment of groundwater discharge to the coastal ocean. Limnol. Oceanogr. 1996, 41, 1347–1353. [Google Scholar] [CrossRef]
  11. Moore, W.S. Large groundwater inputs to coastal waters revealed by 226Ra enrichments. Nature 1996, 380, 612. [Google Scholar] [CrossRef]
  12. Santos, I.R.; Eyre, B.D. Radon tracing of groundwater discharge into an Australian estuary surrounded by coastal acid sulphate soils. J. Hydrol. 2011, 396, 246–257. [Google Scholar] [CrossRef]
  13. Su, N.; Burnett, W.C.; Maclntyre, H.L.; Liefer, J.D.; Peterson, R.N.; Viso, R. Natural radon and radium isotopes for assessing groundwater discharge into Little Lagoon, AL: Implications for harmful algal blooms. Estuar. Coast. 2014, 37, 893–910. [Google Scholar] [CrossRef]
  14. Sadat-Noori, M.; Santos, I.R.; Sanders, C.J.; Sanders, L.M.; Maher, D.T. Groundwater discharge into an estuary using spatially distributed radon time series and radium isotopes. J. Hydrol. 2015, 528, 703–719. [Google Scholar] [CrossRef]
  15. Burnett, W.C.; Aggarwal, P.K.; Aureli, A.; Bokuniewicz, H.; Cable, J.E.; Charette, M.A.; Kontar, E.; Krupa, S.; Kulkarni, K.M.; Loveless, A.; et al. Quantifying submarine groundwater discharge in the coastal zone via multiple methods. Sci. Total. Environ. 2006, 367, 498–543. [Google Scholar] [CrossRef] [PubMed]
  16. Burnett, W.C.; Dulaiova, H. Estimating the dynamics of groundwater input into the coastal zone via continuous radon-222 measurements. J. Environ. Radioact. 2003, 69, 21–35. [Google Scholar] [CrossRef]
  17. Santos, I.R.; Burnett, W.C.; Chanton, J.; Mwashote, B.; Suryaputra, I.G.; Dittmar, T. Nutrient biogeochemistry in a Gulf of Mexico subterranean estuary and groundwater-derived fluxes to the coastal ocean. Limnol. Oceanogr. 2008, 53, 705–718. [Google Scholar] [CrossRef] [Green Version]
  18. Charette, M.A.; Buesseler, K.O.; Andrews, J.E. Utility of radium isotopes for evaluating the input and transport of groundwater-derived nitrogen to a Cape Cod estuary. Limnol. Oceanogr. 2001, 46, 465–470. [Google Scholar] [CrossRef] [Green Version]
  19. Sugimoto, R.; Honda, H.; Kobayashi, S.; Takao, T.; Tahara, D.; Tominaga, O.; Taniguchi, M. Seasonal Changes in Submarine Groundwater Discharge and Associated Nutrient Transport into a Tideless Semi-enclosed Embayment (Obama Bay, Japan). Estuar. Coast. 2016, 39, 13–26. [Google Scholar] [CrossRef]
  20. Kwon, E.Y.; Kim, G.; Primeau, F.; Moore, W.S.; Cho, H.-M.; DeVries, T.; Cho, Y.-K. Global estimate of submarine groundwater discharge based on an observationally constrained radium isotope model. Geophys. Res. Lett. 2014, 41, 8433–8444. [Google Scholar] [CrossRef]
  21. Cho, H.M.; Kim, G.; Kwon, E.Y.; Moosdorf, N.; Garcia-Orellana, J.; Santos, I.R. Radium tracing nutrient inputs through submarine groundwater discharge in the global ocean. Sci. Rep. 2018, 8, 2439. [Google Scholar] [CrossRef] [PubMed]
  22. Swarzenski, P.W. U/Th series radionuclides as coastal groundwater tracers. Chem. Rev. 2007, 107, 663–674. [Google Scholar] [CrossRef] [PubMed]
  23. Li, Y.H.; Chan, L.H. Desorption of Ba and 226Ra from river-borne sediments in the Hudson estuary. Earth Planet. Sci. Lett. 1979, 43, 343–350. [Google Scholar] [CrossRef]
  24. Matsuura, H. Geology of the Mitsu District with Geological Sheet Map at 1:50,000; Geological Survey of Japan: Okayama, Japan, 2001; 58p, (In Japanese with English abstract 4p).
  25. Onodera, S.I.; Saito, M.; Shimizu, Y. Visit to valuable water springs (102) Valuable waters of coastal area in western part of Hiroshima prefecture. J. Groundw. Hydrol. 2013, 55, 279–288. [Google Scholar] [CrossRef] [Green Version]
  26. Hata, M.; Sugimoto, R.; Hori, M.; Tomiyama, T.; Shoji, J. Occurrence, distribution and prey items of juvenile marbled sole Pseudopleuronectes yokohamae around a submarine groundwater seepage on a tidal flat in southwestern Japan. J. Sea Res. 2016, 111, 47–53. [Google Scholar] [CrossRef]
  27. Kim, G.; Burnett, W.C.; Dulaiova, H.; Swarzenski, P.W.; Moore, W.S. Measurement of 224Ra and 226Ra activities in natural waters using a radon-in-air monitor. Environ. Sci. Technol. 2001, 35, 4680–4683. [Google Scholar] [CrossRef] [PubMed]
  28. Dimova, N.; Burnett, W.C.; Horwitz, E.P.; Lane-Smith, D. Automated measurement of 224Ra and 226Ra in water. Appl. Radiat. Isot. 2007, 65, 428–434. [Google Scholar] [CrossRef] [PubMed]
  29. Hosono, T.; Ono, M.; Burnett, W.C.; Tokunaga, T.; Taniguchi, M.; Akimichi, T. Spatial distribution of submarine groundwater discharge and associated nutrients within a local coastal area. Environ. Sci. Technol. 2012, 46, 5319–5326. [Google Scholar] [CrossRef] [PubMed]
  30. Wanninkhof, R. Relationship between wind speed and gas exchange over the ocean. J. Geophys. Res. 1992, 97, 7373–7382. [Google Scholar] [CrossRef]
  31. Macintyre, S.; Wanninkhof, R.; Chanton, J.P. Trace gas exchange across the air-water interface in freshwater and coastal marine environments. In Biogenic Trace Gases: Measuring Emissions from Soil Water; Matson, P.A., Harris, R.C., Eds.; Blackwell Science Ltd.: Hoboken, NJ, USA, 1995; pp. 52–97. [Google Scholar]
  32. Turner, S.; Malin, G.; Nightingale, P.D.; Liss, P.S. Seasonal variation of dimethyl sulphide in the North Sea and an assessment of fluxes to the atmosphere. Mar. Chem. 1996, 54, 245–262. [Google Scholar] [CrossRef]
  33. Sadat-Noori, M.; Tait, D.R.; Maher, D.T.; Holloway, C.; Santos, I.R. Greenhouse gases and submarine groundwater discharge in a Sydney Harbour embayment (Australia). Estuar. Coast. Shelf Sci. 2017. [Google Scholar] [CrossRef]
  34. Kim, G.; Hwang, D.W. Tidal pumping of groundwater into the coastal ocean revealed from submarine 222Rn and CH4 monitoring. Geophys. Res. Lett. 2002, 29. [Google Scholar] [CrossRef]
  35. Taniguchi, M. Tidal effects on submarine groundwater discharge into the ocean. Geophys. Res. Lett. 2002, 29. [Google Scholar] [CrossRef] [Green Version]
  36. Taniguchi, M.; Iwakawa, H. Submarine groundwater discharge in Osaka Bay, Japan. Limnology 2004, 5, 25–32. [Google Scholar] [CrossRef]
  37. Robinson, C.E.; Xin, P.; Santos, I.R.; Charette, M.A.; Li, L.; Barry, D.A. Groundwater dynamics in subterranean estuaries of coastal unconfined aquifers: Controls on submarine groundwater discharge and chemical inputs to the ocean. Adv. Water Resour. 2017. [Google Scholar] [CrossRef]
  38. Oehler, T.; Mogolló, J.M.; Moosdorf, N.; Winkler, A.; Kopf, A.; Pichler, T. Submarine groundwater discharge within a landslide scar at the French Mediterranean coast. Estuar. Coast. Shelf Sci. 2017, 198, 128–137. [Google Scholar] [CrossRef]
  39. Taniguchi, M.; Burnett, W.C.; Dulaiova, H.; Siringan, F.; Foronda, J.; Wattayakorn, G.; Rungsupa, S.; Kontar, E.A.; Ishitobi, T. Groundwater discharge as an important land-sea pathway into Manila Bay, Philippines. J. Coast. Res. 2008, 24, 15–24. [Google Scholar] [CrossRef]
  40. Ishitobi, T.; Taniguchi, M.; Saeki, K.; Ono, K. Quantitive evaluations of submarine groundwater discharge in Suruga Bay, Japan. Geochemistry 2005, 39, 97–106. [Google Scholar] [CrossRef]
  41. Peterson, R.N.; Burnett, W.C.; Taniguchi, M.; Chen, J.; Santos, I.R.; Ishitobi, T. Radon and radium isotopes assessment of submarine groundwater discharge in the Yellow River delta, China. J. Geophys. Res. 2008, 113. [Google Scholar] [CrossRef]
  42. Santos, I.R.; Burnett, W.C.; Chanton, J.; Dimova, N.; Peterson, P.N. Land or Ocean? Assessing the driving forces of submarine groundwater discharge at a coastal site in the Gulf of Mexico. J. Geophys. Res. 2009, 114. [Google Scholar] [CrossRef]
  43. Swarzenski, P.W.; Izbicki, J.A. Coastal groundwater dynamics off Santa Barbara, California: Combining geochemical tracers, electromagnetic seepmeters, and electrical resistivity. Estuar. Coast. Shelf Sci. 2009, 83, 77–89. [Google Scholar] [CrossRef]
  44. Mulligan, A.E.; Charette, M.A. Intercomparison of submarine groundwater discharge estimates from a sandy unconfined aquifer. J. Hydrol. 2006, 327, 411–425. [Google Scholar] [CrossRef]
  45. Burnett, W.C.; Santos, I.R.; Weinstein, Y.; Swarzenski, P.W.; Herut, B. Remaining uncertainties in the use of Rn-222 as a quantitative tracer of submarine groundwater discharge. IAHS Publ. 2007, 312, 109–118. [Google Scholar]
  46. Santo, I.R.; Erler, D.; Tait, D.; Eyre, B.D. Breathing of a coral cay: Tracing tidally driven seawater recirculation in permeable coral reef sediments. J. Geophys. Res. 2010, 115. [Google Scholar] [CrossRef] [Green Version]
  47. Cook, P.G.; Rodellas, V.; Stieglitz, T.C. Quantifying Surface Water, Porewater, and Groundwater Interactions Using Tracers: Tracer Fluxes, Water Fluxes, and End-member Concentrations. Water Resour. Res. 2018, 54, 2452–2465. [Google Scholar] [CrossRef]
  48. Rodellas, V.; Garcia-Orellana, J.; Masqué, P.; Font-Muñoz, J.S. The influence of sediment sources on radium-derived estimates of Submarine Groundwater Discharge. Mar. Chem. 2015, 171, 107–117. [Google Scholar] [CrossRef] [Green Version]
Figure 1. Location of the study site in the central Seto Inland Sea, Japan. Closed circles, triangles, and double circles show the sites of the time-series experiment, and sampling points of groundwater and offshore seawater, respectively.
Hydrology 05 00061 g001
Figure 2. Temporal changes in water depth (m), salinity, seepage flux (cm d−1), 222Rn (dpm L−1), and 224Ra (dpm 100 L−1) at site A and site B. Error bars show standard deviations (1 − σ).
Hydrology 05 00061 g002
Figure 3. Temporal changes in hourly-averaged recirculated submarine groundwater discharge (RSGD) rates, fresh submarine groundwater discharge (FSGD) rates, and the fraction of FSGD at sites A and B. Broken line (blue) indicates water depth.
Hydrology 05 00061 g003
Figure 4. Temporal changes in SGD rates derived from 222Rn and 224Ra at sites A and B. Broken line (blue) indicates water depth.
Hydrology 05 00061 g004
Figure 5. The relationship between water depth and FSGD rate measured with a seepage meter at site A.
Hydrology 05 00061 g005
Figure 6. The relationship between water depth and RSGD rate measured with a seepage meter with a 2-hour delay at site A.
Hydrology 05 00061 g006
Table 1. Salinity and 222Rn (dpm L−1) and 224Ra (dpm 100 L−1) activities in groundwater and offshore seawater. Errors indicate the standard deviation among repeated measurements.
Distance from the Low Tide Mark(m)Salinity222Rn (dpm L1)224Ra (dpm 100 L1)
site A
GW1133.81.2 ± 1.1260 ± 85.0
GW21021.817.9 ± 6.0150.6 ± 47.7
GW31913.842.9 ± 5.1114.8 ± 59.4
site B
GW4033.714.6 ± 6.5449.3 ± 118.4
GW52033.616.1 ± 2.31080.2 ± 116.5
GW62531.117.7 ± 4.51598.7 ± 150.0
Offshore seawater
OS33.03.3 ± 2.30.0 ± 1.3
Table 2. Mean water flux (cm d−1) and fractions of total SGD, RSGD, and FSGD measured by seepage meters and estimated using geochemical tracers (222Rn and 224Ra). Errors indicate standard deviation among hourly or bi-hourly measurements.
Seepage MeterGeochemical Tracers
(cm d−1)(%)(cm d−1)(%)
Site A
SGD99.8 ± 39.3(100)106.9 ± 65.8 *(100)
RSGD88.1 ± 39.4(88.3)72.7 ± 54.3 **(68.1)
FSGD11.6 ± 2.5(11.7)(31.9)
Site B
SGD4.9 ± 6.5(100)117.8 ± 70.8 *(100)
RSGD4.2 ± 6.4(85.6)12.0 ± 8.3 **(10.2)
FSGD0.7 ± 0.2(14.4)(89.8)
* Water flux estimated from the 222Rn mass balance model. ** Water flux estimated from the 224Ra mass balance model.

