Article

Assessment of Impacts of Climate Change on Tile Discharge and Nitrogen Yield Using the DRAINMOD Model

1
School of Engineering, University of Guelph, Guelph, ON N1G 2W1, Canada
2
School of Environmental Sciences, University of Guelph, Guelph, ON N1G2W1, Canada
3
Department of Geography and Environmental Management, University of Waterloo, Waterloo, ON N2L 3G1, Canada
4
Ontario Ministry of the Environment, Conservation and Parks, Etobicoke, ON M9P 3V6, Canada
*
Author to whom correspondence should be addressed.
Hydrology 2021, 8(1), 1; https://doi.org/10.3390/hydrology8010001
Submission received: 26 November 2020 / Revised: 18 December 2020 / Accepted: 21 December 2020 / Published: 26 December 2020

Abstract

:
The detrimental impacts of agricultural subsurface tile flows and their associated pollutants on water quality is a major environmental issue in the Great Lakes region and many other places globally. A strong understanding of water quality indicators along with the contribution of tile-drained agriculture to water contamination is necessary to assess and reduce a significant source of non-point source pollution. In this study, DRAINMOD, a field-scale hydrology and water quality model, was applied to assess the impact of future climatic change on depth to water table, tile flow and associated nitrate loss from an 8.66 ha agricultural field near Londesborough, in Southwestern Ontario, Canada. The closest available climate data from a weather station approximately 10 km from the field site was used by the Ontario Ministry of Natural Resources and Forestry (MNRF) to generate future predictions of daily precipitation and maximum and minimum air temperatures required to create the weather files for DRAINMOD. Of the 28 models applied by MNRF, three models (CGCM3T47-Run5, GFDLCM2.0, and MIROC3.2hires) were selected based on the frequency of the models recommended for use in Ontario with SRA1B emission scenario. Results suggested that simulated tile flows and evapotranspiration (ET) in the 2071–2100 period are expected to increase by 7% and 14% compared to 1960–1990 period. Results also suggest that under future climates, significant increases in nitrate losses (about 50%) will occur along with the elevated tile flows. This work suggests that climate change will have a significant effect on field hydrology and water quality in tile-drained agricultural regions.

1. Introduction

Field agriculture is a significant land use in many areas of the world and has been documented as a contributor of non-point source pollution to surface waters. In a recent study in Uruguay, [1] researchers found a strong correlation between total phosphorus (P) and agriculture land use in a river. In central Asia, remote sensing was used to analyze effects of land use on surface water contamination [2]. Although the relationships were not straightforward, they did find that cropland was a significant contributor to surface water organic pollution. In another study in Europe, [3], analyses of nutrients and other components in river water found that the proportion of arable land in the watershed did affect water pollution levels. To further investigate agricultural land use as a non-point source of pollution, the hydrologic pathway of a pollutant from field to surface water body must be identified and quantified. This study focusses on quantifying tile flow and accompanying nitrate load to surface waters under future climate conditions of the Great Lakes region of North America.
Subsurface (tile) drainage is considered an effective and important practice in field agricultural water management to facilitate farm operations, especially in cold climatic regions. In Ontario, Canada, more than 50% of its arable land is under artificial drainage systems [4]. Tile drainage increases productivity of land by increasing crop yields, but also impacts the environment by degrading water quality. Indeed, it is widely recognized that nitrogen (N) and P leaching results in elevated nutrient concentrations in surface waters representing both environmental and economic (fertilizer loss) impacts. High levels of nitrate may even remain in tile drainage several years after nitrogen fertilizer reduction ([5,6]). Hence, to reduce contamination of surface waters, the impacts of changing cropping systems that may, for instance, occur under future climate regimes are essential. Although climate change is anticipated to play an important role in subsurface drainage, it is not possible to characterize the potential impacts of climate change on field hydrology and/or water quality in agricultural watersheds using field observations. However, modeling of these potential impacts does have potential to at least give acceptable trends in future tile flow and associated nitrate loss. For instance, [7] used the Root Zone Water Quality Model (RZWQM) to estimate the impact of agricultural management systems adaptations on gaseous and drainage nitrogen (N) losses in Iowa, USA. They found that the optimal N rate to minimize loss and maximize maize production was 120 kg N ha−1. Using DRAINMOD, researchers [8] were able to suggest when to block tile outflow to keep the groundwater table at an acceptable depth in central-western Poland. In Illinois, [9], assessed impacts of changing atmospheric conditions using RZWQM along with Support Decision for Agrotechnology Transfer (DSSAT). They found that increasing rainwater nitrate concentration had a moderate impact on nitrate loss in drainage tiles.
In Canada mainly watershed-scale studies on impacts of climate change on water resources have been completed by [10,11,12,13,14]. In their study on a watershed in Quebec, [10], simulated future streamflows finding a slight decrease in annual runoff. In another study, [11], used a weather generator to recommend local water resource management adaptations for a watershed near the present study’s site in Ontario. Using streamflow data and the LARS-WG weather generator, the Soil and Water Assessment Tool (SWAT) model was used by [12] to show that streamflow in a southern Ontario watershed could increase by 12% compared to base period 1961–1990. Also, in southern Ontario, [13] used model simulations to estimate the increase in winter streamflow in several large watersheds. A future assessment of groundwater nitrate concentrations in a sub-watershed of southern Ontario was conducted by [14]. They found that an agricultural BMP was very effective in reducing nitrate in groundwater under a crop rotation system.
In the Great Lakes region, where this study was conducted, there have been several recent studies on impacts of climate change on tile flow and nutrient losses at the watershed scale. The WEPP-WQ model was used by [15] to estimate future N and P losses in two small watersheds finding increases in losses of both nutrients. In another study [16], used DRAINMOD to simulate future tile flow in western Lake Erie basin. They found an average decrease of about 9% in subsurface drainage and recommended controlled drainage to retain more water in the soil profile as a BMP for crop production. In the same basin [17], using the SWAT model found an increase in subsurface drain flow but a decrease in P load from drains. On the other hand, relatively few field-scale studies, which use field data to first calibrate and then validate a tile-flow model to assess climate change impacts have been attempted in the region. Field-scale studies have the advantage over watershed-scale studies of a better-defined source area with associated soil and cropping properties for assessing impacts of future climate on tile flow and accompanying nutrient losses. Using DRAINMOD [18], examined impacts of different tillage practices on future tile flow and nitrate loss in eastern Ontario. They estimated greater future nitrate loss under no-tillage than conventional tillage. At the same field site as the work presented here, The SWAT model was applied to future climate data similar to the approach used in this study [19]. In addition, their results indicated a shift in seasonal water balance and an associated increase in annual P losses by year 2100. Main differences between this study and [19] are use of a different model and modeling approach and analysis of N loss in this study as opposed to P loss in the [19] study.
The DRAINMOD model was developed by [20] as a process-based distributed field-scale model. Many studies have assessed and applied DRAINMOD including, to name a few [21,22,23,24]. The DRAINMOD model has been extensively revised and updated over the years and is still undergoing improvements [25,26]. The main reasons why it was chosen for this study are three-fold: it includes impacts of winter-season processes on soil hydrology along with soil nitrogen dynamics and it has been previously tested and proven satisfactory in Ontario and other cold regions (e.g., [18,27,28,29,30,31,32,33,34,35,36,37,38]). For information on the structure and details on the applied processes in DRAINMOD see publications by [22,39].
Previous work at the same field site as used in this study includes analyses of P transport by [19,40,41,42,43,44]. As well, [45] examined the contribution of preferential flow to tile drainage.
Based on the preceding literature review, this study was undertaken to address the paucity of field-scale studies of how tile flow and nitrate loss may change under future climate regimes in the Great Lakes region. As climate changes there is the potential for shifts in agricultural practices, which may lead to increased nitrate leaching [46]. Hence more studies such as herein are needed to establish a baseline nitrate loading using current field crop practices. In a recent review by [47], it was noted that it is important to improve field-scale hydrology and water quality models under cold climates found in Canada and elsewhere in high-latitude regions. Studies that apply field data to calibrate and validate models, as done in this study, will lead to improvements in model accuracy in the future.
The objectives of this study were: (1) to calibrate and evaluate the latest version of DRAINMOD 6.1 using data from a field site in southern Ontario; and (2) to assess the impact of climate change on tile discharge and nitrogen yields at the same field site using the calibrated model. Using the CGCM3T47 with SRA1B emission scenario, we estimate the impact of future climate on tile discharge and its accompanying nitrate loading for the next century. This research may assist the farming community in developing adaptation strategies to minimize negative impacts of tile drainage systems on water resources.

2. Materials and Methods

2.1. Description of Study Area

The study site (LON) is in southern Ontario, Canada (UTM 472219 E and 4767583 N) near Londesborough. The study was conducted on an 8.66 ha agricultural field with both overland flow and tile drainage restricted to the study field. The site was under a reduced overland tillage (RT) and data collection spanned a range of years and therefore experienced a range of climatic conditions. Tile drainage systems in the field are systematically drained at 90 cm depth through 10-cm diameter laterals (13.5 m spacing) that connected to a larger main tile (20-cm diameter) that exits at the edge of the field. The contributing area to surface drainage within the field is 7.79 ha.
Long-term average annual precipitation measured at Blyth, Ontario, the closest Environment Canada weather station to LON site, is 1247 mm and long-term mean annual temperatures are 7.2 °C (https://climate.weather.gc.ca/historical_data/search_historic_data_e.html). Monthly temperatures vary seasonally across the year, with warm summers and cold winters. Daily maximum and minimum temperatures are variable throughout the year; however, daily mean air temperatures are generally below freezing between December and March. Due to the climate in Ontario, spring planted crops are seeded in early May, whereas fall seeded crops (winter wheat) are planted in September. Harvests are completed by early August (wheat), mid-September (soy) or November (corn).
The topography of the site is gently undulating with slopes ranging from 0.2 to 3.5% [48]. The field consists of soils from the Perth Clay Loam association [49]. These soils developed on clay loam glacial deposits with imperfect drainage. Soil samples collected at the site suggest that the average texture in the top 15 cm is silt (clay 0.9 ± 1.3%, silt 75.7 ± 2.1%, sand 23.4 ± 3.3%) [48]. Table 1 gives some basic soil properties for the LON site.

2.2. Model Formulation

The DRAINMOD model requires different inputs including air temperature and precipitation data, infiltration parameters, soil properties, crop information, and drainage system parameters. These data were used to calculate the relationships among the drained volume and depth to water table (WTD), and relationships between WTD and maximum steady upward flux. Infiltration was simulated using the Green–Ampt equation. Within the model, a soil moisture retention curve for the soil above the tile was used to calculate infiltration parameters as a function of WTD.
The model provides options to the user to use observed ET data or apply daily maximum and minimum temperatures to calculate ET using the Thornthwaite equation. In this study, Thornthwaite approach has been used. Details related to crop management and timing for the study site are given in Table 2.
Many of the input parameters for DRAINMOD are transferable between sites from nearby cold regions. Hence, parameters related to snow melt, ice content etc. were obtained from the literature, such as [29,30] and [18]. Crop-related constants including nitrogen uptake and transformation factors and organic matter dynamics were taken from [5,31,33,34,50,51].
The lower boundary at 1.2 m was assumed to be impermeable and at a constant soil temperature of 7 °C, which is approximately the long-term average air temperature [52].
The model requires initial conditions such as concentrations of NO3-N and   NH 4 + N , given in Table 3.

2.3. Model Calibration

To calibrate and assess the DRAINMOD model, measurements of tile discharge collected in the field from 2011–2016 were divided into two parts: data from the first two years (fall of 2011–summer of 2013), were used to calibrate DRAINMOD, and the remaining two years of the data (fall of 2013–early winter of 2016), were used to validate the model. The chosen calibration parameters were manually adjusted by minimizing differences between observed and simulated tile flow at first visually and then statistically. The most sensitive parameters were selected for calibration based on previous work using DRAINMOD [18,27,28,32,34,35,36,50]. As in other studies, hydrology was first used to calibrate DRAINMOD using Ksat of soil profile and restrictive bottom layer and maximum surface storage which controls water runoff (Table 4).
Simulations were initially evaluated using visual comparisons between the observed and predicted values. These were subsequently assessed using various statistical parameters. The statistical parameters used were the coefficient of determination (R2), the percent bias (PBIAS) [53] and the Nash-Sutcliffe efficiency (NSE; [54]). These parameters were calculated according to:
R 2 = [ i = 1 i = n ( O i O ¯ ) ( P i P ¯ ) i = 1 i = n ( O i O ¯ ) 2 i = 1 i = n ( P i P ¯ ) 2 ] 2   ( 0     R 2     1 )
P B I A S = 100 i = 1 i = n O i P i i = 1 i = n O i
N S E = 1 [ i = 1 i = n ( O i P i ) 2 i = 1 i = n ( O i O ¯ ) 2 ]
where , n is the total number of compared values, O i   is the ith observed value, O ¯ is the mean of observed values, P i is the ith predicted value, P ¯ is the mean of predicted values.

2.4. Climate Change Simulations

Global Climate Models (GCM’s) or Regional Climate Models (RCM’s) are used to generate future climate data needed to assess the possible impacts of future climate changes on drainage and runoff in a watershed. These circulation models are based on physics and provide accurate predictions under different greenhouse gas emission criteria groups, defined by Intergovernmental Panel on Climate Change (IPCC) in their Special Report on Emission Scenarios (SRES) [55] The Ontario Ministry of Natural Resources and Forestry, Canada provided a facility through its web portal Aquamapper (http://climate/aquamapper.com/) to generate future climate data using up to 28 GCMs and RCMs under three gas emission scenarios of SRB1, SRA1B, and SRA2, and SRA2, used in future climate impact studies [56]. Emission scenario SRB1 describes a converging future world with constant population experiencing rapid structural changes towards an economy of service and information by introducing clean and resource-efficient technologies; whereas SRA1B describes a future scenario with rapid economic growth where population peaks at the middle of the century, and rapid introduction of new energy efficient technologies while development is being balanced across energy sources. A highly heterogeneous world with continuously increasing population with a fragmented and slower processing regional economic growth is described by emission scenario SRA2 [57,58].
For this study, we selected the emission scenario presented by SRA1B, which has been recommended for most of the 12 regions of Ontario considered in [23]. SRA1B is also considered to be one of the scenarios across Ontario by Ontario Climate Change Data Portal [59]. This emission scenario assumes the same level of socio-economic–technological growth throughout the region with a rapid economic growth, introduction of efficient new technologies, and has a balance among all energy sources. However, with variable grid sizes of hundreds of kilometers from model to model [60,61], the model predictions may lack the precision needed for smaller sites [62,63,64].
Since the high coarseness of the spatial (45 km) and temporal (daily) resolution of the GCMs to represent the physical processes of convection, land atmospheric interactions, and especially in predicting future rainfall intensity-duration-frequency characteristics, downscaling may be needed for obtaining a more accurate picture of the future climate scenario [61,64,65,66], which we have not attempted in this study.
For this study site near Londesborough, we selected Blyth (43°43′, 81°23′, Elevation = 350.5 m), the closest weather station presented in Aquamapper, to generate future predictions of daily precipitation, maximum and minimum air temperatures required to create the weather files for DRAINMOD. Out of the 28 models in Aquamapper, three models (CGCM3T47-Run5, GFDLCM2.0, and MIROC3.2 MedRes) were selected based on the frequency of the models recommended for use in Ontario with SRA1B emission scenario. The base data from 1971 to 2000 was used to generate the climate data for 2011–2040, 2041–2070, and 2071–2100.
DRAINMOD was run using the future climate data described above and weather data from 1960–1990 as a comparison. The DRAINMOD input parameters from the calibration exercise, also described above, were used in all simulations. By using the pre-existing soil properties and agricultural management system, the future simulations should yield differences between past and future tile flow and nitrate loading only due to climate change.

3. Results and Discussion

3.1. Model Calibration

Several trial-and-error runs were performed by adjusting Ksat of soil profile and restrictive bottom layer and maximum surface storage. The model results were the most sensitive, in order, as given in Table 4. Crop rooting depth was also varied to calibrate DRAINMOD (Table 4). Following the soil hydrology calibration, various nitrogen factors were determined using the same approach. Calibrated values are listed in Table 4, which are similar to those given in previous work (e.g., [21,33,35,51]).

3.2. Model Evaluation

3.2.1. Field-Scale Tile Discharge

Figure 1 and Figure 2 show time series graphs of observed and simulated daily tile discharge and precipitation during the calibration and validation periods. Figure 1, showing the calibration period, indicates that measured tile-flow events correspond well with precipitation. DRAINMOD tile-flow peaks almost consistently match the timing of major precipitation events; however, it appears to underestimate more often than overestimate some peak flow values. Please note that DRAINMOD correctly shows no tile flow when precipitation occurs during dry soil conditions in the summer season. A similar pattern is shown in Figure 2 during the validation period. DRAINMOD does a very good job of when tile flow occurs.
The model performance during the calibration and validation stages at daily and monthly time steps are shown in Table 5.
Observed and simulated drain discharge were in close agreement at both daily and monthly time scales during the calibration period. The statistical values given in Table 5 for the monthly time interval are within the acceptable ranges for both NSE (≥0.65) and PBIAS (≤ ±15%), as suggested by [67]. The PBIAS values are very similar for monthly and daily time intervals.

3.2.2. Field-Scale Nitrogen Yields

After DRAINMOD was calibrated and validated to successfully simulate tile discharge, a series of nitrogen simulations were done to calibrate the nitrogen component of the model. Ammonium yields were excluded from the model evaluation because both field measurements and model simulations exhibited very small N H 4 + -N yields in tile drain effluent.
The calibration and validation results for daily and cumulative NO3-N yields are shown in Figure 3. In general, observed and predicted NO3-N yields were in reasonable agreement. During the calibration period, there were two major nitrate-loss events corresponding to significant tile-flow events. The June 2012 nitrate loss occurred during the first major precipitation event following fertilizer application in the spring. However, the major loss of nitrate in April 2013 was not associated with a particular fertilizer application but followed a winter season after corn was grown (Table 2). Figure 3 shows that there is a strong linear relationship between simulated and observed with the coefficient of determination only slightly lower during the validation period than calibration.

3.3. Climate Change Analysis

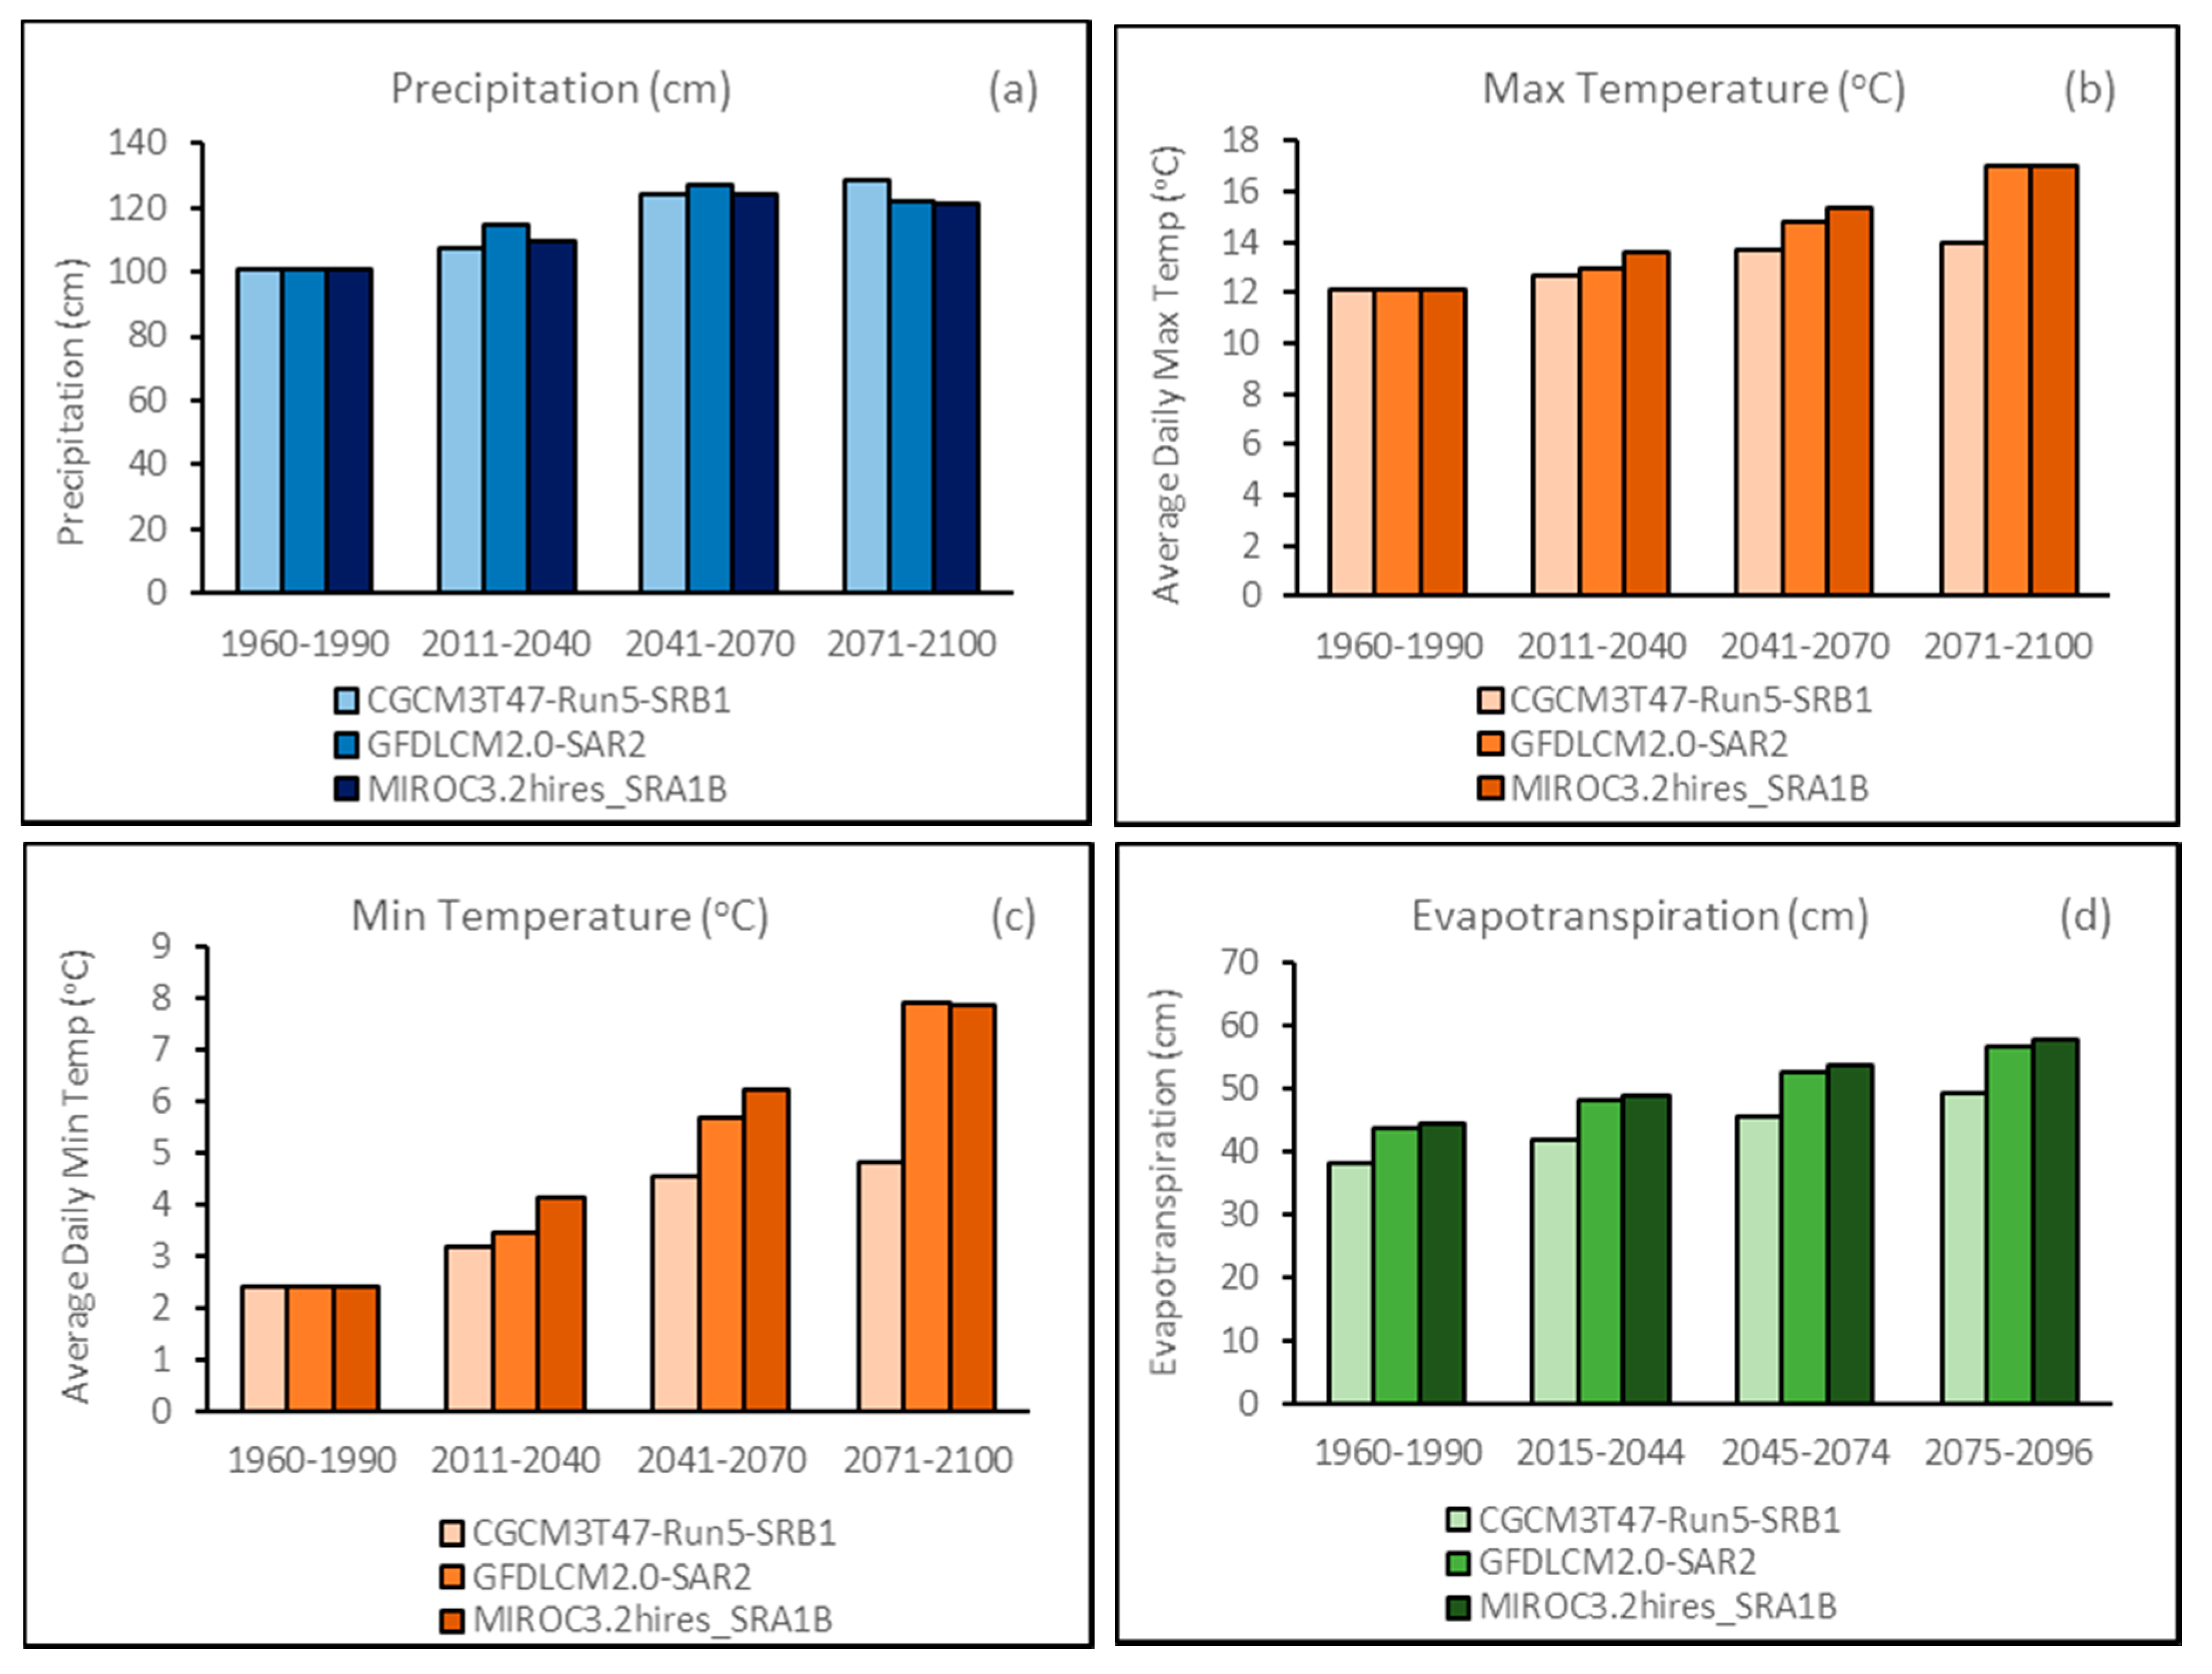
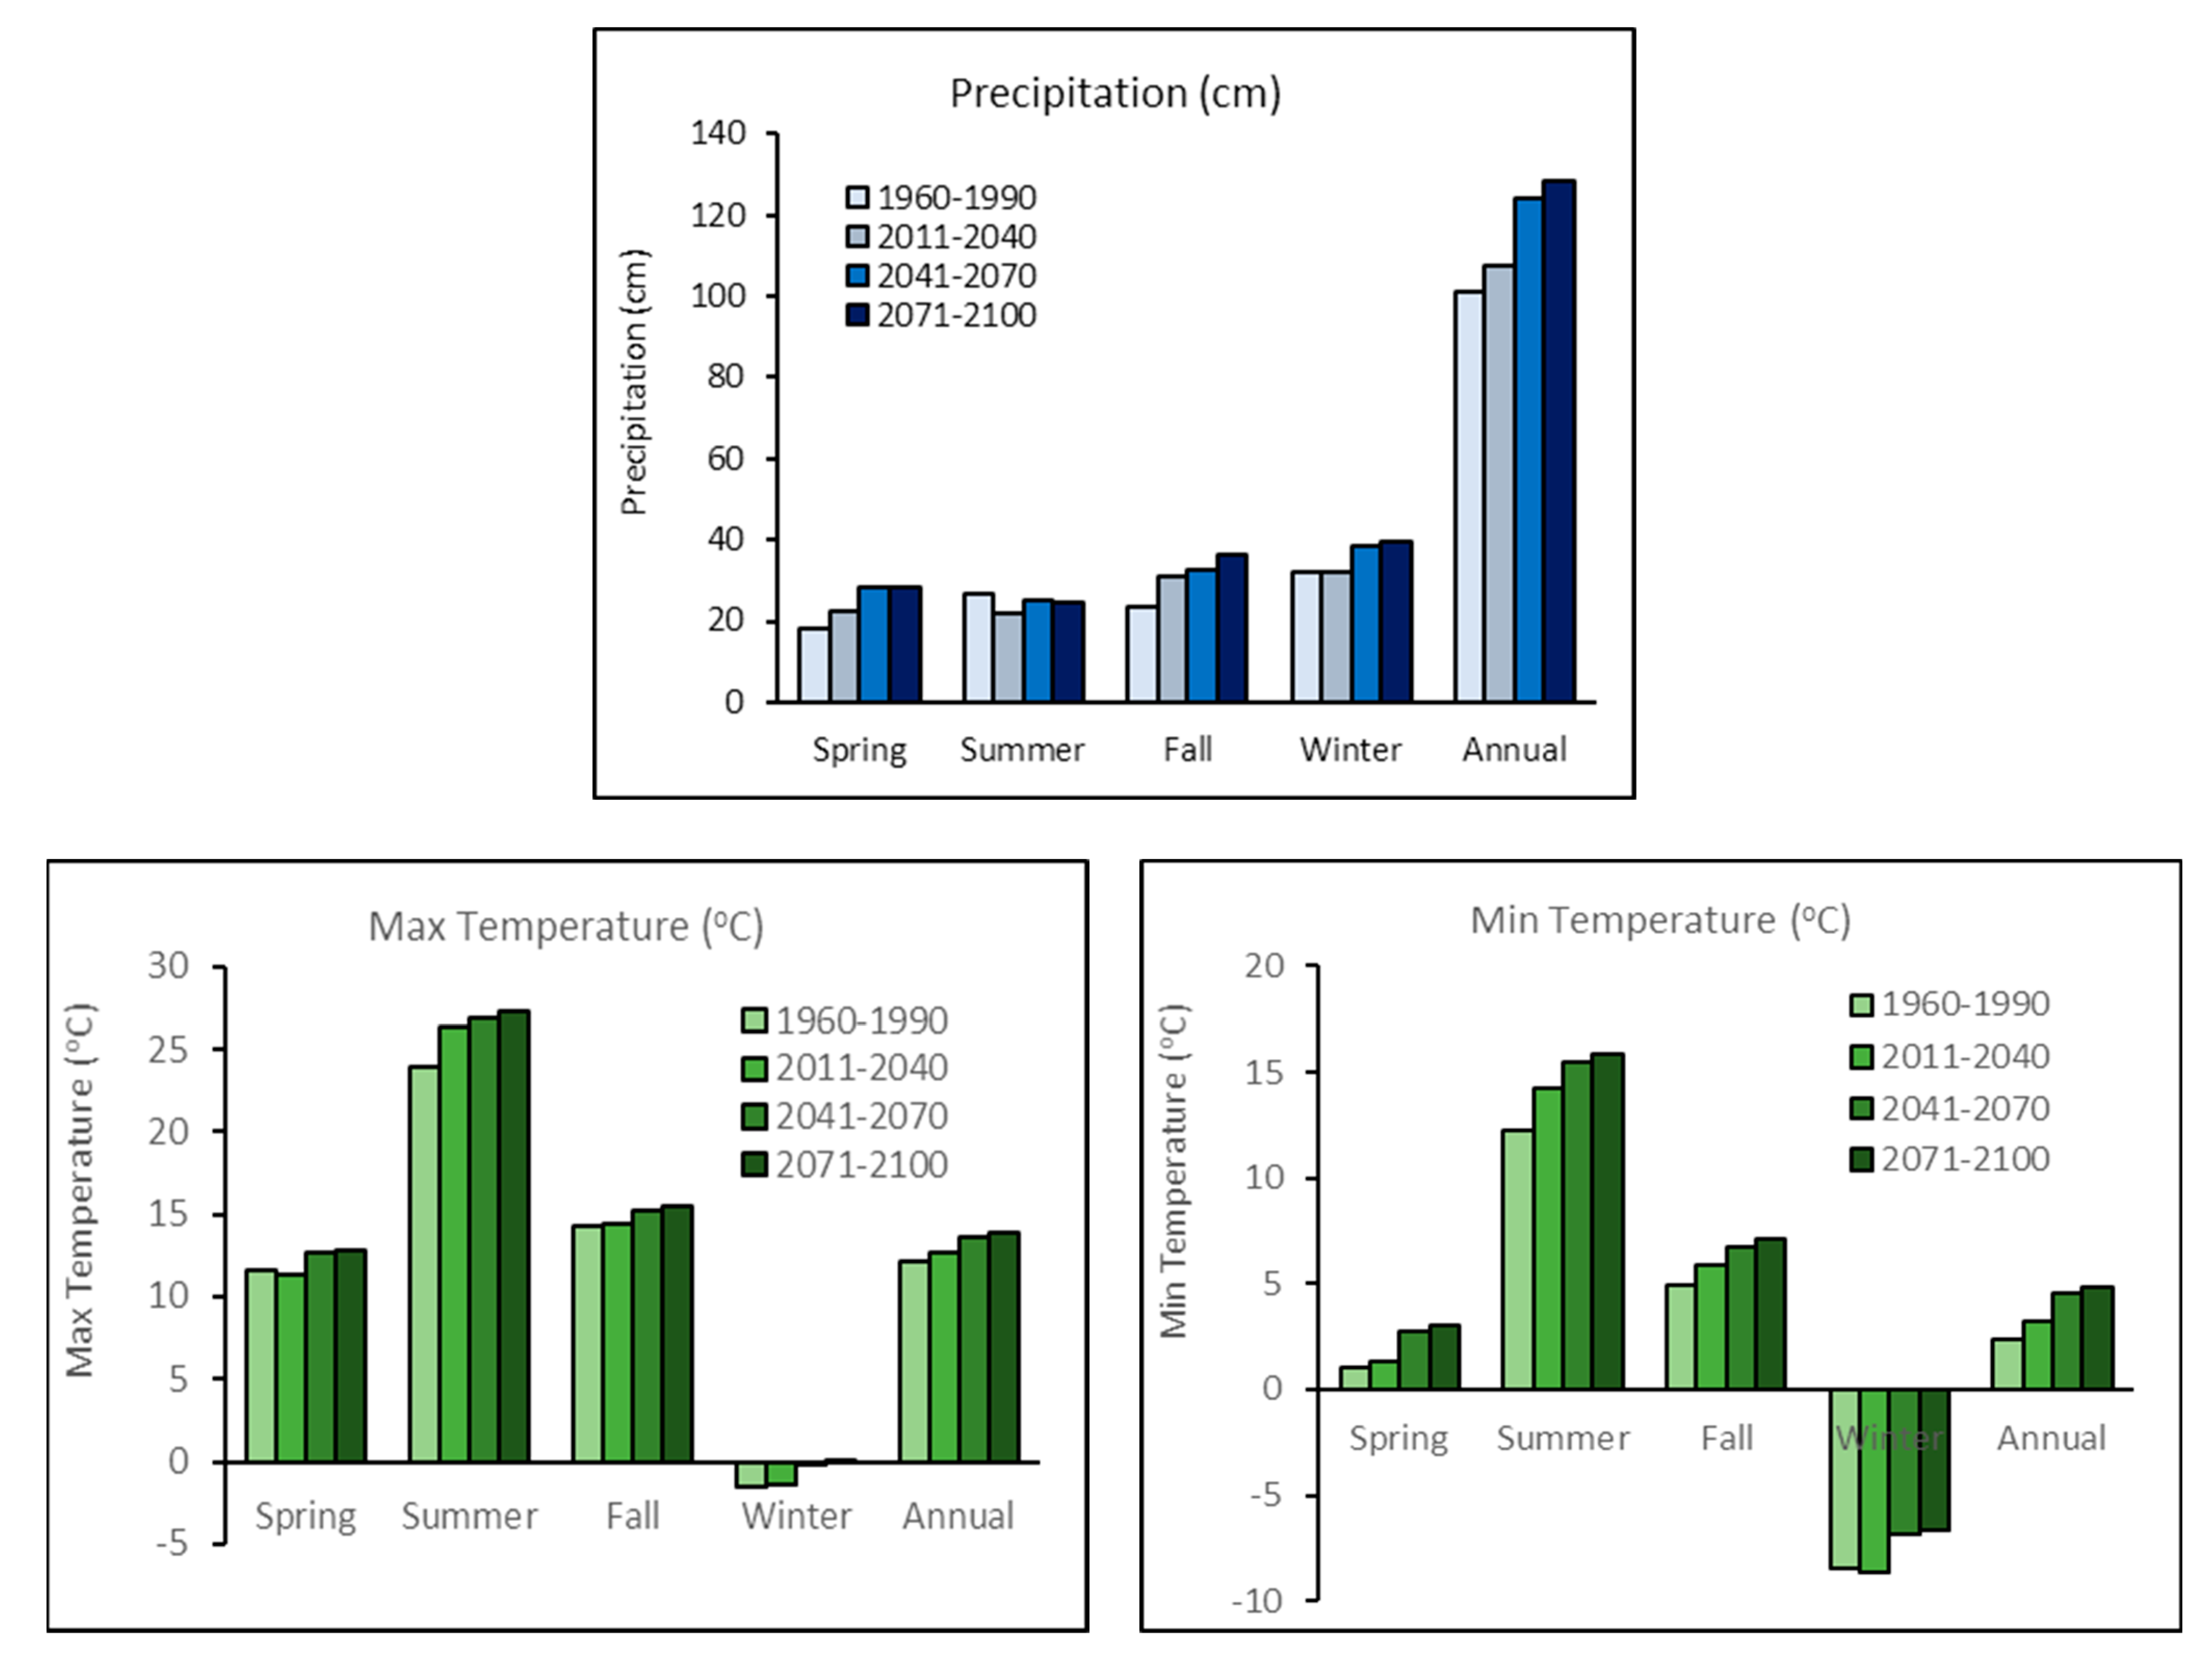
3.3.1. Comparing Past and Future Climates

Figure 4a,d compares annual measured precipitation and DRAINMOD-estimated evapotranspiration for 1960–1990 to three different climate-model estimates of precipitation and DRAINMOD-estimated evapotranspiration for three future time periods. As well, Figure 4b,c compare past-measured and future-estimated daily average maximum and minimum air temperatures using the three different climate models. Please note that both precipitation and evapotranspiration increase in the future as determined in other studies. There are small differences between the three climate-model estimates of precipitation, but model CGCM3T47 does predict somewhat lower future temperature and corresponding evapotranspiration. Therefore, it has been selected as the scenario of future climate change assessment of tile flow and nitrate loss at the site. It represents the least temperature and evapotranspiration increase giving the most predicted future surplus water and, hence, presumably the worst-case scenario for increases in tile flow and corresponding nitrate loss.
Figure 5 shows past and future precipitation and temperature estimates from CGCM3T47 on annual and seasonal bases. Annual precipitation estimates increase with time with a difference of over 20% from the near- to far-future time periods. Precipitation is divided roughly evenly between seasons; however, summers become slightly drier and other seasons slightly wetter with time. These changes could have significant impacts on reducing crop production in summer and a greater potential for nitrogen loss through denitrification in non-cropping seasons. In terms of average daily temperatures, both minimum and maximum increase in every season almost without exception as time progresses. The summer season appears to show the greatest increase in temperatures from beginning to end of the modeled time period.

3.3.2. Effects of Climate Change on Water Balances

The DRAINMOD model was used to predict the impact of future climates on field-scale water balance (Figure 6) and the associated nitrate yields from the LON field site in Ontario.
Evapotranspiration and tile flow first decreased and subsequently increased due to increased precipitation and temperatures under future climate conditions. The comparison of simulated results for the 2071–2100 period (late century) with 1960–1990 period (historical) show that tile flow and ET were found to increase by 7% and 14%.

3.3.3. Effects of Climate Change on Tile Discharge and Nitrogen Yields

Mean seasonal and annual tile discharge for the historical and future time periods is shown in Figure 7. As noted above, the DRAINMOD-estimated annual tile discharge increased slightly during the future period (vs. historical). The winter season appears to dominate this annual increase. The increase in tile flow during winter likely occurs because the estimated maximum daily temperature rises above 0 °C in the future (Figure 5). This would result in more snow melt and more precipitation occurring as rain. In support of this postulation, [13] predicted that streamflow will increase during winter season in the future in several southern Ontario watersheds. As well, [68] found that tile flow is expected to increase based on their study of four Lake Erie watersheds.
Figure 7 also shows past and future nitrate loss as estimated by DRAINMOD. Increasing loss in winter season as time progresses matches well with tile-flow estimates. However, the steady increase in nitrate loss in spring does not correspond exactly with tile flow. Average annual estimated tile flow during spring season is variable with time. Hence, the concentration of nitrate must increase in tile water during spring to account for this steady increase in load. Other studies have revealed a range of results. For instance, [69] found very little change in future annual nitrogen loss from watersheds of various sizes in northeastern Indiana. In a study using SWAT model, [70], found that annual P loading would decrease in the future from a watershed in Lake Erie basin due to increased evapotranspiration and decreased snowfall. On the other hand, [14,18,19,68,71,72] all found that nutrient losses may increase in future in Ontario and Quebec watersheds.

4. Conclusions

This study has once again shown that DRAINMOD is an effective field-scale model for simulating tile flow in Ontario, Canada. The model calibrated and validated well in comparison to tile-flow measurements collected from a single field site. The calibrated model was used to predict future tile flow and nitrogen loss from the same study site. Tile flow is estimated to increase especially in winter in the future. This result is not uncommon when compared to other studies. However, nitrogen loss appears to be more complicated than tile flow. Although nitrate loss appears to increase consistently with increasing tile flow in the future, increases in nitrate loss through tiles does not correlate well with tile flow. Perhaps an increase in winter and spring season temperatures, especially minimum temperature in spring, is leading to enhanced nitrification and hence excessive nitrate loss during spring.

Author Contributions

Conceptualization, G.G., M.M., R.P.R., G.W.P., P.B.K., P.K.G.; Methodology, G.G., M.M., G.W.P., R.P.R., P.B.K., P.K.G.; Software, G.G., R.P.R., G.W.P., P.K.G.; Formal Analysis, G.G., M.M., G.W.P., R.P.R., P.B.K., P.K.G.; Data Curation, M.M.; Writing—Original Draft Preparation, G.G.; Writing—Review & Editing, P.K.G., G.W.P., P.B.K., M.M., G.G., R.P.R. Supervision, R.P.R., G.W.P.; Project Administration, G.W.P., M.M.; Funding Acquisition, G.W.P., M.M., R.P.R. All authors have read and agreed to the published version of the manuscript.

Funding

This research received no external funding.

Data Availability Statement

Not Applicable.

Acknowledgments

The funding received for this project from Ontario Ministry of Agriculture, Food and Rural Affairs (OMAFRA) is gratefully acknowledged.

Conflicts of Interest

The authors declare no conflict of interest.

References

  1. Gorgoglione, A.; Gregorio, J.; Ríos, A.; Alonso, J.; Chreties, C.; Fossati, M. Influence of Land Use/Land Cover on Surface-Water Quality of Santa Lucía River, Uruguay. Sustainability 2020, 12, 4692. [Google Scholar] [CrossRef]
  2. Wang, X.; Zhang, F. Effects of land use/cover on surface water pollution based on remote sensing and 3D-EEM fluorescence data in the Jinghe Oasis. Sci. Rep. 2018, 8, 1–13. [Google Scholar] [CrossRef]
  3. Kändler, M.; Blechinger, K.; Seidler, C.; Pavlů, V.; Šanda, M.; Dostál, T.; Krása, J.; Vitvar, T.; Štich, M. Impact of land use on water quality in the upper Nisa catchment in the Czech Republic and in Germany. Sci. Total Environ. 2017, 586, 1316–1325. [Google Scholar] [CrossRef]
  4. O’Neill, P. Modelling Tile Drains under Present and Future Climate Conditions. Master’s Thesis, University of Waterloo, Waterloo, ON, Canada, 2008. [Google Scholar]
  5. Patni, N.K.; Masse, L.; Jui, P.Y. Tile effluent quality and chemical losses under conventional and no tillage. Part1. Flow and Nitrate. Trans. ASAE 1996, 39, 1673–1679. [Google Scholar] [CrossRef]
  6. Sharma, V.; Negi, S.C.; Rudra, R.P.; Yamg, S. Neural networks for predicting nitrate-nitrogen in drainage water. J. Agric. Water Manag. 2003, 63, 169–183. [Google Scholar] [CrossRef]
  7. Wang, Z.; Qi, Z.; Xue, L.; Bukovsky, M. RZWQM2 simulated management practices to mitigate climate change impacts on nitrogen losses and corn production. Environ. Model. Softw. 2016, 84, 99–111. [Google Scholar] [CrossRef]
  8. Sojka, M.; Kozłowski, M.; Kęsicka, B.; Wróżyński, R.; Stasik, R.; Napierała, M.; Jaskuła, J.; Liberacki, D. The Effect of Climate Change on Controlled Drainage Effectiveness in the Context of Groundwater Dynamics, Surface, and Drainage Outflows. Central-Western Poland Case Study. Agronomy 2020, 10, 625. [Google Scholar] [CrossRef]
  9. Jeong, H.; Pittelkow, C.M.; Bhattarai, R. Simulated responses of tile-drained agricultural systems to recent changes in ambient atmospheric gradients. Agric. Syst. 2019, 168, 48–55. [Google Scholar] [CrossRef]
  10. Quilbé, R.; Rousseau, A.; Moquet, J.; Trinh, N.; Dibike, Y.; Gachon, P.; Chaumont, D. Assessing the effect of climate change on river flow using general circulation models and hydrological modelling. Application to the Chaudiere River (Quebec, Canada). J. Can. Water Resour. 2008, 33, 73–93. [Google Scholar]
  11. Prodanovic, P.; Simonovic, S.P. Impacts of changing climatic conditions in the Upper Thames River Basin. Can. Water Resour. J. 2007, 32, 265–284. [Google Scholar] [CrossRef] [Green Version]
  12. Rahman, M.; Bolisetti, T.; Balachandar, R. Hydrologic modelling to assess the climate change impacts in a southern Ontario watershed. Can. J. Civ. Eng. 2012, 39, 91–103. [Google Scholar] [CrossRef]
  13. Champagne, O.; Arain, M.A.; Leduc, M.; Coulibaly, P.; McKenzie, S. Future shift in winter streamflow modulated by the internal variability of climate in southern Ontario. Hydrol. Earth Syst. Sci. 2020, 24, 3077–3096. [Google Scholar] [CrossRef]
  14. Saleem, S.; Levison, J.; Parker, B.; Martin, R.; Persaud, E. Impacts of climate change and different crop rotation scenarios on groundwater nitrate concentrations in a sandy aquifer. Sustainability 2020, 12, 1153. [Google Scholar] [CrossRef] [Green Version]
  15. Wang, L.; Flanagan, D.C.; Wang, Z.; Cherkauer, K.A. Climate change impacts on nutrient losses of two watersheds in the Great Lakes region. Water 2018, 10, 442. [Google Scholar] [CrossRef] [Green Version]
  16. Pease, L.A.; Fausey, N.R.; Martin, J.F.; Brown, L.C. Projected climate change effects on subsurface drainage and the performance of controlled drainage in the Western Lake Erie Basin. J. Soil Water Conserv. 2017, 72, 240–250. [Google Scholar] [CrossRef] [Green Version]
  17. Mehan, S.; Aggarwal, R.; Gitau, M.W.; Flanagan, D.C.; Wallace, C.W.; Frankenberger, J.R. Assessment of hydrology and nutrient losses in a changing climate in a subsurface-drained watershed. Sci. Total Environ. 2019, 688, 1236–1251. [Google Scholar] [CrossRef]
  18. Golmohammadi, G.; Rudra, R.P.; Madani, A.; Goel, P.K.; Mohammadi, K. Modeling the impacts of tillage practices on water table depth, drain outflow and nitrogen losses using DRAINMOD. J. Comput. Electron. Agric. 2016, 124, 73–83. [Google Scholar] [CrossRef]
  19. Hanke, K. Impacts of Climate Change and Controlled Tile Drainage on Water Quality and Quantity in Southern Ontario, Canada. Master’s Thesis, University of Waterloo, Waterloo, ON, Canada, 2018. [Google Scholar]
  20. Skaggs, R.W. A Water Management Model for Shallow Water Table Soils; Report No. 134.; Water Resources Research Institute of the University of North Carolina: Chapel Hill, NC, USA, 1978. [Google Scholar]
  21. Youssef, M.A.; Skaggs, R.W.; Chescheir, G.M.; Gilliam, J.W. Field evaluation of a model for predicting nitrogen losses from drained lands. J. Environ. Qual. 2006, 35, 2026–2042. [Google Scholar] [CrossRef]
  22. Skaggs, R.W.; Youssef, M.A.; Chescheir, G.M. DRAINMOD: Model use, calibration, and validation. Trans. ASABE 2012, 55, 1509–1522. [Google Scholar] [CrossRef]
  23. Brown, D.M.; Dadfar, H.; Fallow, D.J.; Gordon, R.J.; Lauzon, J.D.; Parkin, G.W. Temporal and Spatial Variability of Water Surplus in Ontario, Canada. Isrn Soil Sci. 2013, 2013, 362895. [Google Scholar] [CrossRef]
  24. Malota, M.; Senzanje, A. Modelling mid-span water table depth and drainage discharge dynamics using DRAINMOD 6.1 in a sugarcane field in Pongola, South Africa. J. Water Sa 2015, 41, 325–334. [Google Scholar] [CrossRef] [Green Version]
  25. Askar, M.H.; Youssef, M.A.; Chescheir, G.M.; Negm, L.M.; King, K.W.; Hesterberg, D.L.; Amoozegar, A.; Skaggs, R.W. DRAINMOD Simulation of macropore flow at subsurface drained agricultural fields: Model modification and field testing. Agric. Water Manag. 2020, 242, 106401. [Google Scholar] [CrossRef]
  26. Adhikari, N.; Davidson, P.C.; Cooke, R.A.; Book, R.S. Drainmod-linked Interface for Evaluating Drainage System Response to Climate Scenarios. Appl. Eng. Agric. 2020, 36, 303–319. [Google Scholar] [CrossRef]
  27. Singh, M.; Prasher, S.O.; Tan, C.; Tejawat, C. Evaluation of DRAINMOD for Southern Ontario conditions. Can. Water Resour. 1994, 19, 313. [Google Scholar] [CrossRef] [Green Version]
  28. Shukla, M.B.; Prasher, S.O.; Madani, A.; Gupta, G.P. Field validation of DRAINMOD in Atlantic Canda. J. Can. Agric. Eng. 1994, 36, 205–213. [Google Scholar]
  29. Luo, W.; Skaggs, R.W.; Chescheir, G.M. DRAINMOD modifications for cold conditions. Trans. ASAE 2000, 43, 1569–1582. [Google Scholar] [CrossRef]
  30. Luo, W.; Skaggs, R.W.; Madani, A.; Cizikci, S.; Mavi, A. Predicting field hydrology in cold conditions with DRAINMOD. Trans. ASAE 2001, 44, 825–834. [Google Scholar]
  31. Youssef, M.A.; Skaggs, R.W.; Reynolds, W.R.; Chescheir, G.M.; Gilliam, J.W. Field evaluation of DRAINMOD5.1 using six years of data from an artificially drained agricultural field in North Carolina. In Proceedings of the ASAE Annual International Meeting, Las Vegas, NV, USA, 27–30 July 2003. [Google Scholar]
  32. Yang, C.; Prasher, S.; Wang, S.; Kim, S.; Tan, C.; Drury, C.; Patel, R. Simulation of nitrate-N movement in Southern Ontario, Canada with DRAINMOD-N. Agric. Water Manag. 2007, 87, 299–306. [Google Scholar] [CrossRef]
  33. Salazar, O.; Wesstrom, I.; Youssef, M.A. Evaluation of DRAINMOD-N II model for predicting nitrogen losses in a loamy sand under cultivation in south-east Sweden. J. Agric. Water Manag. 2009, 96, 267–281. [Google Scholar] [CrossRef]
  34. Dayyani, S.; Madramootoo, C.A.; Enright, P.; Simard, G.; Gullamudi, A.; Prasher, S.O.; Madani, A. Field evaluation of DRAINMOD 5.1 under a cold climate: Simulation of daily midspan water table depths and drain outflows. J. Am. Water Resour. Assoc. 2009, 45, 779–792. [Google Scholar] [CrossRef]
  35. Dayyani, S.; Prasher, S.O.; Madramootoo, C.A.; Madani, A. Modeling water table depths, drain outflow, and nitrogen losses in cold climate using DRAINMOD 5.1. Trans. ASABE 2010, 53, 385–395. [Google Scholar] [CrossRef]
  36. Golmohammadi, G.; Prasher, S.O.; Madani, A.; Rudra, R.P.; Youssef, M.A. SWATDRAIN, a new model to simulate the hydrology of agricultural lands, model development and evaluation. J. Biosyst. Eng. 2016, 141, 31–47. [Google Scholar] [CrossRef]
  37. Golmohammadi, G.; Rudra, R.P.; Madani, A.; Goel, P.K.; Mohammadi, K. Modeling the effects of controlled drainage at a watershed scale using SWATDRAIN. Arab. J. Geosci. 2016, 9, 3–7. [Google Scholar] [CrossRef]
  38. Saadat, S.; Frankenberger, J.; Bowling, L.; Ale, S. Evaluation of Surface Ponding and Runoff Generation in a Seasonally Frozen Drained Agricultural Field. J. Hydrol. 2020, 588, 124985. [Google Scholar] [CrossRef]
  39. Skaggs, R.W. DRAINMOD Reference Report. Methods for Design and Evaluation of Drainage Water Management Systems for Soils with High Water Tables; USDA-SCS, South National Technical Report #329 Center; United States Department of Agriculture Soil Conservation Service: Washington, DC, USA, 1980.
  40. Plach, J.M.; Macrae, M.L.; Ali, G.A.; Brunke, R.R.; English, M.C.; Ferguson, G.; Opolko, G. Supply and transport limitations on phosphorus losses from agricultural fields in the lower Great Lakes region, Canada. J. Environ. Qual. 2018, 47, 96–105. [Google Scholar] [CrossRef] [Green Version]
  41. Plach, J.; Pluer, W.; Macrae, M.; Kompanizare, M.; McKague, K.; Carlow, R.; Brunke, R. Agricultural edge-of-field phosphorus losses in Ontario, Canada: Importance of the nongrowing season in cold regions. J. Environ. Qual. 2019, 48, 813–821. [Google Scholar] [CrossRef]
  42. Lozier, T.M.; Macrae, M.L.; Brunke, R.; Van Eerd, L.L. Release of phosphorus from crop residue and cover crops over the non-growing season in a cool temperate region. Agric. Water Manag. 2017, 189, 39–51. [Google Scholar] [CrossRef]
  43. Van Esbroeck, C.J.; Macrae, M.L.; Brunke, R.R.; McKague, K. Surface and subsurface phosphorus export from agricultural fields during peak flow events over the nongrowing season in regions with cool, temperate climates. J. Soil Water Conserv. 2017, 72, 65–76. [Google Scholar] [CrossRef]
  44. Lozier, T. Potential and Observed Release of Phosphorus from Crop Residue and Cover Crops over the Non-growing Season in a Cool Temperate Region. Master’s Thesis, University of Waterloo, Waterloo, ON, Canada, 2016. [Google Scholar]
  45. Pluer, W.T.; Macrae, M.; Buckley, A.; Reid, K. Contribution of preferential flow to tile drainage varies spatially and temporally. Vadose Zone J. 2020, 19, e20043. [Google Scholar] [CrossRef]
  46. Eimers, M.C.; Liu, F.; Bontje, J. Land Use, Land Cover, and Climate Change in Southern Ontario: Implications for Nutrient Delivery to the Lower Great Lakes; Springer: Cham, Switzerland, 2020. [Google Scholar]
  47. Rudra, R.P.; Mekonnen, B.A.; Shukla, R.; Shrestha, N.K.; Goel, P.K.; Daggupati, P.; Biswas, A. Currents Status, Challenges, and Future Directions in Identifying Critical Source Areas for Non-Point Source Pollution in Canadian Conditions. Agriculture 2020, 10, 468. [Google Scholar] [CrossRef]
  48. Van Esbroeck, C.J. Edge of Field Phosphorus Export via Tile Drainage and Overland Flow from Reduced Tillage Systems in Ontario. Master’s Thesis, University of Waterloo, Waterloo, ON, Canada, 2015. [Google Scholar]
  49. Hoffman, D.W.; Richards, N.R. Soil Survey of Perth County; Experimental Farms Service; Canada Department of Agriculture and the Ontario Agricultural College: Guelph, ON, Canada, 1952; Volume 15. [Google Scholar]
  50. Youssef, M.A.; Skaggs, R.W.; Chescheir, G.M.; Gilliam, J.W. The nitrogen simulation model, DRAINMOD-N II. Trans. ASABE 2005, 48, 611–626. [Google Scholar] [CrossRef]
  51. Wang, S.; Prasher, S.O.; Patel, R.M.; Yang, C.C.; Kim, S.H.; Madani, A.; Macdonald, P.M.; Robertson, S.D. Fate and transport of nitrogen compounds in a cold region soil using DRAINMOD. J. Comput. Electron. Agric. 2006, 53, 113–121. [Google Scholar] [CrossRef]
  52. Penrod, E.B.; Walton, W.W.; Terrel, D.V. A method to describe soil temperature variation. J. Soil Mech. ASCE 1958, 1537, 1–21. [Google Scholar]
  53. Gupta, H.V.; Sorooshian, S.; Yapo, P.O. Status of automatic calibration for hydrologic models: Comparison with multilevel expert calibration. J. Hydrol. Eng. 1999, 4, 135–143. [Google Scholar] [CrossRef]
  54. Nash, J.E.; Sutcliffe, J.V. River flow forecasting through conceptual models: Part 1. A discussion of principles. J. Hydrol. 1970, 10, 282–290. [Google Scholar] [CrossRef]
  55. Nakićenović, N.; Swart, R. (Eds.) Special Report on Emissions Scenarios. A Special Report of Working Group III of the Intergovernmental Panel on Climate Change; Cambridge University Press: Cambridge, UK; New York, NY, USA, 2000; p. 599. [Google Scholar]
  56. Das, S.; Millington, N.; Simonovic, S.P. Distribution choice for the assessment of design rainfall for the city of London (ON, Canada) under climate change. Can. J. Civ. Eng. 2013, 40, 121–129. [Google Scholar] [CrossRef]
  57. Chan, A.; Chow, T. Energy and economic performance of green roof system under future climatic conditions in Hong Kong. Energy Build. 2013, 64, 182–198. [Google Scholar] [CrossRef]
  58. Slamova, K.; Koehl, M. Measurement and GIS-based spatial modelling of copper corrosion in different environments in Europe. Mater. Corros. 2017, 68, 20–29. [Google Scholar] [CrossRef]
  59. Wang, X.; Gordon, H. Ontario Climate Change Data Portal. 2013. Available online: http://www.ontarioccdp.ca (accessed on 12 September 2017).
  60. Gebremeskel, S.; Liu, Y.B.; de Smedt, F.; Hoffmann, L.; Pfister, L. Analysing the effect of climate changes on streamflow using statistically downscaled GCM scenarios. Int. J. River Basin Manag. 2005, 2, 271–280. [Google Scholar] [CrossRef]
  61. Coulibaly, P.; Shi, X. Identification of the Effect of Climate Change on Future Design Standards of Drainage Infrastructure in Ontario. Ministry of Transportation of Ontario, Highway Infrastructure Innovation Funding Program. 2005. Available online: http://www.cspi.ca/sites/default/files/download/Final_MTO_Report_June2005rv.pdf (accessed on 12 September 2017).
  62. Chin, P.; Meyer, P. Orangeville, Mono and Amaranth Water Quantity Risk Management and Climate Change Adaptation Assessment Piolet Study. Report Prepared for Toronto and Region Conservation Authority; Matrix Solutions Inc.: Breslau, ON, Canada, 2014; Available online: https://ctcswp.ca/wp-content/uploads/2014/08/RPT_20140829_RMMEP.pdf (accessed on 11 September 2017).
  63. Kassenaar, D.; Wexler, E.J. Tier 3 Water Budget and Local Area Risk Assessment for the Region of York. Municipal Supplies—Risk Assessment Report. Prepared for “The Regional Municipality of York Transportation and Works Department”; Earthfx Inc.: 3363 Young St., Toronto, ON, Canada, 2013; Available online: https://www.ctcswp.ca/wp-content/uploads/2017/05/RPT_201311_Earthfx_York_Tier3WBLocAreaRiskAssFNL.pdf (accessed on 11 September 2017).
  64. Sunyer, M.A.; Madsen, H.; Ang, P.H. A comparison of different regional climate models and statistical downscaling methods for extreme rainfall estimation under climate change. Atmos. Res. 2012, 103, 119–128. [Google Scholar] [CrossRef]
  65. Coulibaly, P.; Burn, D.H.; Switzman, H.; Henderson, J.; Fausto, E. A Comparison of Future IDF Curves for Southern Ontario: A Comparison of Future IDF Curves for Southern Ontario. 2016. Available online: https://climateconnections.ca/wp-content/uploads/2014/01/IDF-Comparison-Report-and-Addendum.pdf (accessed on 12 September 2017).
  66. Chiotti, Q.; Tonto, F.; Perun, M. Ontario Regional Adaptation Collaborative Project- Weather and Water Information Gateway- Gaps Analysis Report. 2012. Available online: http://www.climateontario.ca/doc/ORAC_Products/WaterManagement/Gaps_Analysis_Report-Final_with_TOC.pdf (accessed on 12 September 2017).
  67. Moriasi, D.N.; Arnold, J.G.; Van Liew, M.W.; Bingner, R.L.; Harmel, R.D.; Veith, T.L. Model evaluation guidelines for systematic quantification of accuracy in watershed simulations. Trans. ASABE 2007, 50, 885–900. [Google Scholar] [CrossRef]
  68. Bosch, N.S.; Evans, M.A.; Scavia, D.; Allan, J.D. Interacting effects of climate change and agricultural BMPs on nutrient runoff entering Lake Erie. J. Great Lakes Res. 2014, 40, 581–589. [Google Scholar] [CrossRef]
  69. Wallace, C.W.; Flanagan, D.C.; Engel, B.A. Quantifying the effects of conservation practice implementation on predicted runoff and chemical losses under climate change. Agric. Water Manag. 2017, 186, 51–65. [Google Scholar] [CrossRef]
  70. Kalcic, M.M.; Muenich, R.L.; Basile, S.; Steiner, A.L.; Kirchhoff, C.; Scavia, D. Climate change and nutrient loading in the Western Lake Erie Basin: Warming can counteract a wetter future. Environ. Sci. Technol. 2019, 53, 7543–7550. [Google Scholar] [CrossRef] [PubMed]
  71. Gombault, C.; Madramootoo, C.A.; Michaud, A.R.; Beaudin, I.; Sottile, M.F.; Chikhaoui, M.; Ngwa, F.F. Impacts of climate change on nutrient losses from the Pike River watershed of southern Québec. Can. J. Soil Sci. 2015, 95, 337–358. [Google Scholar] [CrossRef]
  72. Dayyani, S.; Prasher, S.O.; Madani, A.; Madramootoo, C.A. Impact of climate change on the hydrology and nitrogen pollution in a tile-drained agricultural watershed in eastern Canada. Trans. ASABE 2012, 55, 398–401. [Google Scholar] [CrossRef]
Figure 1. Measured tile discharge (blue line) and precipitation (blue bars) and simulated tile discharge (orange lines) during the model calibration.
Hydrology 08 00001 g001
Figure 2. Measured tile discharge (blue line) and precipitation (blue bars) and simulated tile discharge (orange lines) during the model validation.
Hydrology 08 00001 g002
Figure 3. Observed and DRAINMOD-simulated daily NO3-N (kg/ha) from tile outflow at Londesborough field site during calibration (left) and validation (right) periods.
Hydrology 08 00001 g003
Figure 4. Comparing future climate scenarios ((a) precipitation; (b) maximum average daily temperature; (c) minimum average daily temperature; (d) evapotranspiration) of the three different climate models applied in this study. Please note that for comparison, measured average annual precipitation, average daily maximum and minimum temperatures for 1960–1990 were 100 cm, 12 °C and 2.3 °C, respectively.
Hydrology 08 00001 g004
Figure 5. Historical (1960–1990) and future (2011–2100) predicted annual and seasonal mean precipitation (upper figure) and max/min daily average temperatures (lower figures) using CGCM3T47 model.
Hydrology 08 00001 g005
Figure 6. Simulated water balance components for 1960–1990, and 2011–2100 periods.
Hydrology 08 00001 g006
Figure 7. Historical (1960–1990) and future (2011–2100) simulated seasonal and annual average total tile flows (left) and NO3-N loss (right).
Hydrology 08 00001 g007
Table 1. Some soil Properties at Londesborough field site.
Soil Properties
Depth (cm)0–10 10–20 20–35 35–150
Soil hydraulic conductivity (cm/h)0.260.070.20.26
Soil pH7.7 ± 0.3
Organic matter (%)4.1 ± 0.7
Table 2. Management practices considered in the study.
CropDateActivity Code
SoybeansMid-October 2010 (assume 15 October 2010)Harvest
Winter WheatMid-October 2010 (Considered 16 October 2010)Plant
April 11, 2011Red Clover Air Seeded
Late April 2011 (Considered 25 April 2011)Fert App
Late July 2011 (Considered 25 July 2011)Harvest
Grain Corn5 October 2011Fert App
5 October 2011Spray
11 November 2011Tillage
18 April 2012Spray
25 April 2012Tillage
26 April 2012Plant
26 April 2012Fert App
23 May 2012Fert App
9 June 2012Spray
21 October 2012 (estimate as no rain that day)Harvest
Soybeans9 November 2012Tillage
3 May 2013Plant
24 May 2016Spray
25 September 2013Harvest
Winter Wheat27 September 2013Plant
19 April 2014Plant CC
26 April 2014Fert App
1 June 2014Spray
7–10 August 2014Harvest
Grain Corn9 October 2014Fert App
9 October 2014Spray
17 October 2014Tillage
19 April 2015Spray
27 April 2015Tillage
28 April 2015Plant
28 April 2015Fert App
May 15/15 (estimate)—check weather stationSpray
25 May 2015Fert App
15 July 2015Spray
17 October 2015Harvest
Soybeans9 November 2015Tillage
3 May 2016Plant
24/05/2016 (estimate)—check weather stationSpray
Harvest
Table 3. Initial nitrogen concentrations in four soil depth ranges at the study site.
Initial NO3-N concentration in soil (mg L−1)
0–0.15 m5.17
0.15–0.30 m2.05
0.30–0.60 m1.62
0.60–1.20 m1.58
Initial   NH 4 + -N concentration in soil (mgl−1)
0–0.15 m3.22
0.15–0.30 m2.62
0.30–0.60 m1.74
0.60–1.20 m1.41
NH 4 +   sorption distribution coefficient (cm3g−1) K d  
0–0.15 m2.17
0.15–0.30 m2.32
0.30–0.60 m2.85
0.60–1.20 m3.61
Table 4. Parameters Used in Calibration of DRAINMOD model.
ParameterValue
Saturated hydraulic conductivity (4 layers, cm h−1)Varies
Vertical hydraulic conductivity of restrictive layer (cm h−1)0.0025
Maximum surface storage (mm) 1.6
Rooting depth (cm)MonthDay
115.0
555.0
61524.0
71536.0
73045.0
83145.0
10155.0
12315.0
Mineralization rate (d−1)NT:0.00002
CT:0.00003
Maximum Nitrification rate ( μ gNg 1 d 1 ) NT:9.5
CT:7.7
Nitrification optimum temperature (°C)20
Nitrification half saturation constant ( μ gNg 1 d 1 ) 90
Maximum denitrification rate ( μ gNg 1 d 1 ) NT:4.0
CT:3.0
Nitrification empirical shape factor 0.5
Nitrification Optimum temperature (°C)23.0
Nitrification half saturation constant ( μ gNg 1 d 1 ) 30.0
Table 5. Monthly and daily calibration and validation statistics.
Statistical IndexMonthlyDaily
CalibrationValidationCalibrationValidation
R20.780.740.650.54
NSE0.760.700.620.62
PBIAS (%)1.21.41.11.4
Publisher’s Note: MDPI stays neutral with regard to jurisdictional claims in published maps and institutional affiliations.

