1. Introduction
The compact disk (CD) method for radon measurements was proposed in 2001 [
1], initially as a method for retrospective measurements. It is based on radon absorption in the polycarbonate material of which CDs and digital versatile disks (DVDs) are made and analysis of alpha tracks at a certain depth beneath the disk surface (higher than 76 µm, usually about 80 µm) as described elsewhere [
1,
2]. Since 2001 the method has been thoroughly studied in the laboratory and in indoor radon surveys [
2]. The temperature is the only identified environmental factor to have an effect on the results, and it can be corrected for a posteriori [
2]. Past comparisons made indoors showed good correspondence between the CD method and conventional measurements [
2]. However, new applications of this method (e.g., for measurements in mines [
3] or caves) require tests of the method under more extreme conditions than those typically found indoors. The comparison of results obtained by CDs under extremely high variations in the radon activity concentration and variable temperature with parallel measurements by reference radon monitors can test the potential of the method for applications at peculiar working places or environmental conditions. Here we describe the results of a blind comparison of radon measurements by CDs and continuous radon monitors, which was carried out in the Laboratory of Natural Radiation (LNR) located in Saelices el Chico (Salamanca, Spain). This is a unique laboratory facility where radon activity concentration can vary by orders of magnitude and in which continuous follow-up of radon activity concentrations and environmental parameters (temperature, humidity, pressure) is made by reference instruments [
4].
2. Materials and Methods
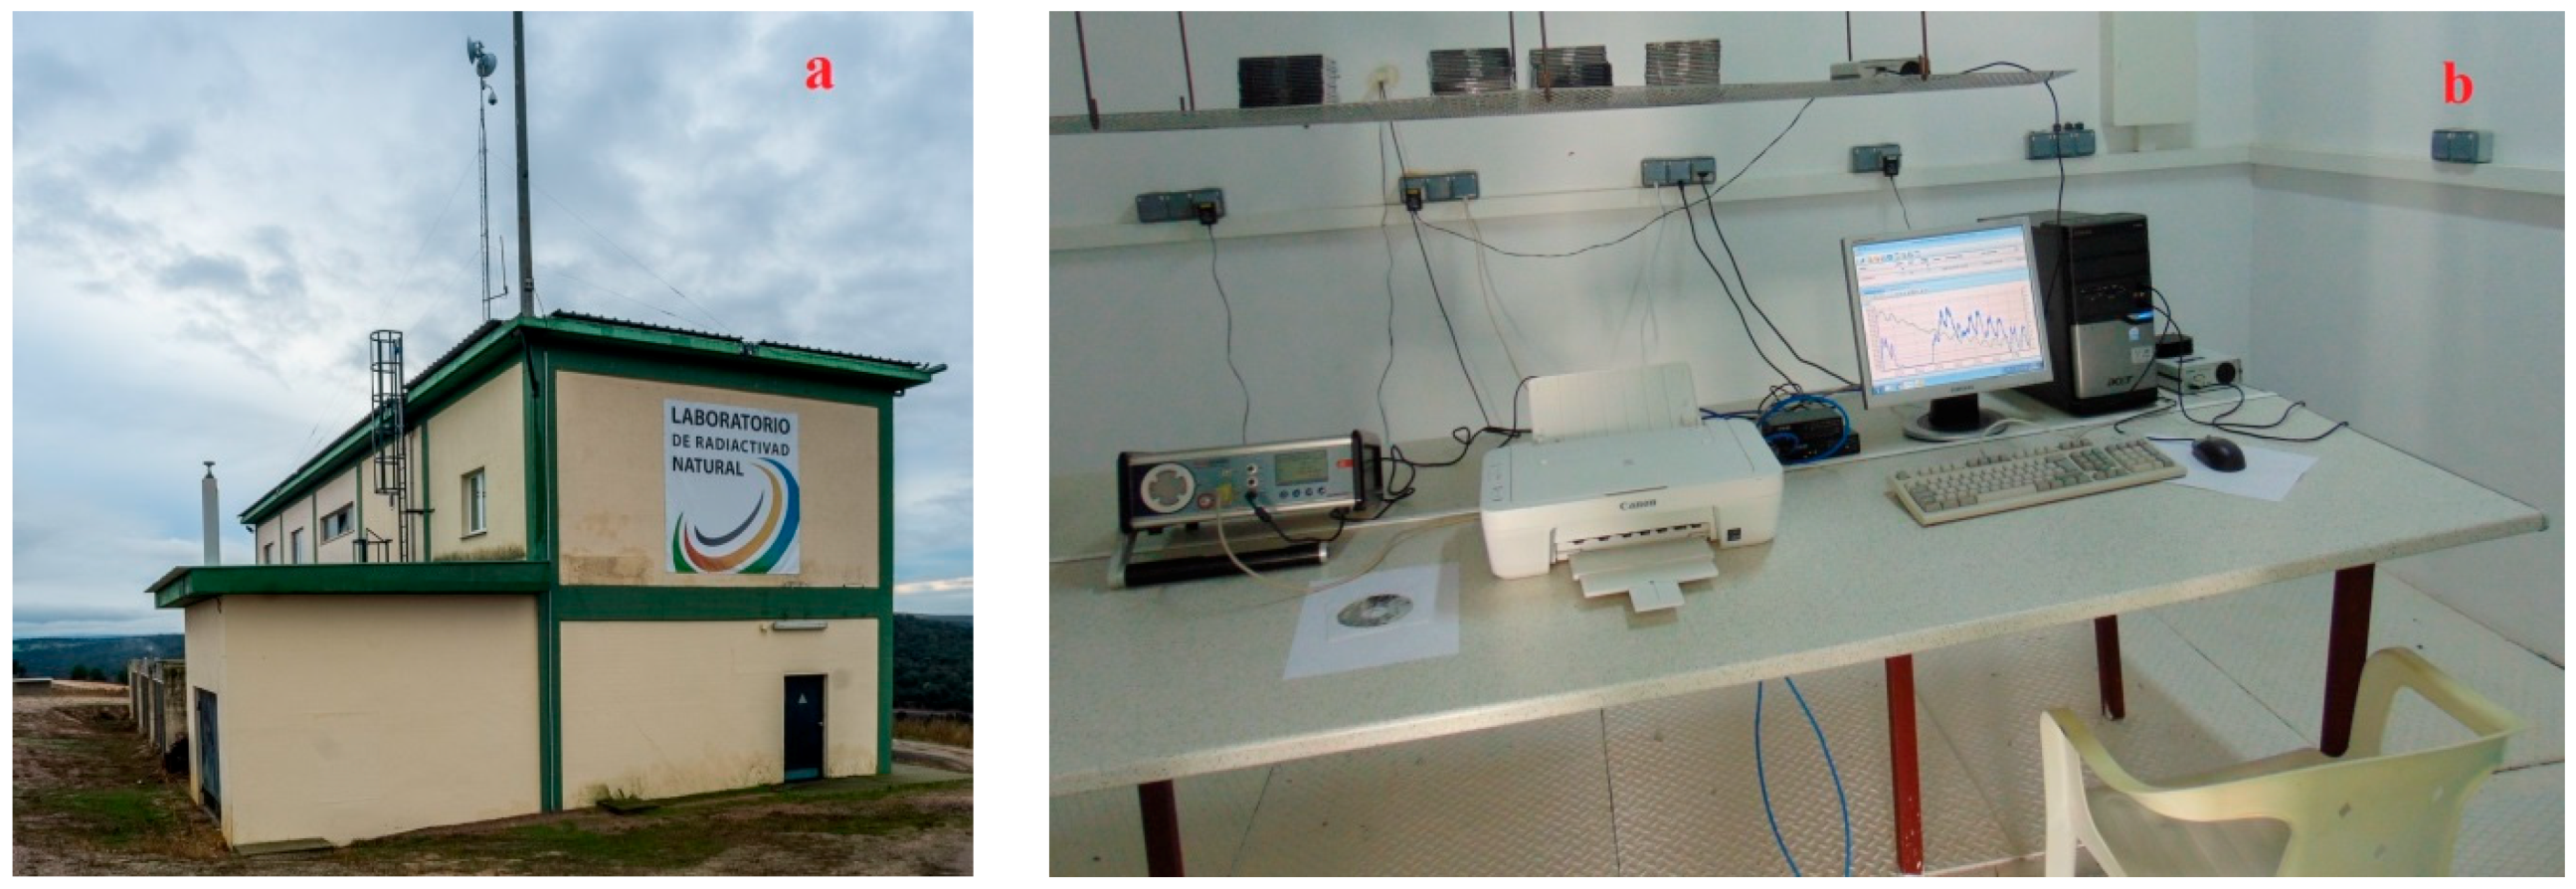
The LNR was set up and handled by the University of Cantabria (
Figure 1a). It is located inside the former uranium mine of Saelices el Chico (Salamanca, Spain) managed by the Spanish National Uranium Company ENUSA, currently under reclamation process. It has been used for calibration and testing of instruments and detectors for the measurement of natural radiation under environmental conditions. The ground floor has two spaces designed as radon chambers (Room 1 and Room 2) with approximately 45 m
3 volume each. Room 1 has no direct connection to the exterior while Room 2 has an artificial ventilation system installed but switched off during the experiment. The radon source is the uranium mine underground soil which has a high radium content.
During the blind test a set of 10 CDs (verbatim, recordable) were exposed in Room 1 (
Figure 1b) for 171 days from 29 September 2017 to 19 March 2018. The disks were exposed in their “jewel cases” (the protective boxes in which CDs or DVDs are usually stored). The jewel cases are not hermetic, and radon penetrates freely inside them. It has been experimentally proved that CDs exposed to
222Rn bare and in their jewel cases give statistically identical results [
1,
5]. The radon activity concentration and some major environmental parameters were followed continuously (every 10 min) by a reference instrument AlphaGUARD PQ2000 PRO (Saphymo/Bertin Instruments, Frankfurt am Main, Gernany) traceable to another AphaGUARD unit calibrated in the Physikalisch-Technische Bundesanstalt (PTB). The reference instrument was verified at the LaRUC’s radon chamber (Laboratory of Environmental Radioactivity, University of Cantabria) [
6].
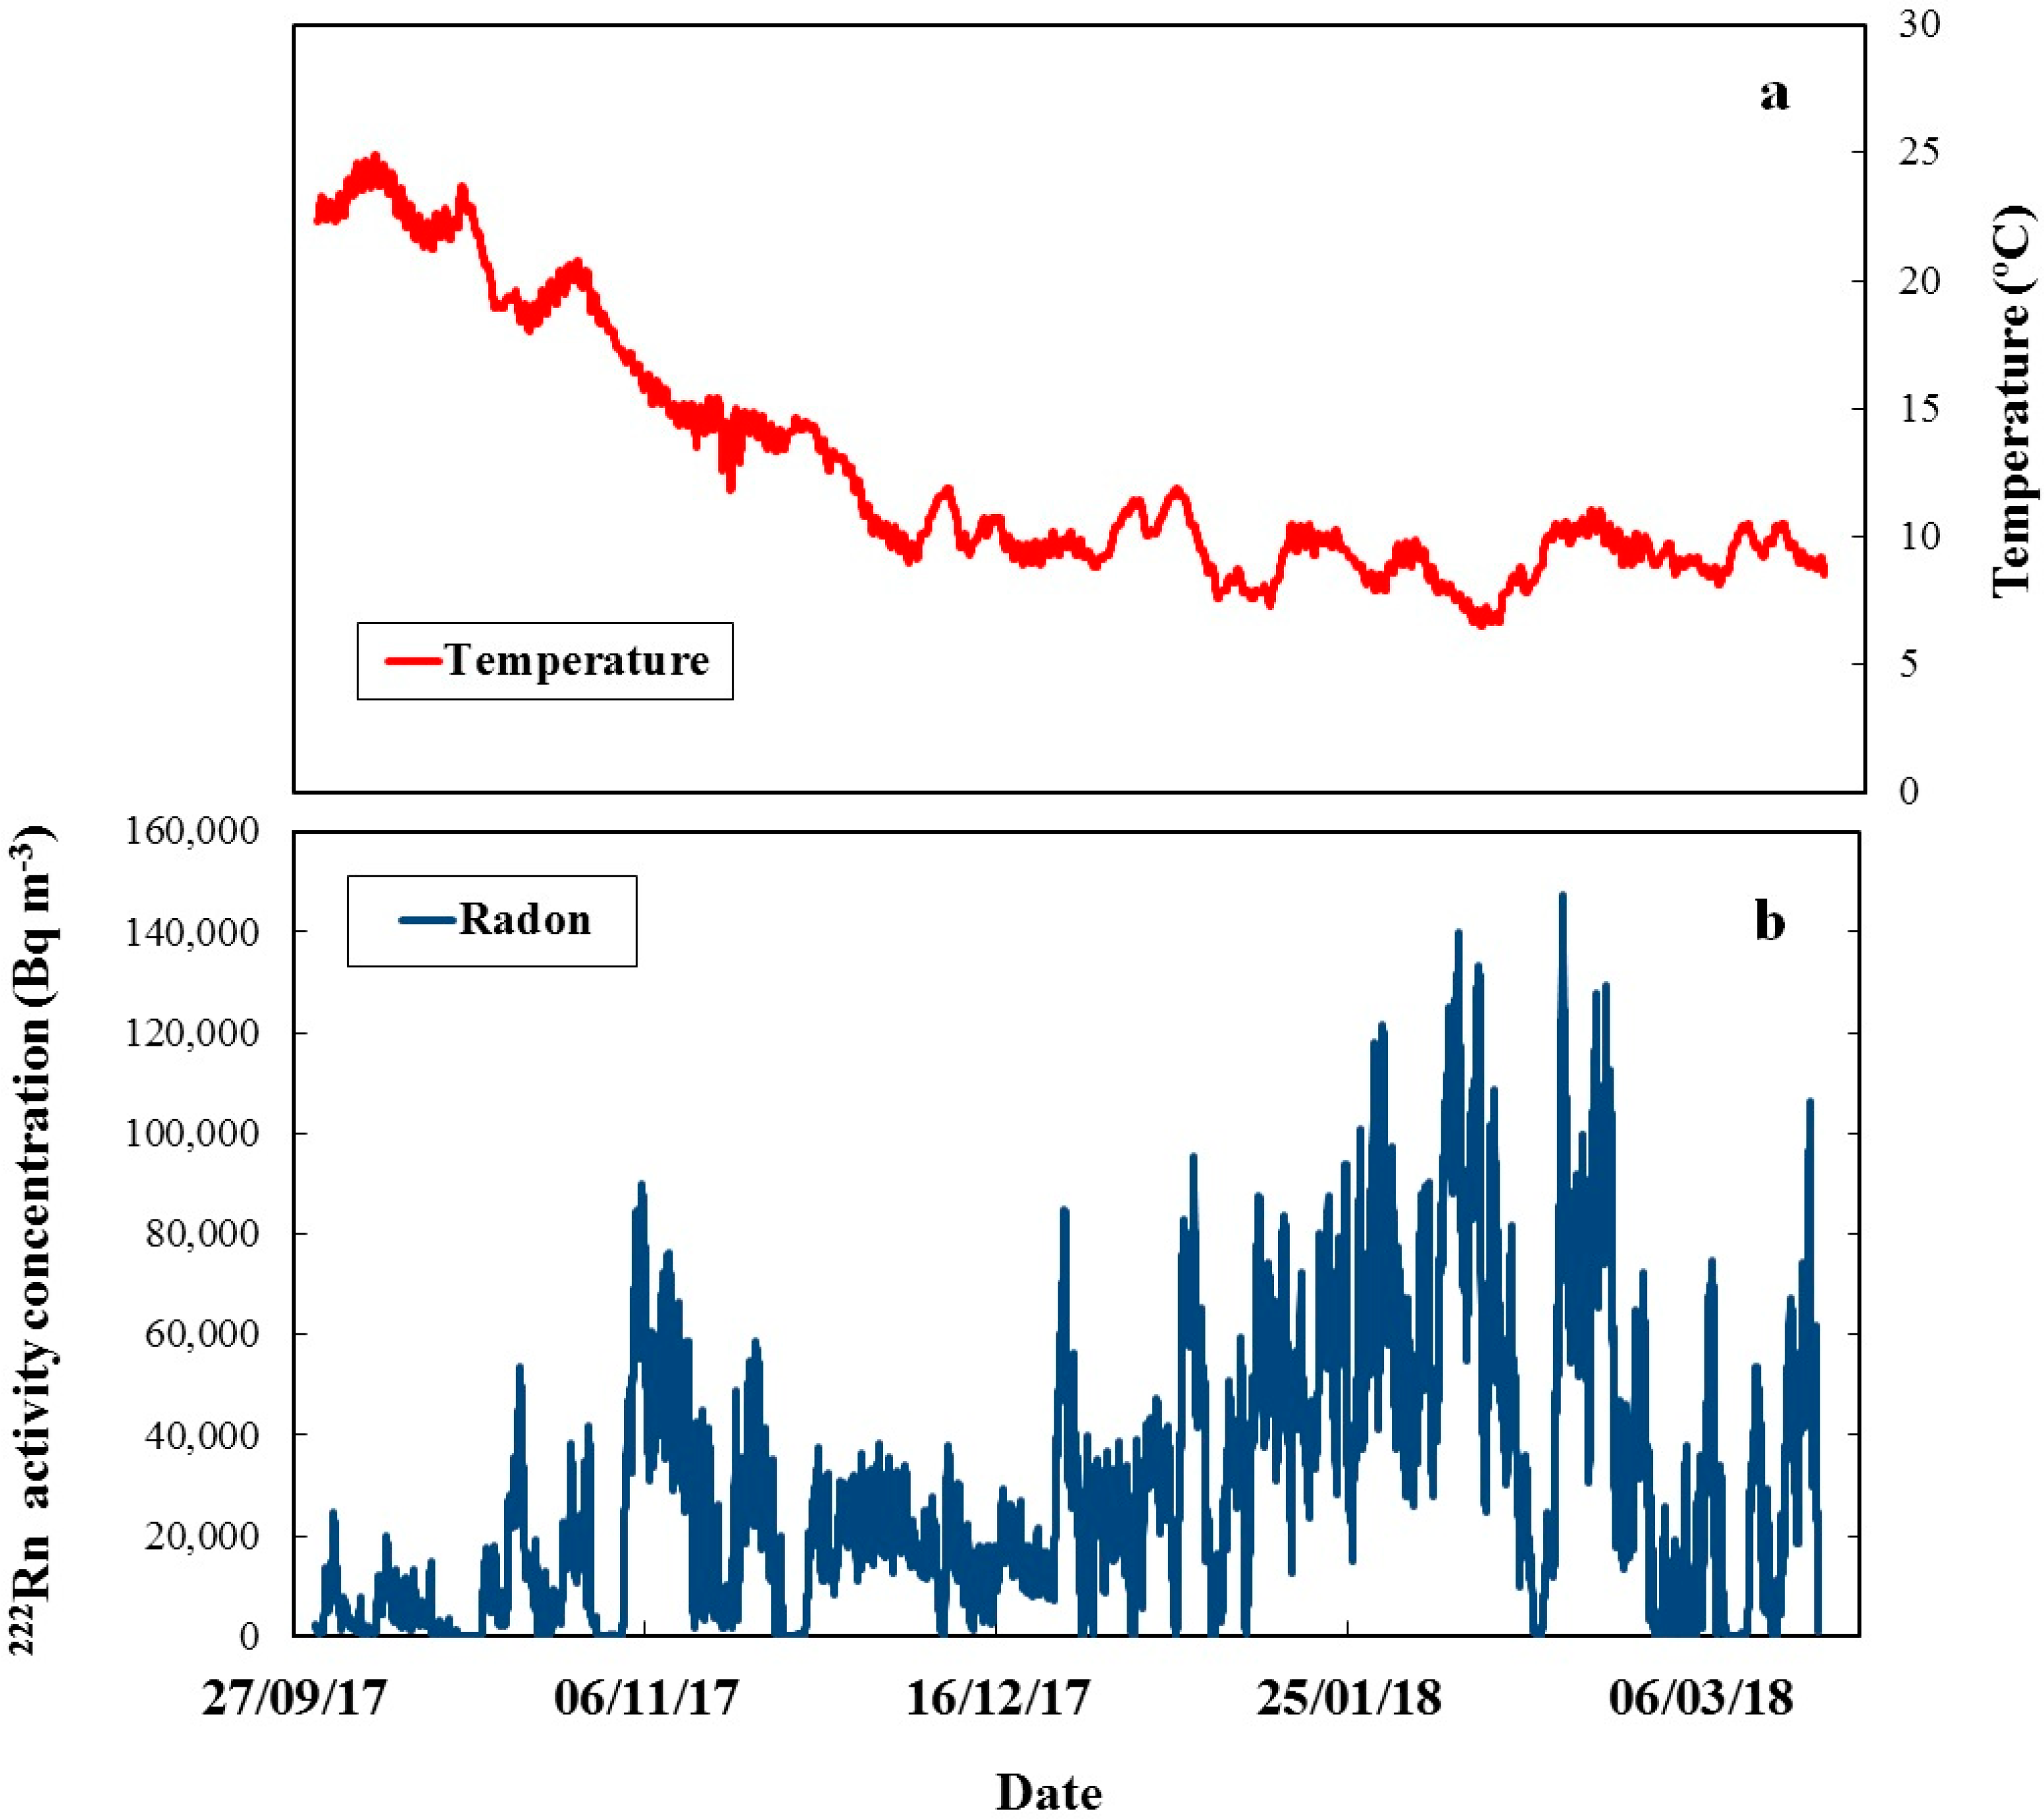
The average temperature during the exposure was 12.6 °C (range 6.5–24.9 °C,
Figure 2a), the average pressure was 944 hPa (903.6–960.2 hPa) and the average relative humidity as 64.4% (27.5%–97.4%). The radon activity concentration varied by orders of magnitude: from <10 to 147,000 Bq m
−3 (
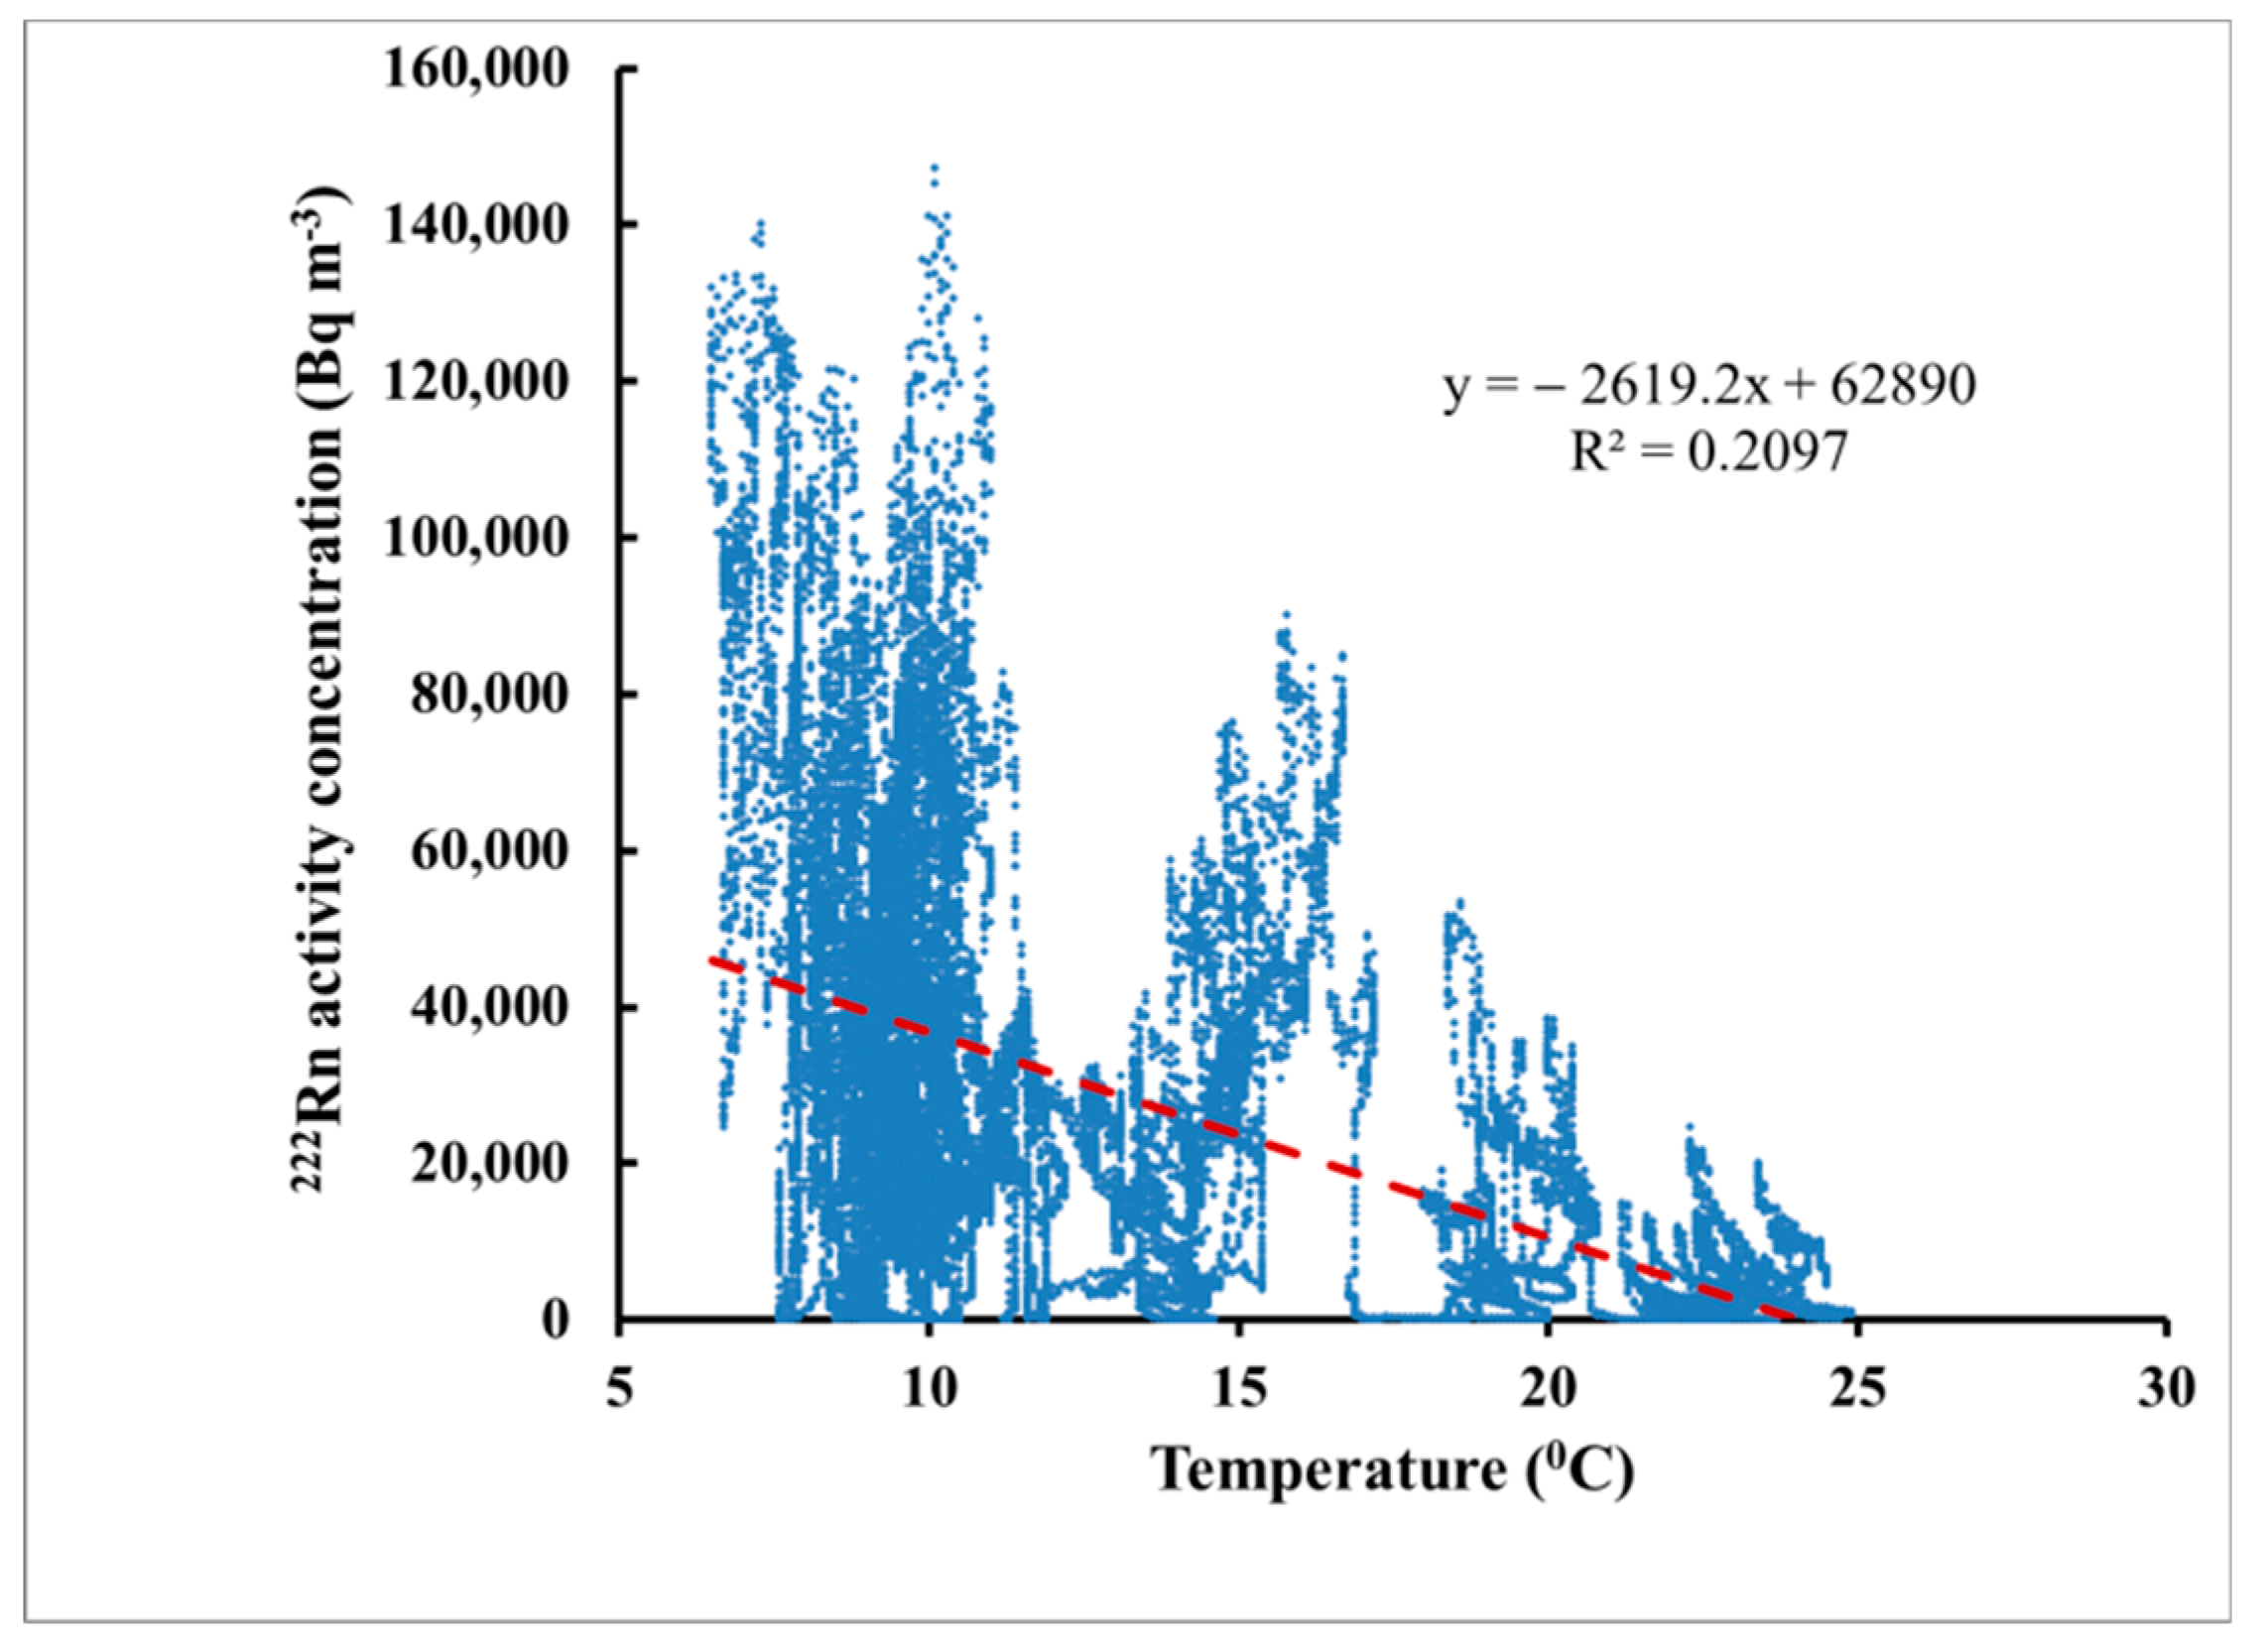
Figure 2b). The variations in radon concentration levels were irregular, while those in the temperature showed a systematic pattern modified by irregular fluctuations. There was a weak negative correlation between the temperature and
222Rn activity concentration (
Figure 3). However, at any temperature
222Rn levels can vary in a wide range, therefore the temperature variations are not considered as the primary cause for
222Rn variations. The
222Rn activity concentrations measured by the reference monitor in the LNR were exchanged with the Sofia University team once the final results were obtained (after the CDs calibration, etching and analysis). The temperature variations were shared previously as they were needed to calibrate the CDs at the mean temperature.
After exposure the disks were processed at Sofia University, Bulgaria. The processing starts with chemical pre-etching, in order to reach the desired depths (in this case 80 µm and 120 µm) by chemical removal of the surface layer. After that, electrochemical etching is applied and the tracks are counted automatically. The etching procedure is described in detail in [
2] and the automatic track counting by a computer scanner in [
8]. The analyzed signal is the net track density (the track density after the background is subtracted). The background of unexposed CDs of the kind used in the experiments was 3.8 ± 1.3 cm
−2.
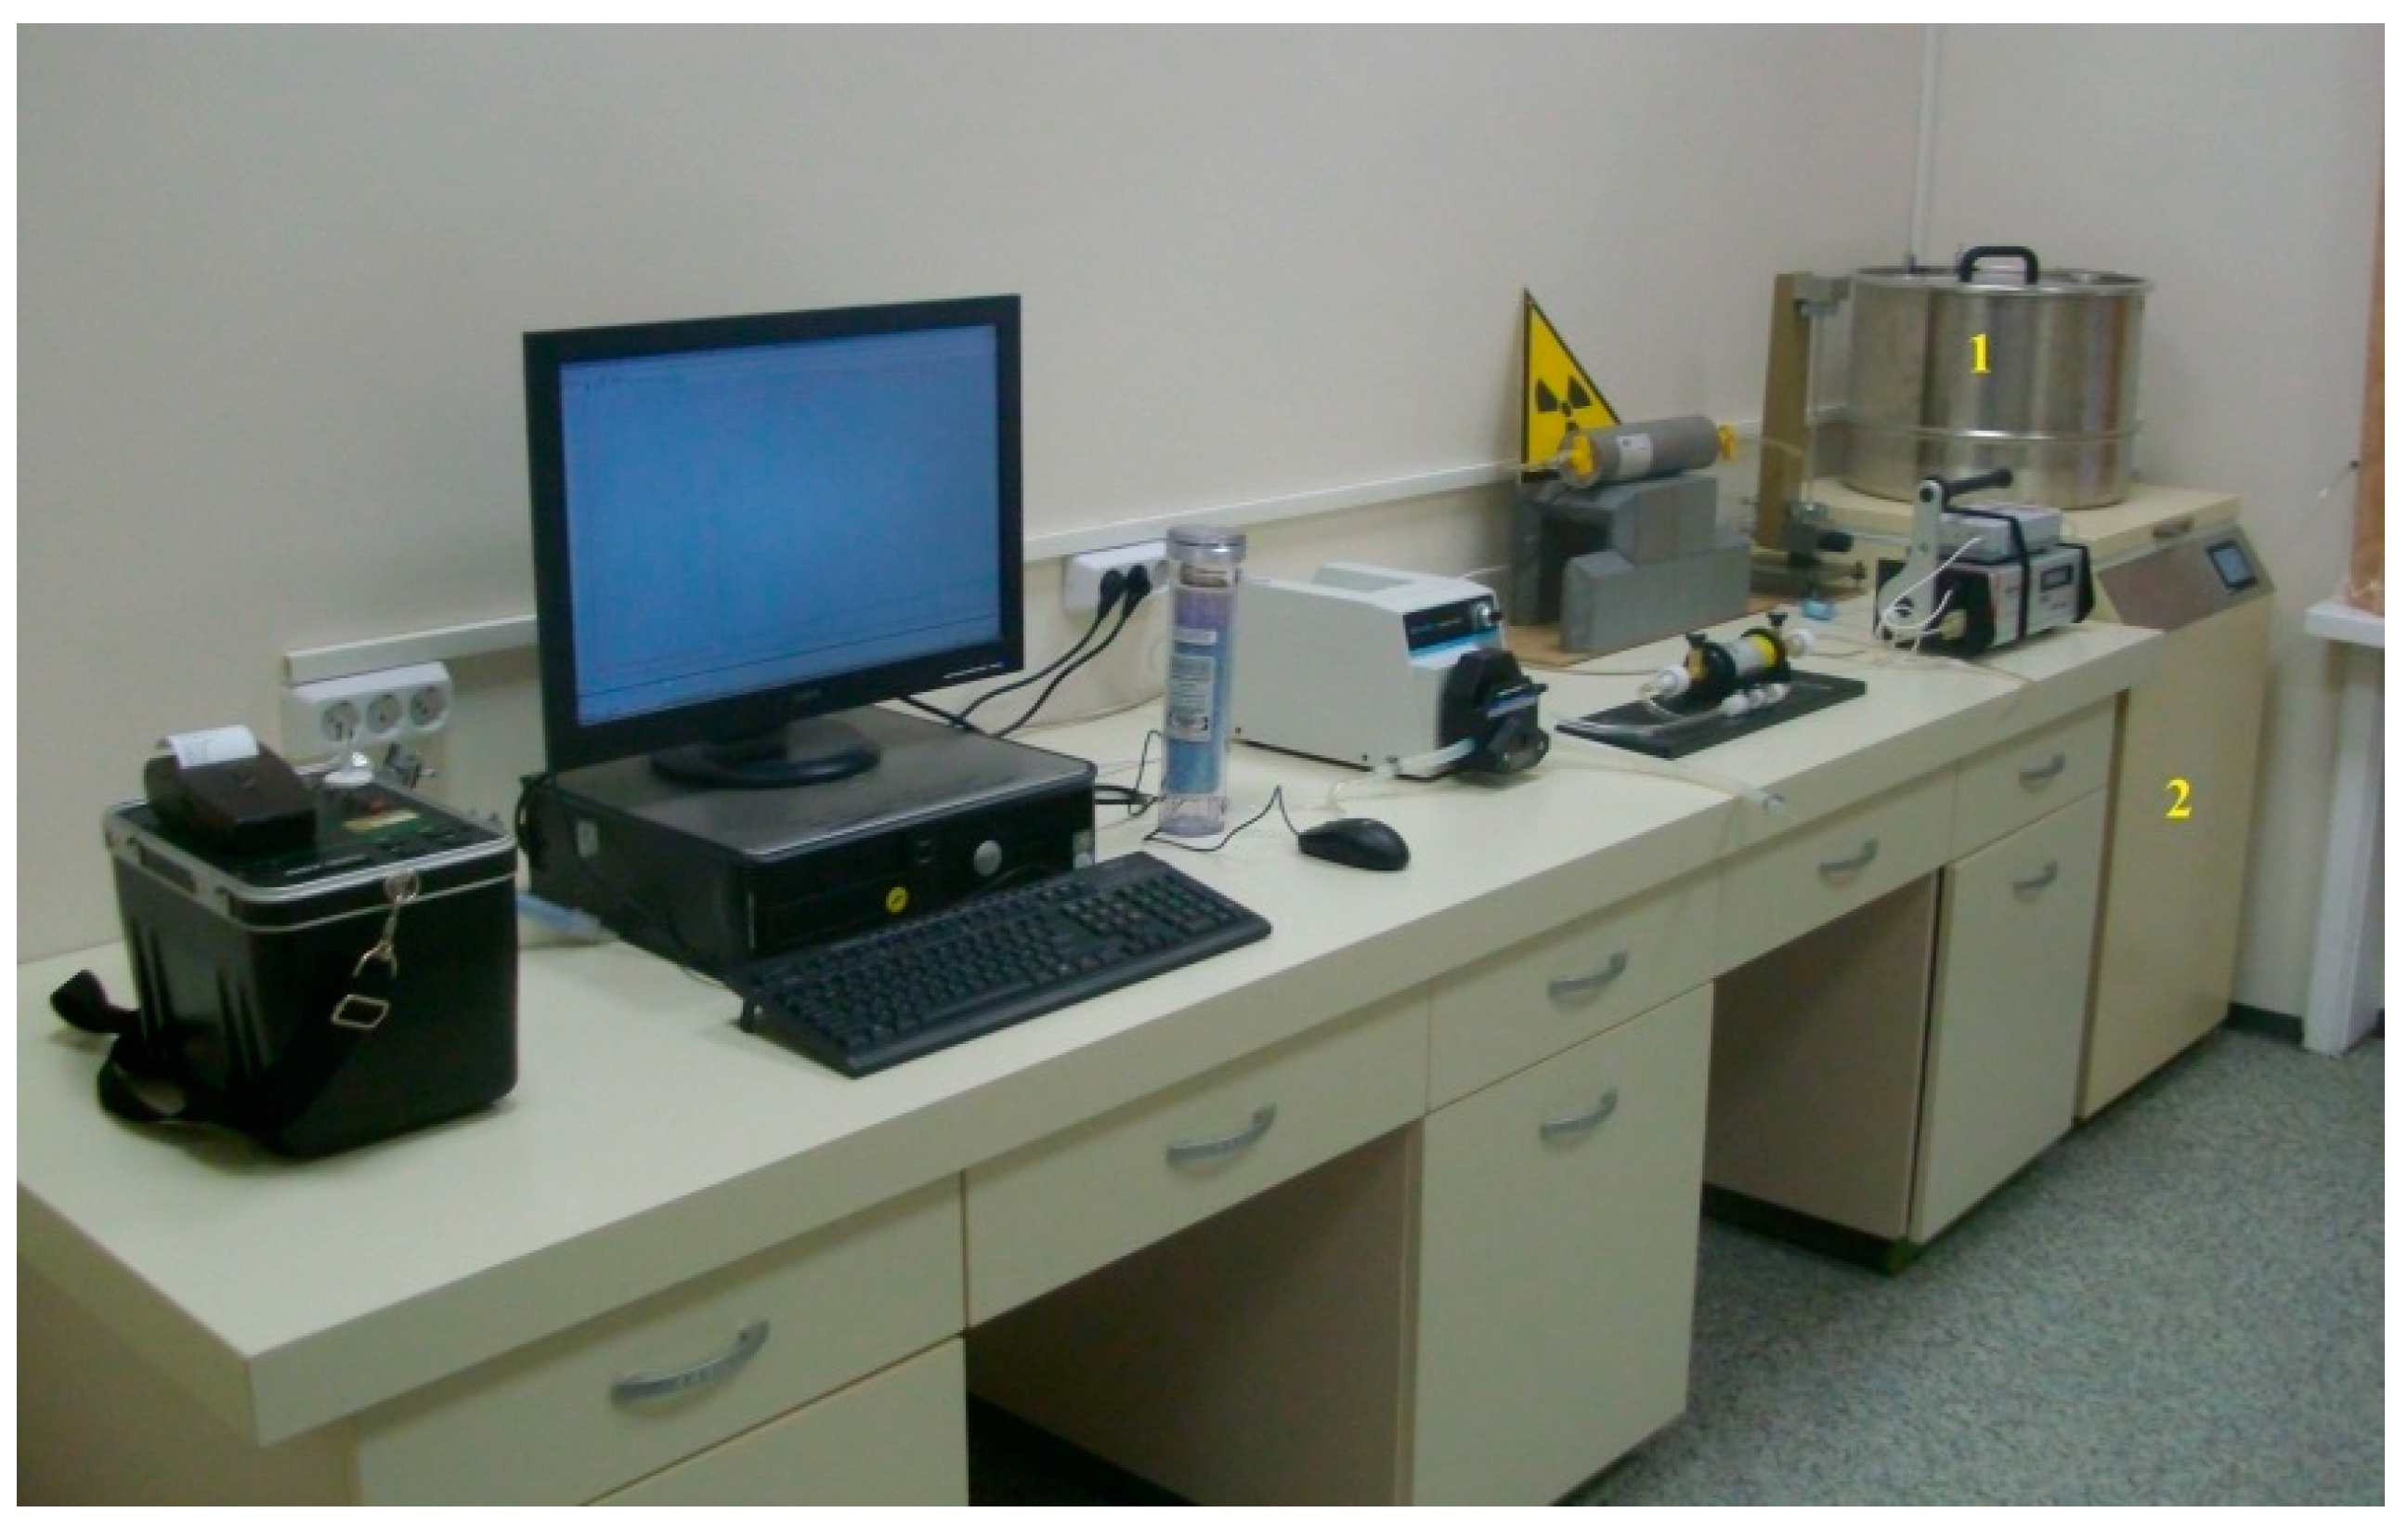
The calibration of the CDs was carried out at Sofia University, Bulgaria by exposure of identical unexposed disks at reference radon concentrations at the average temperature of the exposure in the LNR (12.6 °C). The calibration exposure was done using the calibration facility described in [
9] (
Figure 4). The reference concentration was measured by the reference monitor AlphaGUARD PQ2000 PRO (Saphymo/Bertin Instruments, Frankfurt am Main, Germany). The calibration factor (
CF = net track density/radon exposure) was determined for two depths beneath the disk surface: 80 µm and 120 µm. The
CF values at the average temperature were as follows:
Since the track density decreases in depth [
8], the
CF at temperature 12.6 °C at depth 80 µm is 3.3 times greater than the
CF at 120 µm. Analysis at depths greater than 80 µm can be useful when the signal at 80 µm is high and approaches the saturation level. While it is hard to analyze the tracks in a saturated track detector, the CDs give the opportunity to analyze them at a greater depth at which the tracks are less and to ensure quantitative measurements.
3. Results and Discussion
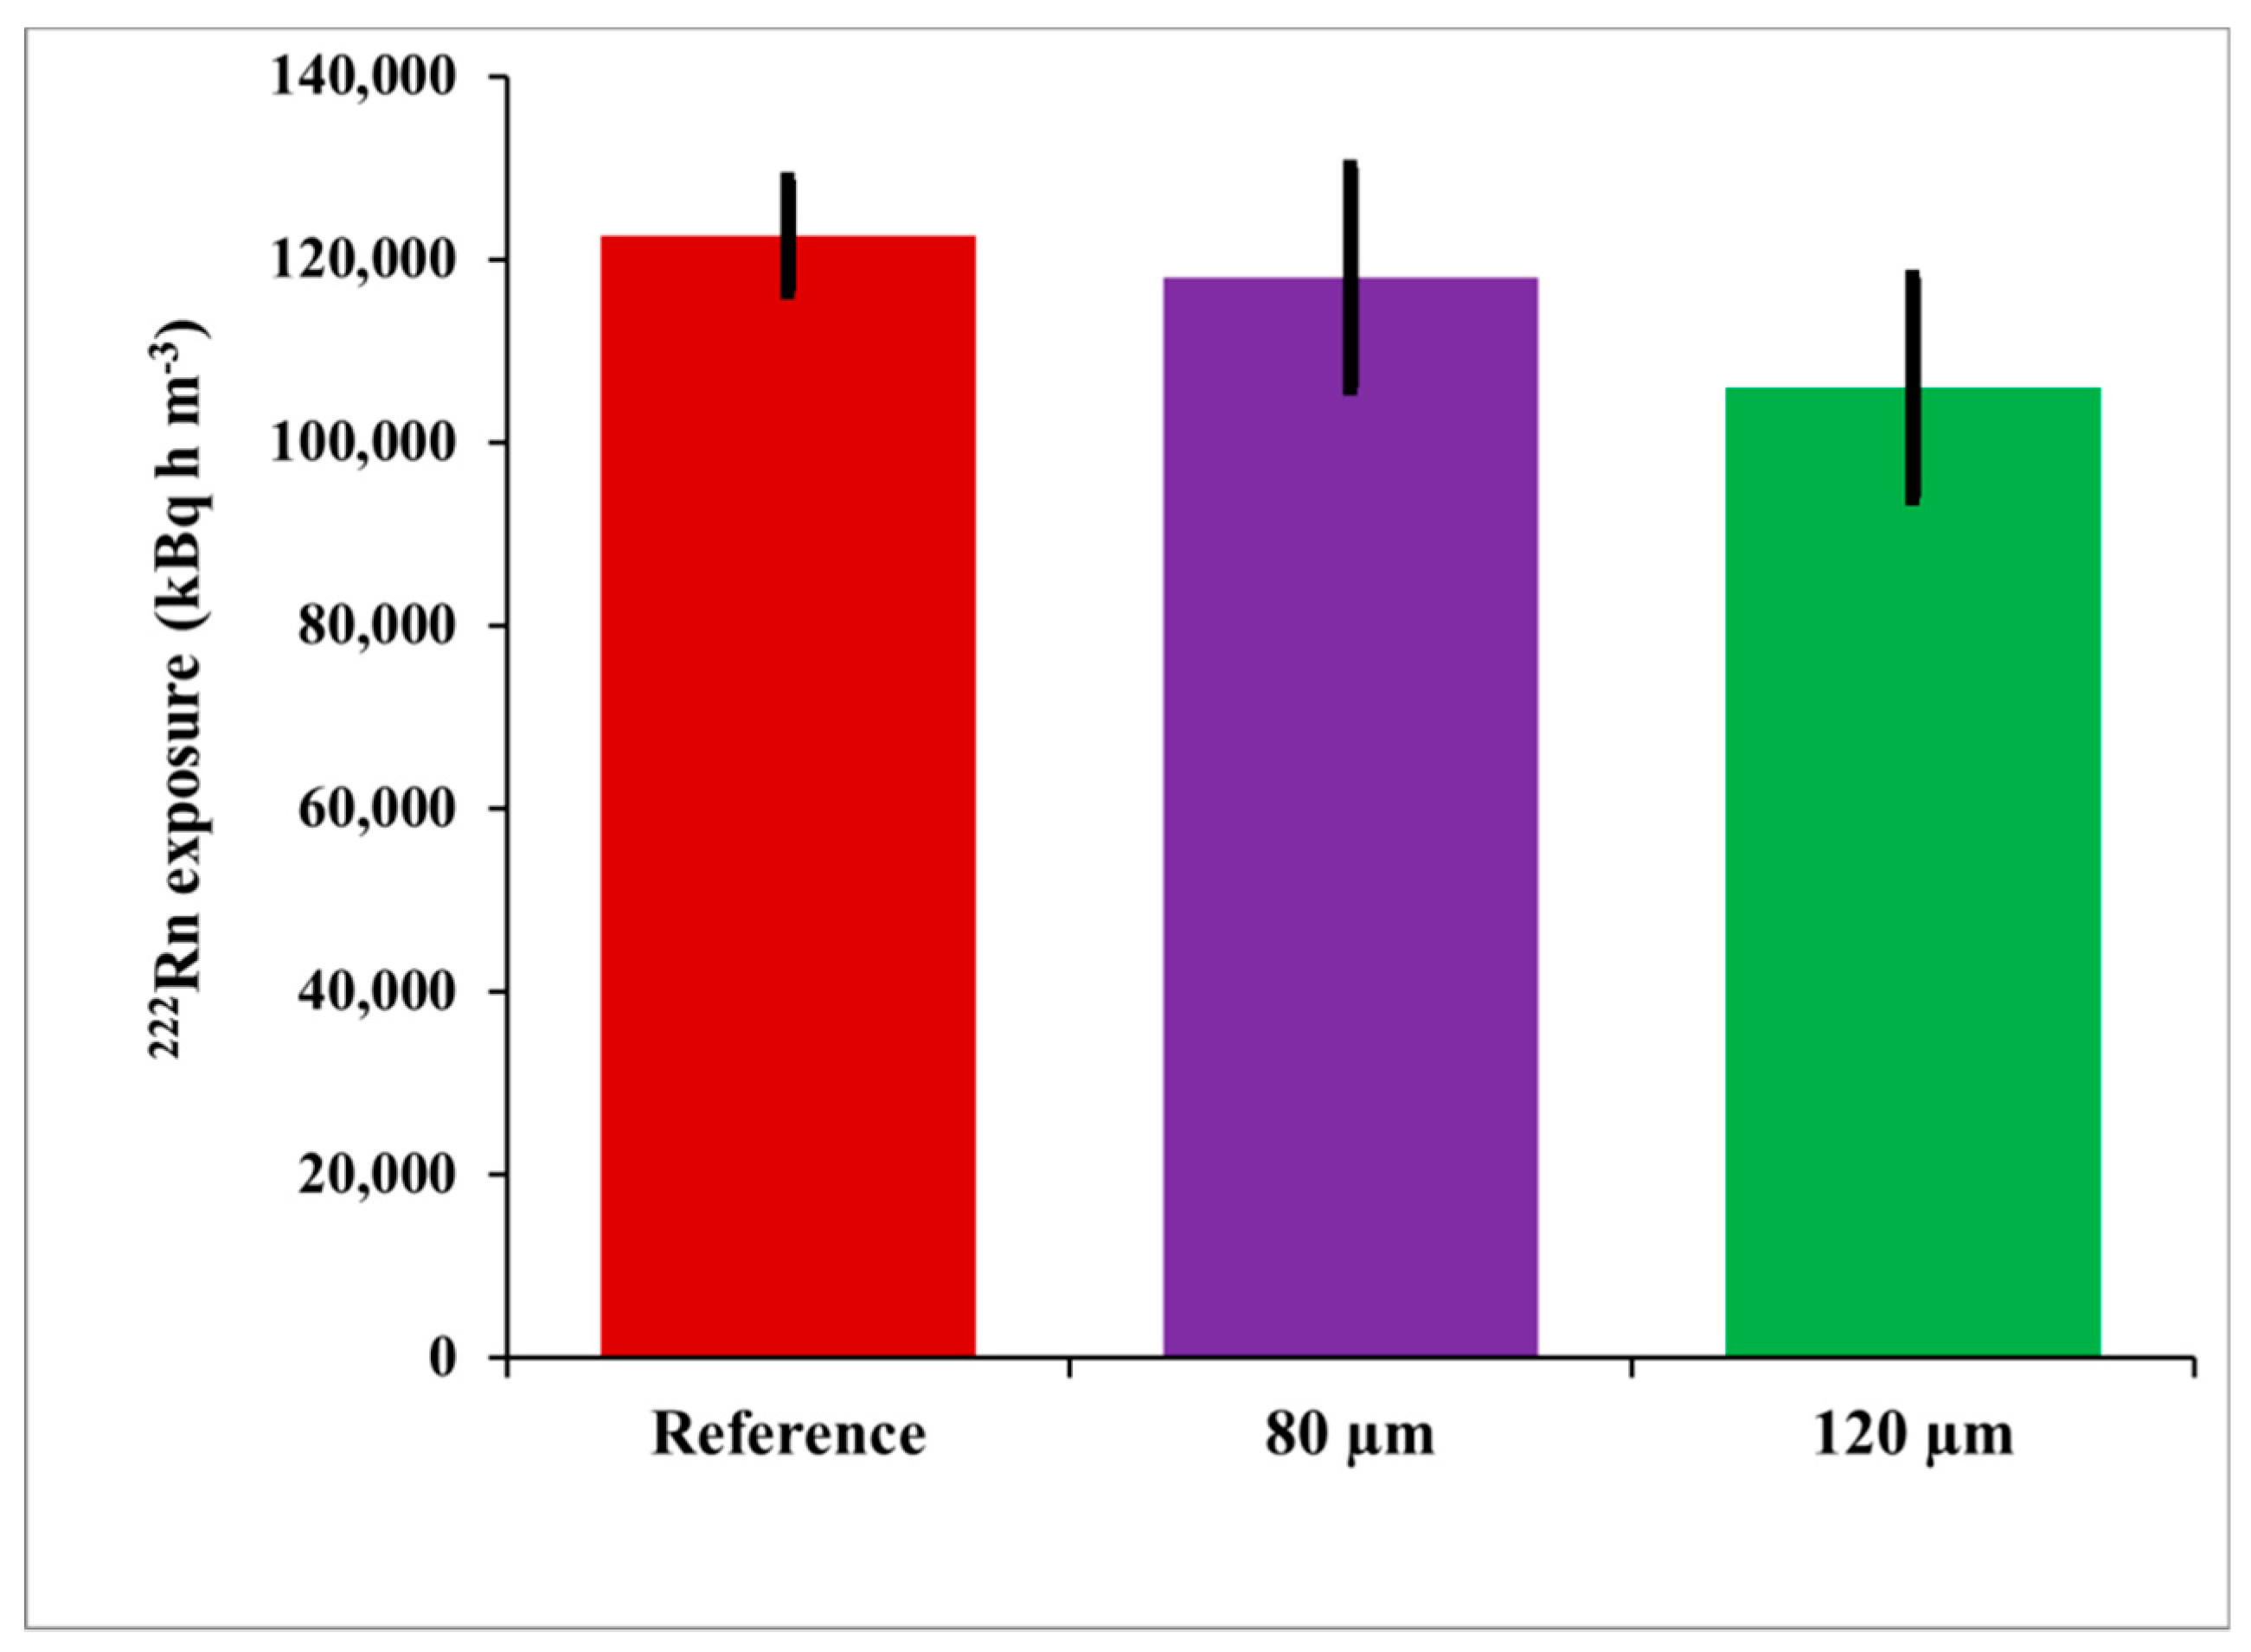
The integrated
222Rn activity concentration (
222Rn exposure) was determined by numerical integration of the values of the
222Rn activity concentration measured by the reference continuous monitor. Its value for this experiment was
I = 122,500 ± 6100 kBq h m
−3. The
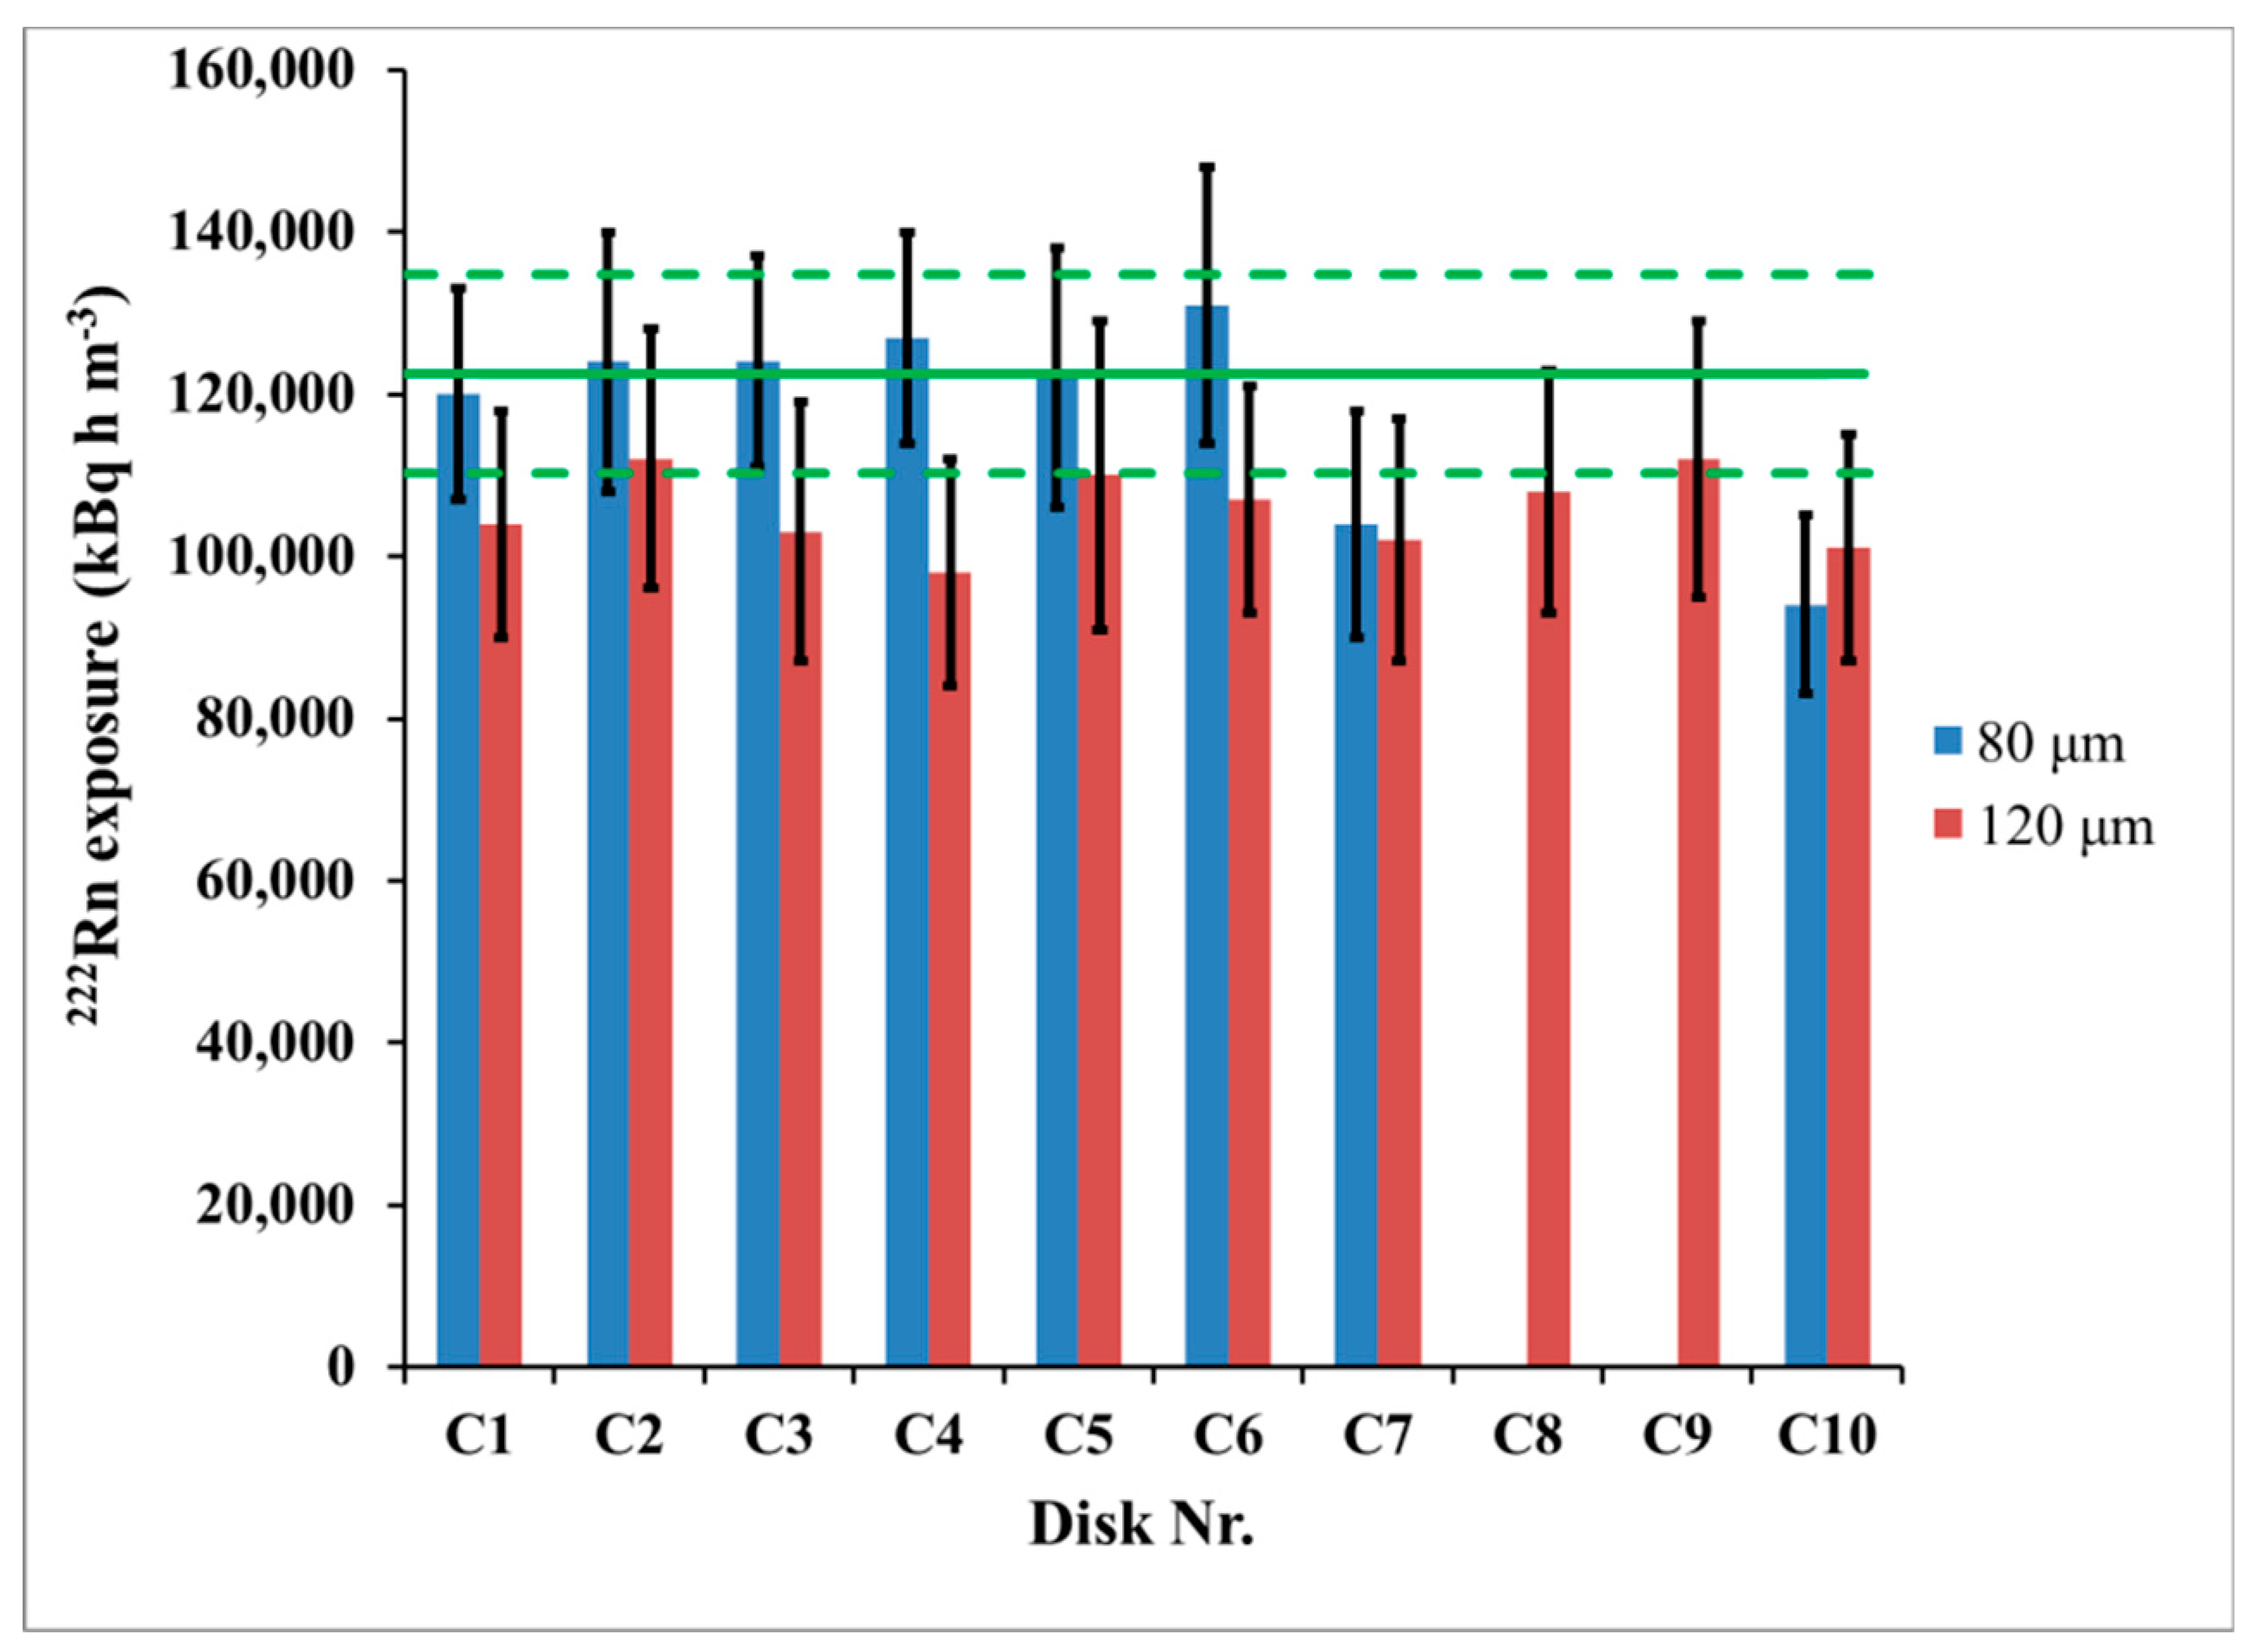
222Rn exposure by CDs was determined by the net track-density at two depths beneath the CD surface, 80 µm and 120 µm, considering the obtained calibration factors. The results of the blind comparison are illustrated in
Figure 5. The individual results for the
222Rn exposure by the single CDs analyzed at 80 µm and 120 µm are shown in
Figure 6.
The differences between the reference activity concentration and that assessed by CDs were 3.7% at 80 µm and 13.5% at 120 µm (
Figure 5). The
t-test [
7,
10] showed that they are not statistically significant at 95% level of confidence. However, a small and systematic bias was observed at both depths analyzed. Therefore, after the results from the blind comparison became available, we explored potential reasons for such bias. The CD calibration factor depends on the temperature, and the time variations of the temperature may incur bias in the results obtained by using the
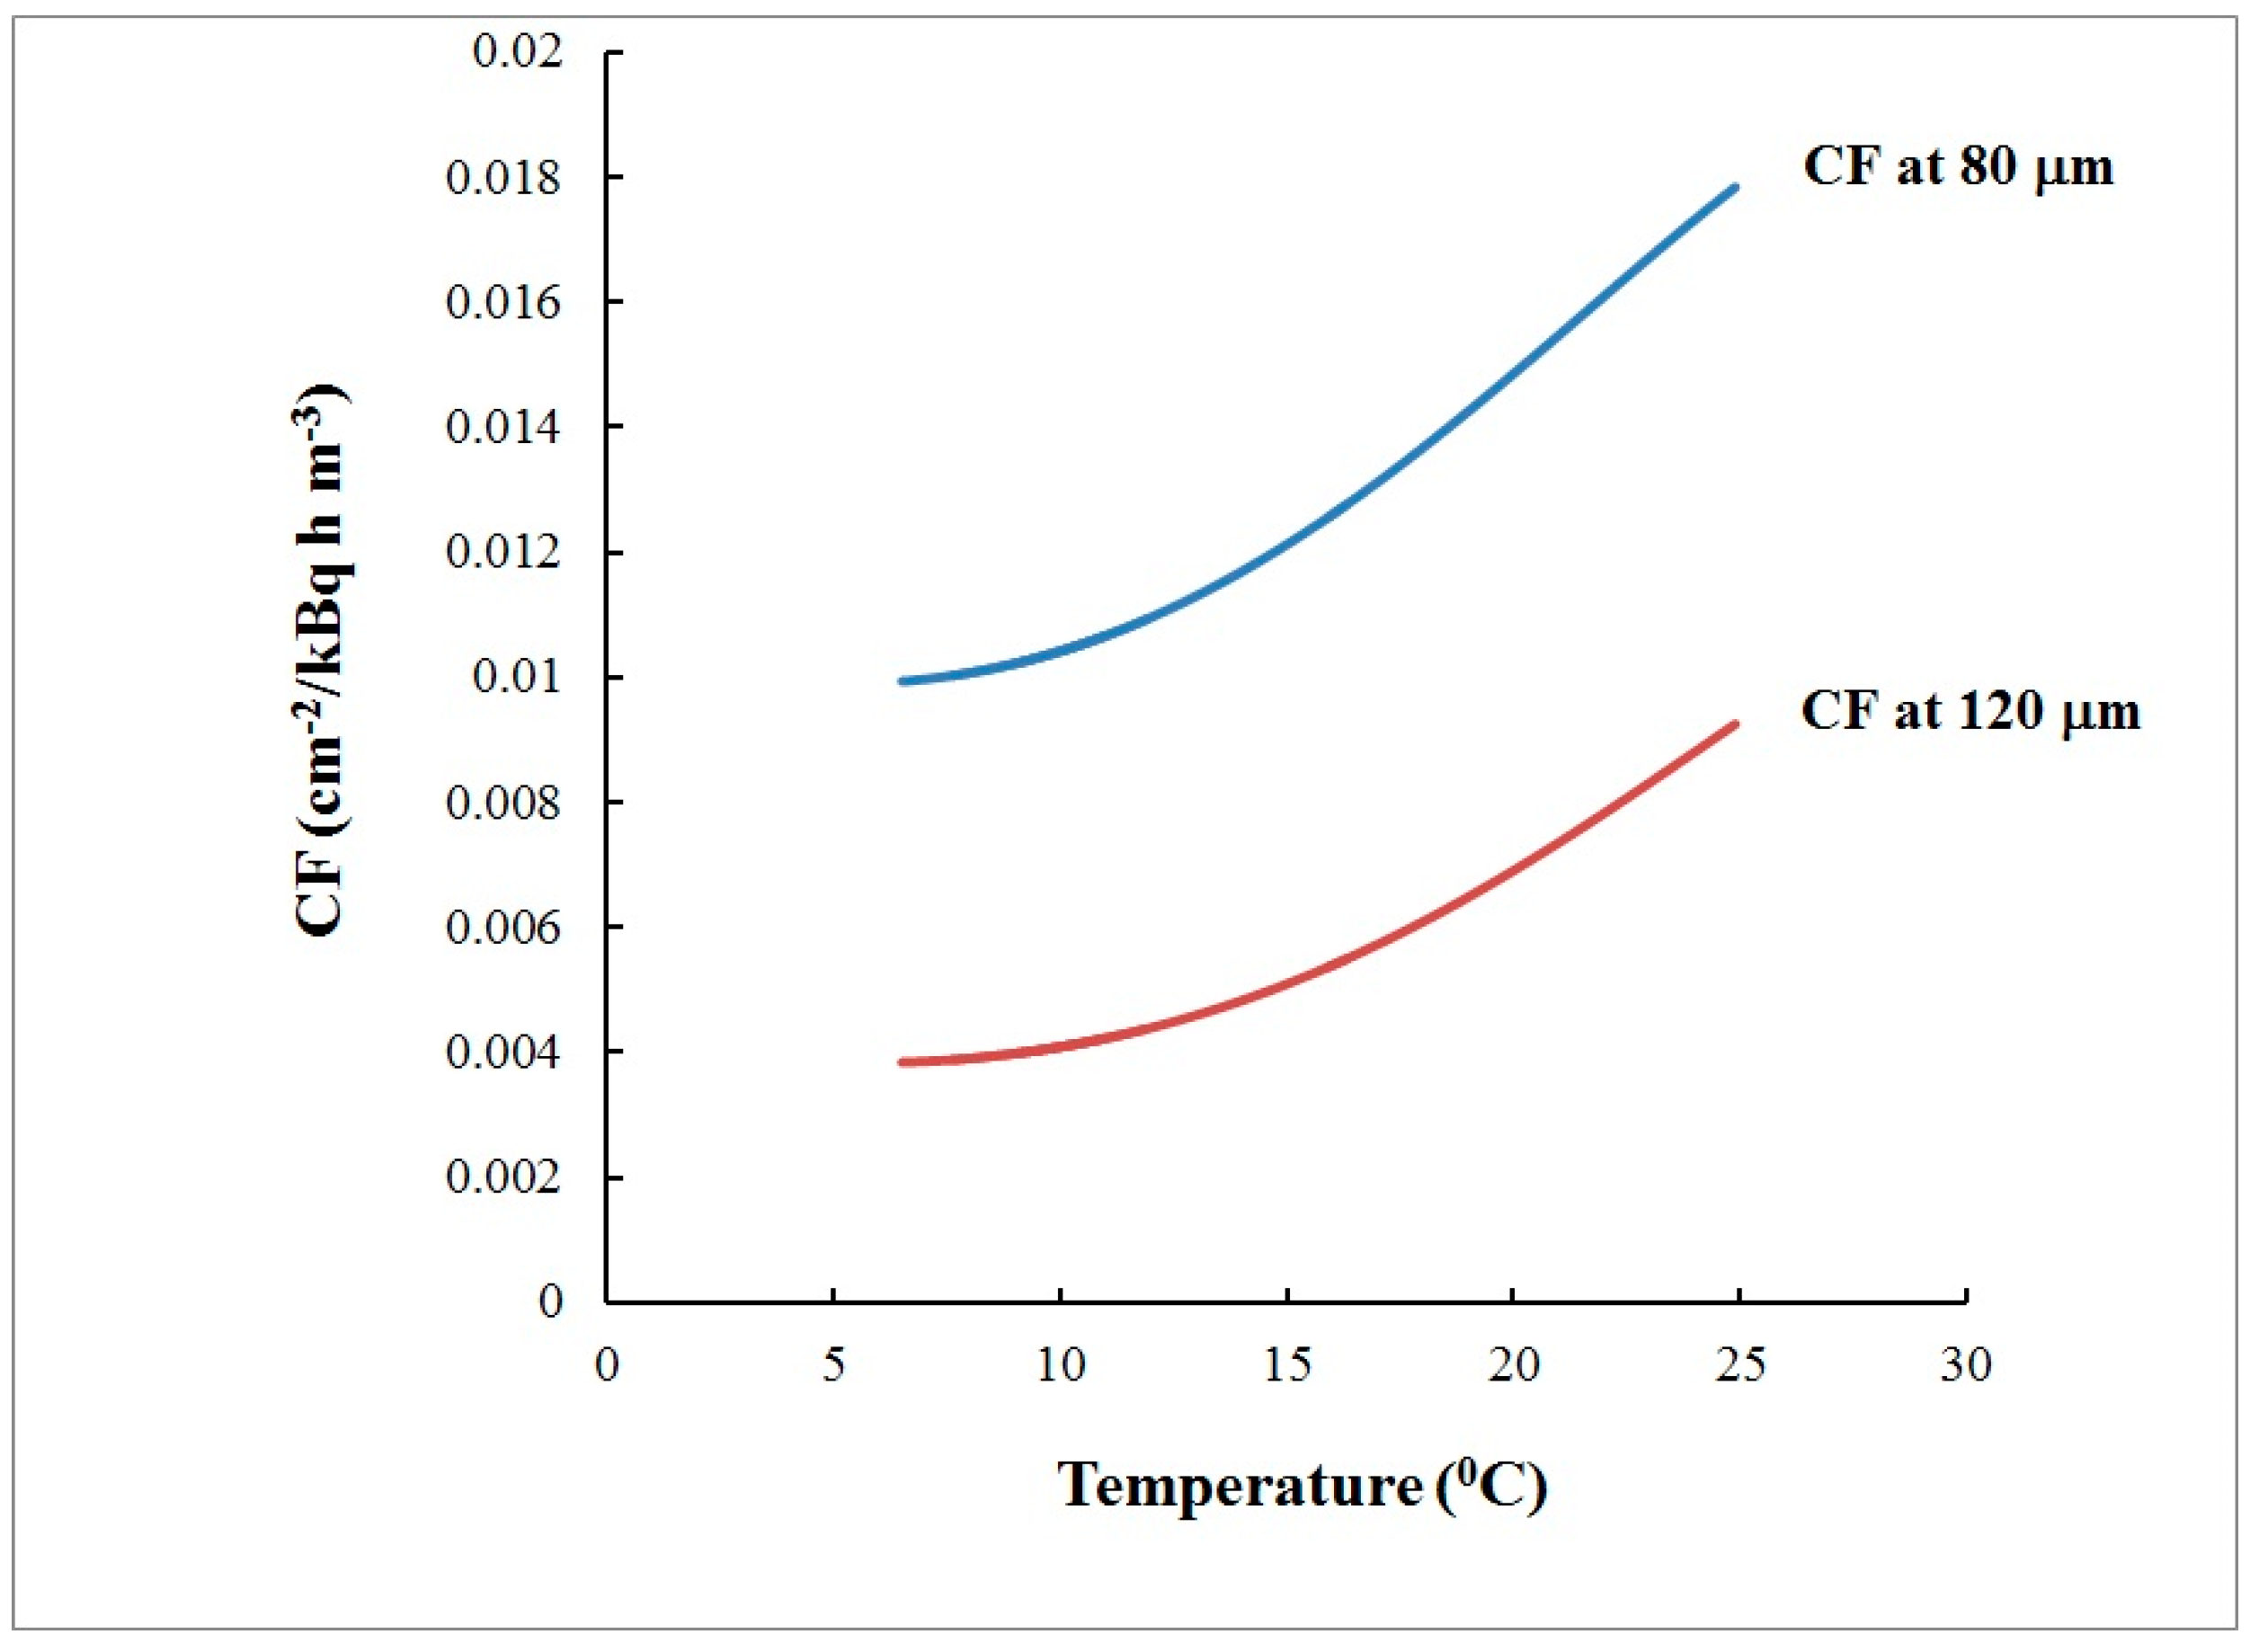
CF value estimated during the calibration exposure at “the average” temperature. To study this bias, theoretical modeling which follows the model described in [
11] was employed. In the theoretical model [
11] the dependence of the
CF is modeled analytically and numerically as a function of the temperature within the temperature interval 5–38 °C. The model [
11] considers the radon absorption and the track-etch properties of the polycarbonate material of which the commercial CDs/DVDs are made. The temperature dependence of the
CF(T), modeled for the studied temperature interval according to [
11] is illustrated in
Figure 7 for the two depths at which the signal is analyzed: 80 µm and 120 µm.
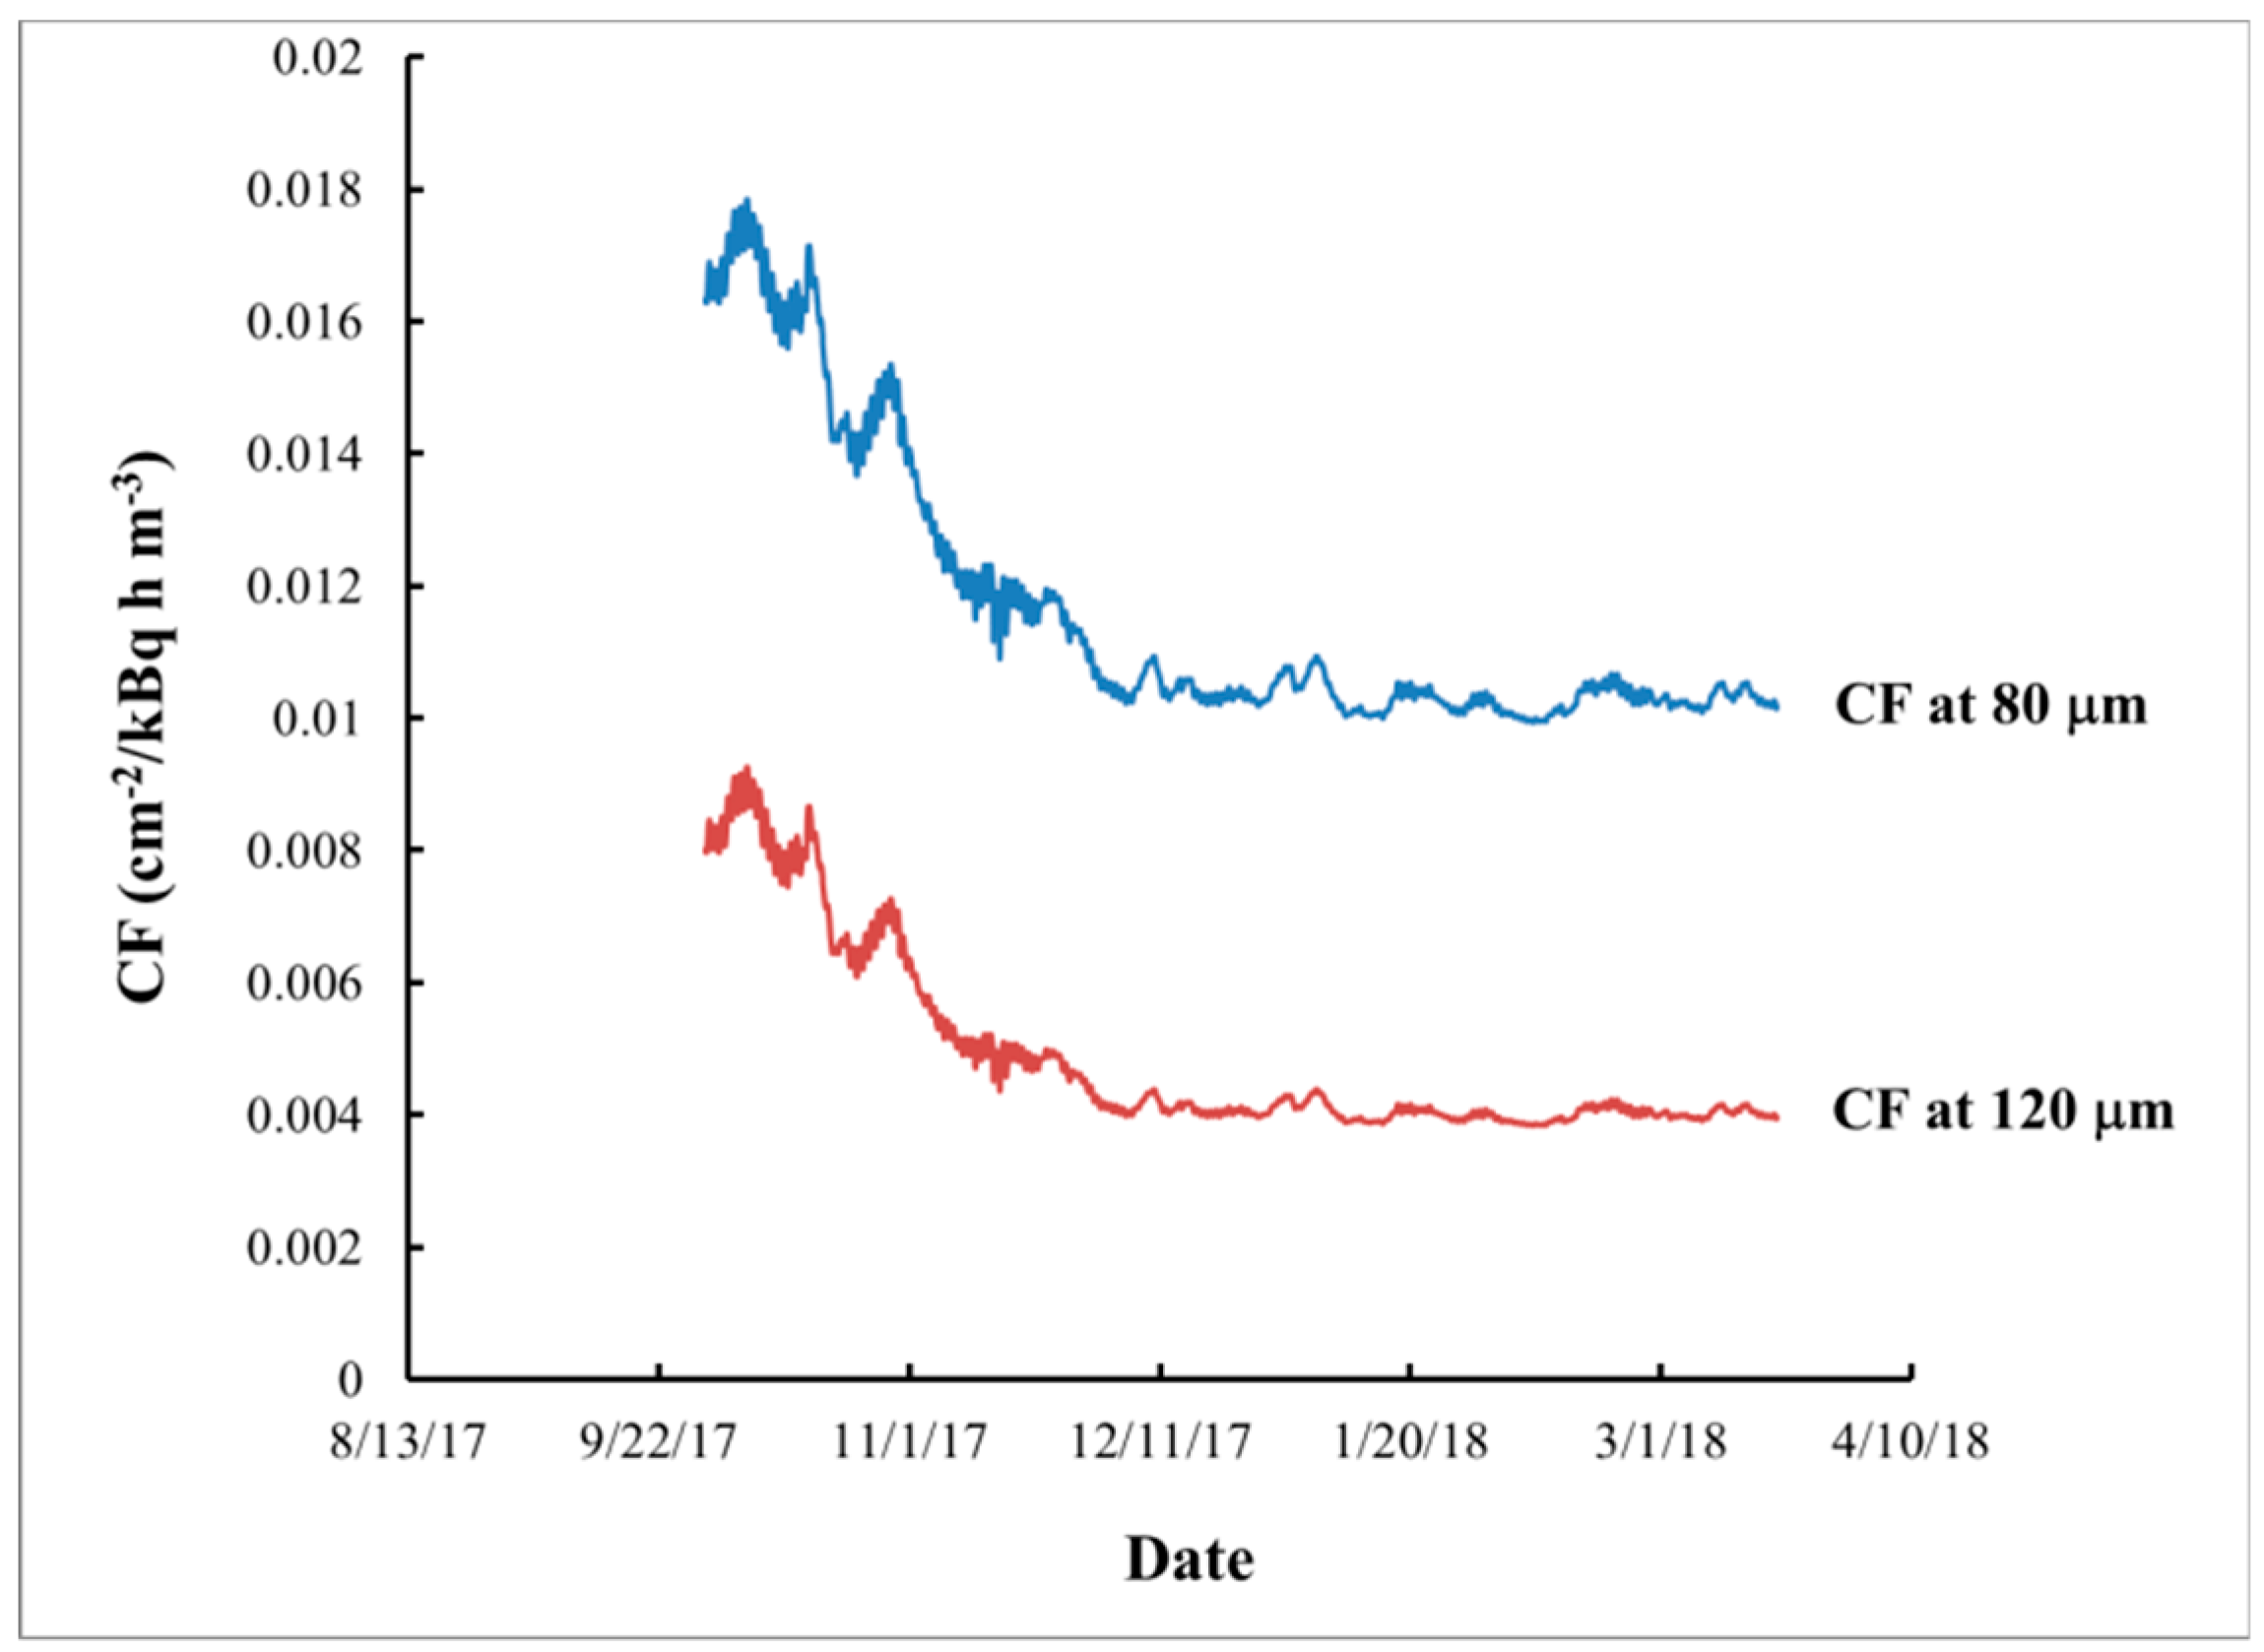
In the real exposure the calibration factor depends on the temperature
T, which depends on the time
t. By combining the temperature dependence of the
CF(
T) with the time dependence
T(
t) of the temperature (
Figure 2a), the time dependence of the calibration factor
CF(
T(
t)) can be determined (
Figure 8). On the other hand, the
222Rn activity concentration
CA(
t) also depends on the time (
Figure 2b). The “true” calibration factor
is the ratio between the signal
n and the
222Rn exposure (
I) at the specific exposure conditions (i.e.,
). Any small time interval
dt at which
CF(
t) and
CA(
t) can be considered practically constant contributes to the signal by
Therefore, for the signal one obtains the following expression, used in the modeling below:
where
texp is the exposure time. The “true” calibration factor
depends on the exposure scenario and may differ from the calibration factor
at the average temperature
, where:
To study the effect of the eventual difference between the “true” calibration factor and that used in the blind comparison (determined in the laboratory and corresponding to the average temperature) a model approach was used. The “true calibration factors” were calculated for the known exposure conditions, by adjusting the calibration factors at the average temperature for the real exposure profile. The obtained results are:
The results of the integrated
222Rn activity concentrations without and with such adjustment are shown in
Table 1.
As seen, adjustment for the real exposure temperature improves the correspondence between the results, making it almost perfect for CDs etched at a depth of 80 µm (deviation reduced from 3.7% to 0.4%). For CDs etched at 120 µm, the deviation between the results and the reference value is reduced from 13.5% to 9.8%. The theoretical modeling revealed that the influence of the temperature variability is greater at a depth of 120 µm and therefore greater temperature bias can be expected. However, there are situations in which the analysis at a greater depth may be preferred. At a depth of 80 µm the “upper limit” of the method (corresponding to track density saturation) is at an integrated
222Rn activity concentration about 260,000 kBq h m
−3 [
5]. However, the upper limit can be increased significantly by etching at a greater depth and/or by modifying the etching regime [
12]. This adds the possibility to make the upper limit of this method quite greater than that of the conventional radon detectors. Thereby, the method is applicable for the measurement of very large radon exposures, either for a long exposition time or at very high radon activity concentration.
According to the results from the experimental comparison and theoretical modeling, a possible reason for the bias between the reference value and the CD results in the blind comparison could be the great time variations of the temperature and 222Rn activity concentration. However, this bias appears to be small even under these extreme variations.

 and
and 


