Excess Mortality in Istanbul during Extreme Heat Waves between 2013 and 2017

 , ,
, ,
Abstract
:1. Introduction
2. Methods
2.1. Study Area
2.2. Mortality Data
2.3. Meteorological Data
2.4. Definition of Heat Wave
2.5. Statistical Analysis
3. Results
4. Discussion
5. Conclusions
Author Contributions
Funding
Acknowledgments
Conflicts of Interest
References
- Perkins, S.; Alexander, L.; Nairn, J. Increasing frequency, intensity and duration of observed global heatwaves and warm spells. Geophys. Res. Lett. 2012, 39. [Google Scholar] [CrossRef]
- Kuglitsch, F.G.; Toreti, A.; Xoplaki, E.; Della-Marta, P.M.; Zerefos, C.S.; Türkeş, M.; Luterbacher, J. Heat wave changes in the eastern Mediterranean since 1960. Geophys. Res. Lett. 2010, 37. [Google Scholar] [CrossRef] [Green Version]
- Diffenbaugh, N.S.; Pal, J.S.; Giorgi, F.; Gao, X. Heat stress intensification in the Mediterranean climate change hotspot. Geophys. Res. Lett. 2007, 34. [Google Scholar] [CrossRef] [Green Version]
- Semenza, J.C.; Rubin, C.H.; Falter, K.H.; Selanikio, J.D.; Flanders, W.D.; Howe, H.L.; Wilhelm, J.L. Heat-related deaths during the July 1995 heat wave in Chicago. N. Engl. J. Med. 1996, 335, 84–90. [Google Scholar] [CrossRef]
- Robine, J.-M.; Cheung, S.L.K.; Le Roy, S.; Van Oyen, H.; Griffiths, C.; Michel, J.-P.; Herrmann, F.R. Death toll exceeded 70,000 in Europe during the summer of 2003. C. R. Biol. 2008, 331, 171–178. [Google Scholar] [CrossRef] [PubMed]
- Azhar, G.S.; Mavalankar, D.; Nori-Sarma, A.; Rajiva, A.; Dutta, P.; Jaiswal, A.; Sheffield, P.; Knowlton, K.; Hess, J.J. Heat-related mortality in India: Excess all-cause mortality associated with the 2010 Ahmedabad heat wave. PLoS ONE 2014, 9, e91831. [Google Scholar] [CrossRef]
- Fouillet, A.; Rey, G.; Wagner, V.; Laaidi, K.; Empereur-Bissonnet, P.; Le Tertre, A.; Frayssinet, P.; Bessemoulin, P.; Laurent, F.; De Crouy-Chanel, P. Has the impact of heat waves on mortality changed in France since the European heat wave of summer 2003? A study of the 2006 heat wave. Int. J. Epidemiol. 2008, 37, 309–317. [Google Scholar] [CrossRef]
- Unal, Y.S.; Tan, E.; Mentes, S.S. Summer heat waves over western Turkey between 1965 and 2006. Theor. Appl. Climatol. 2013, 112, 339–350. [Google Scholar] [CrossRef]
- Gurkan, H.; Eskioglu, O.; Yazıcı, B.; Sensoy, S.; Komuscu, A.U.; Calik, Y. Projected trends in heat and cold waves under effect of climate change. In Proceedings of the 8th Atmospheric Sciences Symposium, Istanbul, Turkey, 1–4 November 2017; pp. 111–122. [Google Scholar]
- Demirtaş, M. High impact heat waves over the Euro-Mediterranean region and Turkey-in concert with atmospheric blocking and large dynamical and physical anomalies. Anadolu Üniv. Bilim. Teknol. Derg. A Uygul. Bilimler Mühendis. 2017, 18, 97–114. [Google Scholar] [CrossRef]
- Reuters. Available online: https://www.reuters.com/article/environment-europe-heatwave-dc/heatwave-causes-deaths-in-greece-romania-idUSL2515969220070625 (accessed on 5 June 2019).
- Daily Sabah Europe. Available online: https://www.dailysabah.com/europe/2017/08/05/heat-wave-affects-southern-europe-turkey-gives-a-taste-of-the-future (accessed on 5 June 2019).
- The Guardian. Available online: https://www.theguardian.com/environment/2000/jul/09/weather.climatechange (accessed on 5 June 2019).
- Ozturk, T.; Ceber, Z.P.; Türkeş, M.; Kurnaz, M.L. Projections of climate change in the Mediterranean Basin by using downscaled global climate model outputs. Int. J. Climatol. 2015, 35, 4276–4292. [Google Scholar] [CrossRef]
- Leone, M.; D’Ippoliti, D.; De Sario, M.; Analitis, A.; Menne, B.; Katsouyanni, K.; de’Donato, F.K.; Basagana, X.; Salah, A.B.; Casimiro, E.; et al. A time series study on the effects of heat on mortality and evaluation of heterogeneity into European and Eastern-Southern Mediterranean cities: Results of EU CIRCE project. Environ. Health 2013, 12, 55:1–55:12. [Google Scholar] [CrossRef] [PubMed]
- Oray, N.C.; Oray, D.; Aksay, E.; Atilla, R.; Bayram, B. The impact of a heat wave on mortality in the emergency department. Medicine 2018, 97, e13815. [Google Scholar] [CrossRef] [PubMed]
- Amengual, A.; Homar, V.; Romero, R.; Brooks, H.E.; Ramis, C.; Gordaliza, M.; Alonso, S. Projections of heat waves with high impact on human health in Europe. Glob. Planet. Chang. 2014, 119, 71–84. [Google Scholar] [CrossRef]
- Campbell, S.; Remenyi, T.A.; White, C.J.; Johnston, F.H. Heatwave and health impact research: A global review. Health Place 2018, 53, 210–218. [Google Scholar] [CrossRef] [PubMed]
- TUIK. Available online: http://www.tuik.gov.tr/PreIstatistikTablo.do?istab_id=1590 (accessed on 19 January 2019).
- Ezber, Y.; Lutfi Sen, O.; Kindap, T.; Karaca, M. Climatic effects of urbanization in Istanbul: A statistical and modeling analysis. Int. J. Climatol. 2007, 27, 667–679. [Google Scholar] [CrossRef]
- Toros, H.; Abbasnia, M.; Sagdic, M.; Tayanç, M. Long-Term Variations of Temperature and Precipitation in the Megacity of Istanbul for the Development of Adaptation Strategies to Climate Change. Adv. Meteorol. 2017. [Google Scholar] [CrossRef]
- Perkins, S.E.; Alexander, L.V. On the measurement of heat waves. J. Clim. 2013, 26, 4500–4517. [Google Scholar] [CrossRef]
- McGregor, G.R.; Bessemoulin, P.; Ebi, K.; Menne, B. Heatwaves and Health: Guidance on Warning-System Development; World Meteorological Organization and World Health Organization: Geneva, Switzerland, 2015. [Google Scholar]
- Huang, C.; Barnett, A.G.; Wang, X.; Tong, S. Effects of extreme temperatures on years of life lost for cardiovascular deaths: A time series study in Brisbane, Australia. Circ. Cardiovasc. Qual. Outcomes 2012, 5, 609–614. [Google Scholar] [CrossRef]
- Grize, L.; Huss, A.; Thommen, O.; Schindler, C.; Braun-Fahrlander, C. Heat wave 2003 and mortality in Switzerland. Swiss Med. Wkly. 2005, 135, 200–205. [Google Scholar]
- Hutter, H.-P.; Moshammer, H.; Wallner, P.; Leitner, B.; Kundi, M. Heatwaves in Vienna: Effects on mortality. Wien. Klin. Wochenschr. 2007, 119, 223–227. [Google Scholar] [CrossRef]
- Fouillet, A.; Rey, G.; Laurent, F.; Pavillon, G.; Bellec, S.; Guihenneuc-Jouyaux, C.; Clavel, J.; Jougla, E.; Hémon, D. Excess mortality related to the August 2003 heat wave in France. Int. Arch. Occup. Environ. Health 2006, 80, 16–24. [Google Scholar] [CrossRef] [PubMed] [Green Version]
- Bogdanović, D.; Milošević, Z.; Lazarević, K.K.; Dolicanin, Z.C.; Ranđelović, D.; Bogdanović, S.D. The impact of the July 2007 heat wave on daily mortality in Belgrade, Serbia. Cent. Eur. J. Public Health 2013, 21, 140–145. [Google Scholar] [CrossRef] [PubMed]
- Bustinza, R.; Lebel, G.; Gosselin, P.; Bélanger, D.; Chebana, F. Health impacts of the July 2010 heat wave in Quebec, Canada. BMC Public Health 2013, 13, 56. [Google Scholar] [CrossRef] [PubMed]
- Reid, C.E.; O’neill, M.S.; Gronlund, C.J.; Brines, S.J.; Brown, D.G.; Diez-Roux, A.V.; Schwartz, J. Mapping community determinants of heat vulnerability. Environ. Health Perspect. 2009, 117, 1730–1736. [Google Scholar] [CrossRef] [PubMed]
- Rey, G.; Fouillet, A.; Bessemoulin, P.; Frayssinet, P.; Dufour, A.; Jougla, E.; Hémon, D. Heat exposure and socio-economic vulnerability as synergistic factors in heat-wave-related mortality. Eur. J. Epidemiol. 2009, 24, 495–502. [Google Scholar] [CrossRef]
- Hajat, S.; Kovats, R.S.; Atkinson, R.W.; Haines, A. Impact of hot temperatures on death in London: A time series approach. J. Epidemiol. Community Health 2002, 56, 367–372. [Google Scholar] [CrossRef]
- Tarım, T.C. Ve Orman Bakanlığı Meteoroloji Genel Müdürlüğü. İllere Ait Mevsim Normalleri(1981–2010). Available online: https://www.mgm.gov.tr/veridegerlendirme/il-ve-ilceler-istatistik.aspx?k=H&m=ISTANBUL (accessed on 5 June 2019).
- Li, J.; Xu, X.; Yang, J.; Liu, Z.; Xu, L.; Gao, J.; Liu, X.; Wu, H.; Wang, J.; Yu, J. Ambient high temperature and mortality in Jinan, China: A study of heat thresholds and vulnerable populations. Environ. Res. 2017, 156, 657–664. [Google Scholar] [CrossRef]
- Díaz, J.; Jordán, A.; García, R.; López, C.; Alberdi, J.; Hernández, E.; Otero, A. Heat waves in Madrid 1986–1997: Effects on the health of the elderly. Int. Arch. Occup. Environ. Health 2002, 75, 163–170. [Google Scholar] [CrossRef]
- Rooney, C.; McMichael, A.J.; Kovats, R.S.; Coleman, M.P. Excess mortality in England and Wales, and in Greater London, during the 1995 heatwave. J. Epidemiol. Community Health 1998, 52, 482–486. [Google Scholar] [CrossRef] [Green Version]
- TUIK. Adrese Dayalı Nüfus Kayıt Sistemi. Available online: http://www.tuik.gov.tr/PreTablo.do?alt_id=1059 (accessed on 19 January 2019).
- Conti, S.; Meli, P.; Minelli, G.; Solimini, R.; Toccaceli, V.; Vichi, M.; Beltrano, C.; Perini, L. Epidemiologic study of mortality during the Summer 2003 heat wave in Italy. Environ. Res. 2005, 98, 390–399. [Google Scholar] [CrossRef]
- Johnson, H.; Kovats, R.S.; McGregor, G.; Stedman, J.; Gibbs, M.; Walton, H.; Cook, L.; Black, E. The impact of the 2003 heat wave on mortality and hospital admissions in England. Health Stat. Q. 2004, 15, S126. [Google Scholar] [CrossRef]
- Kovats, R.S.; Johnson, H.; Griffith, C. Mortality in southern England during the 2003 heat wave by place of death. Health Stat. Q 2006, 29, 6–8. [Google Scholar]
- Canoui-Poitrine, F.; Cadot, E.; Spira, A. Excess deaths during the August 2003 heat wave in Paris, France. Rev. D’épidémiol. Santé Publique 2006, 54, 127–135. [Google Scholar] [CrossRef] [Green Version]
- Yin, Q.; Wang, J. The association between consecutive days’ heat wave and cardiovascular disease mortality in Beijing, China. BMC Public Health 2017, 17, 223. [Google Scholar] [CrossRef]
- Wainwright, S.H.; Buchanan, S.D.; Mainzer, M.; Parrish, R.G.; Sinks, T.H. Cardiovascular mortality—The hidden peril of heat waves. Prehosp. Disaster Med. 1999, 14, 18–27. [Google Scholar] [CrossRef]
- Ellis, F.; Nelson, F. Mortality in the elderly in a heat wave in New York City, August 1975. Environ. Res. 1978, 15, 504–512. [Google Scholar] [CrossRef]
- Bobb, J.F.; Obermeyer, Z.; Wang, Y.; Dominici, F. Cause-specific risk of hospital admission related to extreme heat in older adults. JAMA 2014, 312, 2659–2667. [Google Scholar] [CrossRef]
- Tong, S.; Ren, C.; Becker, N. Excess deaths during the 2004 heatwave in Brisbane, Australia. Int. J. Biometeorol. 2010, 54, 393–400. [Google Scholar] [CrossRef]
- Koppe, C.; Kovats, S.; Jendritzky, G.; Menne, B. Heat-Waves: Risks and Responses; World Health Organization: Copenhagen, Denmark, 2004. [Google Scholar]
- Sözcü. Available online: https://www.sozcu.com.tr/2017/gundem/hava-durumu-1-agustos-asiri-nem-rekor-sicakliklari-getirecek-1955483/ (accessed on 5 June 2019).
- Akşam. Available online: https://www.aksam.com.tr/guncel/istanbul-hava-durumu-meteoroloji-sicaklik-uyarisi-6-agustos/haber-649139 (accessed on 5 June 2019).
- Basu, R.; Samet, J.M. Relation between elevated ambient temperature and mortality: A review of the epidemiologic evidence. Epidemiol. Rev. 2002, 24, 190–202. [Google Scholar] [CrossRef]
- Hajat, S.; Armstrong, B.; Baccini, M.; Biggeri, A.; Bisanti, L.; Russo, A.; Paldy, A.; Menne, B.; Kosatsky, T. Impact of high temperatures on mortality: Is there an added heat wave effect? Epidemiology 2006, 632–638. [Google Scholar] [CrossRef]
- Tong, S.; Wang, X.Y.; Barnett, A.G. Assessment of heat-related health impacts in Brisbane, Australia: Comparison of different heatwave definitions. PLoS ONE 2010, 5, e12155. [Google Scholar] [CrossRef] [PubMed]
- Xu, Z.; FitzGerald, G.; Guo, Y.; Jalaludin, B.; Tong, S. Impact of heatwave on mortality under different heatwave definitions: A systematic review and meta-analysis. Environ. Int. 2016, 89, 193–203. [Google Scholar] [CrossRef] [PubMed]
- Chebana, F.; Martel, B.; Gosselin, P.; Giroux, J.-X.; Ouarda, T.B. A general and flexible methodology to define thresholds for heat health watch and warning systems, applied to the province of Québec (Canada). Int. J. Biometeorol. 2013, 57, 631–644. [Google Scholar] [CrossRef] [PubMed]
- Chiu, Y.; Chebana, F.; Abdous, B.; Bélanger, D.; Gosselin, P. Mortality and morbidity peaks modeling: An extreme value theory approach. Stat. Methods Med. Res. 2018, 27, 1498–1512. [Google Scholar] [CrossRef]


| Characteristic | 2013 | 2014 | 2015 | 2016 | 2017 |
|---|---|---|---|---|---|
| Average of Daily Mean Temperatures (°C) (Min–Max) | 23.7 (18.6–26.3) | 23.7 (17.5–27.6) | 23.4 (18.5–27.9) | 24.2 (17.3–27.2) | 23.5 (17–29.9) |
| Number of days with daily average of mean temperatures > 95th percentiles (n) | 0 | 5 | 5 | 7 | 6 |
| Number of extreme heat waves (n)(days) | 0 | 0 | 1(4) | 1(7) | 2(3; 3) |
| Population (n) | 14,160,467 | 14,377,018 | 14,657,434 | 14,804,116 | 15,029,231 |
| Daily average number of deaths (n) (Rates/100k) | 140.0 (0.99) | 153.2 (1.07) | 157.7 (1.08) | 161.9 (1.09) | 160.9 (1.07) |
| Daily average number of deaths by sex (n) (Rates/100k) | |||||
| Male | 75.6 (1.06) | 81.5 (1.13) | 82.5 (1.12) | 86.4 (1.16) | 85.8 (1.14) |
| Female | 64.4 (0.91) | 71.7 (1.00) | 75.2 (1.03) | 75.5 (1.02) | 75.1 (1.00) |
| Daily average number of deaths by age groups (n) (Rates/100k) | |||||
| 0–14 | 9.6 (0.29) | 10.7 (0.33) | 10.1 (0.31) | 10.1 (0.31) | 9.7 (0.29) |
| 15–64 | 38.8 (0.39) | 41.3 (0.40) | 41.9 (0.40) | 42.9 (0.40) | 42.6 (0.40) |
| 65–74 | 28 (3.38) | 30.7 (3.62) | 31.5 (3.45) | 32.8 (3.49) | 32.8 (3.31) |
| ≥75 | 63.5 (12.42) | 70.6 (13.36) | 74.2 (12.91) | 76.1 (12.78) | 75.8 (12.08) |
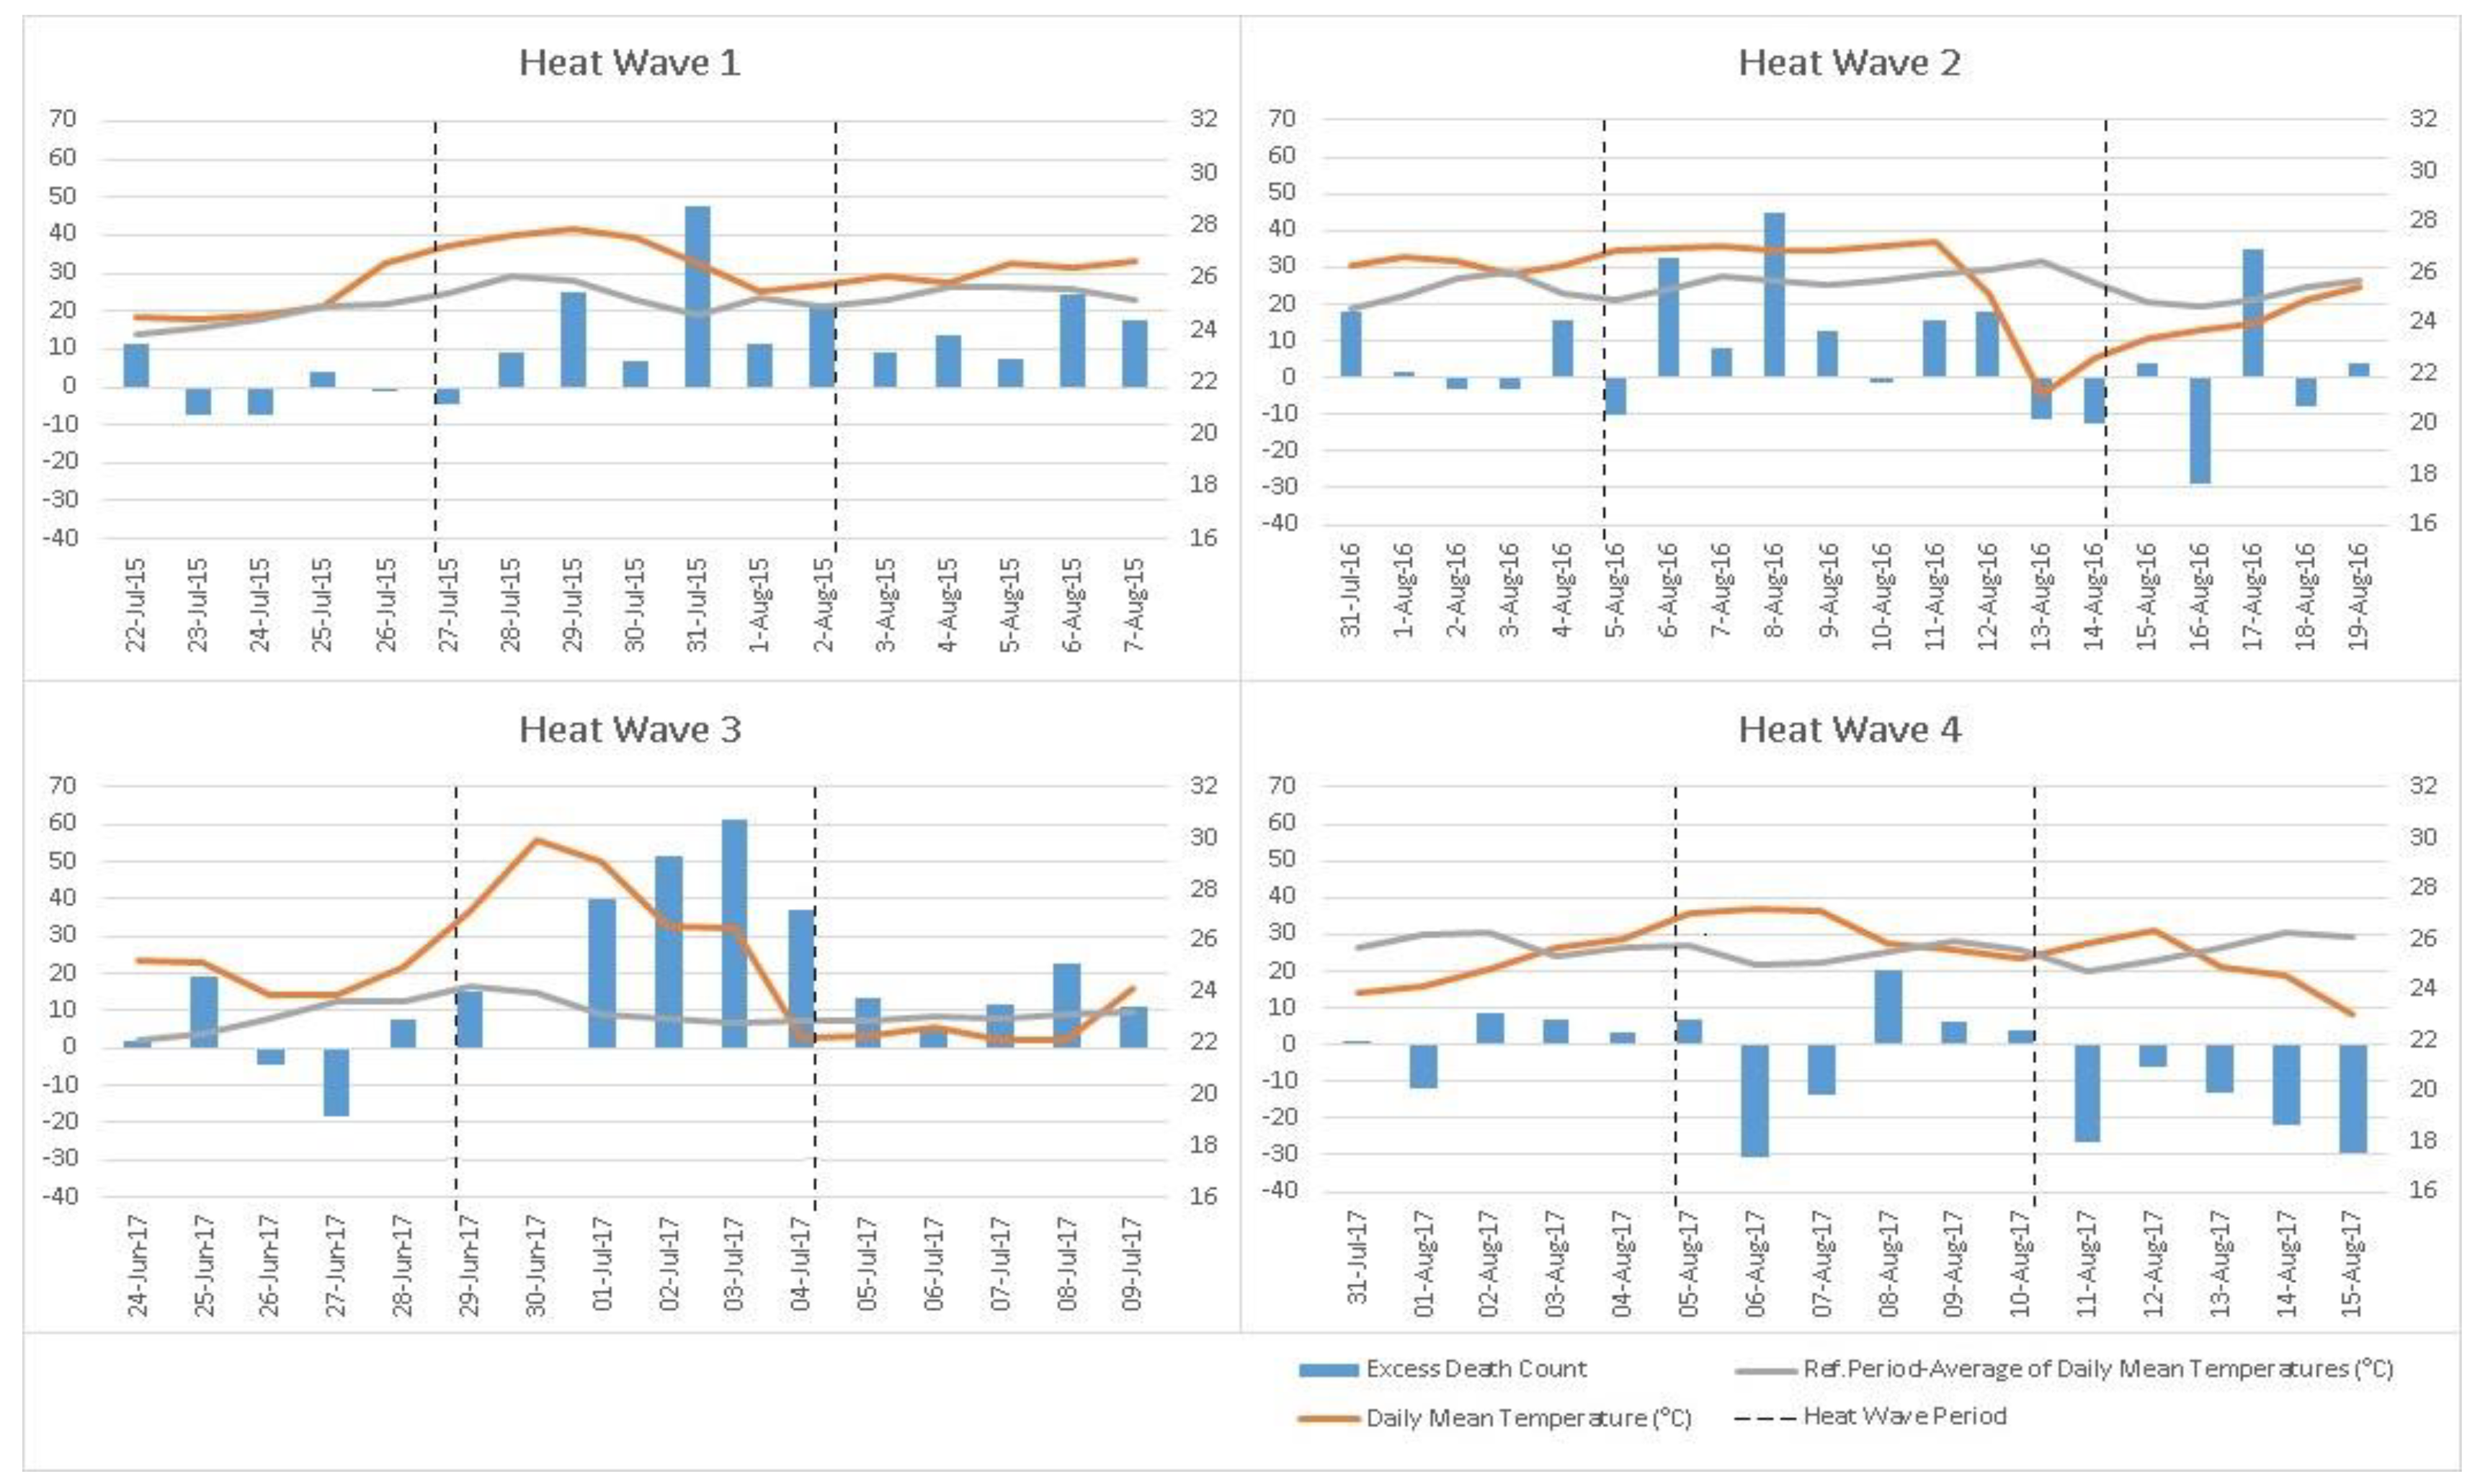
| Extreme Heat Waves | Start Date | End Date * | Number of Days * | Average of Daily Mean Temp (°C) ** | Population | Number of Deaths | Death Rates (x100k) | RR (95% CI) | p Value |
|---|---|---|---|---|---|---|---|---|---|
| Heat Wave 1 | 27 Jul 15 | 2 Aug 15 | 7 | 27.57 | 14,657,434 | 1203 | 1.17 | 1.11 (1.04–1.18) | 0.002 |
| Reference 2013 | 29 Jul 13 | 04 Aug 13 | 7 | 14,160,467 | 943 | ||||
| Reference 2014 | 28 Jul 14 | 03 Aug 14 | 7 | 14,377,018 | 1057 | ||||
| Reference 2016 | 25 Jul 16 | 31 Jul 16 | 7 | 14,804,116 | 1198 | ||||
| Reference 2017 | 24 Jul 17 | 30 Jul 17 | 7 | 15,029,231 | 1125 | ||||
| Reference Total | 28 | 25.64 | 58,370,832 | 4323 | 1.06 | ||||
| Heat Wave 2 | 5 Aug 16 | 14 Aug 16 | 10 | 26.97 | 14,804,116 | 1658 | 1.12 | 1.06 (1.00–1.12) | 0.037 |
| Reference 2013 | 02 Aug 13 | 11 Aug 13 | 10 | 14,160,467 | 1408 | ||||
| Reference 2014 | 08 Aug 14 | 17 Aug 14 | 10 | 14,377,018 | 1546 | ||||
| Reference 2015 | 07 Aug 15 | 16 Aug 15 | 10 | 14,657,434 | 1603 | ||||
| Reference Total | 30 | 25.29 | 43,194,919 | 4557 | 1.05 | ||||
| Heat Wave 3 | 29 Jun 17 | 4 Jul 17 | 6 | 28.72 | 15,029,231 | 1164 | 1.29 | 1.21 (1.14–1.30) | <0.001 |
| Reference 2013 | 27 Jun 13 | 02 Jul 13 | 6 | 14,160,467 | 839 | ||||
| Reference 2014 | 26 Jun 14 | 01 Jul 14 | 6 | 14,377,018 | 930 | ||||
| Reference 2015 | 02 Jul 15 | 07 Jul 15 | 6 | 14,657,434 | 977 | ||||
| Reference 2016 | 30 Jun 16 | 05 Jul 16 | 6 | 14,804,116 | 955 | ||||
| Reference Total | 24 | 23.78 | 57,999,035 | 3701 | 1.06 | ||||
| Heat Wave 4 | 5 Aug 17 | 10 Aug 17 | 6 | 27.09 | 15,029,231 | 926 | 1.03 | 0.99 (0.92–1.07) | 0.847 |
| Reference 2013 | 03 Aug 13 | 08 Aug 13 | 6 | 14,160,467 | 820 | ||||
| Reference 2014 | 02 Aug 14 | 07 Aug 14 | 6 | 14,377,018 | 911 | ||||
| Reference 2015 | 08 Aug 15 | 13 Aug 15 | 6 | 14,657,434 | 950 | ||||
| Reference Total | 18 | 25.27 | 43,194,919 | 2681 | 1.03 |
| Heat Wave | Men | Women | ||||||||
|---|---|---|---|---|---|---|---|---|---|---|
| Population | Number of Deaths | Death Rate (x100k) | RR (95% CI) | p Value | Population | Number of Deaths | Death Rate (x100k) | RR (95% CI) | p Value | |
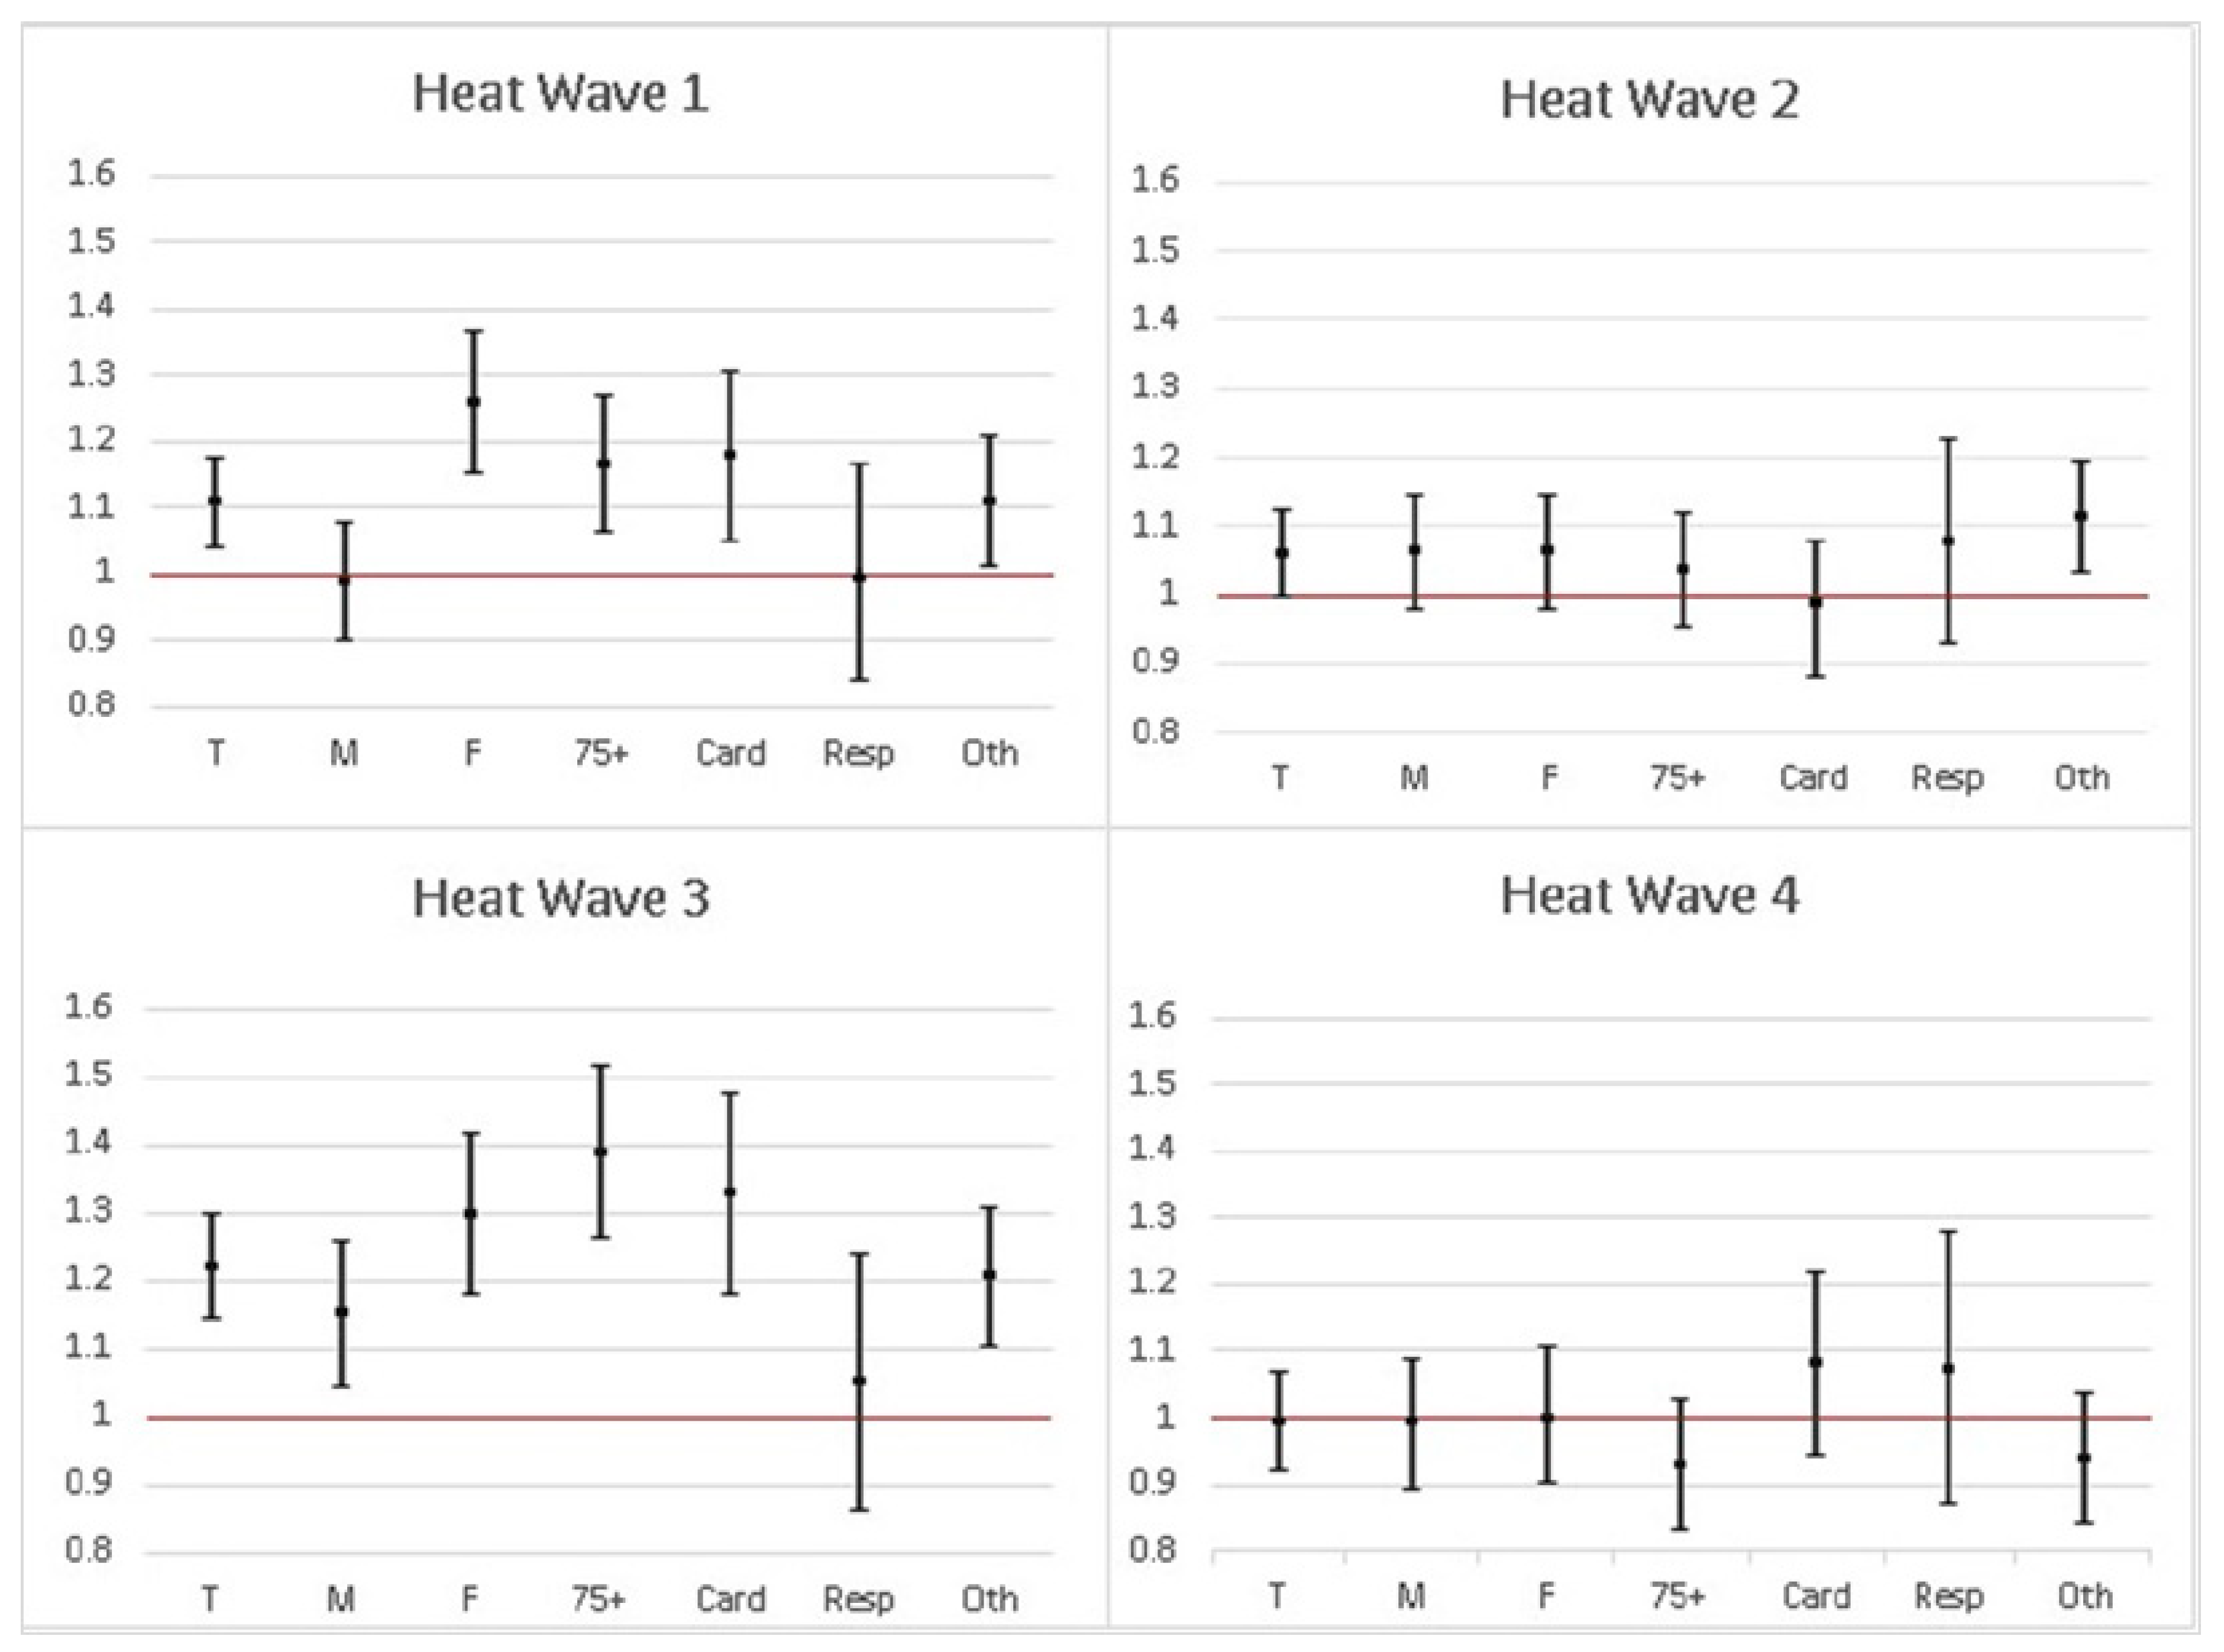
| Heat Wave 1 | 7,360,499 | 572 | 1.11 | 7,296,935 | 631 | 1.24 | ||||
| Reference Total | 29,290,760 | 2315 | 1.13 | 0.98 (0.90–1.08) | 0.718 | 29,080,072 | 2008 | 0.99 | 1.25 (1.15–1.37) | <0.001 |
| Heat Wave 2 | 7,424,390 | 863 | 1.16 | 7,379,726 | 795 | 1.08 | ||||
| Reference Total | 21,697,378 | 2374 | 1.09 | 1.06 (0.98–1.15) | 0.128 | 21,497,541 | 2183 | 1.02 | 1.06 (0.98–1.15) | 0.154 |
| Heat Wave 3 | 7,529,491 | 585 | 1.29 | 7,499,740 | 579 | 1.29 | ||||
| Reference Total | 29,121,768 | 1977 | 1.13 | 1.14 (1.04–1.26) | 0.004 | 28,877,267 | 1724 | 1.00 | 1.29 (1.18–1.42) | <0.001 |
| Heat Wave 4 | 7,529,491 | 478 | 1.06 | 7,499,740 | 448 | 1.00 | ||||
| Reference Total | 21,697,378 | 1396 | 1.07 | 0.99 (0.89–1.09) | 0.801 | 21,497,541 | 1285 | 1.00 | 1.00 (0.90–1.11) | 0.991 |
| Heat Wave | 0–14 | ≥75 | ||||||||
|---|---|---|---|---|---|---|---|---|---|---|
| Population | Number of Deaths | Death Rate (x100k) | RR (95% CI) | p Value | Population | Number of Deaths | Death Rate (x100k) | RR (95% CI) | p Value | |
| Heat Wave 1 | 3,302,582 | 69 | 0.30 | 1.05 (0.80–1.36) | 0.740 | 337,192 | 600 | 25.42 | 1.16 (1.06–1.27) | 0.002 |
| Reference Total | 13,165,698 | 263 | 0.29 | 1,345,706 | 2067 | 21.94 | ||||
| Heat Wave 2 | 3,301,723 | 98 | 0.30 | 1.08 (0.86–1.36) | 0.524 | 345,017 | 787 | 22.81 | 1.03 (0.95–1.12) | 0.507 |
| Reference Total | 9,842,118 | 271 | 0.28 | 975,254 | 2164 | 22.19 | ||||
| Heat Wave 3 | 3,324,439 | 49 | 0.25 | 0.75 (0.55–1.01) | 0.059 | 362,627 | 647 | 29.74 | 1.38 (1.26–1.52) | <0.001 |
| Reference Total | 13,143,841 | 260 | 0.33 | 1,320,271 | 1702 | 21.49 | ||||
| Heat Wave 4 | 3,324,439 | 52 | 0.26 | 0.91 (0.67–1.24) | 0.556 | 362,627 | 443 | 20.36 | 0.93 (0.83–1.03) | 0.179 |
| Reference Total | 9,842,118 | 169 | 0.29 | 975,254 | 1283 | 21.93 | ||||
| Heat Wave | Cardiovascular | Respiratory | Others | |||||||||
|---|---|---|---|---|---|---|---|---|---|---|---|---|
| Number of Deaths | Death Rate (x100k) | RR (95% CI) | p Value | Number of Deaths | Death Rate (x100k) | RR (95% CI) | p Value | Number of Deaths | Death Rate (x100k) | RR (95% CI) | p Value | |
| Heat Wave 1 | 400 | 0.39 | 1.17 (1.05–1.31) | 0.005 | 172 | 0.17 | 0.99 (0.84–1.17) | 0.918 | 631 | 0.61 | 1.11 (1.01–1.21) | 0.025 |
| Reference Total | 1360 | 0.33 | 691 | 0.17 | 2272 | 0.56 | ||||||
| Heat Wave 2 | 492 | 0.33 | 0.98 (0.88–1.08) | 0.649 | 265 | 0.18 | 1.07 (0.93–1.23) | 0.350 | 901 | 0.61 | 1.11 (1.03–1.20) | 0.007 |
| Reference Total | 1470 | 0.34 | 723 | 0.17 | 2364 | 0.55 | ||||||
| Heat Wave 3 | 406 | 0.45 | 1.32 (1.18–1.48) | <0.001 | 145 | 0.16 | 1.03 (0.86–1.24) | 0.718 | 613 | 0.68 | 1.20 (1.10–1.31) | <0.001 |
| Reference Total | 1188 | 0.34 | 541 | 0.16 | 1972 | 0.57 | ||||||
| Heat Wave 4 | 305 | 0.34 | 1.07 (0.94–1.22) | 0.320 | 155 | 0.17 | 1.04 (0.87–1.25) | 0.669 | 466 | 0.52 | 0.93 (0.84–1.04) | 0.205 |
| Reference Total | 820 | 0.32 | 428 | 0.17 | 1433 | 0.55 | ||||||
© 2019 by the authors. Licensee MDPI, Basel, Switzerland. This article is an open access article distributed under the terms and conditions of the Creative Commons Attribution (CC BY) license (http://creativecommons.org/licenses/by/4.0/).
Share and Cite
Can, G.; Şahin, Ü.; Sayılı, U.; Dubé, M.; Kara, B.; Acar, H.C.; İnan, B.; Aksu Sayman, Ö.; Lebel, G.; Bustinza, R.; et al. Excess Mortality in Istanbul during Extreme Heat Waves between 2013 and 2017. Int. J. Environ. Res. Public Health 2019, 16, 4348. https://doi.org/10.3390/ijerph16224348
Can G, Şahin Ü, Sayılı U, Dubé M, Kara B, Acar HC, İnan B, Aksu Sayman Ö, Lebel G, Bustinza R, et al. Excess Mortality in Istanbul during Extreme Heat Waves between 2013 and 2017. International Journal of Environmental Research and Public Health. 2019; 16(22):4348. https://doi.org/10.3390/ijerph16224348
Chicago/Turabian StyleCan, Günay, Ümit Şahin, Uğurcan Sayılı, Marjolaine Dubé, Beril Kara, Hazal Cansu Acar, Barış İnan, Özden Aksu Sayman, Germain Lebel, Ray Bustinza, and et al. 2019. "Excess Mortality in Istanbul during Extreme Heat Waves between 2013 and 2017" International Journal of Environmental Research and Public Health 16, no. 22: 4348. https://doi.org/10.3390/ijerph16224348