Identifying Homogeneous Patterns of Injury in Paediatric Trauma Patients to Improve Risk-Adjusted Models of Mortality and Functional Outcomes


Abstract
:1. Introduction
2. Materials and Methods
2.1. Sample
2.2. Measures
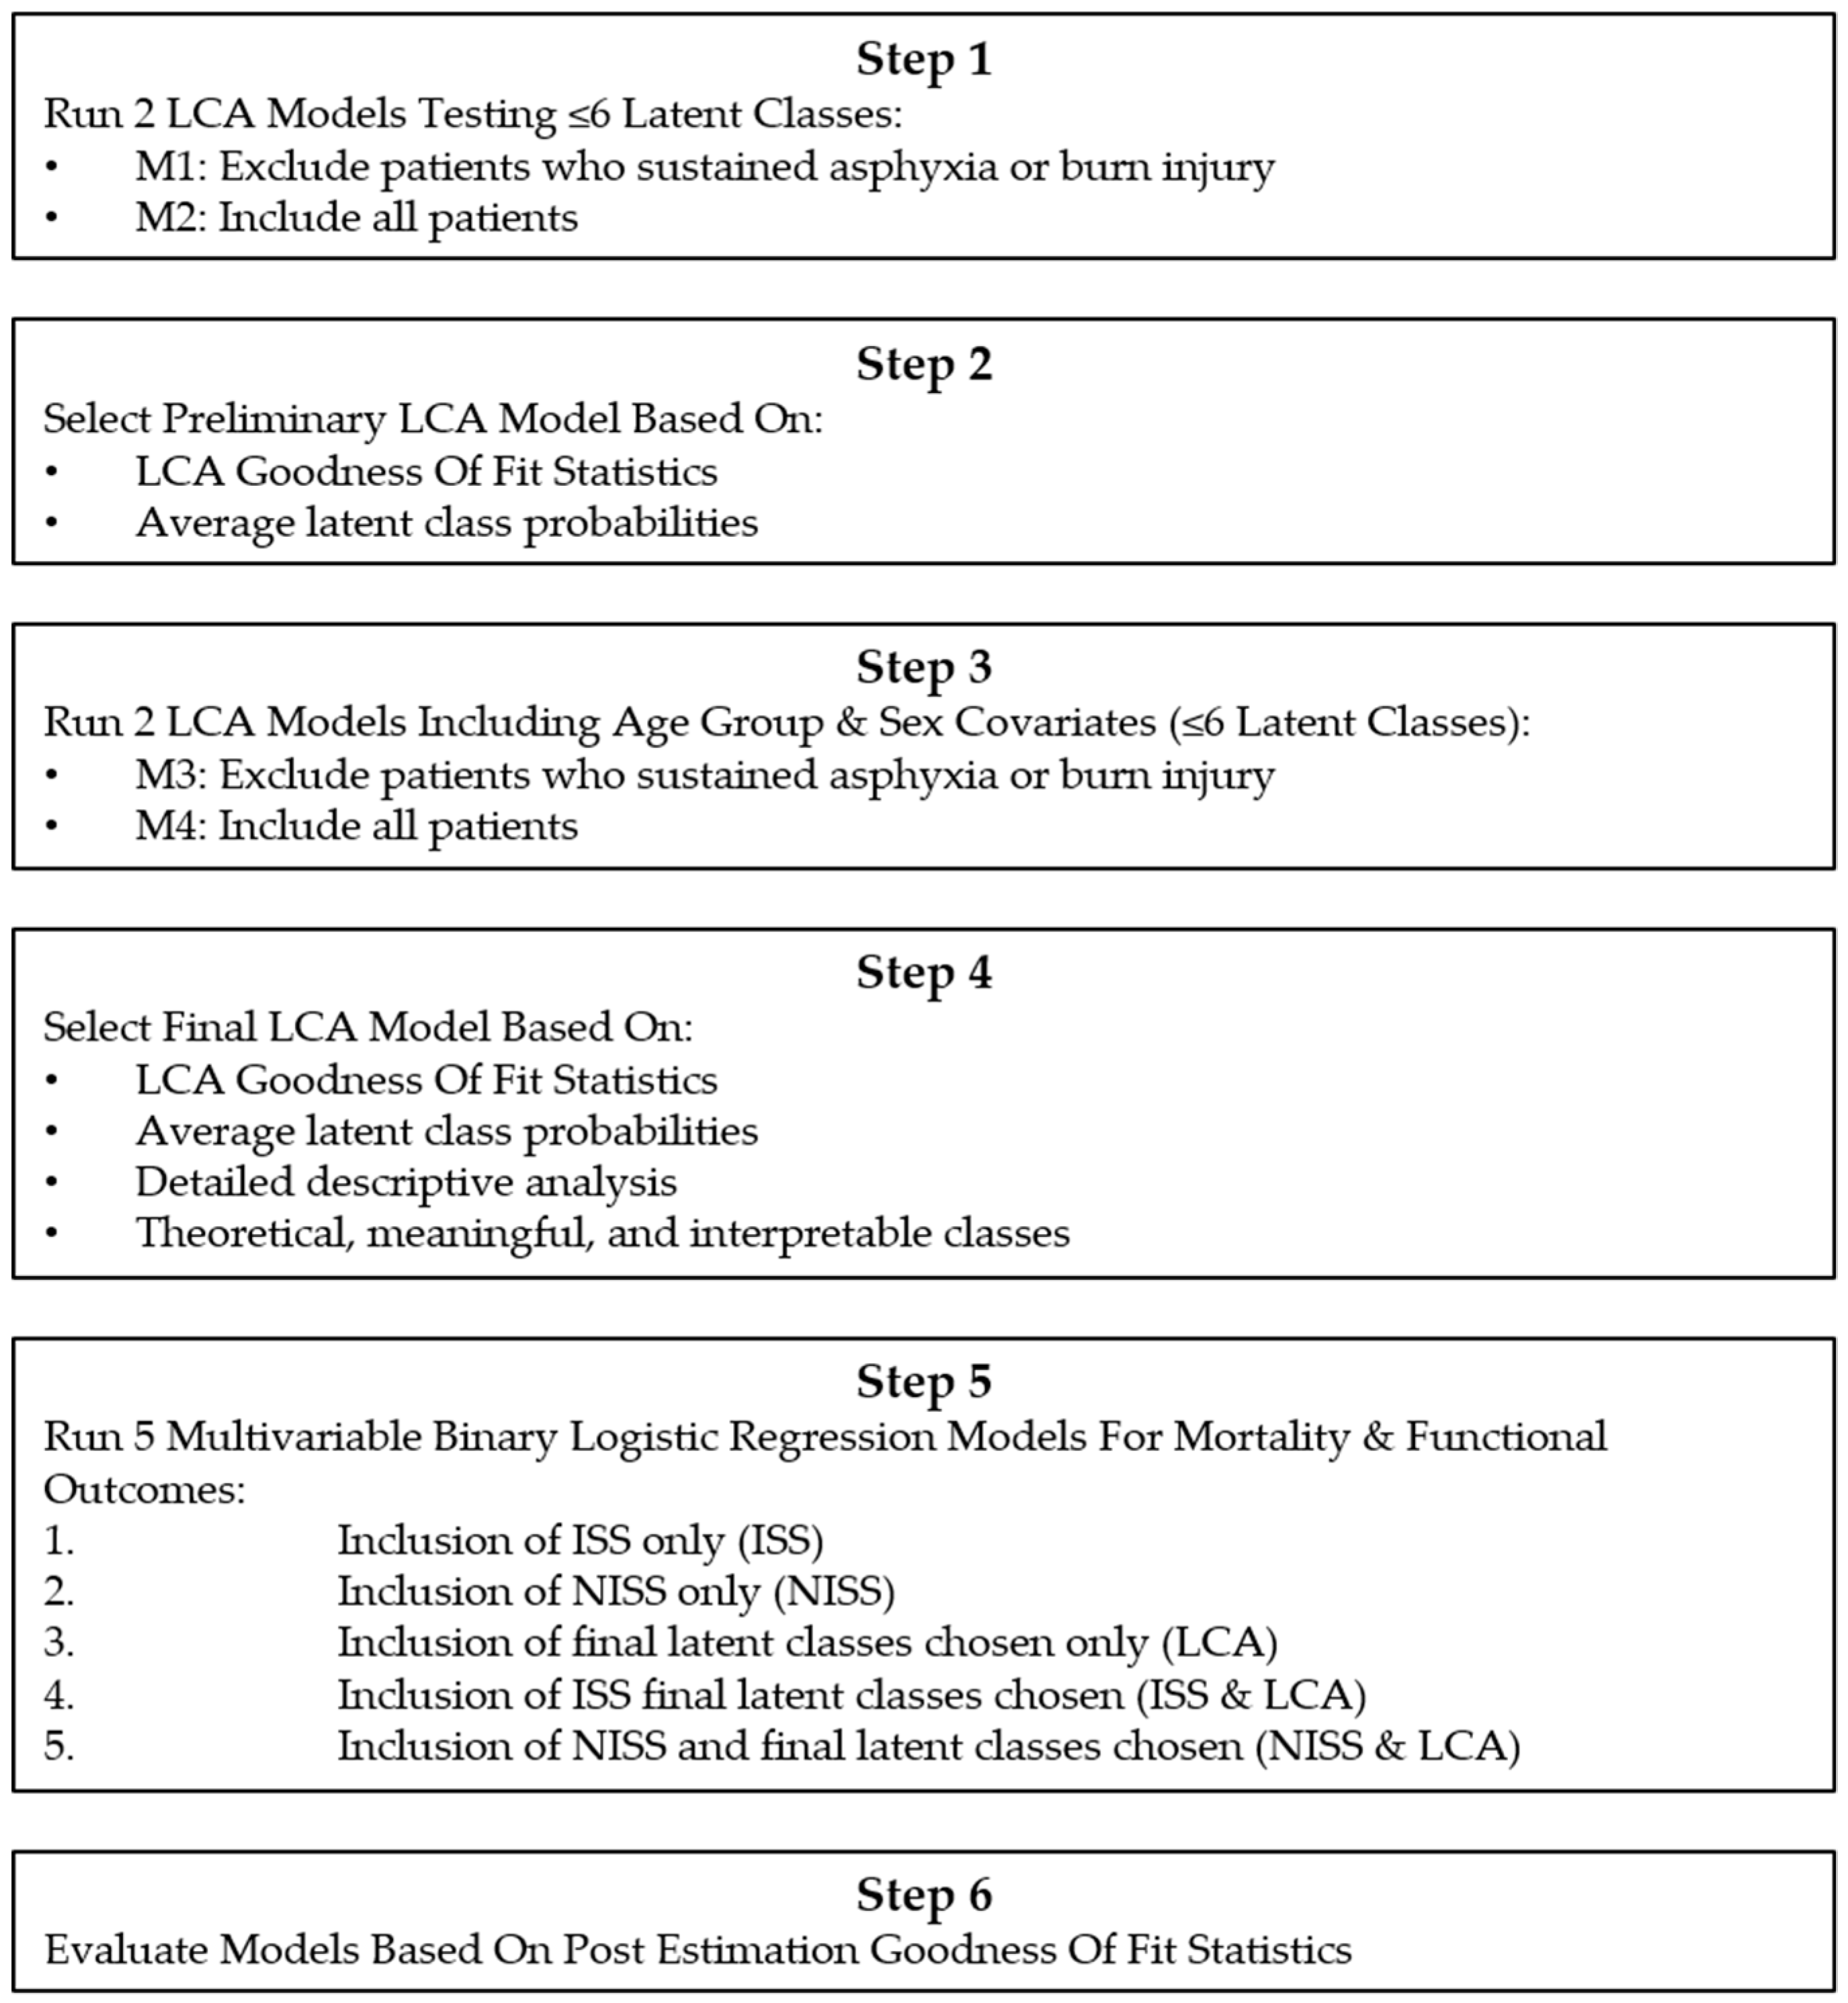
2.3. Analyses
- Inclusion of ISS only (ISS)
- Inclusion of NISS only (NISS)
- Inclusion of final latent classes chosen only (LCA)
- Inclusion of ISS final latent classes chosen (ISS and LCA)
- Inclusion of NISS and final latent classes chosen (NISS and LCA)
- A BIC where the smaller the better model.
- A Hosmer–Lemeshow goodness-of-fit test using 10 quantiles where a p-value > 0.05 indicates a good model fit.
- Percentage sensitivity, specificity and overall percentage correctly classified where the higher the better.
- McFadden, Adjusted McFadden, McKelvey and Zavoina, Cox Snell, Nagelkerke R-square values where the higher the better.
- Receiver Operator Curve area (AUC) where the closer to 1 the better.
- Specification link test for single-equation models where a p-value > 0.05 indicates model correctly specified.
3. Results
3.1. Sample Characteristics
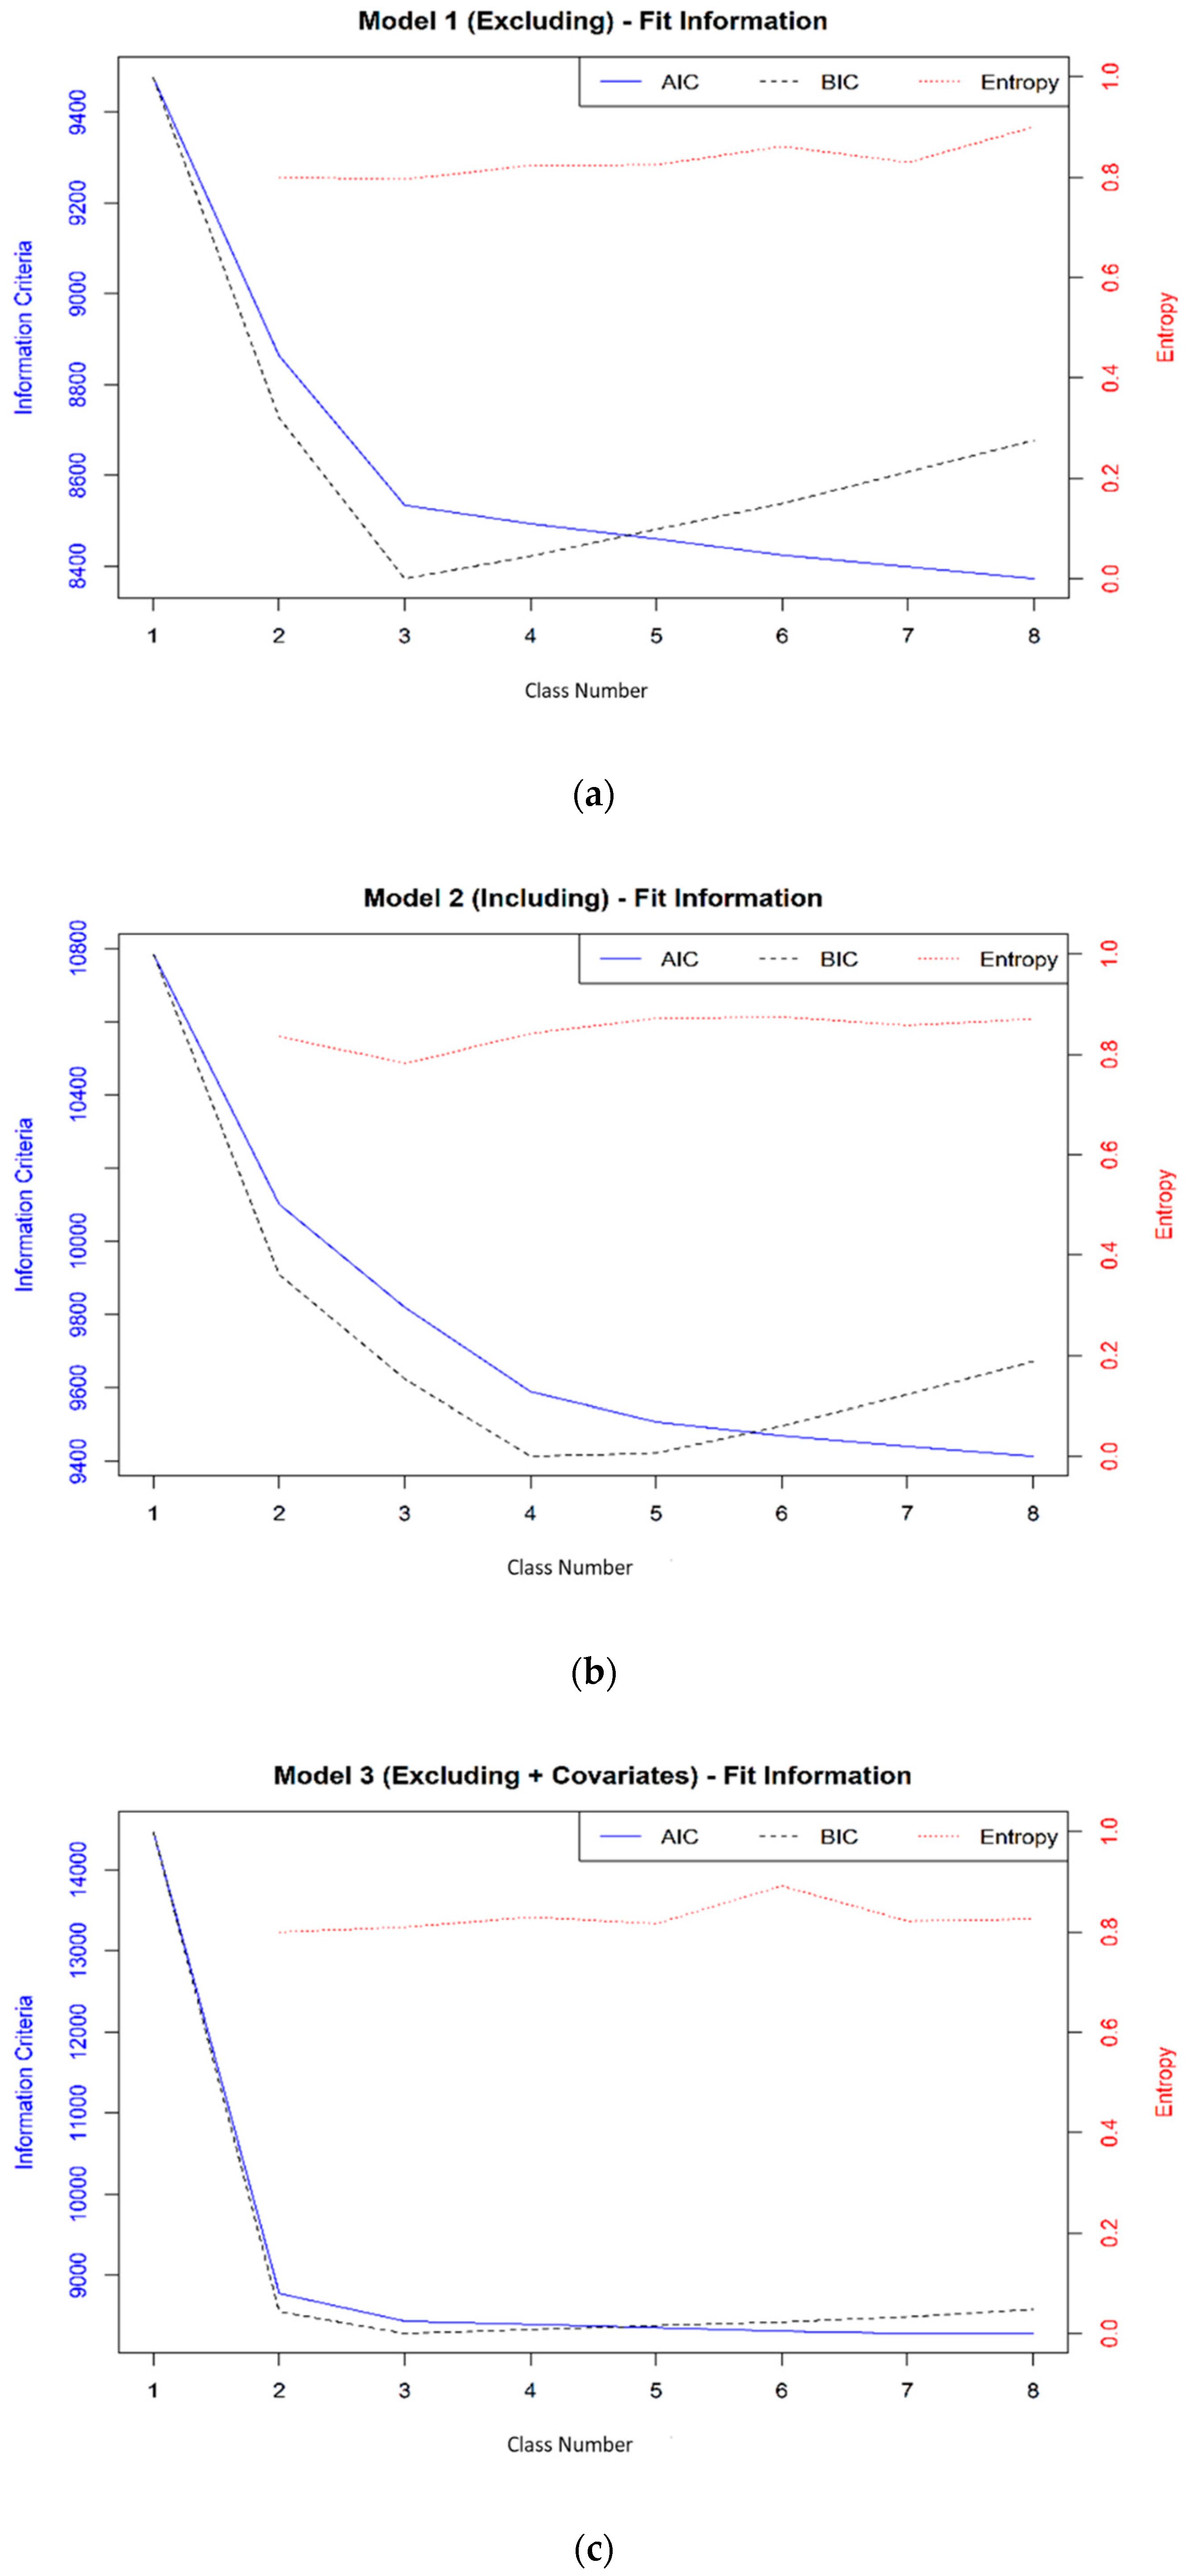
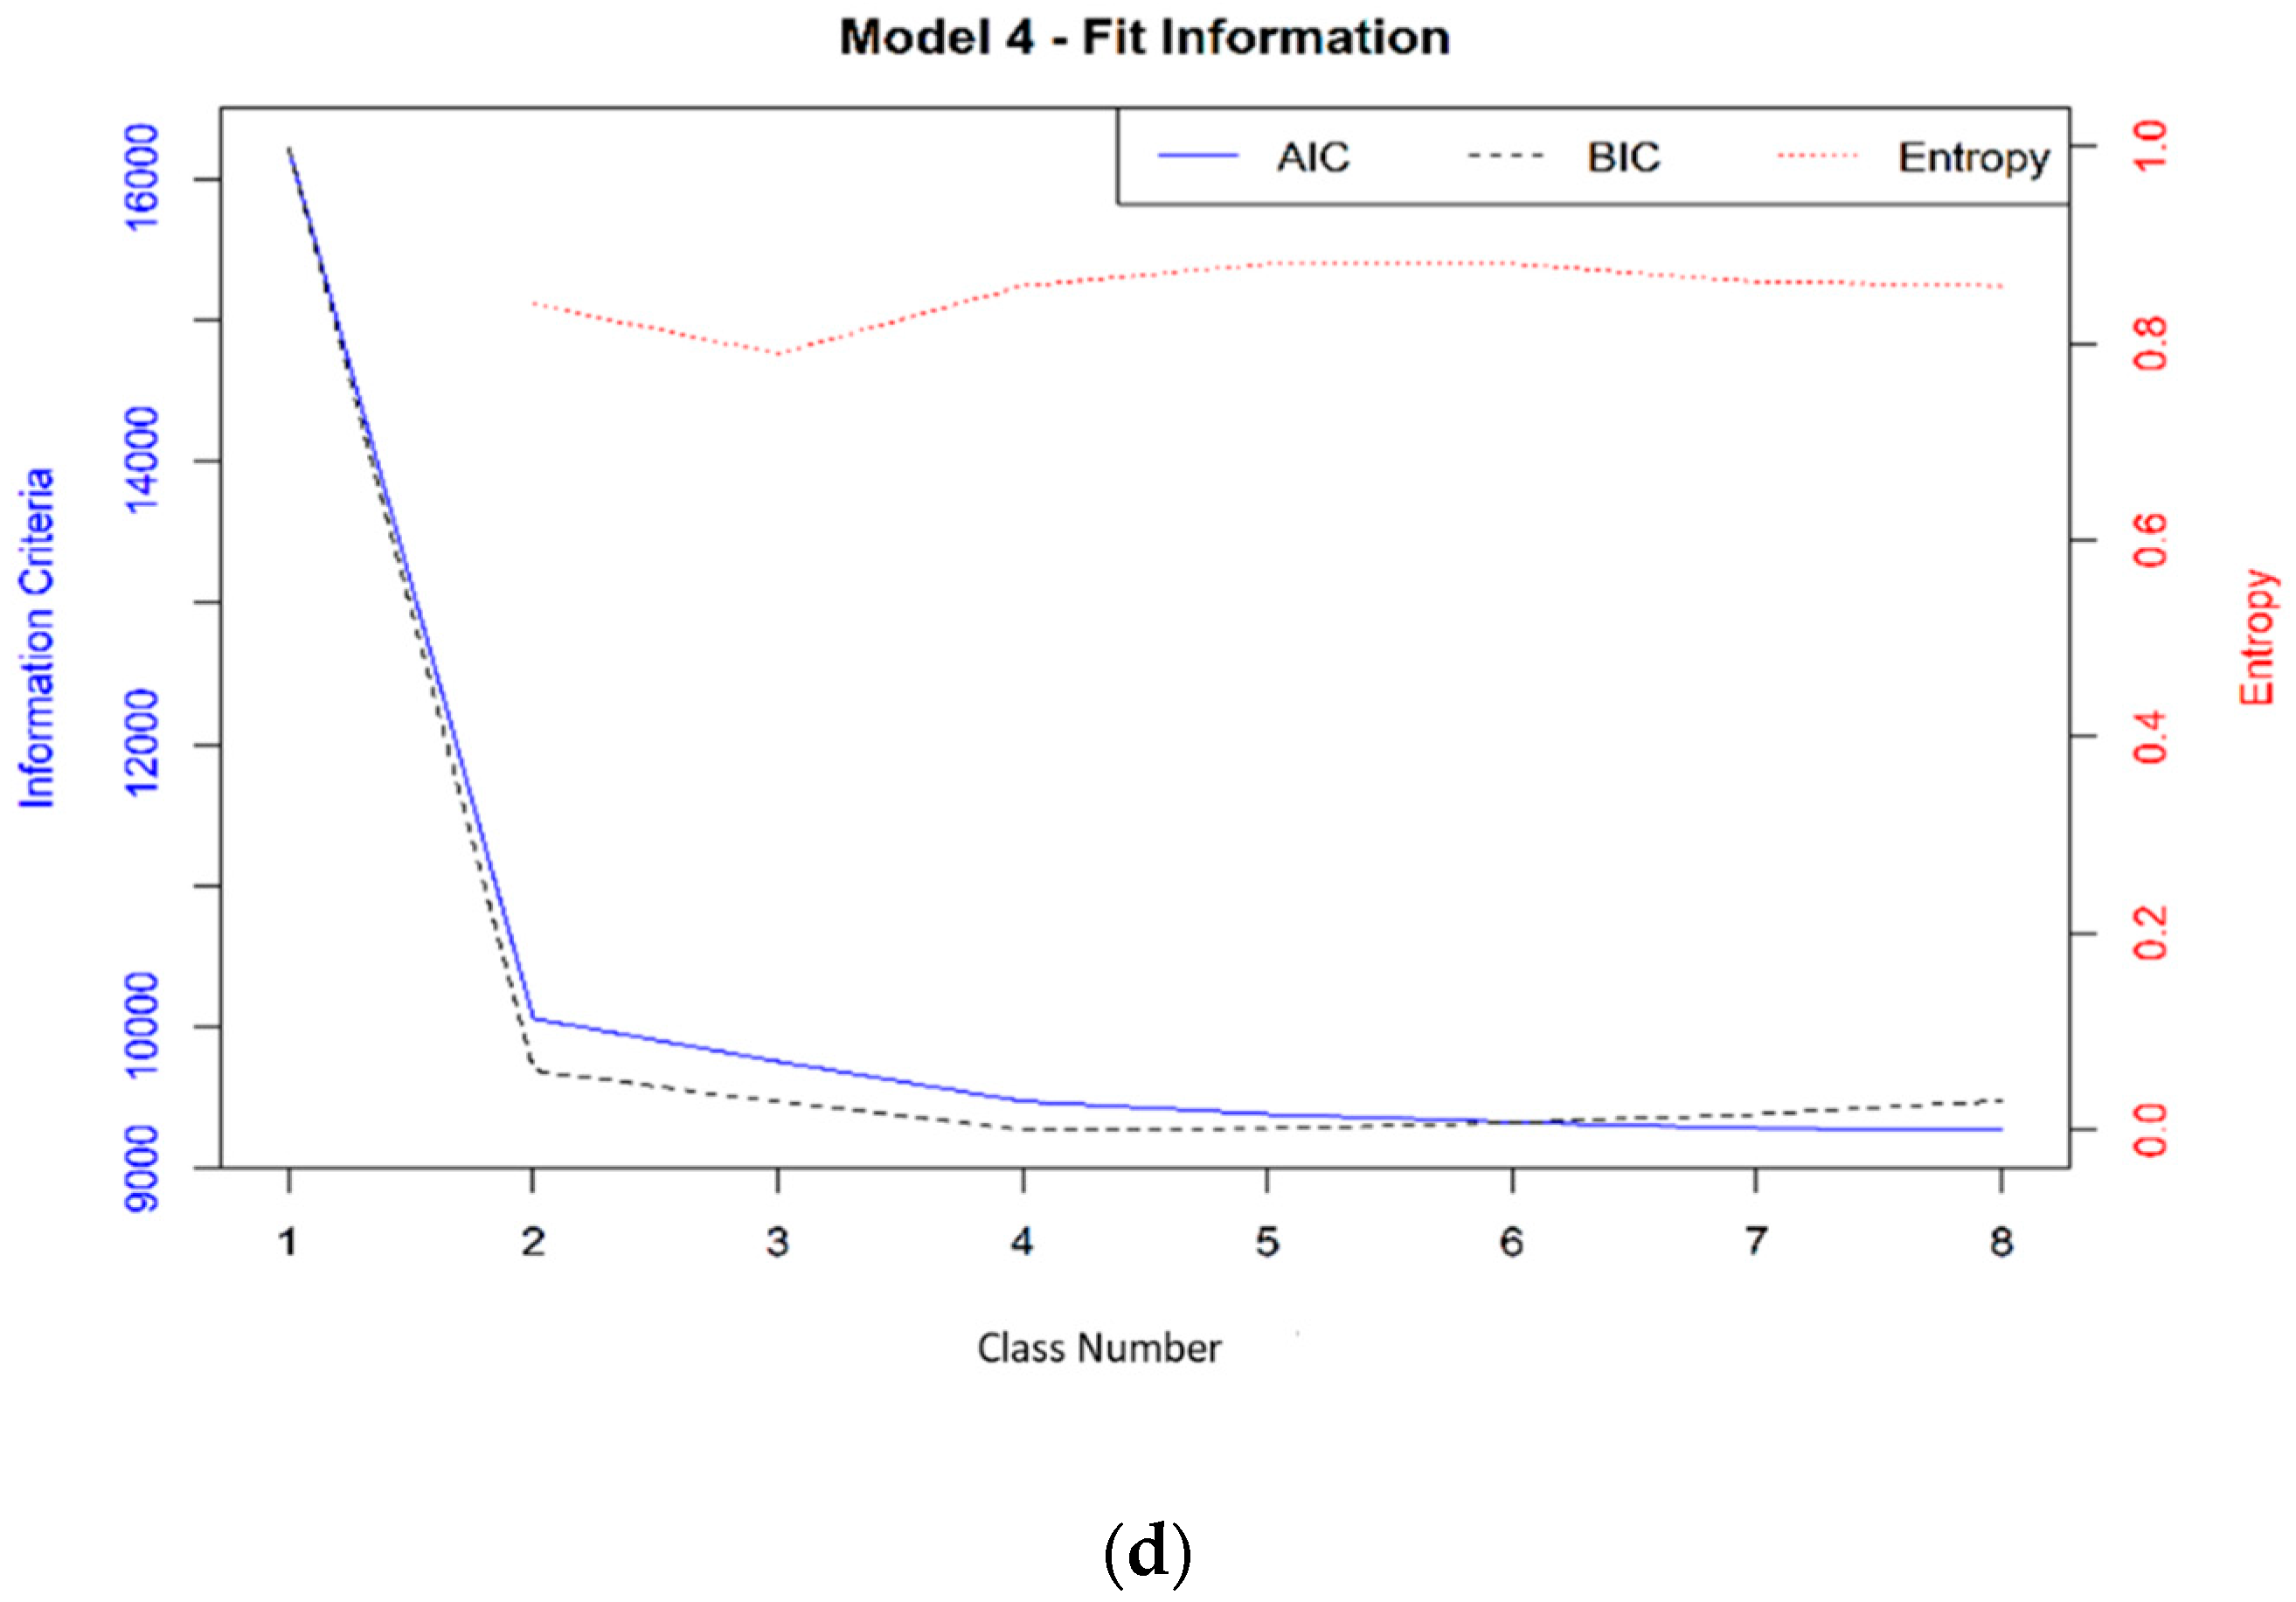
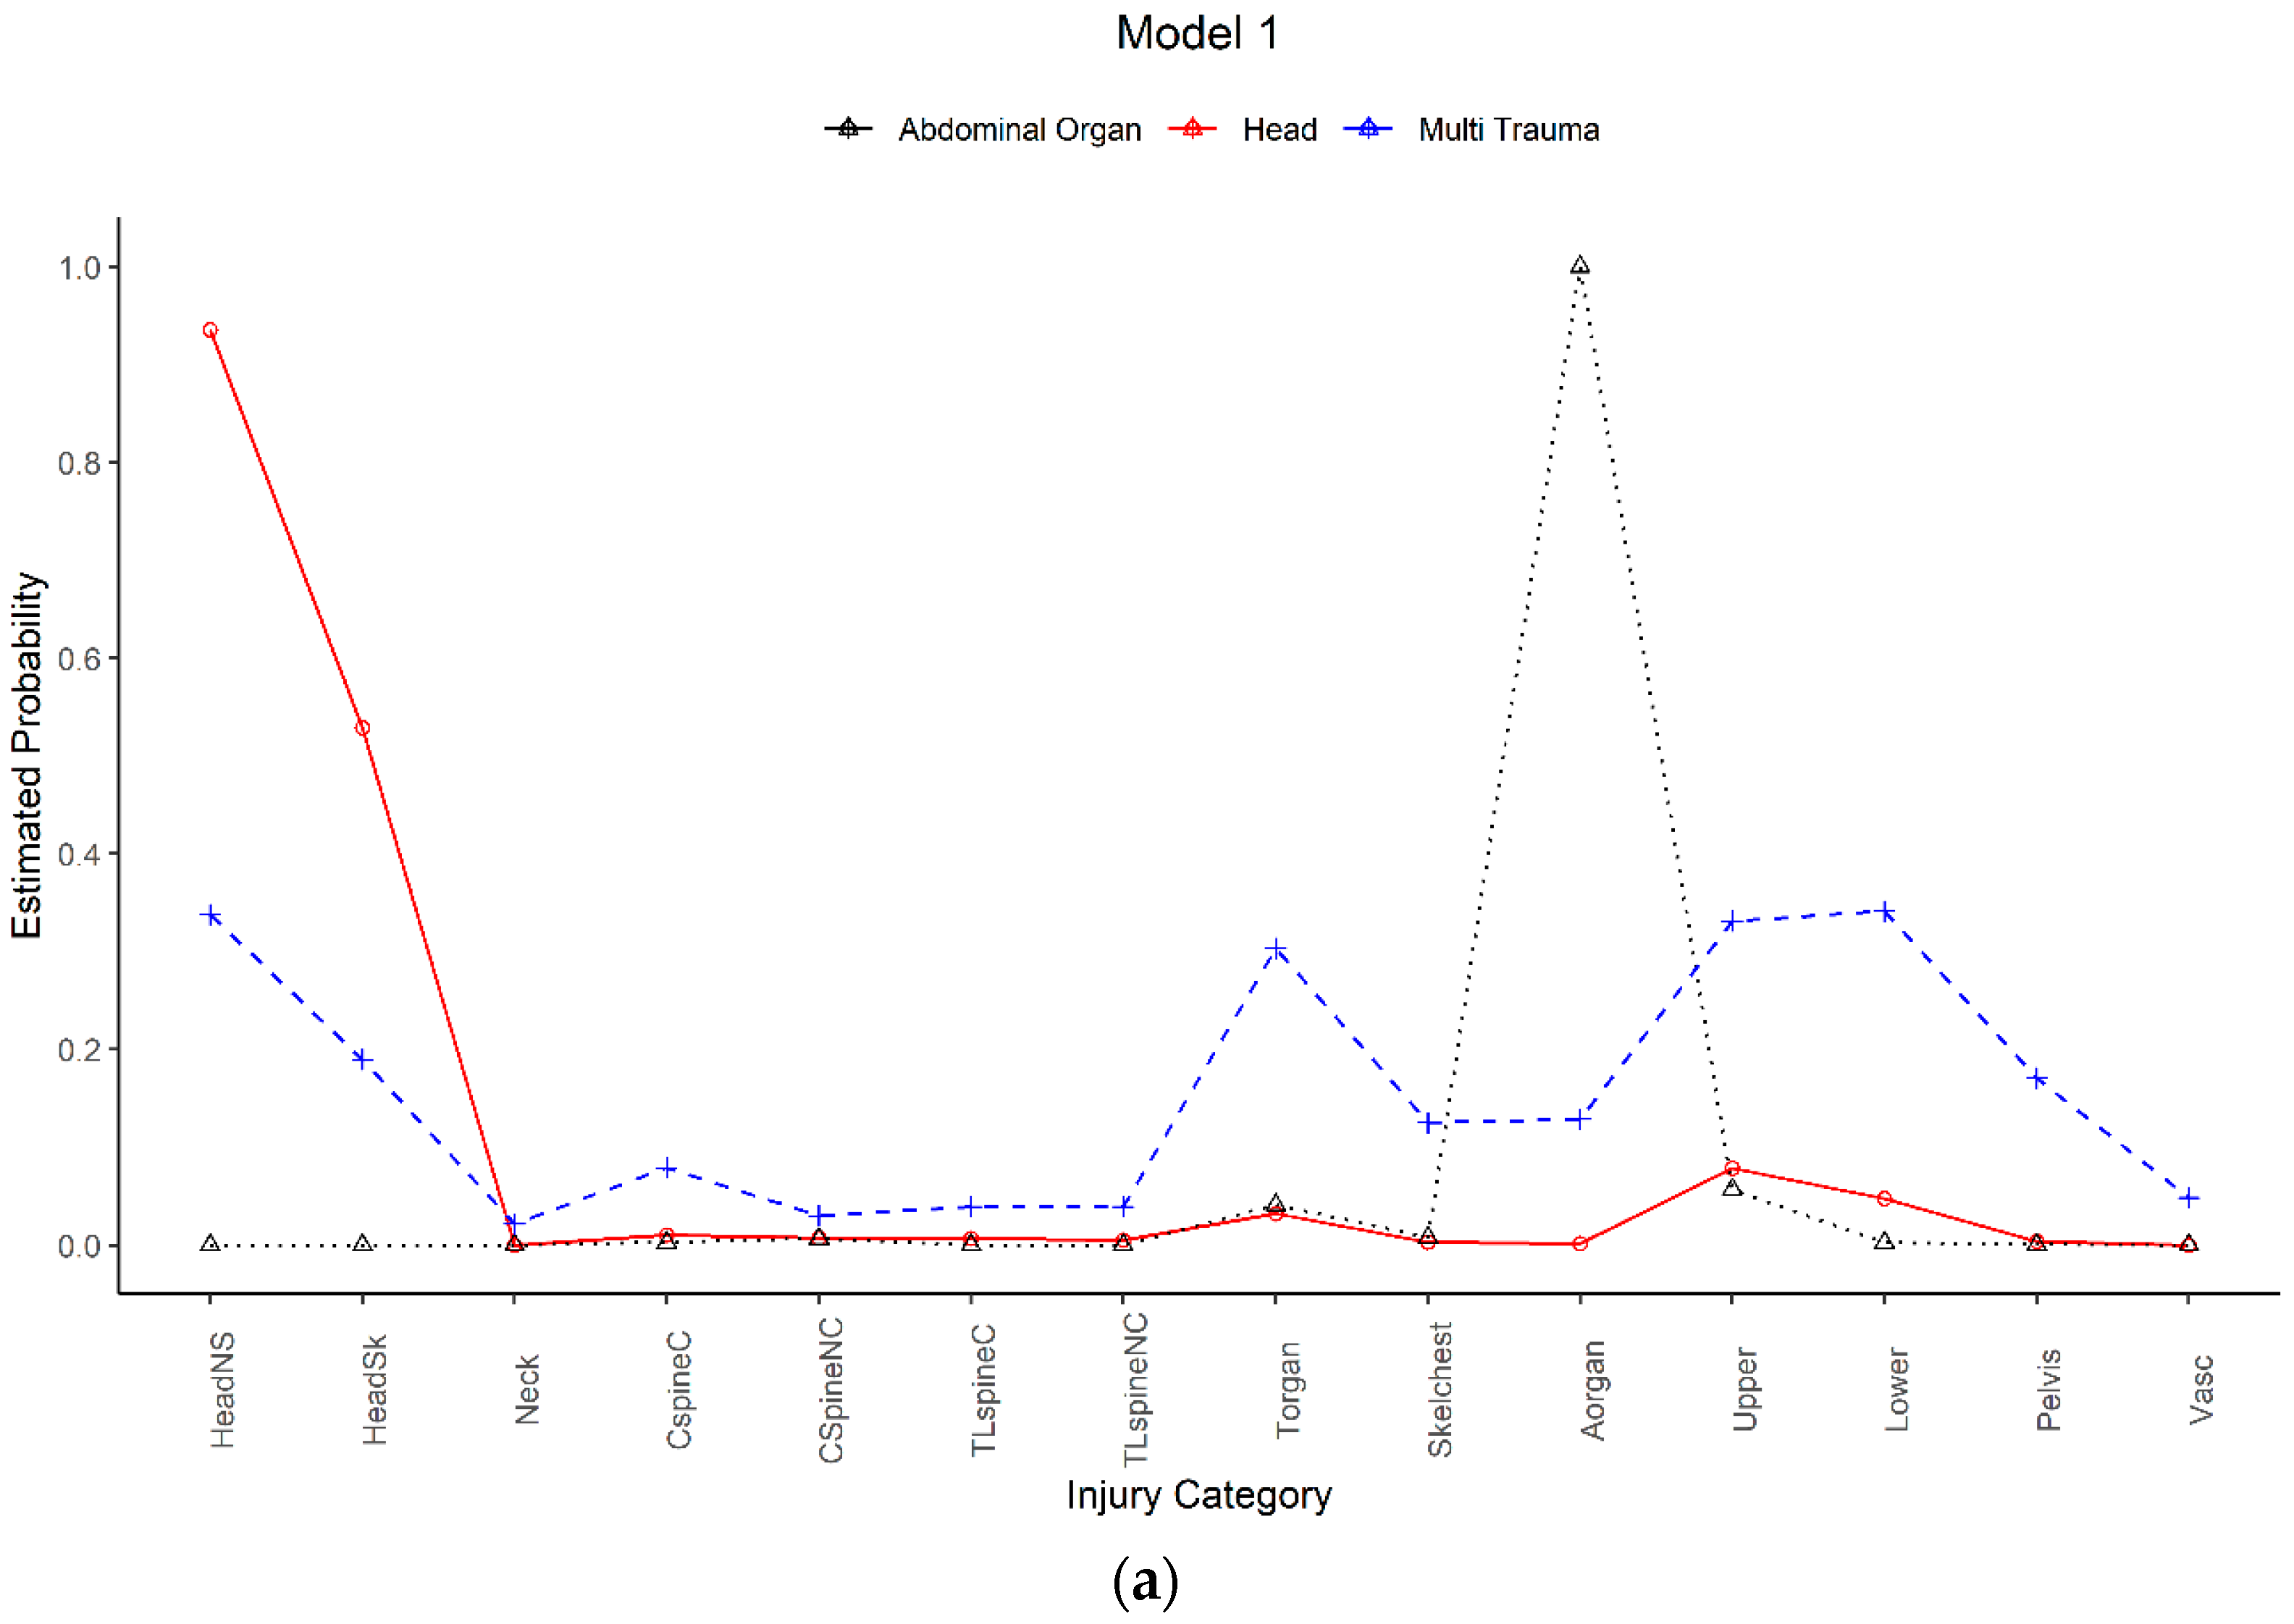
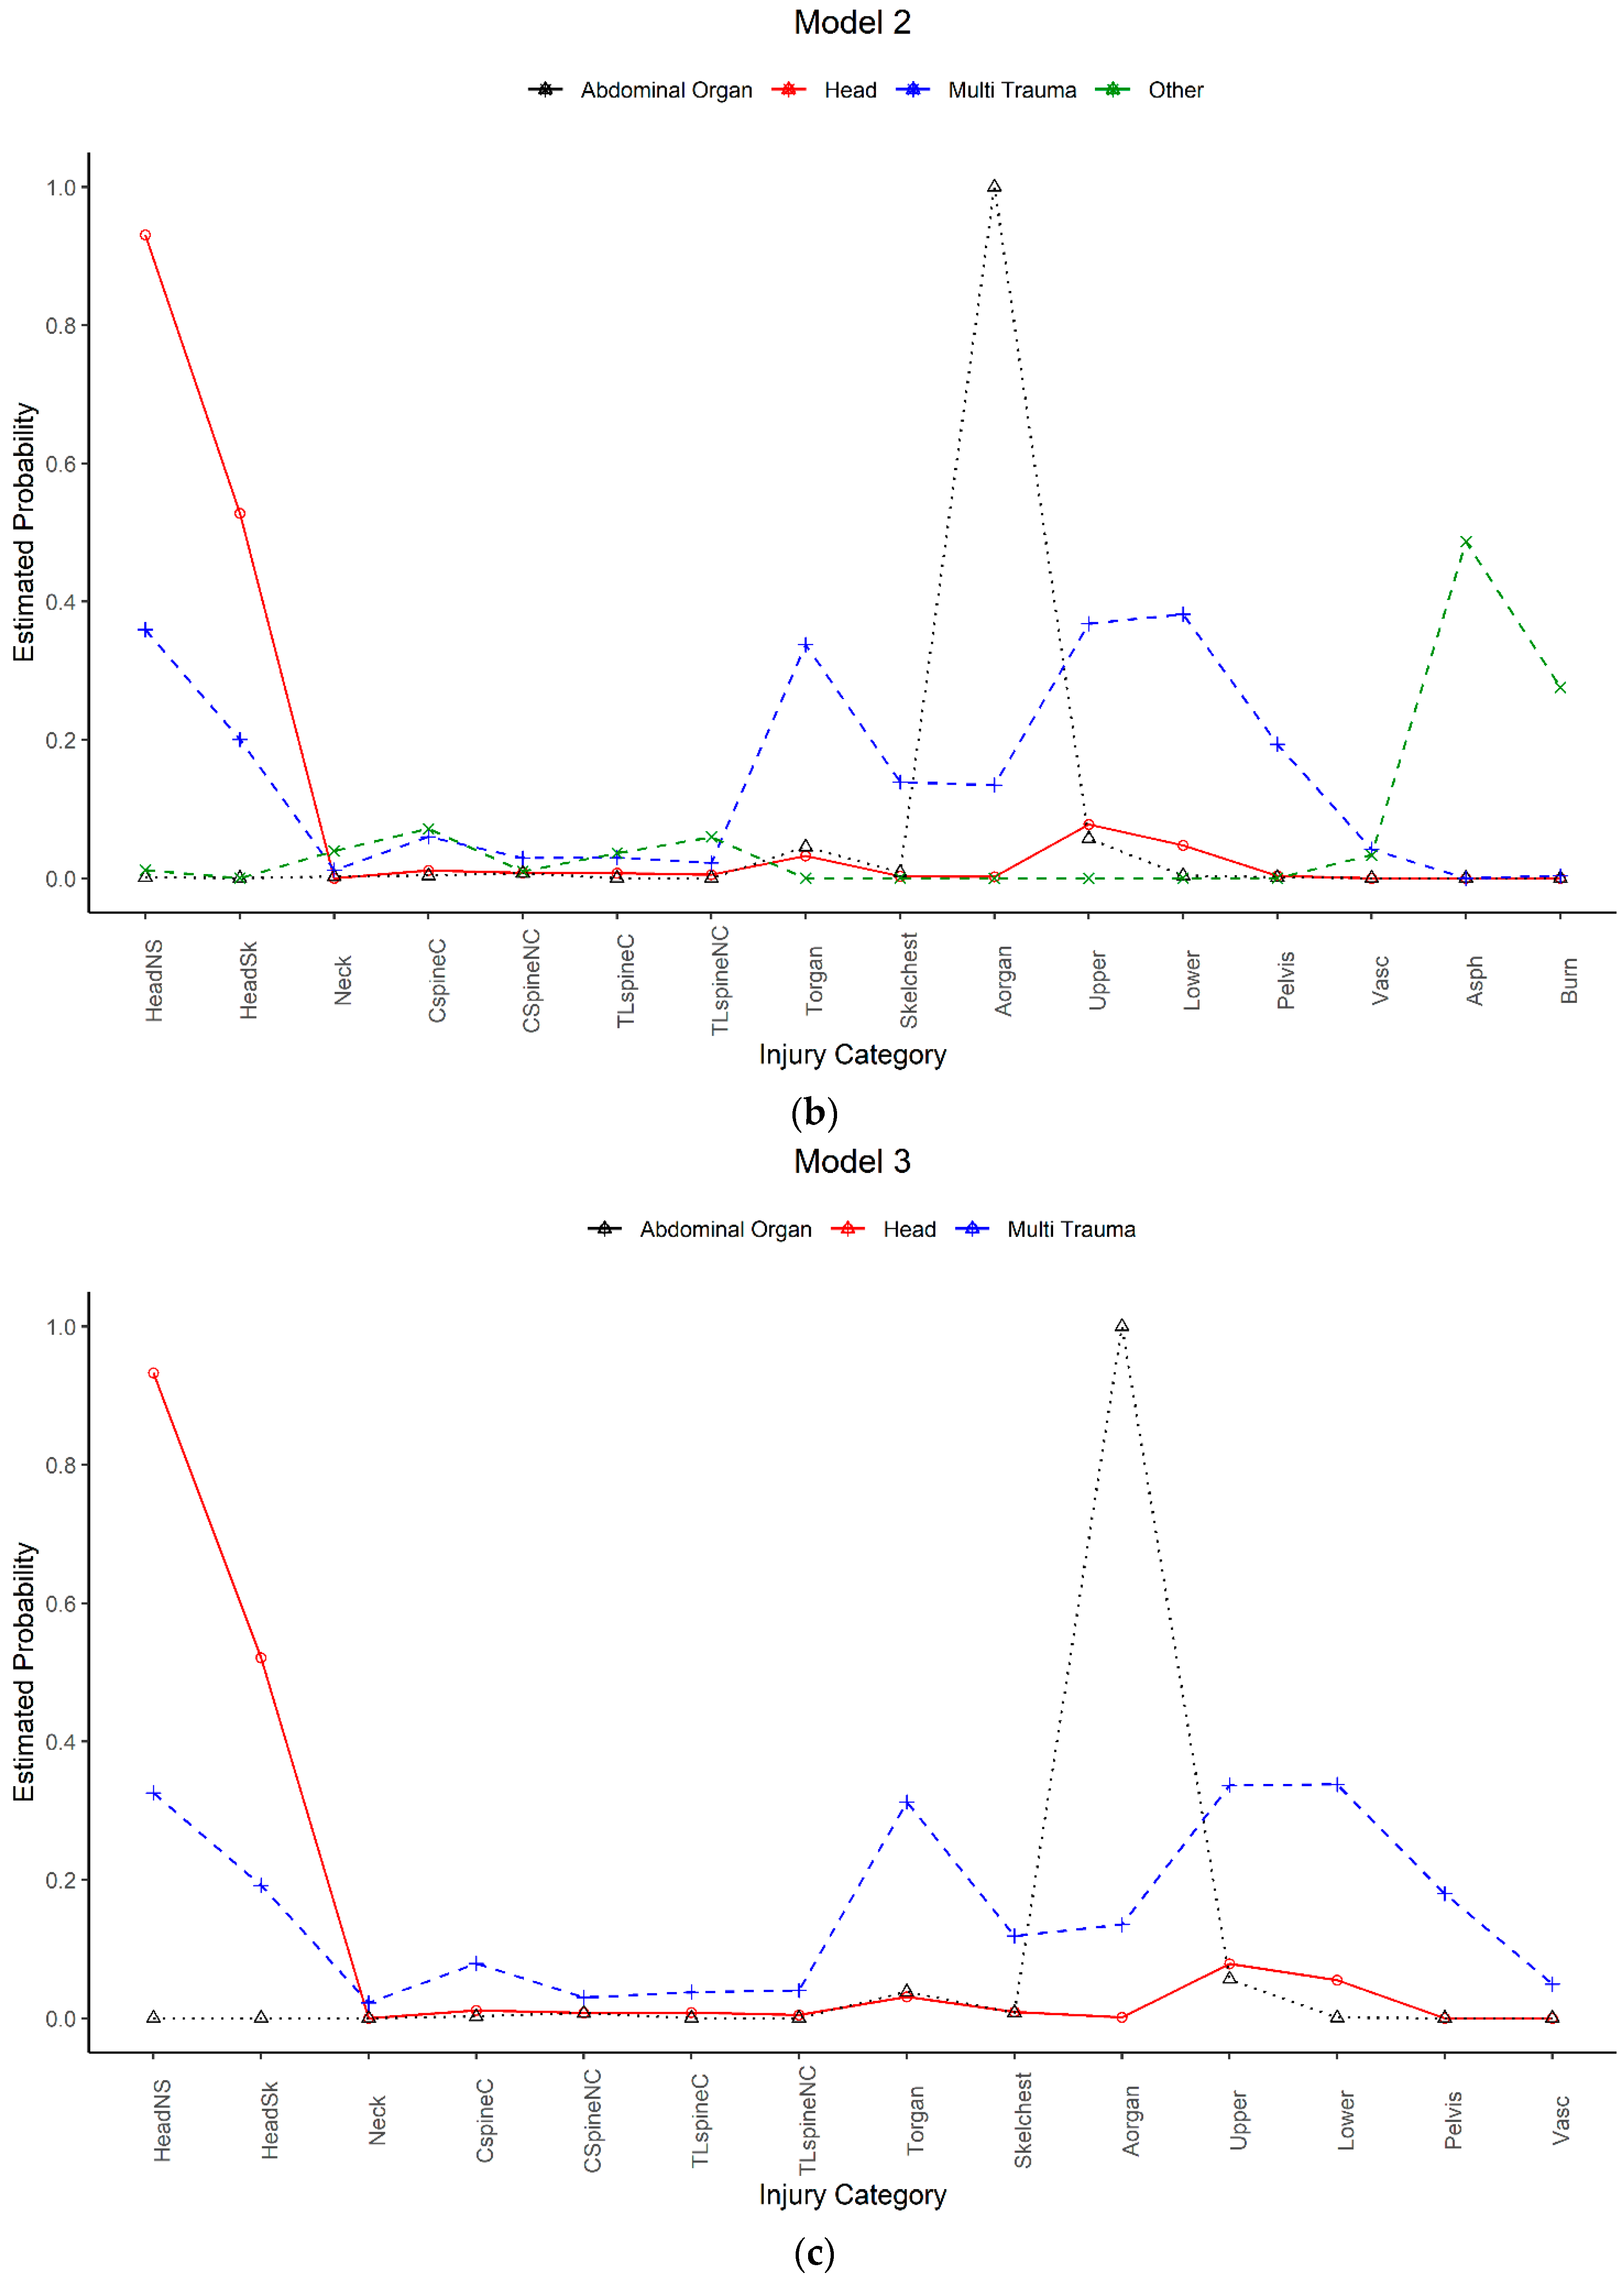
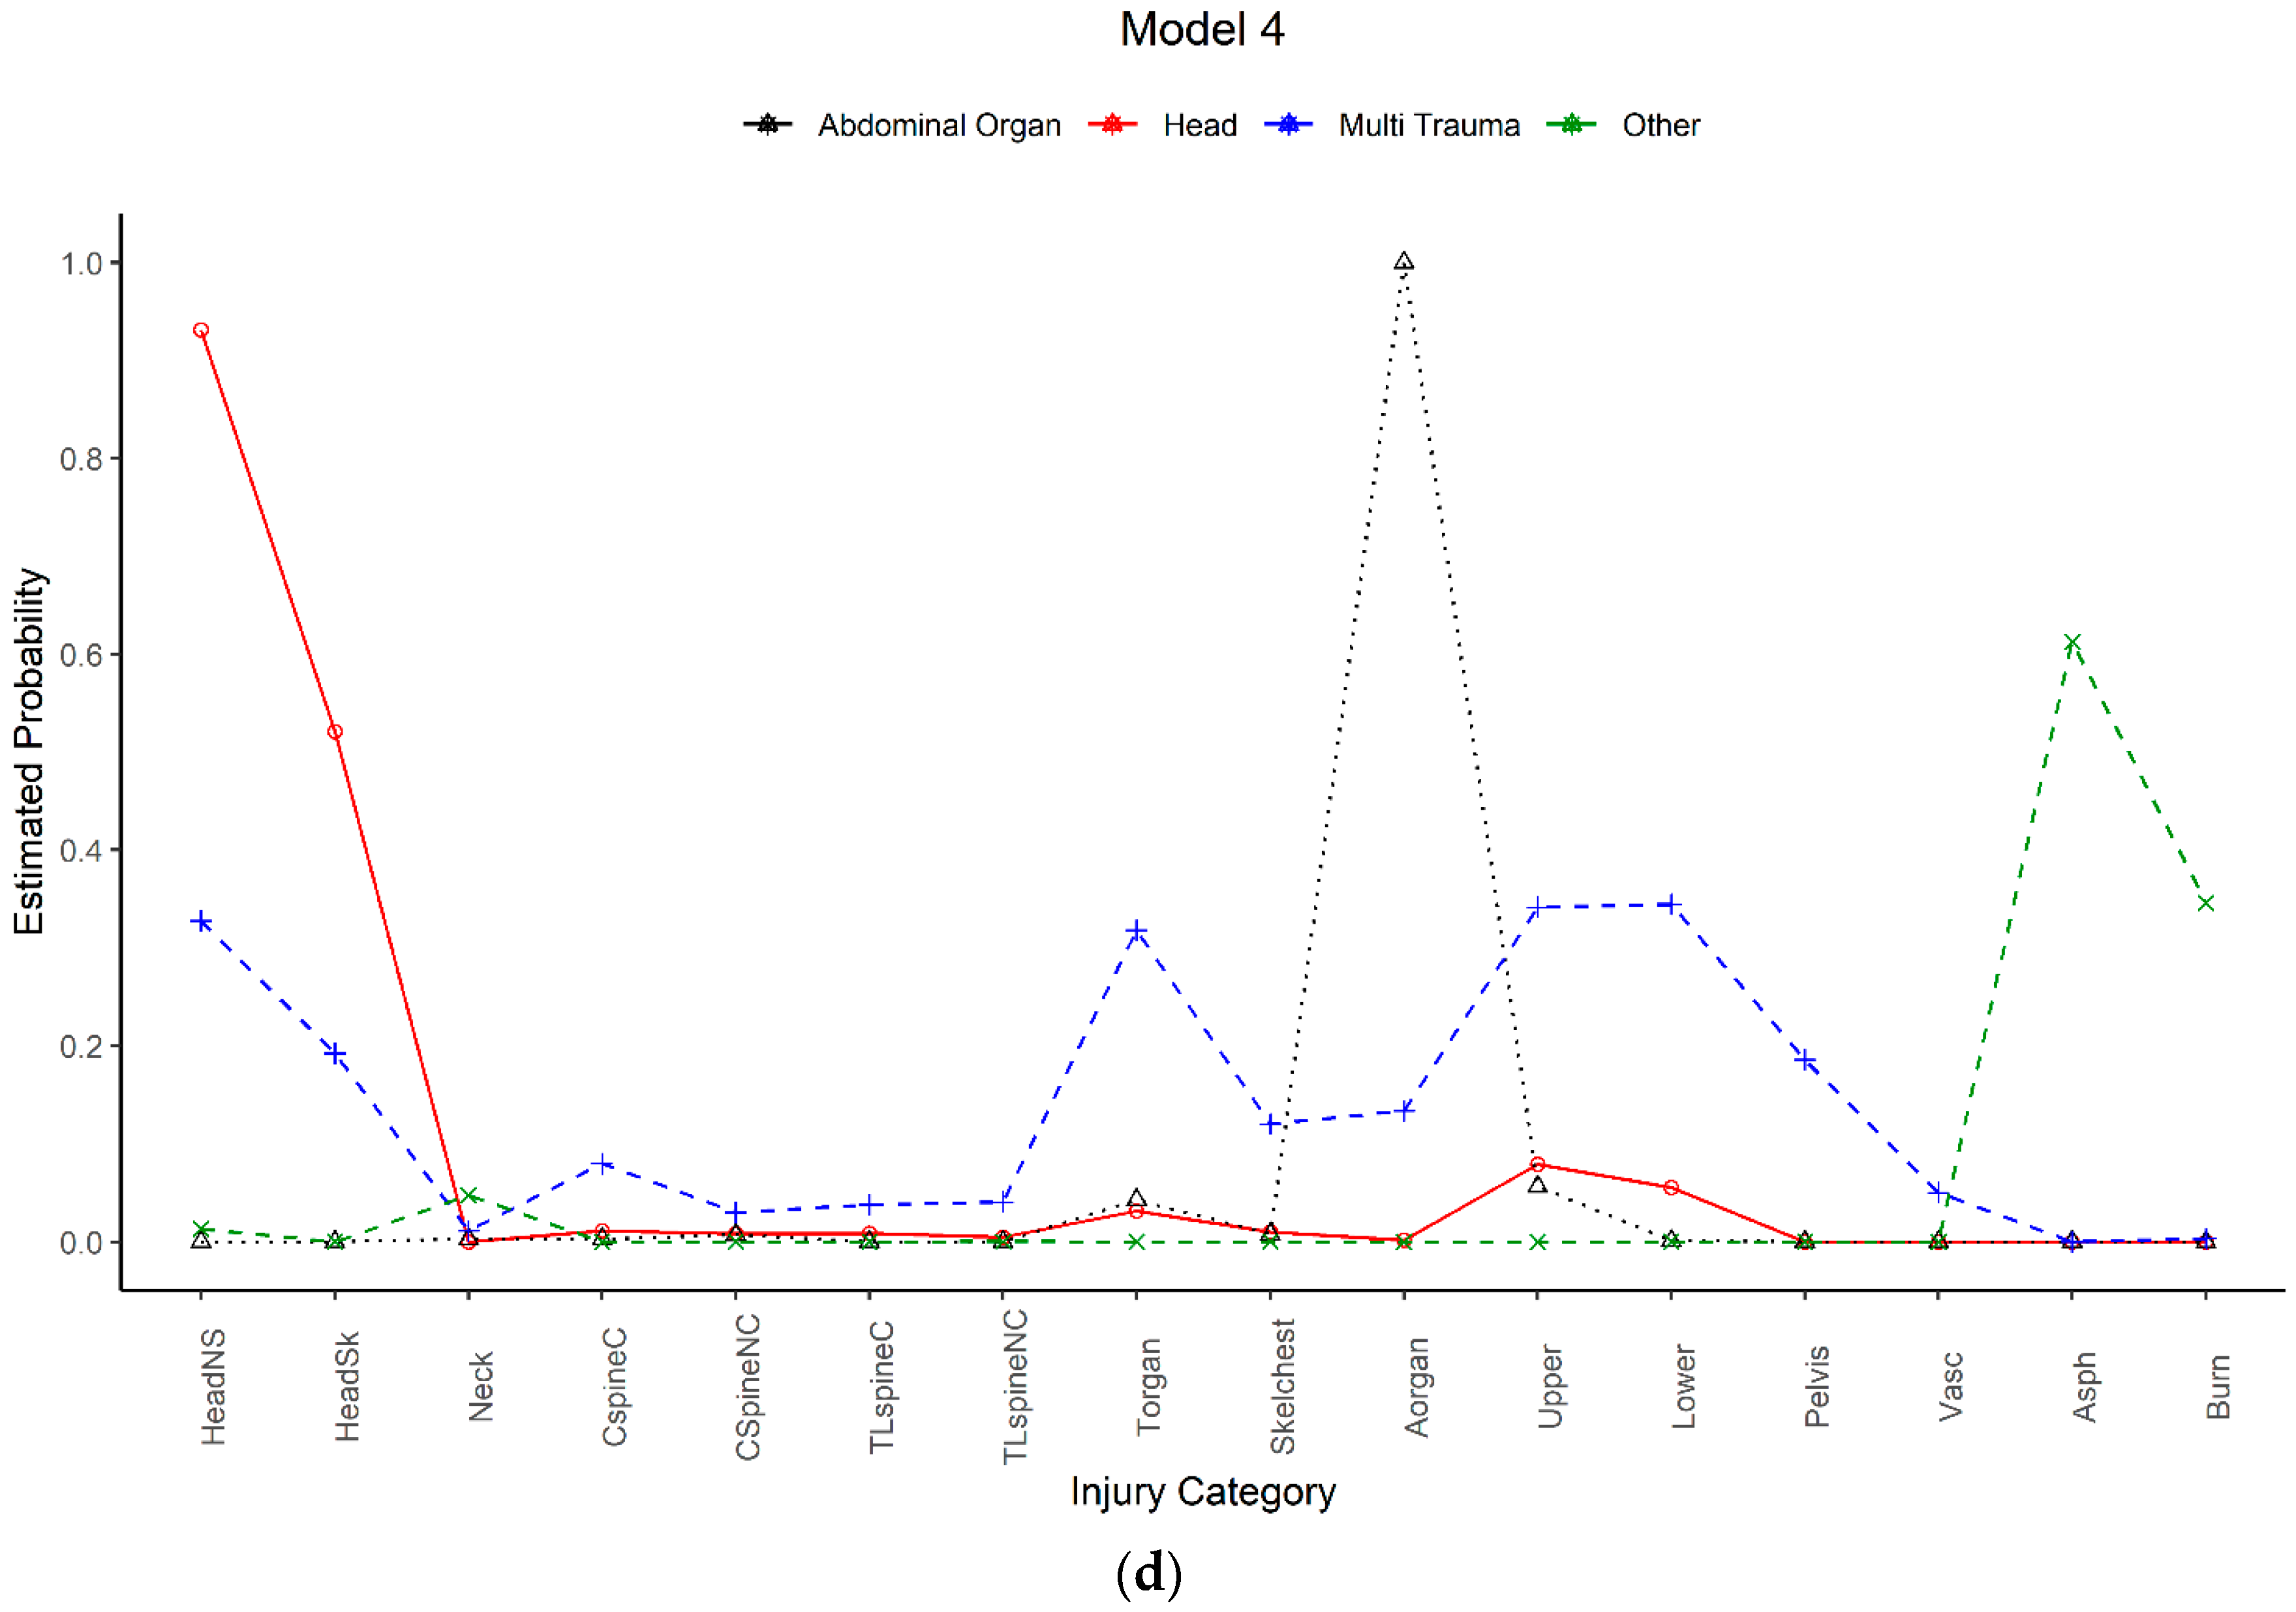
3.2. Latent Class Analysis
3.3. Logistic Regression
3.3.1. Mortality Models
3.3.2. Functional Outcome Models
4. Discussion
5. Conclusions
Author Contributions
Funding
Acknowledgments
Conflicts of Interest
Research Data Policy
Appendix A
- Head brain injury (all AIS 3+ brain injuries)
- Head skull fracture (all AIS 3+ skull fractures)
- Neck injuries (all AIS 3+ neck injuries)
- Cervical spine Spinal Cord Injury (SCI) (any AIS 3+ cervical spinal cord injury, including transient neurological signs)
- Cervical spine non-SCI (any non-SCI AIS 3+ cervical spine injury, including brachial plexus injuries and fractures/dislocations)
- Thoracolumbar spine SCI (any AIS 3+ thoracic or lumbar spinal cord injury)
- Thoracolumbar spine non-SCI (any non-SCI AIS 3+ thoracic or lumbar spine injury, including cauda equine and fractures/dislocations)
- Thoracic organ injury (any AIS 3+ thoracic organ injury)
- Skeletal chest injury (any AIS 3+ rib cage or sternum injury)
- Abdominal organ injury (any AIS 3+ abdominal organ injury)
- Pelvis injury (any AIS 3+ pelvis injury)
- Upper extremity injury (any AIS 2+ injury that includes: amputation, crush injury, clavicle fracture, scapula fracture, humerus fracture and ulna or radius fracture)
- Lower extremity injury (any AIS 2+ injury that includes: amputation, crush injury, femur fracture, tibia or fibula fracture, hip joint dislocation and knee joint dislocation)
- Vascular injury (any AIS 3+ vascular injury in any body region)
- Asphyxia (any AIS 3+ injury related to drowning, asphyxia or suffocation)
- Burns (any AIS 3+ burn injury, reflecting a second or third degree burn (partial or full thickness) to ≥10% total body surface area)
Appendix B

| Mortality | (1) | (2) | (3) | (4) | (5) |
|---|---|---|---|---|---|
| ISS | NISS | LCA ^ | ISS and LCA | NISS and LCA | |
| Model | OR (s.e.) | OR (s.e.) | OR (s.e.) | OR (s.e.) | OR (s.e.) |
| Base | 1259 | 1259 | 1259 | 1259 | 1259 |
| Age Group | |||||
| <1 year | Reference | Reference | Reference | Reference | Reference |
| 1–5 years | 1.784 | 2.948 ** | 0.910 | 0.766 | 0.880 |
| (0.779) | (1.475) | (0.253) | (0.169) | (0.248) | |
| 6–10 years | 0.795 | 1.224 | 0.503 ** | 0.440 *** | 0.455 *** |
| (0.205) | (0.404) | (0.112) | (0.084) | (0.135) | |
| 11–15 years | 0.428 *** | 0.751 | 0.306 *** | 0.259 *** | 0.275 *** |
| (0.071) | (0.201) | (0.056) | (0.019) | (0.044) | |
| Sex | |||||
| Male | Reference | Reference | Reference | Reference | Reference |
| Female | 0.864 | 0.786* | 0.896 | 0.870 | 0.686** |
| (0.090) | (0.097) | (0.087) | (0.083) | (0.081) | |
| Major-Trauma Service | |||||
| No | Reference | Reference | Reference | Reference | Reference |
| Yes | 0.555 | 0.451 | 0.951 | 0.751 | 0.642 |
| (0.426) | (0.373) | (0.765) | (0.664) | (0.578) | |
| Mechanism | |||||
| Road Transport Related | Reference | Reference | Reference | Reference | Reference |
| Low/High fall | 0.226 *** | 0.200 *** | 0.101 *** | 0.218 *** | 0.397 *** |
| (0.078) | (0.068) | (0.025) | (0.056) | (0.090) | |
| Struck or collision with person/object | 2.522 *** | 1.763 *** | 1.004 | 2.373 *** | 2.529 *** |
| (0.402) | (0.377) | (0.088) | (0.243) | (0.452) | |
| Other | 7.508 *** | 12.302 *** | 0.646 ** | 1.160 | 1.896 ** |
| (1.269) | (2.134) | (0.143) | (0.314) | (0.596) | |
| Year | 1.051* | 1.044** | 1.050 | 1.067 | 1.068 |
| (0.029) | (0.023) | (0.038) | (0.050) | (0.050) | |
| IRSAD | 1.055** | 1.048** | 0.979 | 1.053* | 1.033 |
| (0.024) | (0.021) | (0.022) | (0.031) | (0.037) | |
| ARIA | |||||
| Inner regional/outer regional/remote | Reference | Reference | Reference | Reference | Reference |
| Major cities | 1.723 * | 1.678 | 1.515 ** | 1.306 | 1.317 |
| (0.553) | (0.609) | (0.303) | (0.321) | (0.308) | |
| (1) | (2) | (3) | (4) | (5) | |
| 6-Month Functional Outcome Model | ISS | NISS | LCA ^ | ISS and LCA | NISS and LCA |
| Base | 743 | 743 | 743 | 743 | 743 |
| Age Group | |||||
| <1 year | Reference | Reference | Reference | Reference | Reference |
| 1–5 years | 0.509 ** | 0.432 *** | 0.655 ** | 0.588 ** | 0.569 ** |
| (0.064) | (0.057) | (0.094) | (0.124) | (0.116) | |
| 6–10 years | 0.373 ** | 0.311 ** | 0.406 ** | 0.333 ** | 0.326 ** |
| (0.154) | (0.130) | (0.167) | (0.173) | (0.162) | |
| 11–15 years | 0.275 *** | 0.233 *** | 0.319 *** | 0.255 ** | 0.252 ** |
| (0.096) | (0.085) | (0.103) | (0.108) | (0.106) | |
| Sex | |||||
| Male | Reference | Reference | Reference | Reference | Reference |
| Female | 0.809 *** | 0.823 *** | 0.851 *** | 0.816 *** | 0.826 *** |
| (0.049) | (0.042) | (0.035) | (0.038) | (0.034) | |
| Major-Trauma Service | |||||
| No | Reference | Reference | Reference | Reference | Reference |
| Yes | 0.739 | 0.811 | 0.787 | 0.804 | 0.882 |
| (0.189) | (0.220) | (0.268) | (0.278) | (0.291) | |
| Mechanism | |||||
| Road Transport Related | Reference | Reference | Reference | Reference | Reference |
| Low/High fall | 0.786 | 0.876 | 1.004 | 0.991 | 0.978 |
| (0.184) | (0.179) | (0.095) | (0.118) | (0.114) | |
| Struck or collision with person/object | 0.746 *** | 0.886 | 0.779 ** | 0.790 ** | 0.876 |
| (0.048) | (0.080) | (0.056) | (0.062) | (0.085) | |
| Other | 0.231 *** | 0.205 *** | 0.506 ** | 0.489 ** | 0.545 ** |
| (0.040) | (0.036) | (0.110) | (0.120) | (0.114) | |
| Year | 1.021 | 1.020 | 1.033 *** | 1.020 ** | 1.013 * |
| (0.013) | (0.017) | (0.007) | (0.007) | (0.007) | |
| IRSAD | 1.082 ** | 1.073 * | 1.078 | 1.087 ** | 1.078 * |
| (0.036) | (0.043) | (0.049) | (0.043) | (0.044) | |
| ARIA | |||||
| Inner regional/outer regional/remote | Reference | Reference | Reference | Reference | Reference |
| Major cities | 1.138 | 1.197 | 1.185 | 1.195 | 1.244 |
| (0.176) | (0.208) | (0.224) | (0.225) | (0.261) | |
| Fund | |||||
| Compensable | Reference | Reference | Reference | Reference | Reference |
| Non-compensable | 4.754 *** | 4.753 *** | 5.314 *** | 3.959 *** | 3.998 *** |
| (0.675) | (0.674) | (0.576) | (0.353) | (0.427) |
References
- Kyu, H.H.; Pinho, C.; Wagner, J.A.; Brown, J.C.; Bertozzi-Villa, A.; Charlson, F.J.; Coffeng, L.E.; Dandona, L.; Erskine, H.E.; Ferrari, A.J. Global and national burden of diseases and injuries among children and adolescents between 1990 and 2013: Findings from the global burden of disease 2013 study. JAMA Pediatrics 2016, 170, 267–287. [Google Scholar] [PubMed] [Green Version]
- Mitchell, R.J.; Curtis, K.; Foster, K. A 10-year review of child injury hospitalisations, health outcomes and treatment costs in Australia. Inj. Prev. 2018, 24, 344–350. [Google Scholar] [CrossRef] [PubMed] [Green Version]
- Roberts, I.; Hillman, M. Climate change: The implications for policy on injury control and health promotion. Inj. Prev. 2005, 11, 326–329. [Google Scholar] [CrossRef] [PubMed]
- Mitchell, R.J.; Curtis, K.; Chong, S.; Holland, A.J.; Soundappan, S.; Wilson, K.L.; Cass, D.T. Comparative analysis of trends in paediatric trauma outcomes in New South Wales, Australia. Injury 2013, 44, 97–103. [Google Scholar] [CrossRef] [PubMed]
- Hedström, E.M.; Bergström, U.; Michno, P. Injuries in children and adolescents—Analysis of 41,330 injury related visits to an emergency department in northern Sweden. Injury 2012, 43, 1403–1408. [Google Scholar] [CrossRef] [PubMed]
- Mehan, T.J.; Gardner, R.; Smith, G.A.; McKenzie, L.B. Bicycle-related injuries among children and adolescents in the United States. Clin. Pediatr. (Phila) 2009, 48, 166–173. [Google Scholar] [CrossRef] [PubMed]
- Vanlaar, W.; McAteer, H.; Brown, S.; Crain, J.; McFaull, S.; Hing, M.M. Injuries related to off-road vehicles in Canada. Accid. Anal. Prev. 2015, 75, 264–271. [Google Scholar] [CrossRef]
- Ramakrishnaiah, R.H.; Shah, C.; Parnell-Beasley, D.; Greenberg, B.S. Motorized dirt bike injuries in children. J. Emerg. Med. 2013, 44, 806–810. [Google Scholar] [CrossRef]
- Bruns, J.; Hauser, W.A. The epidemiology of traumatic brain injury: A review. Epilepsia 2003, 44, 2–10. [Google Scholar] [CrossRef]
- Li, L.; Liu, J. The effect of pediatric traumatic brain injury on behavioral outcomes: A systematic review. Dev. Med. Child Neurol. 2013, 55, 37–45. [Google Scholar] [CrossRef] [Green Version]
- Eleraky, M.A.; Theodore, N.; Adams, M.; Rekate, H.L.; Sonntag, V.K. Pediatric cervical spine injuries: Report of 102 cases and review of the literature. J. Neurosurg. Spine 2000, 92, 12–17. [Google Scholar] [CrossRef] [PubMed]
- Kemp, A.M.; Dunstan, F.; Harrison, S.; Morris, S.; Mann, M.; Rolfe, K.; Datta, S.; Thomas, D.P.; Sibert, J.R.; Maguire, S. Patterns of skeletal fractures in child abuse: Systematic review. BMJ 2008, 337, a1518. [Google Scholar] [CrossRef] [PubMed] [Green Version]
- Peclet, M.H.; Newman, K.D.; Eichelberger, M.R.; Gotschall, C.S.; Garcia, V.F.; Bowman, L.M. Thoracic trauma in children: An indicator of increased mortality. J. Pediatr. Surg. 1990, 25, 961–966. [Google Scholar] [CrossRef]
- Baker, S.P.; O’Neill, B.; Haddon, W., Jr.; Long, W.B. The injury severity score: A method for describing patients with multiple injuries and evaluating emergency care. J. Trauma Acute Care Surg. 1974, 14, 187–196. [Google Scholar] [CrossRef]
- Osler, T.; Baker, S.P.; Long, W. A modification of the injury severity score that both improves accuracy and simplifies scoring. J. Trauma Acute Care Surg. 1997, 43, 922–926. [Google Scholar] [CrossRef]
- Goodman, L.A. Exploratory latent structure analysis using both identifiable and unidentifiable models. Biometrika 1974, 61, 215–231. [Google Scholar] [CrossRef]
- Vermunt, J.K.; Magidson, J. Latent class cluster analysis. Appl. Latent Class Anal. 2002, 11, 89–106. [Google Scholar]
- Porcu, M.; Giambona, F. Introduction to latent class analysis with applications. J. Early Adolesc. 2017, 37, 129–158. [Google Scholar] [CrossRef]
- Rivara, F.P.; Oldham, K.T. Pediatric trauma care: Defining a research agenda. J. Trauma Acute Care Surg. 2007, 63, S52–S53. [Google Scholar] [CrossRef]
- Cameron, P.A.; Finch, C.F.; Gabbe, B.J.; Collins, L.J.; Smith, K.L.; McNeil, J.J. Developing Australia’s first statewide trauma registry: What are the lessons? ANZ J. Surg. 2004, 74, 424–428. [Google Scholar] [CrossRef]
- Deasy, C.; Gabbe, B.; Palmer, C.; Babl, F.E.; Bevan, C.; Crameri, J.; Butt, W.; Fitzgerald, M.; Judson, R.; Cameron, P. Paediatric and adolescent trauma care within an integrated trauma system. Injury 2012, 43, 2006–2011. [Google Scholar] [CrossRef] [PubMed]
- Palmer, C.S.; Gabbe, B.J.; Cameron, P.A. Defining major trauma using the 2008 Abbreviated Injury Scale. Injury 2016, 47, 109–115. [Google Scholar] [CrossRef] [PubMed]
- Beck, B.; Teague, W.; Cameron, P.; Gabbe, B.J. Causes and characteristics of injury in paediatric major trauma and trends over time. Arch. Dis. Child. 2019, 104, 256–261. [Google Scholar] [CrossRef]
- Gennarelli, T.A.; Wodzin, E. Abbreviated Injury Scale 2005: Update 2008; American Association for Automotive Medicine (AAAM): Des Plaines, IL, USA, 2008. [Google Scholar]
- Crouchman, M.; Rossiter, L.; Colaco, T.; Forsyth, R. A practical outcome scale for paediatric head injury. Arch. Dis. Child. 2001, 84, 120–124. [Google Scholar] [CrossRef] [PubMed] [Green Version]
- Cameron, A.C.; Miller, D.L. A practitioner’s guide to cluster-robust inference. J. Hum. Resour. 2015, 50, 317–372. [Google Scholar] [CrossRef]
- Wurpts, I.C.; Geiser, C. Is adding more indicators to a latent class analysis beneficial or detrimental? Results of a Monte-Carlo study. Front. Psychol. 2014, 5, 920. [Google Scholar] [CrossRef] [Green Version]
- Vermunt, J.K. Latent class and finite mixture models for multilevel data sets. Stat. Methods Med. Res. 2008, 17, 33–51. [Google Scholar] [CrossRef]
- Muthén, B.; Shedden, K. Finite mixture modeling with mixture outcomes using the EM algorithm. Biometrics 1999, 55, 463–469. [Google Scholar] [CrossRef]
- Akaike, H. Factor analysis and AIC. In Selected Papers of Hirotugu Akaike; Springer: Cham, Switzerland, 1987; pp. 371–386. [Google Scholar]
- Schwarz, G. Estimating the dimension of a model. Ann. Stat. 1978, 6, 461–464. [Google Scholar] [CrossRef]
- Lo, Y.; Mendell, N.R.; Rubin, D.B. Testing the number of components in a normal mixture. Biometrika 2001, 88, 767–778. [Google Scholar] [CrossRef]
- Celeux, G.; Soromenho, G. An entropy criterion for assessing the number of clusters in a mixture model. J. Classif. 1996, 13, 195–212. [Google Scholar] [CrossRef] [Green Version]
- Clark, S.L.; Muthén, B. Relating Latent Class Analysis Results to Variables Not Included in the Analysis. 2009. Available online: https://www.statmodel.com/download/relatinglca.pdf (accessed on 30 January 2020).
- Agresti, A. An Introduction to Categorical Data Analysis, 2nd ed.; Wiley: New York, NY, USA, 2007. [Google Scholar]
- Dinno, A. Nonparametric pairwise multiple comparisons in independent groups using Dunn’s test. Stata J. 2015, 15, 292–300. [Google Scholar] [CrossRef] [Green Version]
- Sleat, G.K.; Ardolino, A.M.; Willett, K.M. Outcome measures in major trauma care: A review of current international trauma registry practice. Emerg. Med. J. 2011, 28, 1008–1012. [Google Scholar] [CrossRef] [PubMed]
- R Core Team. R: A Language and Environment for Statistical Computing. 2018. Available online: https://www.R-project.org/ (accessed on 1 June 2019).
- Hallquist, M.N.; Wiley, J.F. MplusAutomation: An R Package for Facilitating Large-Scale Latent Variable Analyses in Mplus. Struct. Equ. Modeling 2018, 25, 621–638. [Google Scholar] [CrossRef]
- Hyder, A.A.; Wunderlich, C.A.; Puvanachandra, P.; Gururaj, G.; Kobusingye, O.C. The impact of traumatic brain injuries: A global perspective. NeuroRehabilitation 2007, 22, 341–353. [Google Scholar] [CrossRef] [PubMed] [Green Version]
- Nataraja, R.; Palmer, C.; Arul, G.; Bevan, C.; Crameri, J. The full spectrum of handlebar injuries in children: A decade of experience. Injury 2014, 45, 684–689. [Google Scholar] [CrossRef]
- Bayreuther, J.; Wagener, S.; Woodford, M.; Edwards, A.; Lecky, F.; Bouamra, O.; Dykes, E. Paediatric trauma: Injury pattern and mortality in the UK. Arch. Dis. Child. Educ. Pract. 2009, 94, 37–41. [Google Scholar] [CrossRef]
- Wolyncewicz, G.E.; Palmer, C.S.; Jowett, H.E.; Hutson, J.M.; King, S.K.; Teague, W.J. Horse-related injuries in children–unmounted injuries are more severe: A retrospective review. Injury 2018, 49, 933–938. [Google Scholar] [CrossRef]
- Sullivan, T.; Haider, A.; DiRusso, S.M.; Nealon, P.; Shaukat, A.; Slim, M. Prediction of mortality in pediatric trauma patients: New injury severity score outperforms injury severity score in the severely injured. J. Trauma Acute Care Surg. 2003, 55, 1083–1088. [Google Scholar] [CrossRef]
- Finch, W.H.; Bronk, K.C. Conducting confirmatory latent class analysis using Mplus. Struct. Equ. Model. 2011, 18, 132–151. [Google Scholar] [CrossRef]
- Grinshteyn, E.; Hemenway, D. Violent death rates in the US compared to those of the other high-income countries, 2015. Prev. Med. 2019, 123, 20–26. [Google Scholar] [CrossRef] [PubMed] [Green Version]
- Ponsford, R.; Thompson, C.; Paparini, S. We need a renewed focus on primary prevention to tackle youth knife violence. BMJ 2019, 365, l1769. [Google Scholar] [CrossRef] [PubMed] [Green Version]


| Characteristic | Models 1 and 2 | Models 3 and 4 |
|---|---|---|
| Base | 1178 | 1281 |
| Sex (n, %) | ||
| Male | 790 (67.1%) | 852 (66.5%) |
| Female | 388 (32.9%) | 429 (33.5%) |
| Age Group (n, %) | ||
| <1 year | 116 (9.8%) | 122 (9.5%) |
| 1–5 years | 263 (22.3%) | 326 (25.4%) |
| 6–10 years | 267 (22.7%) | 278 (21.7%) |
| 11–15 years | 532 (45.2%) | 555 (43.3%) |
| Age in Years (Mean, SD) | 8.6 (5.2) | 8.3 (5.2) |
| IRSAD Quintile (n, %) | ||
| 1 | 206 (17.7%) | 230 (18.2%) |
| 2 | 210 (18.0%) | 227 (17.9%) |
| 3 | 260 (22.3%) | 281 (22.2%) |
| 4 | 263 (22.6%) | 291 (23.0%) |
| 5 | 225 (19.3%) | 236 (18.7%) |
| ARIA (n, %) | ||
| Inner regional/outer regional/remote | 394 (34.0%) | 425 (33.8%) |
| Major city | 764 (66.0%) | 834 (66.2%) |
| Fund (n, %) | ||
| Compensable | 405 (34.7%) | 410 (32.3%) |
| Non-compensable | 762 (65.3%) | 858 (67.7%) |
| Major Trauma Service (n, %) | ||
| Yes | 1028 (87.3%) | 1112 (86.8%) |
| Discharge Type (n, %) | ||
| Home | 888 (75.4%) | 940 (73.4%) |
| Rehabilitation | 196 (16.6%) | 202 (15.8%) |
| Hospital for Convalescence | 18 (1.5%) | 18 (1.4%) |
| Other | 16 (1.4%) | 20 (1.6%) |
| In-hospital death | 60 (5.1%) | 101 (7.9%) |
| Characteristic | Models 1 and 2 | Models 3 and 4 |
|---|---|---|
| Base | 1178 | 1281 |
| Injury Type (n, %) | ||
| Head—brain injury | 503 (57.3%) | 605 (52.8%) |
| Head—skull fracture | 381 (32.3%) | 381 (29.7%) |
| Neck injuries | 9 (0.8%) | 10 (0.8%) |
| Cervical spine—spinal cord injury (SCI) | 39 (3.3%) | 39 (3.0%) |
| Cervical spine—non-SCI | 18 (1.5%) | 18 (1.4%) |
| Thoracolumbar spine—SCI | 20 (1.7%) | 20 (1.6%) |
| Thoracolumbar spine—non-SCI | 19 (1.6%) | 19 (1.5%) |
| Thoracic organ injuries | 152 (12.9%) | 153 (11.9%) |
| Skeletal chest injuries | 55 (4.7%) | 55 (4.3%) |
| Abdominal organ injuries | 246 (20.9%) | 246 (19.2%) |
| Upper limb injuries | 193 (16.4%) | 193 (15.1%) |
| Lower limb injuries | 169 (14.3%) | 170 (13.3%) |
| Pelvis injuries | 73 (6.2%) | 74 (5.8%) |
| Vascular injuries | 20 (1.7%) | 20 (1.6%) |
| Asphyxial injury | Excluded | 65 (5.1%) |
| Burn injury | Excluded | 38 (3.0%) |
| ISS (Median, IQR) | 17.0 (16.0, 26.0) | 17.0 (16.0, 26.0) |
| NISS (Median, IQR) | 25.0 (17.0, 34.0) | 25.0 (17.0, 34.0) |
| Six-Month KOSCHI | ||
| Death in hospital/disability | 401 (57.4%) | 463 (60.4%) |
| Good/intact recovery | 298 (42.6%) | 304 (39.6%) |
| Total Injuries (Median, IQR) | 2.0 (1.0, 2.0) | 1.0 (1.0, 2.0) |
| Mechanism of Injury (n, %) | ||
| Motor vehicle occupant | 207 (17.6%) | 208 (16.2%) |
| Motorcycle | 123 (10.4%) | 124 (9.7%) |
| Cyclist | 118 (10.0%) | 118 (9.2%) |
| Pedestrian | 143 (12.1%) | 143 (11.2%) |
| Horse-related | 40 (3.4%) | 40 (3.1%) |
| Low fall | 168 (14.3%) | 168 (13.1%) |
| High fall | 139 (11.8%) | 139 (10.9%) |
| Submersion/drowning | Excluded | 52 (4.1%) |
| Other threat to breathing | Excluded | 12 (0.9%) |
| Fire/scalds/contact burn | Excluded | 36 (2.8%) |
| Cutting, piercing object | 13 (1.1%) | 13 (1.0%) |
| Struck by or collision with person/object | 159 (13.5%) | 159 (12.4%) |
| Other | 68 (5.8%) | 69 (5.4%) |
| Head Injuries | Model 1 | Model 2 | Model 3 | Model 4 |
| Less than 1 year of age | 6.58 | 6.66 | 7.68 | 8.20 |
| 1–5 years of age | 4.92 | 2.08 | 5.36 | 2.37 |
| Discharged for rehabilitation | 2.19 | 3.26 | - | 2.51 |
| Mechanism—low falls | 8.27 | 9.22 | 8.18 | 9.25 |
| Mechanism—high falls | 4.28 | 5.34 | 4.37 | 5.36 |
| Mechanism—struck by or collision with person/object | 2.09 | 3.06 | 2.34 | 3.59 |
| Multi-Trauma | ||||
| 11–15 years of age | 4.26 | 4.51 | 5.58 | 6.70 |
| Discharged to rehabilitation | 3.29 | 2.61 | 3.72 | 4.52 |
| Mechanism—motor vehicle occupant | 6.63 | 7.44 | 6.58 | 7.41 |
| Mechanism—motorcycle | 3.09 | 4.33 | 3.37 | 4.19 |
| Mechanism—pedestrian | 5.76 | 7.65 | 6.03 | 7.07 |
| Isolated abdominal | ||||
| Male | 2.84 | 3.03 | 2.79 | 3.03 |
| 6–10 years of age | 2.67 | 3.19 | 2.72 | 3.00 |
| 11–15 years of age | 3.93 | 4.41 | 4.00 | 4.56 |
| Discharged directly home | 7.23 | 7.77 | 7.43 | 7.77 |
| Mechanism—motorcycle | 4.31 | 4.78 | 4.34 | 4.78 |
| Mechanism—cyclist | 5.64 | 6.20 | 5.68 | 6.20 |
| Mechanism—struck by or collision with person/object | 2.01 | 2.54 | 2.04 | 2.54 |
| (1) | (2) | (3) | (4) | (5) | |
|---|---|---|---|---|---|
| Model | ISS OR (s.e.) | NISS OR (s.e.) | LCA ^ OR (s.e.) | ISS and LCA OR (s.e.) | NISS and LCA OR (s.e.) |
| Base | 1259 | 1259 | 1259 | 1259 | 1259 |
| ISS | 1.149 *** | 1.161 *** | |||
| (0.007) | (0.008) | ||||
| NISS | 1.111 *** | 1.13 *** | |||
| (0.005) | (0.009) | ||||
| LCA Class | |||||
| Head | Reference | Reference | Reference | ||
| Multi-trauma | 1.295 ** | 0.705 *** | 2.474 *** | ||
| (0.107) | (0.059) | (0.169) | |||
| Abdominal Organ | 0.190 ** | 0.221 | 0.988 | ||
| (0.099) | (0.253) | (1.051) | |||
| Asphyxia | 21.130 *** | 29.957 *** | 135.185 *** | ||
| (4.921) | (5.895) | (30.330) | |||
| Burns and other | 0.843 | 0.681 | 4.155 *** | ||
| (0.149) | (0.328) | (1.678) | |||
| Fit Statistics | |||||
| BIC | 481.93 | 471.55 | 546.90 | 411.30 | 373.68 |
| Sensitivity % | 85.86 | 88.89 | 76.77 | 83.84 | 88.89 |
| Specificity% | 82.07 | 82.41 | 78.45 | 87.59 | 90.09 |
| Overall % correctly classified | 82.37 | 82.92 | 78.32 | 87.29 | 89.99 |
| Hosmer-Lemeshow goodness-of-fit test (p-value) | 0.430 | 0.246 | 0.850 | 0.479 | 0.743 |
| McFadden R2 | 0.357 | 0.372 | 0.263 | 0.458 | 0.513 |
| Adjusted McFadden R2 | 0.342 | 0.357 | 0.248 | 0.444 | 0.498 |
| McKelvey and Zavoina R2 | 0.507 | 0.529 | 0.398 | 0.558 | 0.587 |
| Cox Snell R2 | 0.178 | 0.185 | 0.135 | 0.223 | 0.246 |
| Nagelkerke R2 | 0.421 | 0.437 | 0.318 | 0.527 | 0.581 |
| AUC | 0.916 | 0.917 | 0.853 | 0.940 | 0.951 |
| Specification link test (p-value) | <0.001 *** | 0.029 ** | 0.139 | 0.077 * | 0.587 |
| (1) | (2) | (3) | (4) | (5) | |
|---|---|---|---|---|---|
| Model | ISS OR (s.e.) | NISS OR (s.e.) | LCA ^ OR (s.e.) | ISS and LCA OR (s.e.) | NISS and LCA OR (s.e.) |
| Base | 743 | 743 | 743 | 743 | 743 |
| ISS | 0.908 *** | 0.918 *** | |||
| (0.012) | (0.010) | ||||
| NISS | 0.940 *** | 0.941 *** | |||
| (0.008) | (0.006) | ||||
| LCA Class | |||||
| Head | Reference | Reference | Reference | ||
| Multi-trauma | 1.041 | 1.054 | 0.748 ** | ||
| (0.122) | (0.120) | (0.072) | |||
| Abdominal Organ | 3.642 ** | 3.206 ** | 2.180* | ||
| (1.830) | (1.533) | (1.007) | |||
| Asphyxia | 0.179 *** | 0.237 ** | 0.121 *** | ||
| (0.079) | (0.101) | (0.042) | |||
| Burns and other | 0.336 ** | 0.326 ** | 0.183 *** | ||
| (0.126) | (0.122) | (0.054) | |||
| Fit Statistics | |||||
| BIC | 847.90 | 846.47 | 858.12 | 792.31 | 809.57 |
| Sensitivity % | 73.83 | 71.81 | 74.83 | 77.18 | 76.51 |
| Specificity % | 66.29 | 69.66 | 64.94 | 68.09 | 69.66 |
| Overall % correctly classified | 69.31 | 70.52 | 68.91 | 71.74 | 72.41 |
| Hosmer-Lemeshow goodness-of-fit test | 0.358 | 0.931 | 0.768 | 0.369 | 0.653 |
| McFadden R2 | 0.186 | 0.187 | 0.176 | 0.220 | 0.224 |
| Adjusted McFadden R2 | 0.176 | 0.177 | 0.166 | 0.208 | 0.214 |
| McKelvey and Zavoina R2 | 0.365 | 0.341 | 0.282 | 0.392 | 0.383 |
| Cox Snell R2 | 0.221 | 0.223 | 0.211 | 0.257 | 0.261 |
| Nagelkerke R2 | 0.299 | 0.301 | 0.285 | 0.347 | 0.352 |
| AUC | 0.777 | 0.782 | 0.775 | 0.803 | 0.806 |
| Specification link test (p-value) | 0.122 | 0.643 | 0.147 | 0.020 ** | 0.150 |
© 2020 by the authors. Licensee MDPI, Basel, Switzerland. This article is an open access article distributed under the terms and conditions of the Creative Commons Attribution (CC BY) license (http://creativecommons.org/licenses/by/4.0/).
Share and Cite
Dipnall, J.F.; Gabbe, B.J.; Teague, W.J.; Beck, B. Identifying Homogeneous Patterns of Injury in Paediatric Trauma Patients to Improve Risk-Adjusted Models of Mortality and Functional Outcomes. Int. J. Environ. Res. Public Health 2020, 17, 892. https://doi.org/10.3390/ijerph17030892
Dipnall JF, Gabbe BJ, Teague WJ, Beck B. Identifying Homogeneous Patterns of Injury in Paediatric Trauma Patients to Improve Risk-Adjusted Models of Mortality and Functional Outcomes. International Journal of Environmental Research and Public Health. 2020; 17(3):892. https://doi.org/10.3390/ijerph17030892
Chicago/Turabian StyleDipnall, Joanna F., Belinda J. Gabbe, Warwick J. Teague, and Ben Beck. 2020. "Identifying Homogeneous Patterns of Injury in Paediatric Trauma Patients to Improve Risk-Adjusted Models of Mortality and Functional Outcomes" International Journal of Environmental Research and Public Health 17, no. 3: 892. https://doi.org/10.3390/ijerph17030892