Effect of the Financial Crisis on Socioeconomic Inequalities in Mortality in Small Areas in Seven Spanish Cities

 , , and
Abstract
:1. Introduction
2. Methods
2.1. Design, Unit of Analysis, and Study Population
2.2. Information Sources
2.3. Mortality
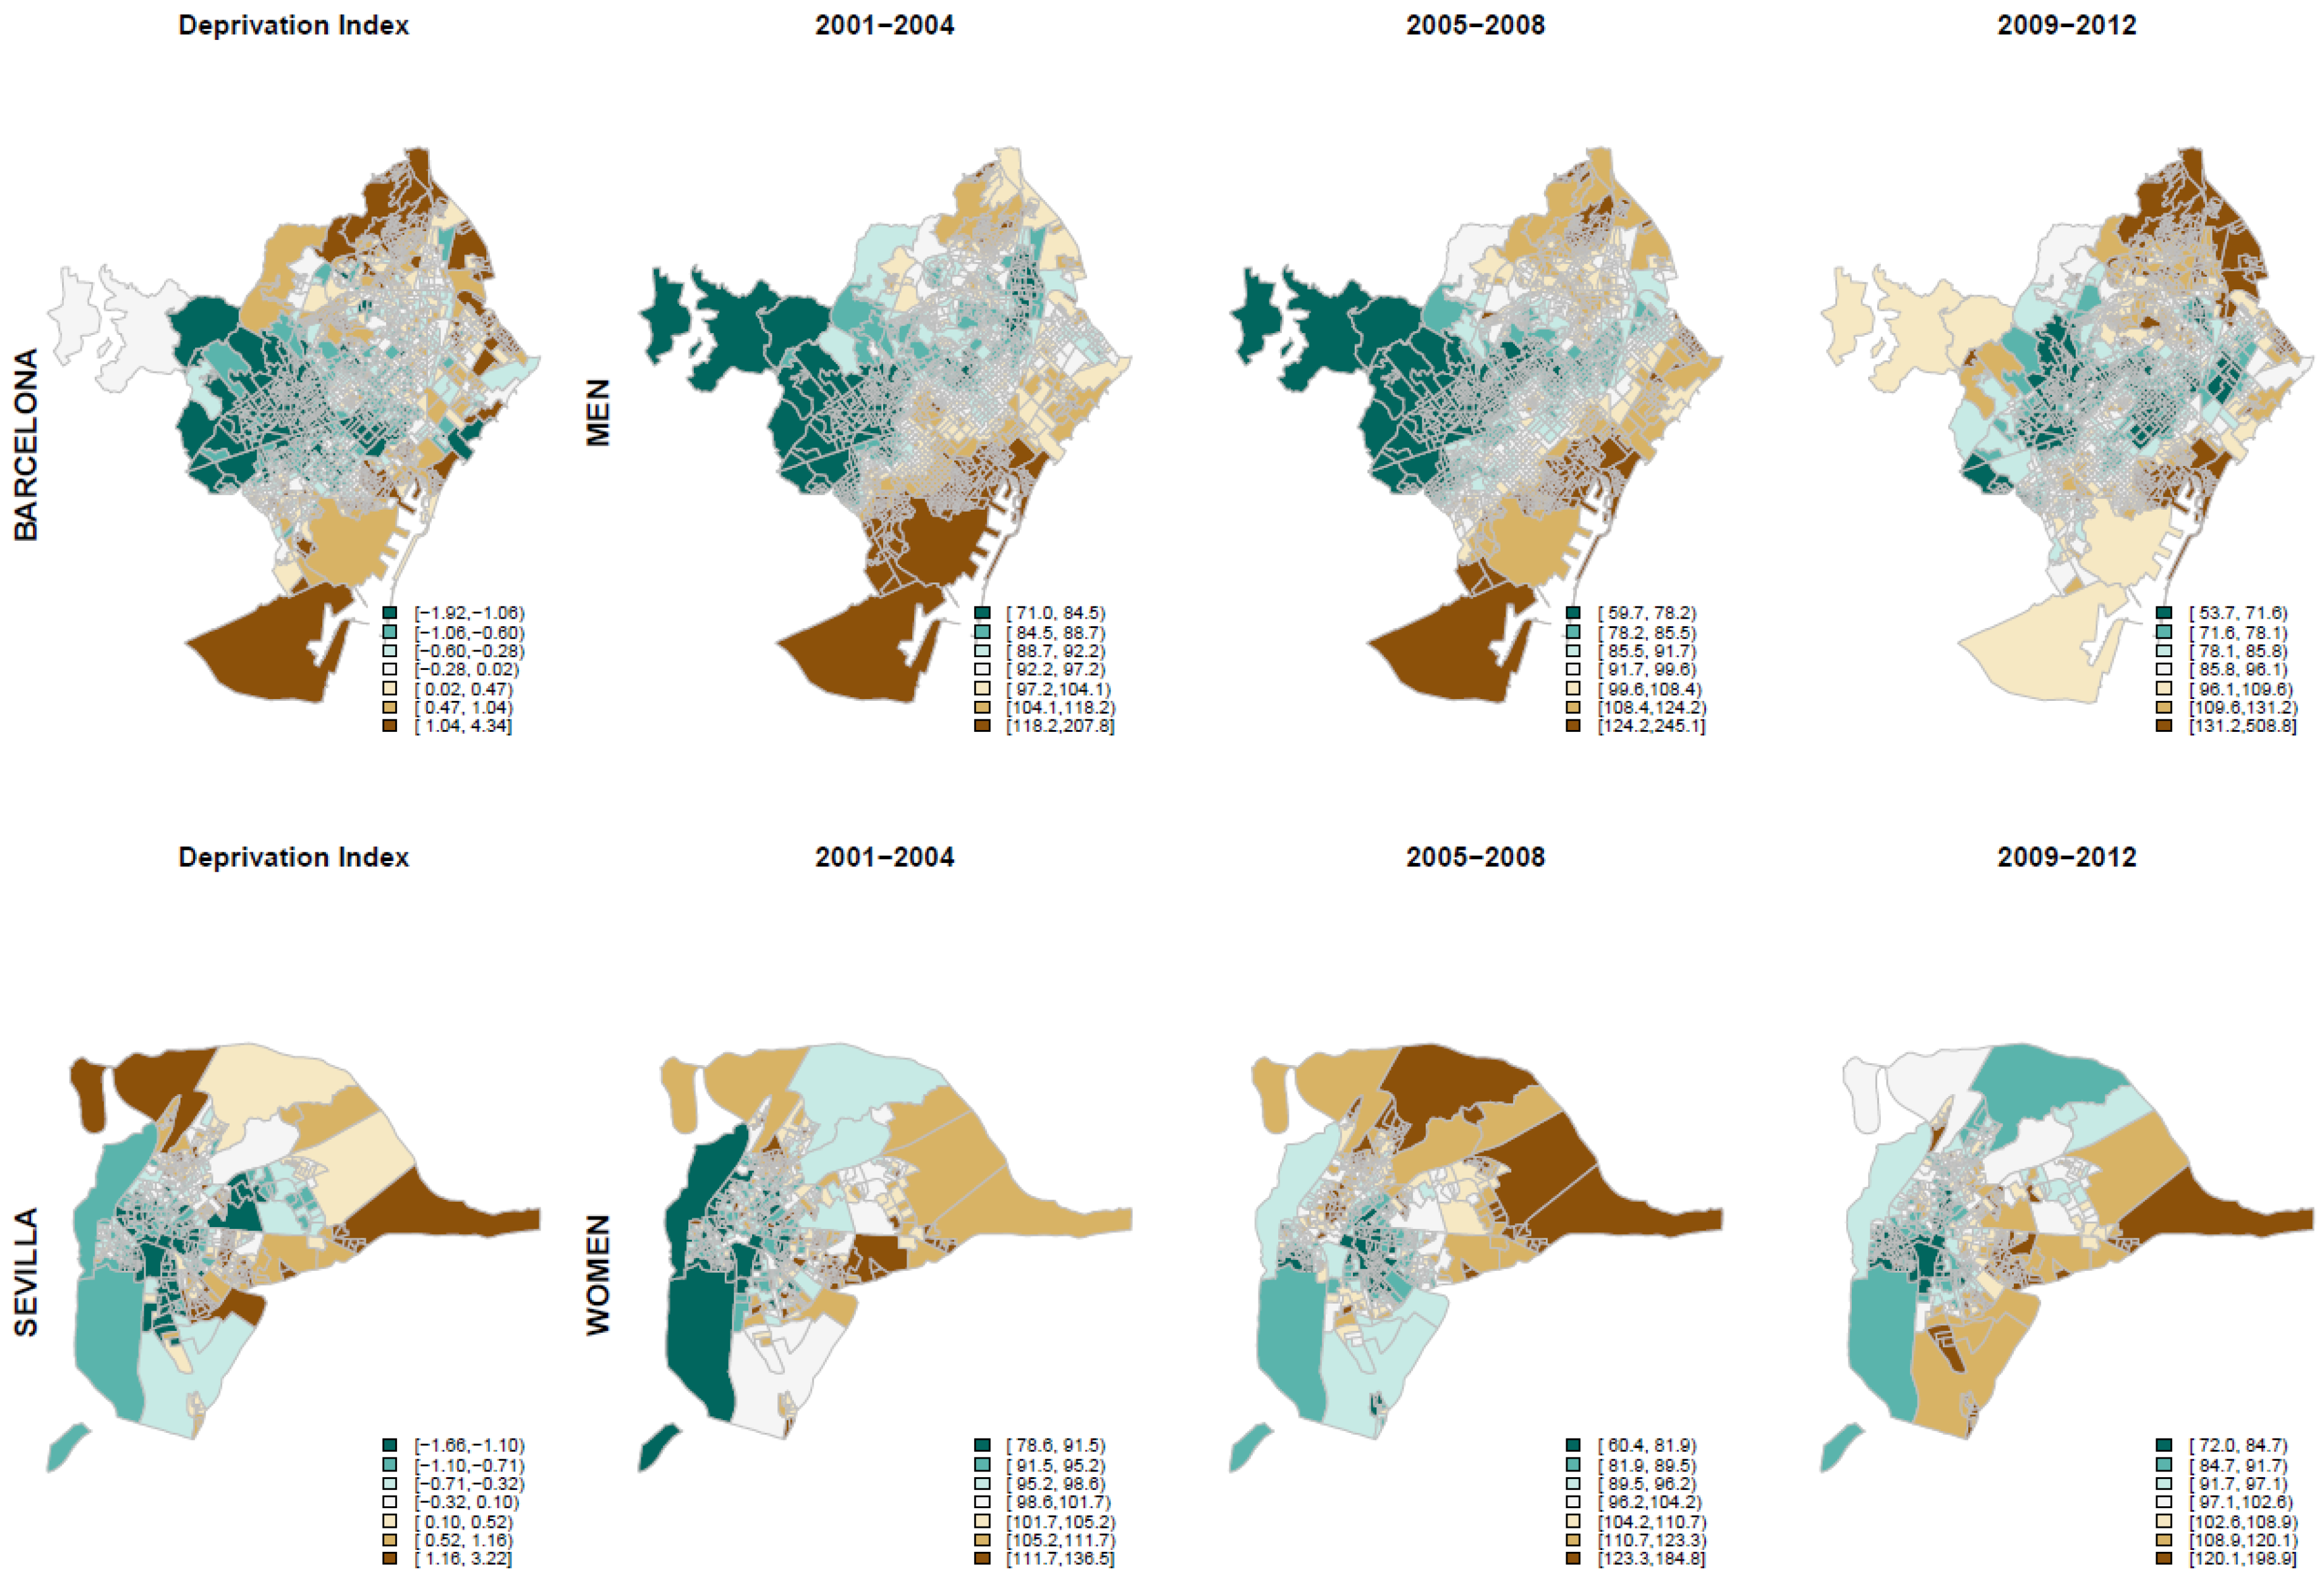
2.4. Socioeconomic Deprivation Index
2.5. Data Analysis
- Oi~Poisson (Eiθi)
- log(θi) = α + Si + Hi (model 1)
- Oit~Poisson (Eitθit)
- log(θit) = α + β1D1 + β2P2t + β3P3t + β4P2tDi + β5P3tDt + Sit + Hit (model 2)
3. Results
4. Discussion
4.1. Main Findings of the Study
4.2. What Is Already Known and What Does This Study Add?
4.3. Limitations of This Study
5. Conclusions
Author Contributions
Funding
Conflicts of Interest
Ethics Approval and Consent to Participate
References
- Cortés-Franch, I.; González López-Valcárcel, B. Crisis económico-financiera y salud en España. Evidencia y perspectivas. Informe SESPAS 2014. Gac. Sanit. 2014, 28, 1–6. [Google Scholar] [CrossRef] [PubMed] [Green Version]
- Quaglio, G.; Karapiperis, T.; Van Woensel, L.; Arnold, E.; McDaid, D. Austerity and health in Europe. Health Policy 2013, 113, 13–19. [Google Scholar] [CrossRef] [PubMed] [Green Version]
- Dávila Quintana, C.D.; González López-Valcárcel, B. [The economic crisis and health]. Gac. Sanit. 2009, 23, 261–265. [Google Scholar] [CrossRef] [PubMed] [Green Version]
- Bacigalupe, A.; Escolar-Pujolar, A. The impact of economic crises on social inequalities in health: What do we know so far? Int. J. Equity Health 2014, 13, 52. [Google Scholar] [CrossRef] [PubMed] [Green Version]
- Bezruchka, S. The effect of economic recession on population health. Cmaj 2009, 181, 281–285. [Google Scholar] [CrossRef] [Green Version]
- Budhdeo, S.; Watkins, J.; Atun, R.; Williams, C.; Zeltner, T.; Maruthappu, M. Changes in government spending on healthcare and population mortality in the European union, 1995–2010: A cross-sectional ecological study. J. R. Soc. Med. 2015, 108, 490–498. [Google Scholar] [CrossRef] [Green Version]
- Bacigalupe, A.; Shahidi, F.V.; Muntaner, C.; Martín, U.; Borrell, C. Why is There so Much Controversy Regarding the Population Health Impact of the Great Recession? Reflections on Three Case Studies. Int. J. Health Serv. 2015, 46, 5–35. [Google Scholar] [CrossRef]
- Falagas, M.E.; Vouloumanou, E.K.; Mavros, M.N.; Karageorgopoulos, D.E. Economic crises and mortality: A review of the literature. Int. J. Clin. Pract. 2009, 63, 1128–1135. [Google Scholar] [CrossRef]
- Segura Benedicto, A. Recortes, austeridad y salud. Informe SESPAS 2014. Gac. Sanit. 2014, 28, 7–11. [Google Scholar] [CrossRef] [Green Version]
- Suhrcke, M.; Stuckler, D. Will the recession be bad for our health? It depends. Soc. Sci. Med. 2012, 74, 647–653. [Google Scholar] [CrossRef]
- Catalano, R.; Goldman-Mellor, S.; Saxton, K.; Margerison-Zilko, C.; Subbaraman, M.; LeWinn, K.; Anderson, E. The health effects of economic decline. Annu. Rev. Public Health 2011, 32, 431–450. [Google Scholar] [CrossRef] [PubMed] [Green Version]
- Parmar, D.; Stavropoulou, C.; Ioannidis, J.P.A. Health outcomes during the 2008 financial crisis in Europe: Systematic literature review. Br. Med. J. 2008, 354, 1–11. [Google Scholar] [CrossRef] [PubMed] [Green Version]
- Toffolutti, V.; Suhrcke, M. Assessing the short term health impact of the Great Recession in the European Union: A cross-country panel analysis. Prev. Med. (Baltim) 2014, 64, 54–62. [Google Scholar] [CrossRef] [PubMed]
- Tapia Granados, J.A.; Rodriguez, J.M. Health, economic crisis, and austerity: A comparison of Greece, Finland and Iceland. Health Policy (New York) 2015, 119, 941–953. [Google Scholar] [CrossRef] [PubMed]
- Coope, C.; Gunnell, D.; Hollingworth, W.; Hawton, K.; Kapur, N.; Fearn, V.; Metcalfe, C. Suicide and the 2008 economic recession: Who is most at risk? Trends in suicide rates in England and Wales 2001–2011. Soc. Sci. Med. 2014, 117, 76–85. [Google Scholar] [CrossRef] [PubMed]
- Haw, C.; Hawton, K.; Gunnell, D.; Platt, S. Economic recession and suicidal behaviour: Possible mechanisms and ameliorating factors. Int. J. Soc. Psychiatry 2015, 61, 73–81. [Google Scholar] [CrossRef]
- Stuckler, D.; Basu, S.; Suhrcke, M.; Coutts, A.; McKee, M. Effects of the 2008 recession on health: A first look at European data. Lancet 2011, 378, 124–125. [Google Scholar] [CrossRef]
- Regidor, E.; Barrio, G.; Bravo, M.J.; de la Fuente, L. Has health in Spain been declining since the economic crisis? J. Epidemiol. Community Health 2014, 68, 280–282. [Google Scholar] [CrossRef]
- Borrell, C.; Rodríguez-Sanz, M.; Malmusi, D.; Bartoll, X.; Novoa, A.M. The suffering of the population in the economic crisis of the Spanish State. Salud Colect. 2014, 10, 95–98. [Google Scholar] [CrossRef]
- Karanikolos, M.; Heino, P.; McKee, M.; Stuckler, D.; Legido-Quigley, H. Effects of the global financial crisis on health in high-income OECD countries: A narrative review. Int. J. Health Serv. 2016, 46, 208–240. [Google Scholar] [CrossRef]
- Lopez-Valcarcel, B.G.; Barber, P. Economic Crisis, Austerity Policies, Health and Fairness: Lessons Learned in Spain. Appl. Health Econ. Health Policy 2017, 15, 13–21. [Google Scholar] [CrossRef] [PubMed] [Green Version]
- Bartoll, X.; Palencia, L.; Malmusi, D.; Suhrcke, M.; Borrell, C. The evolution of mental health in Spain during the economic crisis. Eur. J. Public Health 2014, 24, 415–418. [Google Scholar] [CrossRef] [PubMed] [Green Version]
- Rodríguez-Fonseca, M.; Palència, L.; Marí-Dell’Olmo, M.; Gandarillas, A.; Domínguez-Berjón, M.F.; Gotsens, M.; Borrell, C. Evolution of socio-economic inequalities in mortality in small geographical areas of the two largest cities in Spain (Barcelona and Madrid), 1996–2007. Public Health 2013, 127, 916–921. [Google Scholar] [CrossRef] [PubMed]
- Maynou, L.; Saez, M.; Lopez-Casasnovas, G. Has the economic crisis widened the intraurban socioeconomic inequalities in mortality? The case of Barcelona, Spain. J. Epidemiol. Community Health 2016, 70, 114–124. [Google Scholar] [CrossRef] [PubMed]
- Marí-Dell’Olmo, M.; Gotsens, M.; Palència, L.; Burström, B.; Corman, D.; Costa, G.; Gandarillas, A. Socioeconomic inequalities in cause-specific mortality in 15 European cities. J. Epidemiol. Community Health 2015, 69, 432–441. [Google Scholar] [CrossRef] [Green Version]
- Santana, P.; Costa, C.; Marí-Dell’Olmo, M.; Gotsens, M.; Borrell, C. Mortality, material deprivation and urbanization: Exploring the social patterns of a metropolitan area. Int. J. Equity Health 2015, 14, 55. [Google Scholar] [CrossRef] [Green Version]
- Borrell, C.; Marí-Dell’Olmo, M.; Serral, G.; Martínez-Beneito, M.; Gotsens, M. Inequalities in mortality in small areas of eleven Spanish cities (the multicenter MEDEA project). Health Place 2010, 16, 703–711. [Google Scholar] [CrossRef]
- Gotsens, M.; Marí-Dell’Olmo, M.; Martínez-Beneito, M.A.; Pérez, K.; Pasarín, M.I.; Daponte, A.; Gandarillas, A. Socio-economic inequalities in mortality due to injuries in small areas of ten cities in Spain (MEDEA Project). Accid Anal Prev. 2011, 43, 1802–1810. [Google Scholar] [CrossRef]
- Pérez, G.; Gotsens, M.; Palència, L.; Marí-Dell’Olmo, M.; Domínguez-Berjón, M.F.; Rodríguez-Sanz, M.; Bacigalupe, A. Protocolo del estudio sobre el efecto de la crisis económica en la mortalidad, la salud reproductiva y las desigualdades en salud en España. Gac. Sanit. 2016, 30, 472–476. [Google Scholar] [CrossRef] [Green Version]
- INE. Censos de Población y Viviendas. Available online: http://www.ine.es/censo2001/internet.htm (accessed on 3 February 2020).
- Domínguez-Berjón, M.F.; Borrell, C.; Cano-Serral, G.; Esnaola, S.; Nolasco, A.; Pasarín, M.I.; Escolar-Pujolar, A. Construcción de un índice de privación a partir de datos censales en grandes ciudades españolas (Proyecto MEDEA). Gac. Sanit. 2008, 22, 179–187. [Google Scholar] [CrossRef] [Green Version]
- Besag, J.; York, J.; Mollié, A. Bayesian image restoration, with two applications in spatial statistics. Ann. Inst. Stat. Math. 1991, 43, 1–59. [Google Scholar] [CrossRef]
- R. Team. R: A Language and Environment for Statistical Computing; R Foundation for Statistical Computing: Vienna, Austria, 2012. [Google Scholar]
- Rue, H.; Martino, S. INLA: Functions Which Allow to Perform a Full Bayesian Analysis of Structured Additive Models Using Integrated Nested Laplace Approximation. R Package Version 0.0. 2009. Available online: https://www.r-inla.org (accessed on 23 January 2020).
- Barr, B.; Taylor-Robinson, D.; Scott-Samuel, A.; McKee, M.; Stuckler, D. Suicides associated with the 2008-10 economic recession in England: Time trend analysis. BMJ 2012, 345, e5142. [Google Scholar] [CrossRef] [PubMed] [Green Version]
- Baumbach, A.; Gulis, G. Impact of financial crisis on selected health outcomes in Europe. Eur. J. Public Health 2014, 24, 399–403. [Google Scholar] [CrossRef] [PubMed]
- Laanani, M.; Ghosn, W.; Jougla, E.; Rey, G. Impact of unemployment variations on suicide mortality in Western European countries (2000–2010). J. Epidemiol. Community Health 2015, 69, 103–109. [Google Scholar] [CrossRef] [PubMed] [Green Version]
- Santana, P.; Costa, C.; Cardoso, G.; Loureiro, A.; Ferrão, J. Suicide in Portugal: Spatial determinants in a context of economic crisis. Heal Place. Health Place 2015, 35, 85–94. [Google Scholar] [CrossRef] [Green Version]
- Isabel, R.P.; Miguel, R.B.; Antonio, R.G.; Oscar, M.G. Economic crisis and suicides in Spain. Socio-demographic and regional variability. Eur. J. Health Econ. 2016, 18, 313–320. [Google Scholar] [CrossRef]
- Alvarez-Galvez, J.; Salinas-Perez, J.A.; Rodero-Cosano, M.L.; Salvador-Carulla, L. Methodological barriers to studying the association between the economic crisis and suicide in Spain. BMC Public Health 2017, 17, 694. [Google Scholar] [CrossRef] [Green Version]
- Borrell, C.; Marí-Dell’Olmo, M.; Gotsens, M.; Calvo, M.; Rodríguez-Sanz, M.; Bartoll, X.; Esnaola, S. Socioeconomic inequalities in suicide mortality before and after the economic recession in Spain. BMC Public Health 2017, 17, 772. [Google Scholar] [CrossRef] [Green Version]
- Borrell, C.; Palència, L.; Marí Dell’Olmo, M.; Morrisson, J.; Deboosere, P.; Gotsens, M.; Rodríguez-Sanz, M. Socioeconomic inequalities in suicide mortality in European urban areas before and during the economic recession. Eur. J. Public Health 2019, 30, 92–98. [Google Scholar] [CrossRef]
- Ruiz-Ramos, M.; Córdoba-Doña, J.A.; Bacigalupe, A.; Juárez, S.; Escolar-Pujolar, A. Crisis económica al inicio del siglo XXI y mortalidad en España. Tendencia e impacto sobre las desigualdades sociales. Informe SESPAS 2014. Gac. Sanit. 2014, 28 (Suppl. S1), 89–96. [Google Scholar] [CrossRef] [Green Version]
- Valkonen, T. Changes in socioeconomic inequalities in mortality during an economic boom and recession among middle-aged men and women in Finland. Eur. J. Public Health 2000, 10, 274–280. [Google Scholar] [CrossRef] [Green Version]
- Regidor, E.; Vallejo, F.; Granados, J.A.T.; Viciana-Fernández, F.J.; de la Fuente, L.; Barrio, G. Mortality decrease according to socioeconomic groups during the economic crisis in Spain: A cohort study of 36 million people. Lancet 2016, 388, 2642–2652. Available online: http://linkinghub.elsevier.com/retrieve/pii/S0140673616304469 (accessed on 3 February 2020). [CrossRef]
- Gotsens, M.; Marí-Dell’Olmo, M.; Pérez, K.; Palència, L.; Martinez-Beneito, M.-A.; Rodríguez-Sanz, M.; Dzúrová, D. Socioeconomic inequalities in injury mortality in small areas of 15 European cities. Health Place 2013, 24, 165–172. [Google Scholar] [CrossRef] [Green Version]
- Courtenay, W.H. Constructions of masculinity and their influence on men’s well-being: A theory of gender and health. Soc. Sci. Med. 2000, 50, 1385–1401. [Google Scholar] [CrossRef]
- Möller-Leimkühler, A.M. The gender gap in suicide and premature death or: Why are men so vulnerable? Eur. Arch. Psychiatry Clin Neurosci. 2003, 253, 1–8. [Google Scholar] [CrossRef] [PubMed]
- CCOO de Industria. Los efectos de la crisis en el estado de las autonomías; CCOO de Industria: Madrid, Spain, 2016. [Google Scholar]
- Regidor, E.; Vallejo, F.; Granados, J.A.T.; Viciana-Fernández, F.J.; de la Fuente, L.; Barrio, G. Mortality decrease according to socioeconomic groups—Authors’ reply. Lancet 2017, 389, 1795. [Google Scholar] [CrossRef]
- Moya, A.Z.; Buffel, V.; Navarro Yáñez, C.J.; Bracke, P. Social inequality in morbidity, framed within the current economic crisis in Spain. Int. J. Equity Health 2015, 14, 131. [Google Scholar] [CrossRef] [Green Version]
- Maynou, L.; Saez, M. Economic crisis and health inequalities: Evidence from the European Union. Int. J. Equity Health 2016, 15, 135. [Google Scholar] [CrossRef] [Green Version]
- Rodríguez-Sanz, M.; Gotsens, M.; Marí-Dell’Olmo, M.; Mehdipanah, R.; Borrell, C. Twenty years of socioeconomic inequalities in premature mortality in Barcelona: The influence of population and neighbourhood changes. Health Place 2016, 39, 142–152. [Google Scholar] [CrossRef]
- Nello, O. The challenges of urban renewal. Ten lessons from the Catalan experience. Anal. Soc. 2010. [Google Scholar]
- Norman, P.; Boyle, P.; Exeter, D.; Feng, Z.; Popham, F. Rising premature mortality in the UK’s persistently deprived areas: Only a Scottish phenomenon? Soc. Sci. Med. 2011, 73, 1575–1584. [Google Scholar] [CrossRef] [PubMed]
- Thomson, H. A dose of realism for healthy urban policy: Lessons from area-based initiatives in the UK. J. Epidemiol. Community Health 2008, 62, 932–936. [Google Scholar] [CrossRef] [PubMed]
- Richardson, S.; Thomson, A.; Best, N.; Elliott, P. Interpreting posterior relative risk estimates in disease-mapping studies. Environ. Health Perspect. 2004, 112, 1016–1025. [Google Scholar] [CrossRef] [PubMed]


| Infectious and Parasitic Diseases | Diabetes | Ischemic Heart Diseases | Cerebrovascular Diseases | Cirrhosis | Suicide | Traffic Injuries | All Causes | |||||||||||
|---|---|---|---|---|---|---|---|---|---|---|---|---|---|---|---|---|---|---|
| Cities (No. Census Tract) | Period | Pob | N | ASMR | N | ASMR | N | ASMR | N | ASMR | N | ASMR | N | ASMR | N | ASMR | N | ASMR |
| Barcelona (1491) | 2001–2004 | 293,6440 | 799 | 26.9 | 725 | 25.0 | 3565 | 122.3 | 2187 | 77.4 | 672 | 21.8 | 342 | 11.4 | 285 | 9.7 | 32,128 | 1105.9 |
| 2005–2008 | 304,6533 | 768 | 24.3 | 702 | 22.6 | 3047 | 98.5 | 1957 | 63.8 | 553 | 17.4 | 339 | 10.6 | 195 | 6.5 | 31,247 | 1011.1 | |
| 2009–2012 | 308,3469 | 609 | 18.1 | 648 | 18.9 | 2835 | 84.4 | 1658 | 48.6 | 557 | 17.1 | 332 | 10.2 | 134 | 4.3 | 29,724 | 883.9 | |
| Bilbao (288) | 2001–2004 | 657,840 | 174 | 26.5 | 129 | 21.7 | 698 | 113.0 | 549 | 91.4 | 174 | 25.0 | 78 | 11.5 | 84 | 13.0 | 7282 | 1177.0 |
| 2005–2008 | 658,272 | 177 | 25.0 | 131 | 19.0 | 710 | 101.5 | 530 | 77.9 | 161 | 22.2 | 82 | 11.5 | 46 | 7.0 | 7350 | 1065.5 | |
| 2009–2012 | 660,882 | 119 | 15.1 | 145 | 18.7 | 729 | 94.0 | 470 | 61.3 | 152 | 19.5 | 69 | 9.8 | 43 | 6.3 | 7392 | 963.3 | |
| San Sebastian (140) | 2001–2004 | 333,822 | 81 | 26.1 | 66 | 23.7 | 318 | 106.5 | 226 | 79.3 | 76 | 22.8 | 37 | 11.3 | 53 | 16.1 | 3346 | 1131.8 |
| 2005–2008 | 336,108 | 68 | 19.9 | 63 | 18.9 | 283 | 84.4 | 217 | 66.5 | 88 | 23.6 | 42 | 11.8 | 38 | 11.0 | 3419 | 1018.2 | |
| 2009–2012 | 339,319 | 51 | 13.6 | 82 | 22.6 | 271 | 72.1 | 221 | 60.0 | 59 | 15.0 | 34 | 9.6 | 17 | 5.1 | 3353 | 904.6 | |
| Vitoria (168) | 2001–2004 | 429,826 | 89 | 25.5 | 58 | 19.4 | 282 | 88.3 | 233 | 80.4 | 84 | 21.7 | 59 | 14.4 | 86 | 20.9 | 3426 | 1074.5 |
| 2005–2008 | 451,026 | 82 | 21.4 | 84 | 23.3 | 288 | 75.0 | 227 | 63.1 | 100 | 23.5 | 66 | 15.1 | 49 | 11.4 | 3680 | 971.6 | |
| 2009–2012 | 468,668 | 59 | 12.9 | 75 | 17.6 | 306 | 68.9 | 206 | 48.1 | 94 | 20.0 | 62 | 12.6 | 24 | 5.1 | 3808 | 864.0 | |
| Madrid (2358) | 2001–2004 | 5,498,348 | 1235 | 23.4 | 664 | 14.3 | 5788 | 119.4 | 3037 | 64.9 | 1056 | 19.8 | 432 | 7.9 | 554 | 9.9 | 54,053 | 1112.1 |
| 2005–2008 | 5,668,478 | 1132 | 20.1 | 595 | 11.6 | 5262 | 100.2 | 2810 | 54.4 | 915 | 16.4 | 240 | 4.1 | 355 | 6.2 | 53,087 | 1008.3 | |
| 2009–2012 | 5,776,884 | 1098 | 18.3 | 649 | 11.2 | 4427 | 76.6 | 2349 | 40.7 | 728 | 12.4 | 126 | 2.1 | 107 | 1.8 | 50,979 | 883.9 | |
| Granada (181) | 2001–2004 | 441,668 | 114 | 28.4 | 78 | 21.3 | 599 | 164.2 | 348 | 99.2 | 130 | 31.9 | 56 | 13.2 | 69 | 15.0 | 4285 | 1169.1 |
| 2005–2008 | 439,300 | 118 | 28.3 | 90 | 23.5 | 509 | 132.0 | 345 | 91.2 | 143 | 34.1 | 50 | 11.7 | 53 | 12.0 | 4409 | 1128.9 | |
| 2009–2012 | 446,516 | 72 | 15.8 | 103 | 23.7 | 536 | 122.1 | 298 | 69.2 | 101 | 22.6 | 88 | 19.6 | 22 | 4.9 | 4217 | 969.3 | |
| Sevilla (510) | 2001–2004 | 1,357,036 | 292 | 24.3 | 169 | 17.9 | 1808 | 188.6 | 1398 | 161.7 | 321 | 27.3 | 145 | 11.5 | 154 | 11.1 | 11,655 | 1193.8 |
| 2005–2008 | 1,332,728 | 318 | 26.4 | 182 | 18.1 | 1463 | 141.9 | 1309 | 137.0 | 319 | 26.1 | 130 | 10.2 | 104 | 7.8 | 12,017 | 1155.8 | |
| 2009–2012 | 1,337,716 | 260 | 20.8 | 193 | 18.1 | 1242 | 110.7 | 1002 | 94.6 | 323 | 25.1 | 115 | 9.0 | 56 | 4.3 | 11,836 | 1051.5 | |
| Infectious and Parasitic Diseases | Diabetes | Ischemic Heart Diseases | Cerebrovascular Diseases | Cirrhosis | Suicide | Traffic Injuries | All Causes | |||||||||||
|---|---|---|---|---|---|---|---|---|---|---|---|---|---|---|---|---|---|---|
| Cities (No. Census Tract) | Period | Pob | N | ASMR | N | ASMR | N | ASMR | N | ASMR | N | ASMR | N | ASMR | N | ASMR | N | ASMR |
| Barcelona (1491) | 2001–2004 | 3,298,056 | 723 | 15.2 | 959 | 17.0 | 2878 | 49.8 | 3441 | 59.0 | 443 | 9.6 | 163 | 4.4 | 146 | 4.0 | 33,501 | 614.0 |
| 2005–2008 | 3,375,674 | 749 | 14.0 | 885 | 14.2 | 2336 | 37.2 | 2949 | 46.1 | 409 | 8.7 | 157 | 4.1 | 67 | 1.8 | 32,914 | 557.0 | |
| 2009–2012 | 3,406,659 | 655 | 10.9 | 789 | 11.5 | 2102 | 29.8 | 2510 | 35.7 | 381 | 7.8 | 159 | 4.3 | 62 | 1.5 | 32,306 | 501.6 | |
| Bilbao (288) | 2001–2004 | 730,202 | 136 | 14.3 | 177 | 15.6 | 504 | 44.6 | 731 | 64.2 | 94 | 9.9 | 29 | 3.6 | 42 | 5.5 | 6935 | 636.7 |
| 2005–2008 | 734,570 | 134 | 11.9 | 189 | 14.4 | 463 | 35.3 | 691 | 52.2 | 61 | 6.0 | 50 | 6.0 | 17 | 1.7 | 7050 | 567.0 | |
| 2009–2012 | 738,067 | 147 | 10.8 | 167 | 10.6 | 447 | 29.6 | 645 | 41.6 | 76 | 7.0 | 33 | 3.7 | 9 | 1.2 | 7224 | 502.4 | |
| San Sebastian (140) | 2001–2004 | 375,249 | 68 | 11.7 | 89 | 14.7 | 254 | 40.9 | 399 | 65.4 | 30 | 6.0 | 29 | 6.7 | 23 | 5.1 | 3664 | 619.8 |
| 2005–2008 | 380,058 | 70 | 10.7 | 72 | 10.7 | 224 | 31.8 | 361 | 51.8 | 26 | 4.9 | 8 | 2.1 | 13 | 3.0 | 3625 | 538.3 | |
| 2009–2012 | 385,302 | 50 | 6.5 | 93 | 11.8 | 191 | 22.4 | 308 | 37.5 | 35 | 6.1 | 18 | 3.4 | 9 | 1.7 | 3824 | 504.8 | |
| Vitoria (168) | 2001–2004 | 443,772 | 71 | 14.6 | 87 | 17.6 | 203 | 40.7 | 294 | 58.0 | 36 | 7.9 | 16 | 3.6 | 23 | 5.1 | 3094 | 622.6 |
| 2005–2008 | 463,781 | 66 | 11.8 | 117 | 18.7 | 209 | 34.6 | 269 | 43.3 | 29 | 5.7 | 16 | 3.2 | 13 | 2.5 | 3231 | 541.2 | |
| 2009–2012 | 482,422 | 50 | 6.9 | 100 | 12.9 | 227 | 28.8 | 261 | 35.2 | 35 | 6.0 | 12 | 2.2 | 11 | 2.5 | 3417 | 475.9 | |
| Madrid (2358) | 2001–2004 | 6,273,028 | 932 | 11.3 | 1038 | 10.9 | 4949 | 51.9 | 4762 | 49.8 | 589 | 7.4 | 193 | 2.8 | 230 | 3.6 | 52,832 | 581.0 |
| 2005–2008 | 6,437,031 | 1017 | 11.1 | 901 | 8.6 | 4532 | 43.2 | 4266 | 40.7 | 405 | 4.9 | 95 | 1.4 | 141 | 2.1 | 54,214 | 544.5 | |
| 2009–2012 | 6,599,904 | 1045 | 10.0 | 983 | 8.1 | 3934 | 33.0 | 3758 | 31.5 | 361 | 4.0 | 34 | 0.5 | 41 | 0.6 | 54,534 | 492.0 | |
| Granada (181) | 2001–2004 | 508,984 | 63 | 10.7 | 102 | 16.3 | 473 | 74.8 | 481 | 74.6 | 76 | 13.1 | 27 | 5.1 | 19 | 3.6 | 4206 | 678.1 |
| 2005–2008 | 505,528 | 93 | 14.2 | 103 | 14.7 | 435 | 60.7 | 499 | 68.9 | 54 | 8.6 | 36 | 6.6 | 10 | 2.0 | 4547 | 658.1 | |
| 2009–2012 | 513,880 | 60 | 8.0 | 113 | 14.3 | 574 | 68.3 | 430 | 51.8 | 52 | 8.1 | 27 | 4.9 | 6 | 1.3 | 4561 | 581.9 | |
| Sevilla (510) | 2001–2004 | 1,482,864 | 181 | 11.3 | 270 | 15.9 | 1457 | 85.6 | 2583 | 147.7 | 112 | 7.2 | 48 | 3.1 | 45 | 3.1 | 11,545 | 684.0 |
| 2005–2008 | 1,463,852 | 188 | 11.0 | 310 | 16.8 | 1101 | 59.9 | 2207 | 115.7 | 115 | 7.1 | 51 | 3.3 | 23 | 1.6 | 11,805 | 650.7 | |
| 2009–2012 | 1,474,368 | 194 | 10.3 | 232 | 10.8 | 1078 | 52.7 | 1583 | 74.1 | 115 | 6.6 | 56 | 3.7 | 14 | 1.0 | 12,056 | 599.6 | |
| Infectious and Parasitic Diseases | Diabetes | Ischemic Heart Diseases | Cerebrovascular Diseases | Cirrhosis | Suicide | Traffic Injuries | All Causes | ||||||||||
|---|---|---|---|---|---|---|---|---|---|---|---|---|---|---|---|---|---|
| Cities (No. Census Tract) | Period | RR | 95%CI | RR | 95%CI | RR | 95%CI | RR | 95%CI | RR | 95%CI | RR | 95%CI | RR | 95%CI | RR | 95%CI |
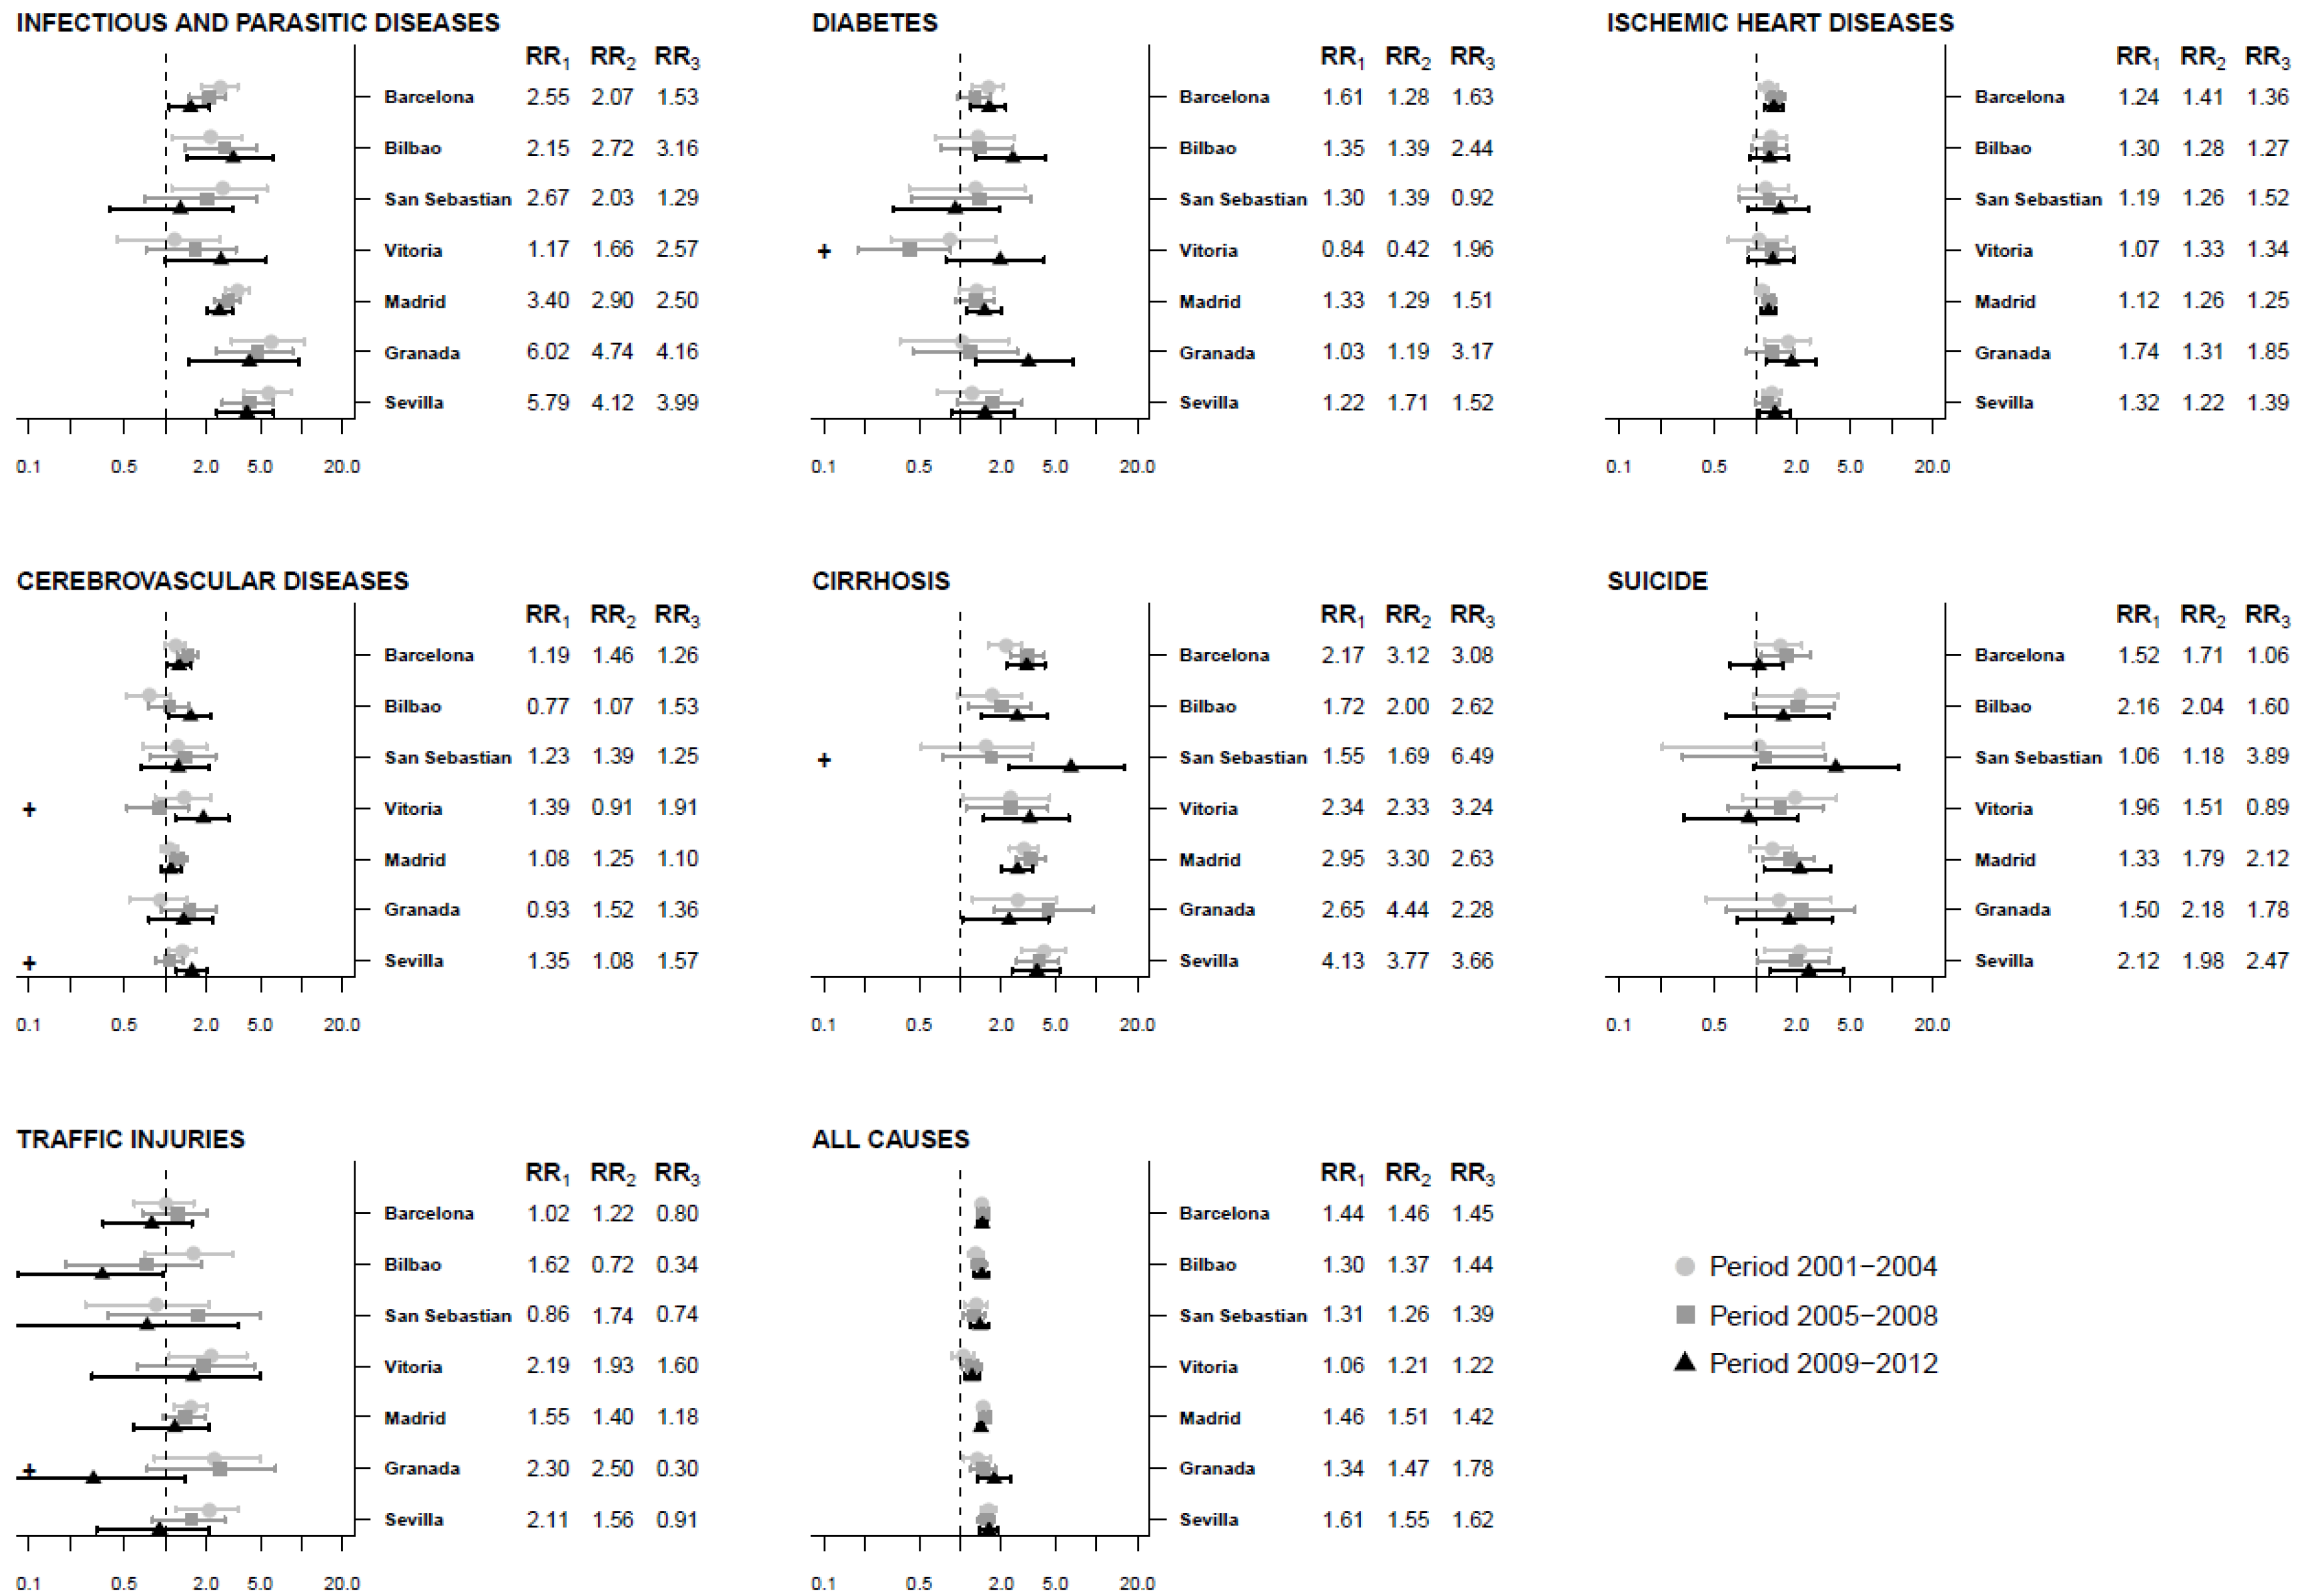
| Barcelona (1491) | 2001–2004 | 2.55 | (1.85–3.41) | 1.61 | (1.23–2.05) | 1.24 | (1.08–1.44) | 1.19 | (0.99–1.41) | 2.17 | (1.60–2.86) | 1.52 | (1.00–2.19) | 1.02 | (0.59–1.63) | 1.44 | (1.36–1.53) |
| 2005–2008 | 2.07 | (1.51–2.79) | 1.28 | (0.96–1.66) | 1.41 | (1.22–1.64) | 1.46 | (1.22–1.73) | 3.12 | (2.31–4.11) | 1.71 | (1.11–2.54) | 1.22 | (0.68–2.02) | 1.46 | (1.37–1.55) | |
| 2009–2012 | 1.53 | (1.07–2.10) | 1.63 | (1.19–2.16) | 1.36 | (1.16–1.59) | 1.26 | (1.02–1.55) | 3.08 | (2.18–4.16) | 1.06 | (0.66–1.59) | 0.80 | (0.35–1.56) | 1.45 | (1.35–1.55) | |
| Bilbao (288) | 2001–2004 | 2.15 | (1.13–3.67) | 1.35 | (0.65–2.46) | 1.30 | (0.97–1.72) | 0.77 | (0.53–1.10) | 1.72 | (0.95–2.85) | 2.16 | (0.98–4.05) | 1.62 | (0.70–3.13) | 1.30 | (1.13–1.48) |
| 2005–2008 | 2.72 | (1.41–4.64) | 1.39 | (0.72–2.45) | 1.28 | (0.94–1.70) | 1.07 | (0.76–1.49) | 2.00 | (1.15–3.26) | 2.04 | (0.96–3.79) | 0.72 | (0.19–1.86) | 1.37 | (1.21–1.54) | |
| 2009–2012 | 3.16 | (1.46–6.12) | 2.44 | (1.31–4.17) | 1.27 | (0.90–1.74) | 1.53 | (1.06–2.16) | 2.62 | (1.43–4.35) | 1.60 | (0.60–3.48) | 0.34 | (0.08–0.96) | 1.44 | (1.27–1.63) | |
| San Sebastian (140) | 2001–2004 | 2.67 | (1.11–5.61) | 1.30 | (0.42–2.97) | 1.19 | (0.76–1.75) | 1.23 | (0.69–2.01) | 1.55 | (0.52–3.39) | 1.06 | (0.21–3.15) | 0.86 | (0.26–2.09) | 1.31 | (1.07–1.58) |
| 2005–2008 | 2.03 | (0.71–4.67) | 1.39 | (0.44–3.30) | 1.26 | (0.77–1.96) | 1.39 | (0.77–2.34) | 1.69 | (0.75–3.31) | 1.18 | (0.29–3.27) | 1.74 | (0.38–5.02) | 1.26 | (1.05–1.50) | |
| 2009–2012 | 1.29 | (0.40–3.09) | 0.92 | (0.32–1.97) | 1.52 | (0.89–2.44) | 1.25 | (0.66–2.11) | 6.49 | (2.29–15.86) | 3.89 | (0.98–11.31) | 0.74 | (0.04–3.45) | 1.39 | (1.19–1.62) | |
| Vitoria (168) | 2001–2004 | 1.17 | (0.44–2.51) | 0.84 | (0.31–1.83) | 1.07 | (0.63–1.68) | 1.39 | (0.84–2.16) | 2.34 | (1.05–4.54) | 1.96 | (0.81–3.95) | 2.19 | (1.07–3.95) | 1.06 | (0.87–1.26) |
| 2005–2008 | 1.66 | (0.72–3.30) | 0.42 | (0.18–0.85) | 1.33 | (0.87–1.94) | 0.91 | (0.52–1.47) | 2.33 | (1.11–4.39) | 1.51 | (0.63–3.10) | 1.93 | (0.62–4.50) | 1.21 | (1.02–1.43) | |
| 2009–2012 | 2.57 | (1.00–5.52) | 1.96 | (0.78–4.14) | 1.34 | (0.89–1.94) | 1.91 | (1.18–2.93) | 3.24 | (1.48–6.26) | 0.89 | (0.30–2.07) | 1.60 | (0.29–5.00) | 1.22 | (1.07–1.39) | |
| Madrid (2358) | 2001–2004 | 3.40 | (2.76–4.16) | 1.33 | (0.98–1.78) | 1.12 | (1.00–1.26) | 1.08 | (0.94–1.23) | 2.95 | (2.30–3.72) | 1.33 | (0.91–1.89) | 1.55 | (1.16–2.03) | 1.46 | (1.39–1.53) |
| 2005–2008 | 2.90 | (2.32–3.59) | 1.29 | (0.91–1.77) | 1.26 | (1.12–1.42) | 1.25 | (1.08–1.43) | 3.30 | (2.58–4.18) | 1.79 | (1.15–2.67) | 1.40 | (0.98–1.95) | 1.51 | (1.44–1.58) | |
| 2009–2012 | 2.50 | (2.01–3.09) | 1.51 | (1.12–1.99) | 1.25 | (1.10–1.41) | 1.10 | (0.93–1.30) | 2.63 | (2.02–3.38) | 2.12 | (1.15–3.60) | 1.18 | (0.59–2.09) | 1.42 | (1.35–1.49) | |
| Granada (181) | 2001–2004 | 6.02 | (3.08–10.47) | 1.03 | (0.36–2.25) | 1.74 | (1.15–2.51) | 0.93 | (0.54–1.44) | 2.65 | (1.23–5.06) | 1.50 | (0.43–3.61) | 2.30 | (0.83–5.01) | 1.34 | (1.05–1.66) |
| 2005–2008 | 4.74 | (2.37–8.67) | 1.19 | (0.45–2.61) | 1.31 | (0.86–1.89) | 1.52 | (0.93–2.37) | 4.44 | (1.78–9.50) | 2.18 | (0.61–5.36) | 2.50 | (0.74–6.48) | 1.47 | (1.19–1.80) | |
| 2009–2012 | 4.16 | (1.48–9.56) | 3.17 | (1.31–6.69) | 1.85 | (1.19–2.77) | 1.36 | (0.76–2.25) | 2.28 | (1.03–4.43) | 1.78 | (0.74–3.64) | 0.30 | (0.01–1.41) | 1.78 | (1.33–2.33) | |
| Sevilla (510) | 2001–2004 | 5.79 | (3.76–8.58) | 1.22 | (0.67–2.00) | 1.32 | (1.13–1.54) | 1.35 | (1.05–1.70) | 4.13 | (2.82–5.87) | 2.12 | (1.18–3.55) | 2.11 | (1.19–3.49) | 1.61 | (1.44–1.81) |
| 2005–2008 | 4.12 | (2.62–6.19) | 1.71 | (0.95–2.85) | 1.22 | (0.98–1.51) | 1.08 | (0.85–1.34) | 3.77 | (2.60–5.32) | 1.98 | (1.05–3.46) | 1.56 | (0.81–2.74) | 1.55 | (1.36–1.76) | |
| 2009–2012 | 3.99 | (2.39–6.29) | 1.52 | (0.86–2.50) | 1.39 | (1.06–1.80) | 1.57 | (1.21–2.02) | 3.66 | (2.38–5.38) | 2.47 | (1.27–4.37) | 0.91 | (0.31–2.09) | 1.62 | (1.38–1.89) | |
| Infectious and Parasitic Diseases | Diabetes | Ischemic Heart Diseases | Cerebrovascular Diseases | Cirrhosis | Suicide | Traffic Injuries | All Causes | ||||||||||
|---|---|---|---|---|---|---|---|---|---|---|---|---|---|---|---|---|---|
| Cities (No. Census Tract) | Period | RR | 95%CI | RR | 95%CI | RR | 95%CI | RR | 95%CI | RR | 95%CI | RR | 95%CI | RR | 95%CI | RR | 95%CI |
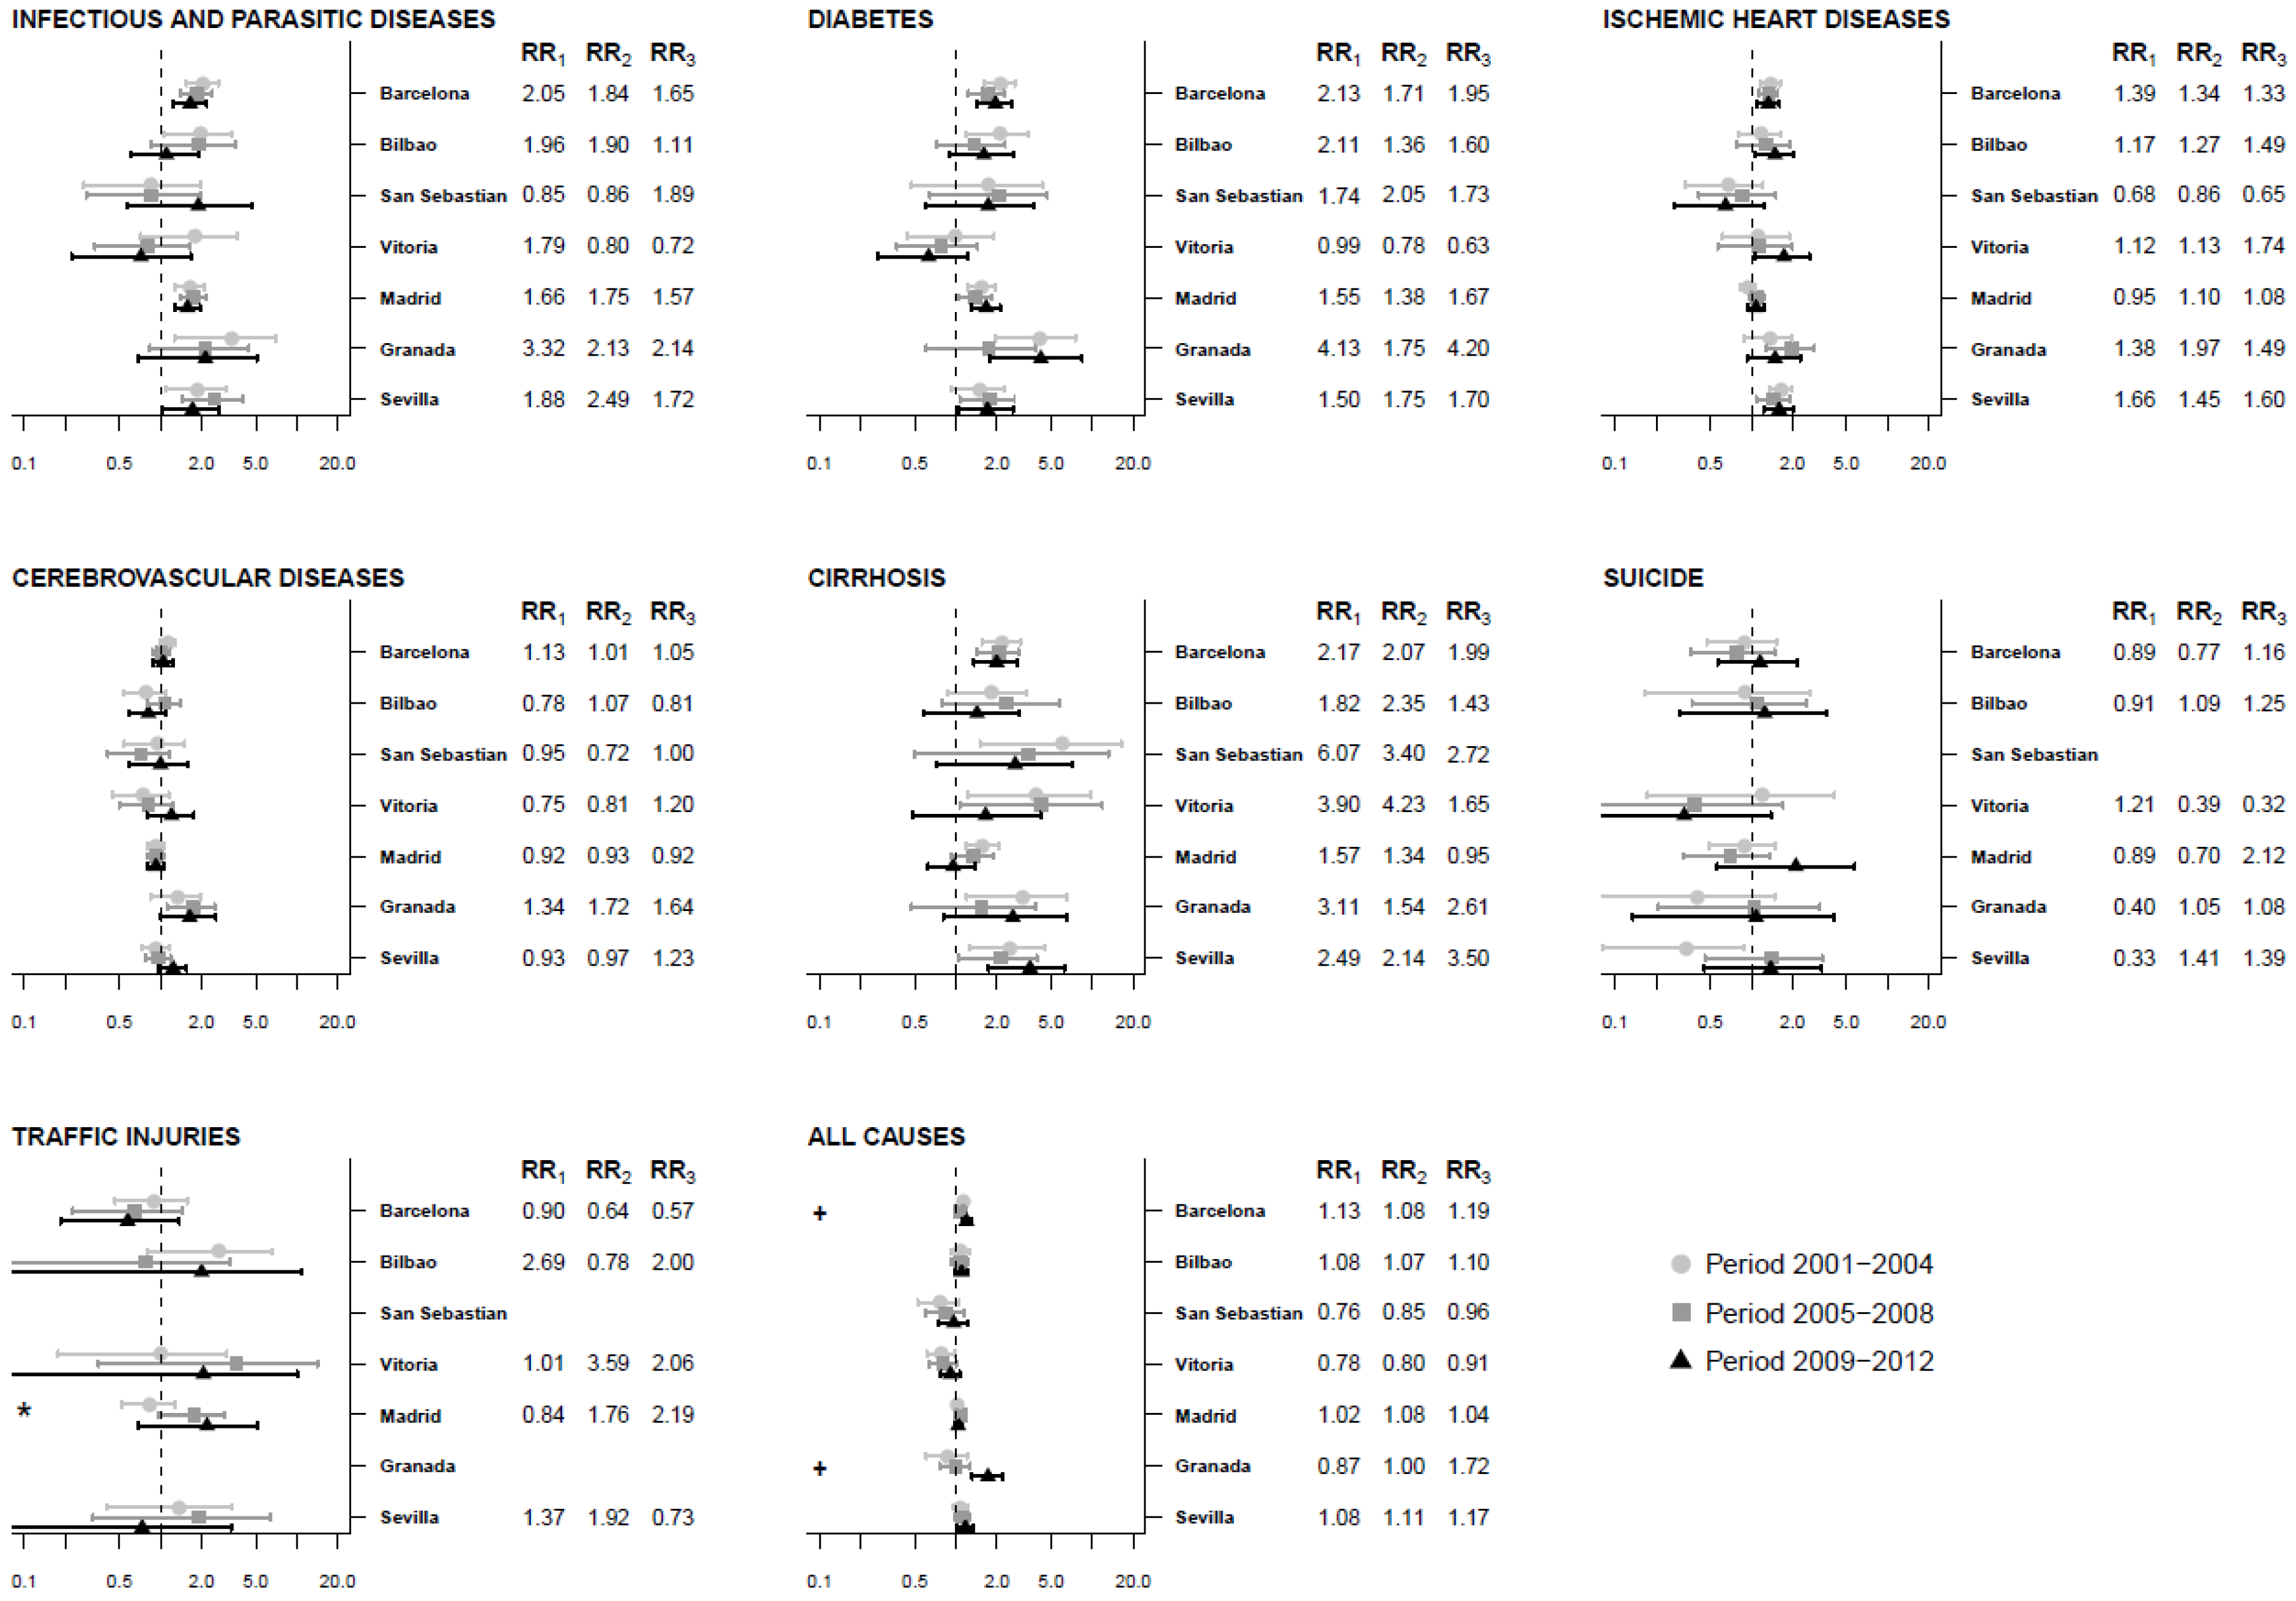
| Barcelona (1491) | 2001–2004 | 2.05 | (1.54–2.66) | 2.13 | (1.63–2.70) | 1.39 | (1.17–1.62) | 1.13 | (0.99–1.28) | 2.17 | (1.54–2.97) | 0.89 | (0.47–1.52) | 0.90 | (0.46–1.56) | 1.13 | (1.06–1.20) |
| 2005–2008 | 1.84 | (1.40–2.40) | 1.71 | (1.24–2.25) | 1.34 | (1.14–1.56) | 1.01 | (0.87–1.17) | 2.07 | (1.43–2.89) | 0.77 | (0.36–1.48) | 0.64 | (0.23–1.45) | 1.08 | (1.00–1.15) | |
| 2009–2012 | 1.65 | (1.23–2.17) | 1.95 | (1.42–2.56) | 1.33 | (1.10–1.61) | 1.05 | (0.88–1.24) | 1.99 | (1.36–2.81) | 1.16 | (0.56–2.18) | 0.57 | (0.18–1.37) | 1.19 | (1.10–1.29) | |
| Bilbao (288) | 2001–2004 | 1.96 | (1.06–3.33) | 2.11 | (1.20–3.39) | 1.17 | (0.81–1.64) | 0.78 | (0.54–1.09) | 1.82 | (0.87–3.33) | 0.91 | (0.17–2.69) | 2.69 | (0.79–6.54) | 1.08 | (0.91–1.25) |
| 2005–2008 | 1.90 | (0.85–3.52) | 1.36 | (0.72–2.30) | 1.27 | (0.78–1.92) | 1.07 | (0.81–1.40) | 2.35 | (0.80–5.70) | 1.09 | (0.37–2.56) | 0.78 | (0.07–3.20) | 1.07 | (0.91–1.24) | |
| 2009–2012 | 1.11 | (0.60–1.89) | 1.60 | (0.90–2.65) | 1.49 | (1.05–2.04) | 0.81 | (0.59–1.09) | 1.43 | (0.59–2.94) | 1.25 | (0.29–3.52) | 2.00 | (0.03–10.87) | 1.10 | (0.97–1.24) | |
| San Sebastian (140) | 2001–2004 | 0.85 | (0.27–1.97) | 1.74 | (0.47–4.28) | 0.68 | (0.33–1.21) | 0.95 | (0.54–1.50) | 6.07 | (1.50–16.39) | 0.76 | (0.52–1.06) | ||||
| 2005–2008 | 0.86 | (0.28–1.98) | 2.05 | (0.64–4.70) | 0.86 | (0.41–1.52) | 0.72 | (0.41–1.16) | 3.40 | (0.49–13.19) | 0.85 | (0.60–1.14) | |||||
| 2009–2012 | 1.89 | (0.57–4.68) | 1.73 | (0.59–3.78) | 0.65 | (0.28–1.24) | 1.00 | (0.58–1.59) | 2.72 | (0.72–7.19) | 0.96 | (0.75–1.21) | |||||
| Vitoria (168) | 2001–2004 | 1.79 | (0.72–3.68) | 0.99 | (0.44–1.91) | 1.12 | (0.61–1.89) | 0.75 | (0.44–1.15) | 3.90 | (1.22–9.68) | 1.21 | (0.17–4.08) | 1.01 | (0.18–3.07) | 0.78 | (0.61–0.98) |
| 2005–2008 | 0.80 | (0.33–1.64) | 0.78 | (0.37–1.44) | 1.13 | (0.57–2.00) | 0.81 | (0.50–1.25) | 4.23 | (1.06–11.86) | 0.39 | (0.02–1.71) | 3.59 | (0.35–14.17) | 0.80 | (0.63–1.00) | |
| 2009–2012 | 0.72 | (0.22–1.67) | 0.63 | (0.27–1.22) | 1.74 | (1.07–2.67) | 1.20 | (0.79–1.75) | 1.65 | (0.48–4.19) | 0.32 | (0.02–1.39) | 2.06 | (0.08–10.08) | 0.91 | (0.77–1.07) | |
| Madrid (2358) | 2001–2004 | 1.66 | (1.28–2.11) | 1.55 | (1.22–1.93) | 0.95 | (0.83–1.07) | 0.92 | (0.81–1.05) | 1.57 | (1.17–2.07) | 0.89 | (0.49–1.50) | 0.84 | (0.51–1.27) | 1.02 | (0.97–1.08) |
| 2005–2008 | 1.75 | (1.39–2.17) | 1.38 | (1.04–1.80) | 1.10 | (0.96–1.25) | 0.93 | (0.81–1.07) | 1.34 | (0.92–1.88) | 0.70 | (0.32–1.35) | 1.76 | (0.95–2.97) | 1.08 | (1.03–1.14) | |
| 2009–2012 | 1.57 | (1.26–1.95) | 1.67 | (1.29–2.11) | 1.08 | (0.93–1.25) | 0.92 | (0.80–1.06) | 0.95 | (0.62–1.38) | 2.12 | (0.56–5.74) | 2.19 | (0.69–5.20) | 1.04 | (0.98–1.10) | |
| Granada (181) | 2001–2004 | 3.32 | (1.26–7.01) | 4.13 | (1.97–7.54) | 1.38 | (0.88–1.99) | 1.34 | (0.84–1.96) | 3.11 | (1.19–6.52) | 0.40 | (0.04–1.48) | 0.87 | (0.60–1.20) | ||
| 2005–2008 | 2.13 | (0.83–4.45) | 1.75 | (0.61–3.82) | 1.97 | (1.30–2.88) | 1.72 | (1.12–2.50) | 1.54 | (0.47–3.85) | 1.05 | (0.21–3.17) | 1.00 | (0.76–1.26) | |||
| 2009–2012 | 2.14 | (0.69–5.09) | 4.20 | (1.77–8.46) | 1.49 | (0.93–2.28) | 1.64 | (1.00–2.55) | 2.61 | (0.81–6.56) | 1.08 | (0.13–4.06) | 1.72 | (1.31–2.22) | |||
| Sevilla (510) | 2001–2004 | 1.88 | (1.10–3.00) | 1.50 | (0.92–2.27) | 1.66 | (1.36–1.99) | 0.93 | (0.72–1.17) | 2.49 | (1.24–4.47) | 0.33 | (0.08–0.87) | 1.37 | (0.41–3.38) | 1.08 | (0.95–1.22) |
| 2005–2008 | 2.49 | (1.44–4.03) | 1.75 | (1.07–2.69) | 1.45 | (1.09–1.91) | 0.97 | (0.77–1.18) | 2.14 | (1.05–3.93) | 1.41 | (0.45–3.32) | 1.92 | (0.32–6.38) | 1.11 | (0.97–1.27) | |
| 2009–2012 | 1.72 | (1.03–2.68) | 1.70 | (1.04–2.64) | 1.60 | (1.23–2.03) | 1.23 | (0.96–1.54) | 3.50 | (1.73–6.27) | 1.39 | (0.45–3.29) | 0.73 | (0.05–3.32) | 1.17 | (1.01–1.35) | |
© 2020 by the authors. Licensee MDPI, Basel, Switzerland. This article is an open access article distributed under the terms and conditions of the Creative Commons Attribution (CC BY) license (http://creativecommons.org/licenses/by/4.0/).
Share and Cite
Gotsens, M.; Ferrando, J.; Marí-Dell’Olmo, M.; Palència, L.; Bartoll, X.; Gandarillas, A.; Sanchez-Villegas, P.; Esnaola, S.; Daponte, A.; Borrell, C. Effect of the Financial Crisis on Socioeconomic Inequalities in Mortality in Small Areas in Seven Spanish Cities. Int. J. Environ. Res. Public Health 2020, 17, 958. https://doi.org/10.3390/ijerph17030958
Gotsens M, Ferrando J, Marí-Dell’Olmo M, Palència L, Bartoll X, Gandarillas A, Sanchez-Villegas P, Esnaola S, Daponte A, Borrell C. Effect of the Financial Crisis on Socioeconomic Inequalities in Mortality in Small Areas in Seven Spanish Cities. International Journal of Environmental Research and Public Health. 2020; 17(3):958. https://doi.org/10.3390/ijerph17030958
Chicago/Turabian StyleGotsens, Mercè, Josep Ferrando, Marc Marí-Dell’Olmo, Laia Palència, Xavier Bartoll, Ana Gandarillas, Pablo Sanchez-Villegas, Santi Esnaola, Antonio Daponte, and Carme Borrell. 2020. "Effect of the Financial Crisis on Socioeconomic Inequalities in Mortality in Small Areas in Seven Spanish Cities" International Journal of Environmental Research and Public Health 17, no. 3: 958. https://doi.org/10.3390/ijerph17030958