Predictive Model of the Risk of In-Hospital Mortality in Colorectal Cancer Surgery, Based on the Minimum Basic Data Set

 ,
,  , , , ,
Abstract
:1. Introduction
2. Materials and Methods
2.1. Data Sources
2.2. Variables
2.3. Statistical Analysis
3. Results
4. Discussion
4.1. Findings
4.2. Comparison with Previous Studies
4.3. Strengths of the Study
4.4. Potential Limitations
4.5. Implications
5. Conclusions
Author Contributions
Funding
Conflicts of Interest
Disclaimer
References
- Arnold, M.; Sierra, M.S.; Laversanne, M.; Soerjomataram, I.; Jemal, A.; Bray, F. Global patterns and trends in colorectal cancer incidence and mortality. Gut 2016, 66, 683–691. [Google Scholar] [CrossRef] [Green Version]
- Siegel, R.L.; Miller, K.D.; Fedewa, S.A.; Ahnen, D.J.; Meester, R.G.; Barzi, A.; Jemal, A. Colorectal cancer statistics, 2017. CA Cancer J. Clin. 2017, 67, 177–193. [Google Scholar] [CrossRef]
- Baré, M.; Mora, L.; Torà, N.; Gil, M.J.; Barrio, I.; Collera, P.; Suárez, D.; Redondo, M.; Escobar, A.; De Larrea, N.F.; et al. CCR-CARESS score for predicting operative mortality in patients with colorectal cancer. BJS 2018, 105, 1853–1861. [Google Scholar] [CrossRef]
- Copeland, G.P.; Jones, D.; Walters, M. POSSUM: A scoring system for surgical audit. BJS 1991, 78, 355–360. [Google Scholar] [CrossRef]
- Tez, M.; Yoldas, O.; Gocmen, E.; Külah, B.; Koc, M.; Kulah, B. Evaluation of P-POSSUM and CR-POSSUM Scores in Patients with Colorectal Cancer Undergoing Resection. World J. Surg. 2006, 30, 2266–2269. [Google Scholar] [CrossRef] [PubMed]
- Bromage, S.J.; Cunliffe, W.J. Validation of the CR-POSSUM Risk-Adjusted Scoring System for Major Colorectal Cancer Surgery in a Single Center. Dis. Colon Rectum 2007, 50, 192–196. [Google Scholar] [CrossRef] [PubMed]
- Cohen, M.E.; Bilimoria, K.Y.; Ko, C.Y.; Hall, B.L. Development of an American College of Surgeons National Surgery Quality Improvement Program: Morbidity and Mortality Risk Calculator for Colorectal Surgery. J. Am. Coll. Surg. 2009, 208, 1009–1016. [Google Scholar] [CrossRef] [PubMed]
- Bilimoria, K.Y.; Liu, Y.; Paruch, J.L.; Zhou, L.; Kmiecik, T.E.; Ko, C.Y.; Cohen, M.E. Development and evaluation of the universal ACS NSQIP surgical risk calculator: A decision aid and informed consent tool for patients and surgeons. J. Am. Coll. Surg. 2013, 217, 833–842.e1. [Google Scholar] [CrossRef] [Green Version]
- Ozkan, O.; Guner, A.; Kaya, U.; Kece, C.; Reis, E.; Kesici, S. Evaluation of CR-POSSUM, original ACPGBI and new ACPGBI scoring systems for colorectal cancer surgery. Chirurgia 2015, 109, 800–805. [Google Scholar]
- Baré, M.; Alcantara, M.J.; Gil, M.J.; Collera, P.; Pont, M.; Escobar, A.; Sarasqueta, C.; Redondo, M.; Briones, E.; Dujovne, P.; et al. Validity of the CR-POSSUM model in surgery for colorectal cancer in Spain (CCR-CARESS study) and comparison with other models to predict operative mortality. BMC Heal. Serv. Res. 2018, 18, 49. [Google Scholar] [CrossRef] [Green Version]
- Harrell, F.E. Regression Modeling Strategies: With Applications to Linear Models, Logistic Regression, and Survival Analysis; Springer: New York, NY, USA, 2013. [Google Scholar]
- Aylin, P.; Bottle, A.; Majeed, A. Use of administrative data or clinical databases as predictors of risk of death in hospital: Comparison of models. BMJ 2007, 334, 1044. [Google Scholar] [CrossRef] [PubMed] [Green Version]
- Kramer, A.; Zimmerman, J.E. Assessing the calibration of mortality benchmarks in critical care: The Hosmer-Lemeshow test revisited*. Crit. Care Med. 2007, 35, 2052–2056. [Google Scholar] [CrossRef] [PubMed]
- Hosmer, D.; Hjort, N.L. Goodness-of-fit processes for logistic regression: Simulation results. Stat. Med. 2002, 21, 2723–2738. [Google Scholar] [CrossRef] [PubMed]
- Sammut, C.; Webb, G.I. Encyclopedia of Machine Learning; Springer Science & Business Media: New York, NY, USA, 2011. [Google Scholar]
- Delong, E.R.; Delong, D.M.; Clarke-Pearson, D.L. Comparing the Areas under Two or More Correlated Receiver Operating Characteristic Curves: A Nonparametric Approach. Biom. J. 1988, 44, 837. [Google Scholar] [CrossRef]
- Sullivan, L.; Massaro, J.M.; D’Agostino, R.B. Presentation of multivariate data for clinical use: The Framingham Study risk score functions. Stat. Med. 2004, 23, 1631–1660. [Google Scholar] [CrossRef]
- Campillo-Soto, A.; Flores-Pastor, B.; Soria-Aledo, V.; Candel-Arenas, M.; Andrés-García, B.; Martín-Lorenzo, J.G.; Aguayo-Albasini, J.L. The POSSUM scoring system: An instrument for measuring quality in surgical patients. Cirugía Española 2006, 80, 395–399. [Google Scholar] [CrossRef]
- Prytherch, D.R.; Whiteley, M.S.; Higgins, B.; Weaver, P.C.; Prout, W.G.; Powell, S.J. POSSUM and Portsmouth POSSUM for predicting mortality. Physiological and Operative Severity Score for the enUmeration of Mortality and morbidity. Br. J. Surg. 1998, 85, 1217–1220. [Google Scholar] [CrossRef]
- Senagore, A.J.; Warmuth, A.J.; Delaney, C.P.; Tekkis, P.; Fazio, V.W. POSSUM, p-POSSUM, and Cr-POSSUM: Implementation Issues in a United States Health Care System for Prediction of Outcome for Colon Cancer Resection. Dis. Colon Rectum 2004, 47, 1435–1441. [Google Scholar] [CrossRef]
- Haga, Y.; Wada, Y.; Takeuchi, H.; Kimura, O.; Furuya, T.; Sameshima, H.; Ishikawa, M. Estimation of physiologic ability and surgical stress (E-PASS) for a surgical audit in elective digestive surgery. Surgery 2004, 135, 586–594. [Google Scholar] [CrossRef]
- Tekkis, P.P.; Poloniecki, J.D.; Thompson, M.R.; Stamatakis, J.D. Operative mortality in colorectal cancer: Prospective national study. BMJ 2003, 327, 1196–1201. [Google Scholar] [CrossRef] [Green Version]
- Tekkis, P.P.; McCulloch, P.; Poloniecki, J.D.; Prytherch, D.; Kessaris, N.; Steger, A.C. Risk-adjusted prediction of operative mortality in oesophagogastric surgery with O-POSSUM. BJS 2004, 91, 288–295. [Google Scholar] [CrossRef] [PubMed]
- Tekkis, P.P.; Prytherch, D.; Kocher, H.M.; Senapati, A.; Poloniecki, J.D.; Stamatakis, J.D.; Windsor, A. Development of a dedicated risk-adjustment scoring system for colorectal surgery (colorectal POSSUM). BJS 2004, 91, 1174–1182. [Google Scholar] [CrossRef] [PubMed]
- Alves, A.; Panis, Y.; Mantion, G.; Slim, K.; Kwiatkowski, F.; Vicaut, E. The AFC score: Validation of a 4-item predicting score of postoperative mortality after colorectal resection for cancer or diverticulitis: Results of a prospective multicenter study in 1049 patients. Ann Surg. 2007, 246, 91–96. [Google Scholar] [CrossRef] [PubMed]
- Van Der Sluis, F.J.; Espín, E.; Vallribera, F.; De Bock, G.; Hoekstra, H.J.; Van Leeuwen, B.L.; Engel, A.F. Predicting postoperative mortality after colorectal surgery: A novel clinical model. Color. Dis. 2014, 16, 631–639. [Google Scholar] [CrossRef] [PubMed]
- Matheny, M.E.; Ohno-Machado, L.; Resnic, F. Discrimination and calibration of mortality risk prediction models in interventional cardiology. J. Biomed. Informatics 2005, 38, 367–375. [Google Scholar] [CrossRef] [Green Version]
- Kong, C.H.; Guest, G.D.; Stupart, D.A.; Faragher, I.G.; Chan, S.T.F.; Watters, D. Colorectal preOperative Surgical Score (CrOSS) for mortality in major colorectal surgery. ANZ J. Surg. 2015, 85, 403–407. [Google Scholar] [CrossRef]
- Walker, K.; Finan, P.J.; Van Der Meulen, J. Model for risk adjustment of postoperative mortality in patients with colorectal cancer. BJS 2014, 102, 269–280. [Google Scholar] [CrossRef]
- Quintana, J.M.; Antón-Ladislao, A.; González, N.; Lázaro, S.; Bare, M.; Fernández-De-Larrea, N.; Redondo, M.; Briones, E.; Escobar, A.; Sarasqueta, C.; et al. Predictors of one and two years’ mortality in patients with colon cancer: A prospective cohort study. PLoS ONE 2018, 13, e0199894. [Google Scholar] [CrossRef]
- Longo, W.E.; Virgo, K.S.; Johnson, F.E.; Oprian, C.A.; Vernava, A.M.; Wade, T.P.; Phelan, M.A.; Henderson, W.G.; Daley, J.; Khuri, S.F. Risk factors for morbidity and mortality after colectomy for colon cancer. Dis. Colon Rectum 2000, 43, 83–91. [Google Scholar] [CrossRef]
- Alvès, A.; Panis, Y.; Mathieu, P.; Mantion, G.; Kwiatkowski, F.; Slim, K. Postoperative Mortality and Morbidity in French Patients Undergoing Colorectal Surgery. Arch. Surg. 2005, 140, 278–283. [Google Scholar] [CrossRef] [Green Version]
- Harrell, F.E., Jr.; Lee, K.L.; Mark, D.B. Multivariable prognostic models: Issues in developing models, evaluating assumptions and adequacy, and measuring and reducing errors. Statist. Med. 1996, 15, 361–387. [Google Scholar] [CrossRef]
- Jencks, S.F. Assessing hospital-associated deaths from discharge data. The role of length of stay and comorbidities. JAMA 1988, 260, 2240–2246. [Google Scholar] [CrossRef] [PubMed]
- Librero, J.; Peiró, S. Do chronic diseases prevent intra-hospital mortality? Paradoxes and biases in information about hospital morbidity. Gac. Sanit. 1998, 12, 199–206. [Google Scholar] [CrossRef] [Green Version]


| Variable | ||
|---|---|---|
| Quantitative, mean ± SD | Age | 69.56 ± 11.67 |
| Stay | 12.50 ± 6.74 | |
| Preoperative stay | 2.51 ± 3.96 | |
| NDD | 5.96 ± 3.37 | |
| NPD | 3.77 ± 2.94 | |
| Qualitative, n (%) | Male sex | 55,735 (60.10) |
| Scheduled admission | 71,797 (77.40) | |
| Re-admission | 15,111 (16.30) | |
| Mortality | 3930 (4.20) | |
| COPD | 6301 (6.80) | |
| Ischaemic heart disease | 2608 (2.80) | |
| Arterial hypertension | 38,409 (41.40) | |
| Obesity | 4157 (4.50) | |
| Stroke | 1203 (1.30) | |
| Renal insufficiency | 4019 (4.30) | |
| Anaemia | 10,105 (10.90) | |
| Atrial fibrillation | 7082 (7.60) | |
| Diabetes | 17,210 (18.60) | |
| Dyslipidaemia | 18,826 (20.30) | |
| Tumor location: rectum | 22,363 (24.10) | |
| Tumor location: sigmoid colon | 21,777 (23.50) | |
| Tumor location: rectosigmoid junction | 10,015 (10.80) | |
| Tumor location: colon/others | 38,613 (41.60) |
| Variable | Exitus (3930) | Survival (88,838) | ORu | 95% CI | p-Value | |
|---|---|---|---|---|---|---|
| Age | 77.44 ± 10.22 | 69.22 ± 11.61 | 1.08 | 1.08–1.09 | <0.001 | |
| Stay | 14.21 ± 8.77 | 12.43 ± 6.22 | 1.04 | 1.03–1.04 | <0.001 | |
| Preoperative stay | 4.24 ± 6.10 | 2.44 ± 3.83 | 1.08 | 1.07–1.08 | <0.001 | |
| NDD | 9.44 ± 3.53 | 5.81 ± 3.27 | 1.34 | 1.32–1.35 | <0.001 | |
| NPD | 6.41 ± 4.41 | 3.65 ± 2.80 | 1.22 | 1.21–1.23 | <0.001 | |
| Sex | Female | 1428 (3.86) | 35,602 (96.14) | 1 | ||
| Male | 2502 (4.49) | 53,233 (95.51) | 1.17 | 1.09–1.25 | <0.001 | |
| Laparoscopy | No | 3848 (4.50) | 81,576 (95.50) | 1 | ||
| Yes | 82 (1.12) | 7262 (98.88) | 4.17 | 3.35–5.21 | <0.001 | |
| Type of admission | Scheduled | 1628 (2.27) | 70,169 (97.63) | 1 | ||
| Urgent | 2299 (11.00) | 18,609 (89.00) | 5.32 | 4.99–5.68 | <0.001 | |
| Re-admission | No | 3144 (4.05) | 74,513 (95.95) | 1 | ||
| Yes | 786 (5.20) | 14,325 (94.80) | 1.3 | 1.20–1.41 | <0.001 | |
| Tumor location: rectum | No | 3399 (4.83) | 67,006 (95.17) | 1 | ||
| Yes | 531 (2.37) | 21,832 (97.63) | 0.48 | 0.44–0.53 | <0.001 | |
| Tumor location: sigmoid colon | No | 3020 (4.25) | 67,971 (95.75) | 1 | ||
| Yes | 910 (4.18) | 20,867 (95.82) | 0.98 | 0.91–1.06 | 0.630 | |
| Tumor location: rectosigmoid junction | No | 3524 (4.26) | 79,229 (95.74) | 1 | ||
| Yes | 406 (4.05) | 9609 (95.95) | 0.95 | 0.86–1.06 | 0.340 | |
| Tumor location: descending colon | No | 3749 (4.23) | 84,956 (95.77) | 1 | ||
| Yes | 181 (4.45) | 3882 (95.55) | 1.06 | 0.91–1.23 | 0.480 | |
| Tumor location: transverse colon | No | 3715 (4.18) | 85,092 (95.82) | 1 | ||
| Yes | 215 (5.43) | 3746 (94.57) | 1.32 | 1.14–1.51 | <0.001 | |
| COPD | No | 3470 (4.02) | 82,949 (95.98) | 1 | ||
| Yes | 455 (7.22) | 5846(92.78) | 1.9 | 1.68–2.06 | <0.001 | |
| Ischaemic heart disease | No | 3711 (4.13) | 86,058 (95.87) | 1 | ||
| Yes | 192 (7.36) | 2416 (92.64) | 1.84 | 1.58–2.14 | <0.001 | |
| Arterial hypertension | No | 2392 (4.41) | 51,871 (95.56) | 1 | ||
| Yes | 1534 (3.99) | 36,875 (96.01) | 0.9 | 0.84–0.96 | <0.010 | |
| Valvulopathy | No | 3773 (4.16) | 86,896 (95.84) | 1 | ||
| Yes | 138 (7.59) | 1679 (92.41) | 1.89 | 1.59–2.26 | <0.001 | |
| Stroke | No | 3781 (4.14) | 87,597 (95.86) | 1 | ||
| Yes | 130 (10.81) | 1073 (89.19) | 2.81 | 2.33–3.38 | <0.001 | |
| Renal insufficiency | No | 2807 (3.17) | 85,664 (96.83) | 1 | ||
| Yes | 1014 (25.23) | 3005 (74.77) | 10.29 | 9.50–11.16 | <0.001 | |
| Anaemia | No | 3197 (3.88) | 79,225 (96.12) | 1 | ||
| Yes | 714 (7.07) | 9391 (92.93) | 1.89 | 1.73–2.05 | <0.001 | |
| Atrial fibrillation | No | 3267 (3.81) | 82,380 (96.19) | 1 | ||
| Yes | 657 (9.28) | 6452 (90.72) | 2.58 | 2.36–2.81 | <0.001 | |
| Diabetes | No | 3178 (4.22) | 72,188 (95.78) | 1 | ||
| Yes | 740 (4.30) | 16,470 (95.70) | 1.02 | 0.94–1.11 | 0.630 | |
| Obesity | No | 3796 (4.28) | 84,810 (95.72) | 1 | ||
| Yes | 133 (3.20) | 4024 (96.80) | 0.74 | 0.62–0.89 | <0.001 | |
| Dyslipidaemia | No | 3418 (4.63) | 70,353 (95.37) | 1 | ||
| Yes | 510 (2.71) | 18,316 (97.29) | 0.57 | 0.52–0.63 | <0.001 | |
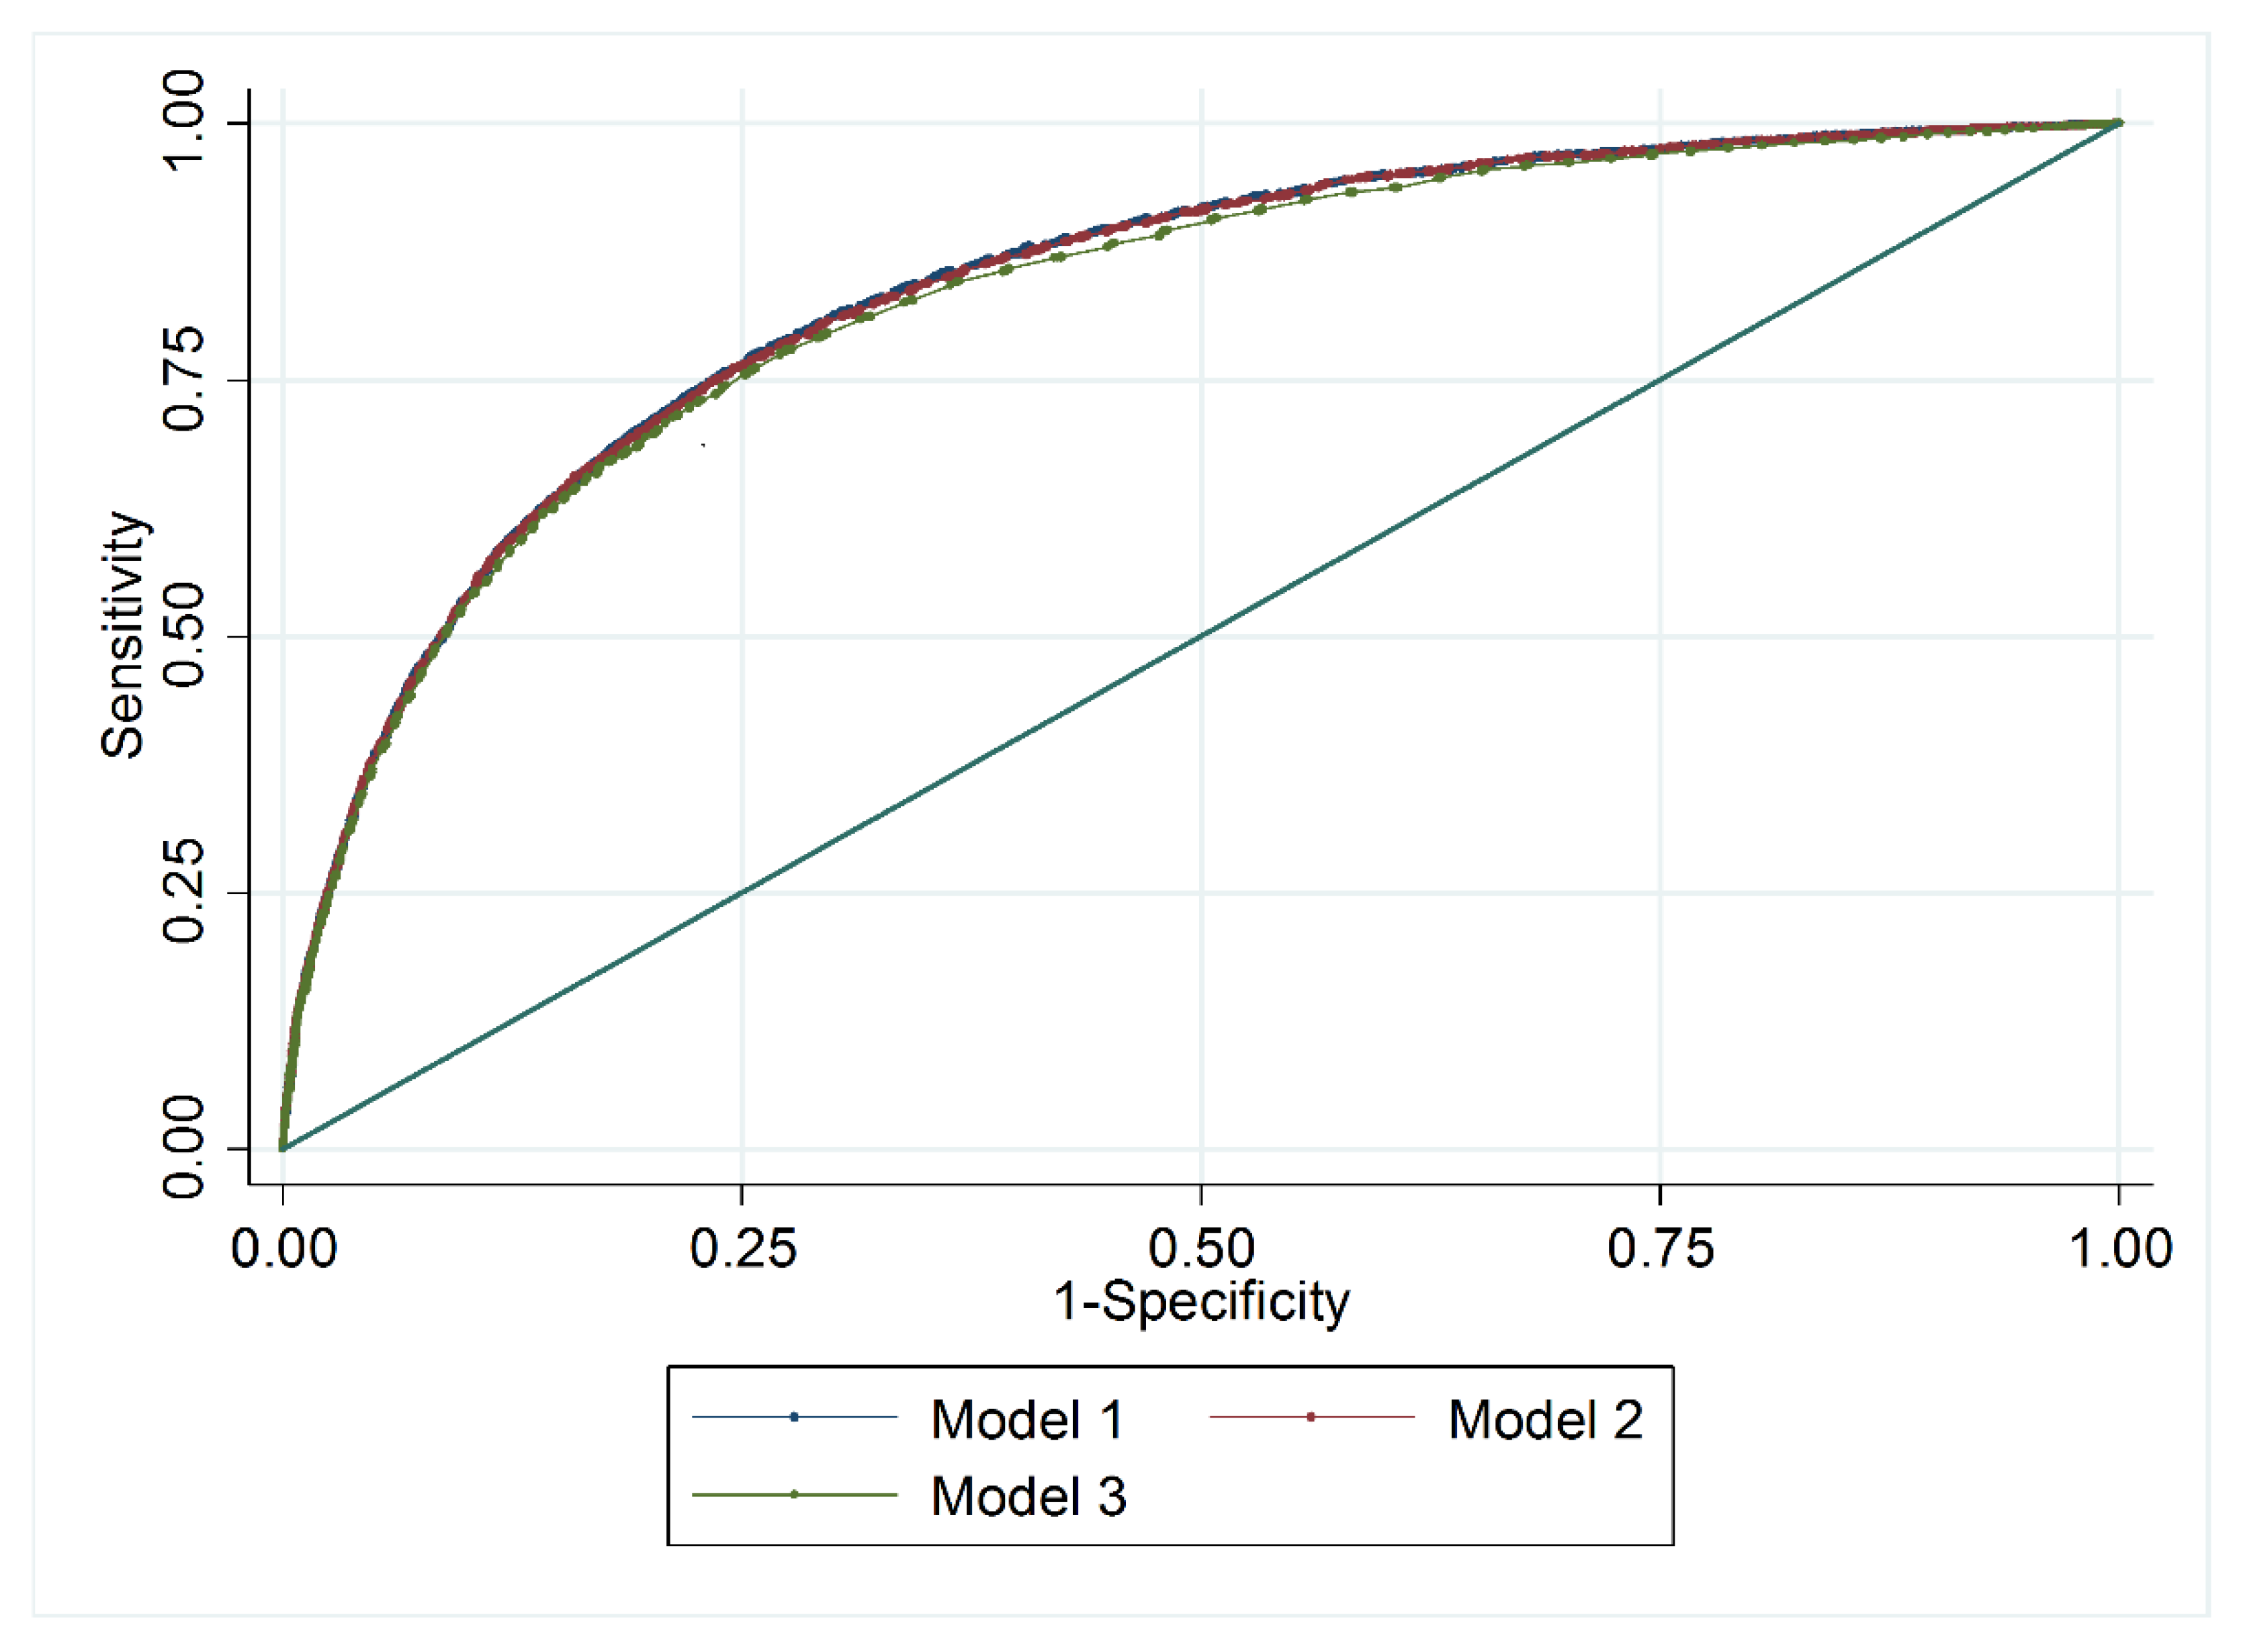
| Model 1 (Initial) | Model 2 (Intermediate) | Model 3 (Final or ACMS) | ||||
|---|---|---|---|---|---|---|
| Variable | ORa | 95% CI | ORa | 95% CI | ORa | 95% CI |
| Ischaemic heart disease | 1.31 | 1.11–1.56 | ||||
| Anaemia | 1.14 | 1.04–1.25 | ||||
| Re-admission | 0.72 | 0.66–0.79 | 0.72 | 0.66–0.79 | ||
| CRC location Rectum | 0.80 | 0.77–0.89 | 0.80 | 0.72–0.88 | ||
| Atrial fibrillation | 1.40 | 1.26–1.55 | 1.39 | 1.26–1.54 | ||
| Dyslipidaemia | 0.53 | 0.48–0.59 | 0.54 | 0.48–0.59 | ||
| Age (decade) | 1.72 | 1.66–1.79 | 1.73 | 1.73–1.79 | 1.79 | 1.78–1.79 |
| Type of admission (urgent) | 4.65 | 4.33–5.00 | 4.63 | 4.31–4.98 | 4.68 | 4.36–5.02 |
| COPD | 1.39 | 1.24–1.56 | 1.40 | 1.25–1.56 | 1.43 | 1.28–1.60 |
| Stroke | 1.90 | 1.54–2.33 | 1.89 | 1.54–2.32 | 1.87 | 1.53–2.29 |
| Renal insufficiency | 7.17 | 6.56–7.84 | 7.18 | 6.57–7.85 | 7.26 | 6.65–7.94 |
| AUC | 0.84 95%CI 0.83–0.84 | 0.83 95%CI 0.83–0.84 | 0.83 95%CI 0.82–0.83 | |||
| Pearson’s χ2 test | <0.001 | <0.001 | <0.001 | |||
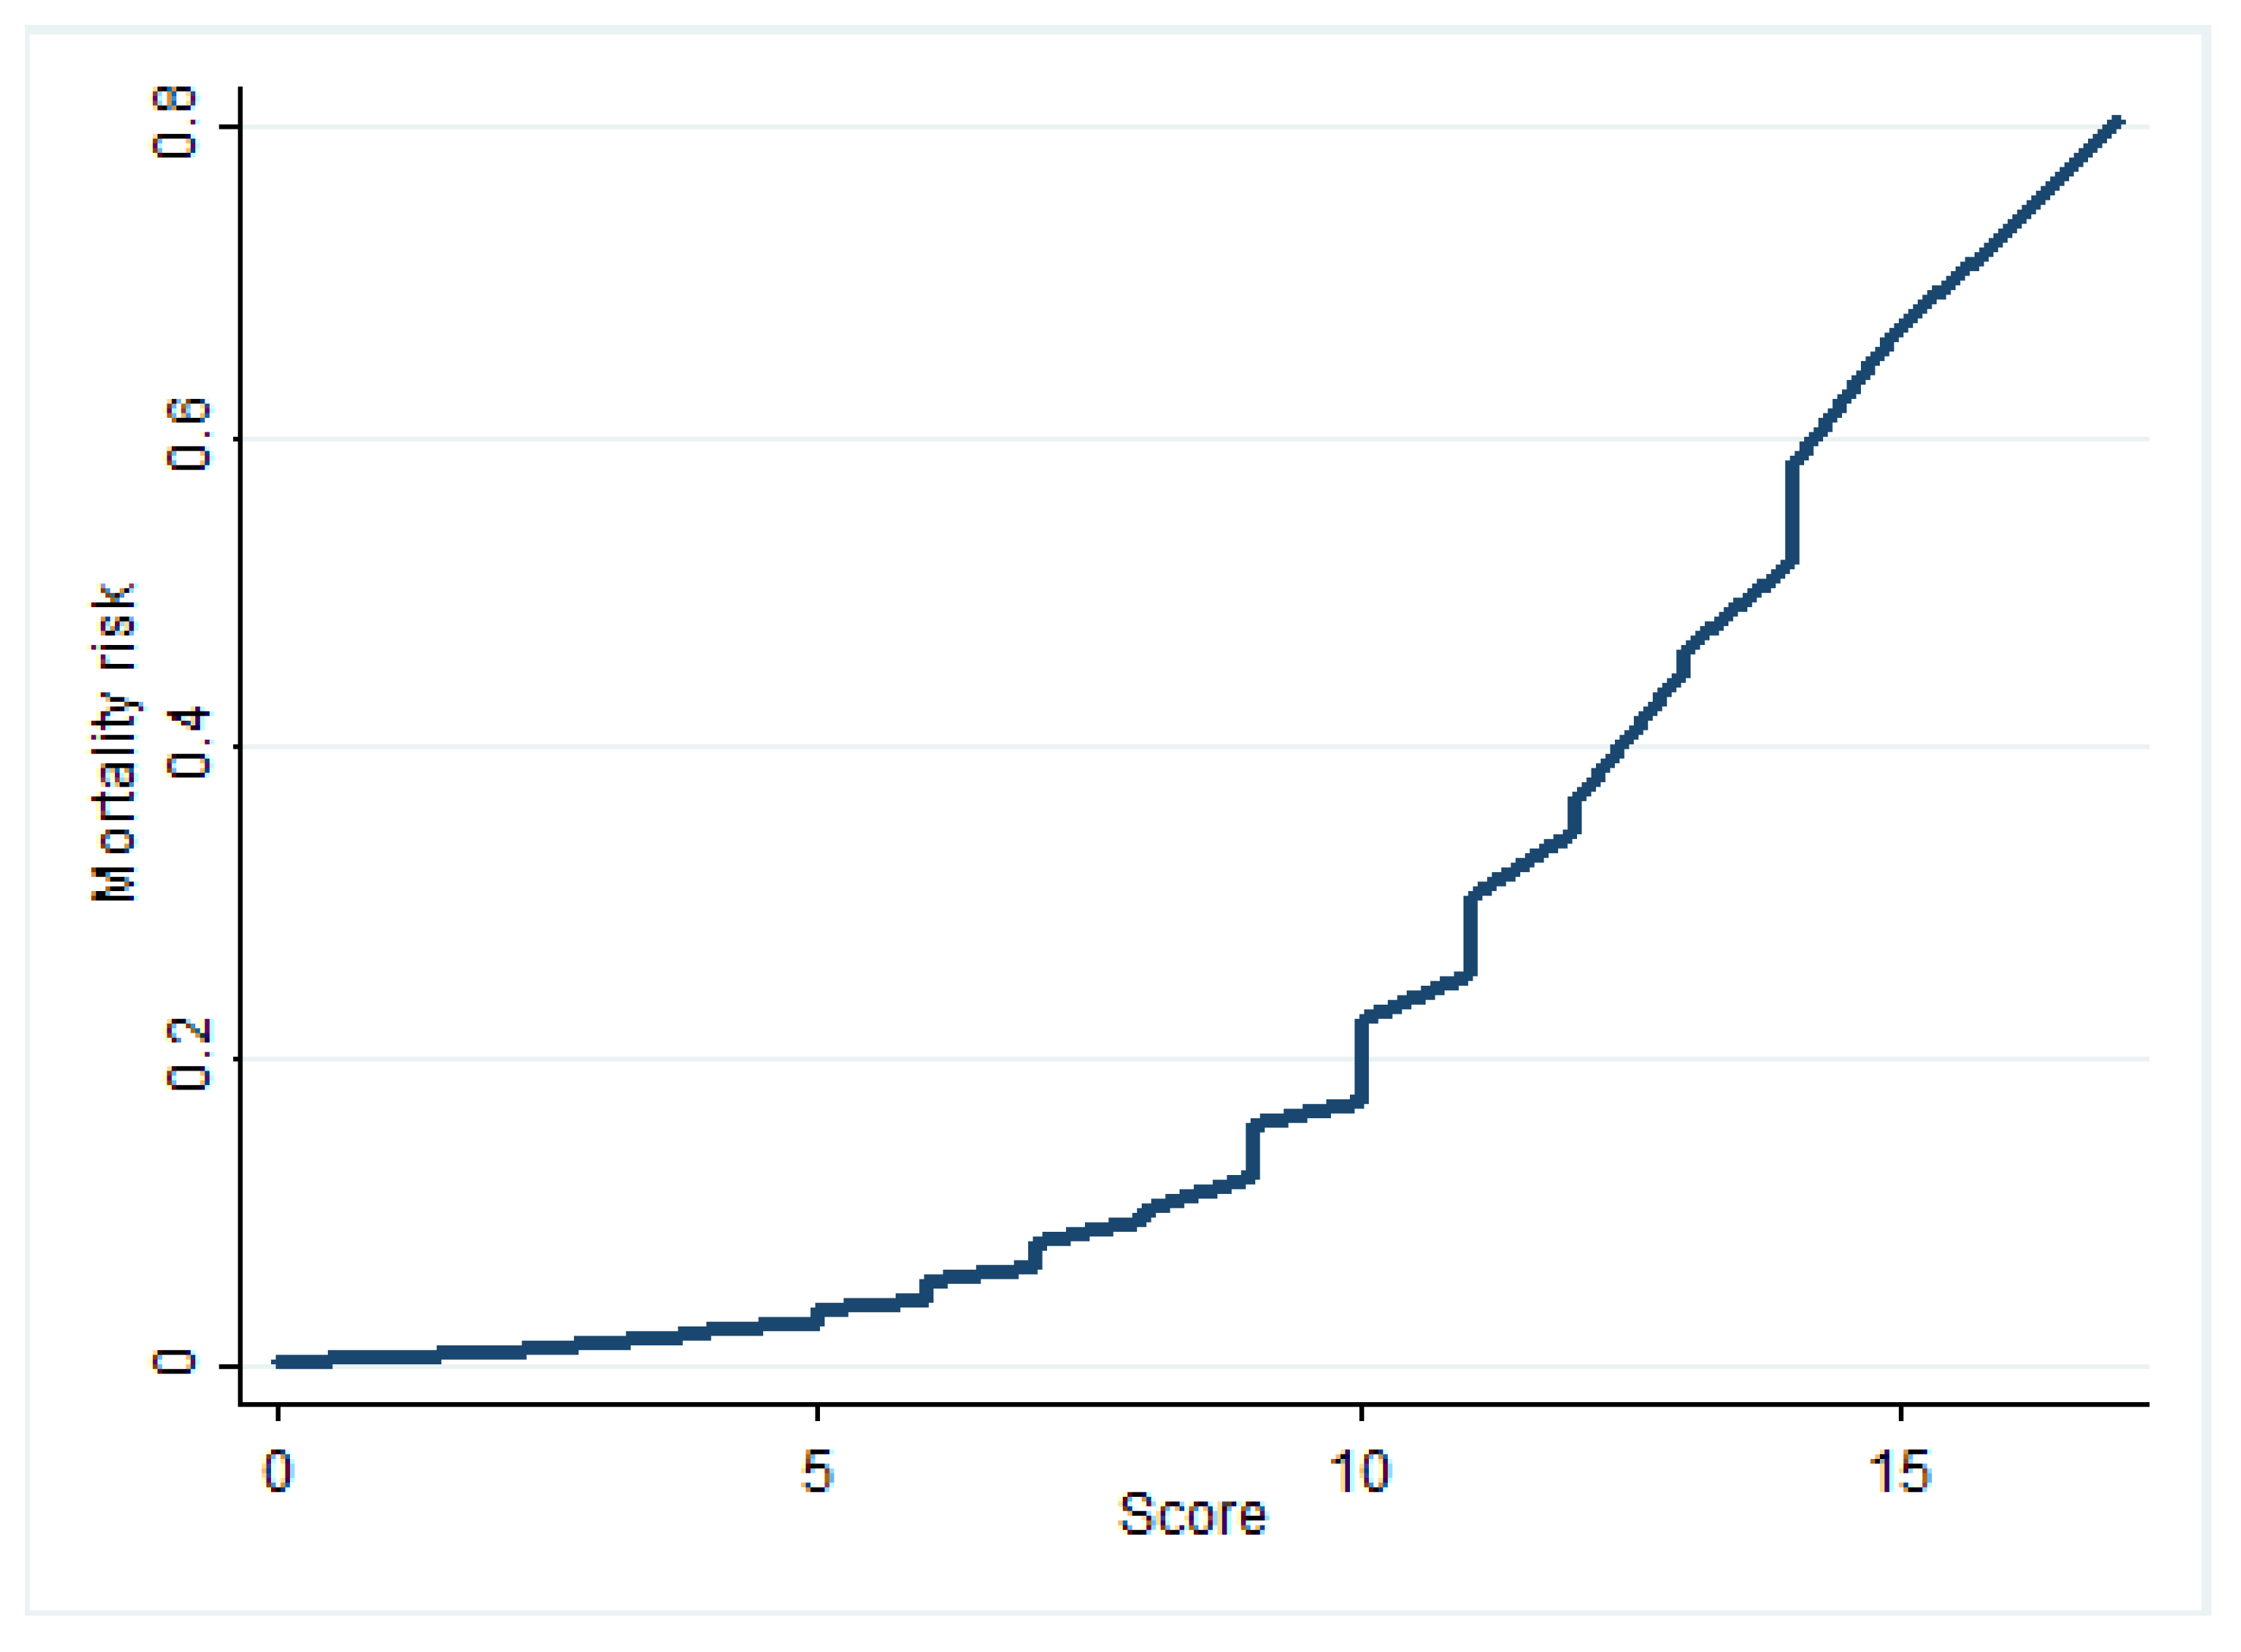
| Attribute | Points |
|---|---|
| Age 41–60 | 1 |
| Age 61–80 | 3 |
| Age > 80 | 5 |
| Urgent admission | 4 |
| COPD | 1 |
| Stroke | 2 |
| Renal insufficiency | 5 |
© 2020 by the authors. Licensee MDPI, Basel, Switzerland. This article is an open access article distributed under the terms and conditions of the Creative Commons Attribution (CC BY) license (http://creativecommons.org/licenses/by/4.0/).
Share and Cite
García-Torrecillas, J.M.; Olvera-Porcel, M.C.; Ferrer-Márquez, M.; Rosa-Garrido, C.; Rodríguez-Barranco, M.; Lea-Pereira, M.C.; Rubio-Gil, F.; Sánchez, M.-J. Predictive Model of the Risk of In-Hospital Mortality in Colorectal Cancer Surgery, Based on the Minimum Basic Data Set. Int. J. Environ. Res. Public Health 2020, 17, 4216. https://doi.org/10.3390/ijerph17124216
García-Torrecillas JM, Olvera-Porcel MC, Ferrer-Márquez M, Rosa-Garrido C, Rodríguez-Barranco M, Lea-Pereira MC, Rubio-Gil F, Sánchez M-J. Predictive Model of the Risk of In-Hospital Mortality in Colorectal Cancer Surgery, Based on the Minimum Basic Data Set. International Journal of Environmental Research and Public Health. 2020; 17(12):4216. https://doi.org/10.3390/ijerph17124216
Chicago/Turabian StyleGarcía-Torrecillas, Juan Manuel, María Carmen Olvera-Porcel, Manuel Ferrer-Márquez, Carmen Rosa-Garrido, Miguel Rodríguez-Barranco, María Carmen Lea-Pereira, Francisco Rubio-Gil, and María-José Sánchez. 2020. "Predictive Model of the Risk of In-Hospital Mortality in Colorectal Cancer Surgery, Based on the Minimum Basic Data Set" International Journal of Environmental Research and Public Health 17, no. 12: 4216. https://doi.org/10.3390/ijerph17124216