Male-Type and Prototypal Depression Trajectories for Men Experiencing Mental Health Problems

 , ,
, ,
Abstract
:1. Introduction
2. Materials and Methods
2.1. Participants and Design
2.2. Measures
2.3. Procedure
2.4. Data Analysis
3. Results
3.1. Sample Characters
3.2. Baseline Differences—PHQ, MDRS
3.3. Internal Consistency and Correlations Across Waves
3.4. Latent Growth Modelling
3.5. Effect of Current Treatment
4. Discussion
5. Conclusions
Author Contributions
Funding
Conflicts of Interest
Appendix A

| Not at All (0 Days) | Occasionally (1–4 Days) | Around 25% of the Time (5–8 Days) | Just Under Half the Time (9–12 Days) | Just over Half the Time (13–16 Days) | Around 75% of the Time (17–20 Days) | Very Frequently (21–24 Days) | Almost Always (25+ Days) | |
|---|---|---|---|---|---|---|---|---|
| 1. I bottled up my negative feelings | 0 | 1 | 2 | 3 | 4 | 5 | 6 | 7 |
| 2. I covered up my difficulties | 0 | 1 | 2 | 3 | 4 | 5 | 6 | 7 |
| 3. I drank more alcohol than usual | 0 | 1 | 2 | 3 | 4 | 5 | 6 | 7 |
| 4. I drove dangerously or aggressively | 0 | 1 | 2 | 3 | 4 | 5 | 6 | 7 |
| 5. I had more heartburn than usual | 0 | 1 | 2 | 3 | 4 | 5 | 6 | 7 |
| 6. I had regular headaches | 0 | 1 | 2 | 3 | 4 | 5 | 6 | 7 |
| 7. I had stomach pains | 0 | 1 | 2 | 3 | 4 | 5 | 6 | 7 |
| 8. I had to work things out by myself | 0 | 1 | 2 | 3 | 4 | 5 | 6 | 7 |
| 9. I had unexplained aches and pains | 0 | 1 | 2 | 3 | 4 | 5 | 6 | 7 |
| 10. I needed alcohol to help me unwind | 0 | 1 | 2 | 3 | 4 | 5 | 6 | 7 |
| 11. I needed to have easy access to alcohol | 0 | 1 | 2 | 3 | 4 | 5 | 6 | 7 |
| 12. I overreacted to situations with aggressive behaviour | 0 | 1 | 2 | 3 | 4 | 5 | 6 | 7 |
| 13. I sought out drugs | 0 | 1 | 2 | 3 | 4 | 5 | 6 | 7 |
| 14. I stopped caring about the consequences of my actions | 0 | 1 | 2 | 3 | 4 | 5 | 6 | 7 |
| 15. I stopped feeling so bad while drinking | 0 | 1 | 2 | 3 | 4 | 5 | 6 | 7 |
| 16. I took unnecessary risks | 0 | 1 | 2 | 3 | 4 | 5 | 6 | 7 |
| 17. I tried to ignore feeling down | 0 | 1 | 2 | 3 | 4 | 5 | 6 | 7 |
| 18. I used drugs to cope | 0 | 1 | 2 | 3 | 4 | 5 | 6 | 7 |
| 19. I verbally lashed out at others without being provoked | 0 | 1 | 2 | 3 | 4 | 5 | 6 | 7 |
| 20. I was verbally aggressive to others | 0 | 1 | 2 | 3 | 4 | 5 | 6 | 7 |
| 21. It was difficult to manage my anger | 0 | 1 | 2 | 3 | 4 | 5 | 6 | 7 |
| 22. Using drugs provided temporary relief | 0 | 1 | 2 | 3 | 4 | 5 | 6 | 7 |
References
- Call, J.B.; Shafer, K. Gendered Manifestations of Depression and Help Seeking Among Men. Am. J. Men’s Health 2015, 12, 41–51. [Google Scholar] [CrossRef] [PubMed]
- Oliffe, J.L.; Rossnagel, E.; Seidler, Z.E.; Kealy, D.; Ogrodniczuk, J.S.; Rice, S.M. Men’s Depression and Suicide. Curr. Psychiatry Rep. 2019, 21, 103. [Google Scholar] [CrossRef] [PubMed]
- Mauvais-Jarvis, F.; Merz, N.B.; Barnes, P.J.; Brinton, R.D.; Carrero, J.-J.; DeMeo, D.L.; De Vries, G.J.; Epperson, C.N.; Govindan, R.; Klein, S.L.; et al. Sex and Gender: Modifiers of Health, Disease, and Medicine. Lancet 2020, 396, 565–582. [Google Scholar] [CrossRef]
- Ribeiro, J.D.; Huang, X.; Fox, K.R.; Franklin, J.C. Depression and Hopelessness as Risk Factors for Suicide Ideation, Attempts and Death: Meta-Analysis of Longitudinal Studies. Br. J. Psychiatry 2018, 212, 279–286. [Google Scholar] [CrossRef] [PubMed]
- Hawton, K.; Comabella, C.C.I.; Haw, C.; Saunders, K. Risk Factors for Suicide in Individuals with Depression: A Systematic Review. J. Affect. Disord. 2013, 147, 17–28. [Google Scholar] [CrossRef] [PubMed]
- WHO Global Health Observatory Data: Suicide Rates. 2016. Available online: https://www.who.int/gho/mental_health/suicide_rates_male_female/en/ (accessed on 7 October 2020).
- Möller-Leimkühler, A.M. Barriers to Help-Seeking by Men: A Review of Sociocultural and Clinical Literature with Particular Reference to Depression. J. Affect. Disord. 2002, 71, 1–9. [Google Scholar] [CrossRef]
- Oliffe, J.L.; Broom, A.; Rossnagel, E.; Kelly, M.T.; Affleck, W.; Rice, S.M. Help-seeking prior to Male Suicide: Bereaved Men Perspectives. Soc. Sci. Med. 2020, 113173. [Google Scholar] [CrossRef]
- Brownhill, S.; Wilhelm, K.; Barclay, L.; Schmied, V. ’Big build’: Hidden depression in men. Aust. N. Zeal. J. Psychiatry 2005, 39, 921–931. [Google Scholar] [CrossRef]
- Brownhill, S.H. Intensified Constraint: The Battle Between Individual and Social Forces Influencing Hidden Depression in Men; University of New South Wales: Sydney, Australia, 2003. [Google Scholar]
- Chuick, C.D.; Greenfeld, J.M.; Greenberg, S.T.; Shepard, S.J.; Cochran, S.V.; Haley, J.T. A Qualitative Investigation of Depression in Men. Psychol. Men Masc. 2009, 10, 302–313. [Google Scholar] [CrossRef] [Green Version]
- Emslie, C.; Ridge, D.; Ziebland, S.; Hunt, K. Men’s Accounts of Depression: Reconstructing or Resisting Hegemonic Masculinity? Soc. Sci. Med. 2006, 62, 2246–2257. [Google Scholar] [CrossRef]
- Heifner, C. The Male Experience of Depression. Perspect. Psychiatr. Care 1997, 33, 10–18. [Google Scholar] [CrossRef] [PubMed]
- Oliffe, J.L.; Robertson, S.; Kelly, M.T.; Roy, P.; Ogrodniczuk, J.S. Connecting Masculinity and Depression Among International Male University Students. Qual. Health Res. 2010, 20, 987–998. [Google Scholar] [CrossRef] [PubMed]
- Magovcevic, M.; Addis, M.E. The Masculine Depression Scale: Development and Psychometric Evaluation. Psychol. Men Masc. 2008, 9, 117–132. [Google Scholar] [CrossRef] [Green Version]
- Martin, L.A. Challenging Depression Criteria: An Exploration of Men’s Experiences of Depression. Ph.D. Thesis, University of Michingan-Dearborn, Dearborn, MI, USA, November 2010. [Google Scholar]
- Rutz, W. Improvement of Care for People Suffering from Depression: The Need for Comprehensive Education. Int. Clin. Psychopharmacol. 1999, 14, S27–S33. [Google Scholar] [CrossRef] [PubMed]
- Zierau, F.; Bille, A.; Rutz, W.; Bech, P. The Gotland Male Depression Scale: A Validity Study in Patients with Alcohol Use Disorder. Nord. J. Psychiatry 2002, 56, 265–271. [Google Scholar] [CrossRef] [PubMed]
- Brownhill, S.; Wilhelm, K.; Eliovson, G.; Waterhouse, M. ’For Men Only’. A Mental Health Prompt List in Primary Care. Aust. Fam. Physician 2003, 32, 443–450. [Google Scholar]
- Levant, R.; Smalley, K.; Aupont, M.; House, A.; Richmond, K.; Noronha, D. Initial Validation of the Male Role Norms Inventory-Revised (MRNI-R). J. Men’s Stud. 2007, 15, 83–100. [Google Scholar] [CrossRef]
- Genuchi, M.C.; Valdez, J.N. The Role of Anger as a Component of a Masculine Variation of Depression. Psychol. Men Masc. 2015, 16, 149–159. [Google Scholar] [CrossRef]
- Seidler, Z.E.; Dawes, A.J.; Rice, S.M.; Oliffe, J.L.; Dhillon, H.M. The Role of Masculinity in Men’s Help-Seeking for Depression: A Systematic Review. Clin. Psychol. Rev. 2016, 49, 106–118. [Google Scholar] [CrossRef]
- Seidler, Z.E.; Rice, S.M.; Ogrodniczuk, J.S.; Kealy, D.; Dhillon, H.M.; Oliffe, J.L. Considerations in Men’s Mental Health Promotion and Treatment. In Men’s Health Equity: A Handbook; Routledge: New York, NY, USA; Oxon, UK, 2019; pp. 275–287. [Google Scholar] [CrossRef]
- American Psychiatric Association. Diagnostic and Statistical Manual of Mental Disorders (DSM-5®); American Psychiatric Pub: Washington, DC, USA, 2013. [Google Scholar]
- Rice, S.; Aucote, H.M.; Möller-Leimkühler, A.M.; Amminger, G.P. Confirmatory Factor Analysis of the Gotland Male Depression Scale in an Australian Community Sample. Eur. J. Psychol. Assess. 2017, 33, 190–195. [Google Scholar] [CrossRef]
- Rice, S.M.; Fallon, B.J.; Aucote, H.M.; Möller-Leimkühler, A.M. Development and Preliminary Validation of the Male Depression Risk Scale: Furthering the Assessment of Depression in Men. J. Affect. Disord. 2013, 151, 950–958. [Google Scholar] [CrossRef] [PubMed]
- Rice, S.; Fallon, B.J.; Aucote, H.M.; Möller-Leimkühler, A.; Treeby, M.S.; Amminger, G.P. Longitudinal Sex Differences of Externalising and Internalising Depression Symptom Trajectories: Implications for Assessment of Depression in Men from an Online Study. Int. J. Soc. Psychiatry 2014, 61, 236–240. [Google Scholar] [CrossRef] [PubMed]
- Rice, S.; Ogrodniczuk, J.S.; Kealy, D.; Seidler, Z.E.; Dhillon, H.; Oliffe, J.L. Validity of the Male Depression Risk Scale in a Representative Canadian Sample: Sensitivity and Specificity in Identifying Men with Recent Suicide Attempt. J. Ment. Health 2017, 28, 132–140. [Google Scholar] [CrossRef] [PubMed]
- Kuehner, C. Is It All Depression? JAMA Psychiatry 2014, 71, 337. [Google Scholar] [CrossRef]
- Safford, S.M. Gender and Depression in Men: Extending Beyond Depression and Extending Beyond Gender. Clin. Psychol. Sci. Pract. 2008, 15, 169–173. [Google Scholar] [CrossRef]
- Kroenke, K.; Spitzer, R.L.; Williams, J.B.W. The PHQ-9. J. Gen. Intern. Med. 2001, 16, 606–613. [Google Scholar] [CrossRef]
- Levis, B.; Benedetti, A.; Thombs, B.D. Accuracy of Patient Health Questionnaire-9 (PHQ-9) for Screening to Detect Major Depression: Individual Participant Data Meta-Analysis. BMJ 2019, 365, l1476. [Google Scholar] [CrossRef] [Green Version]
- Ogrodniczuk, J.; Oliffe, J.; Beharry, J. HeadsUpGuys: Canadian Online Resource for Men with Depression. Can. Fam. Physician 2018, 64, 93. [Google Scholar]
- Rice, S.; Kealy, D.; Oliffe, J.L.; Ogrodniczuk, J.S. Externalizing Depression Symptoms Among Canadian Males with Recent Suicidal Ideation: A Focus on Young Men. Early Interv. Psychiatry 2018, 13, 308–313. [Google Scholar] [CrossRef]
- Hayes, A.F.; Coutts, J.J. Use Omega Rather than Cronbach’s Alpha for Estimating Reliability. But…. Commun. Methods Meas. 2020, 14, 1–24. [Google Scholar] [CrossRef]
- Hancock, G.R.; An, J. A Closed-Form Alternative for Estimating ω Reliability under Unidimensionality. Meas. Interdiscip. Res. Perspect. 2020, 18, 1–14. [Google Scholar] [CrossRef] [Green Version]
- Lee, K.; Whittaker, T.A. Statistical Power of the Multiple Domain Latent Growth Model for Detecting Group Differences. Struct. Equ. Model. Multidiscip. J. 2018, 25, 700–714. [Google Scholar] [CrossRef]
- Duncan, T.E.; Duncan, S.C. An Introduction to Latent Growth Curve Modeling. Behav. Ther. 2004, 35, 333–363. [Google Scholar] [CrossRef]
- Byrne, B.M. Structural Equation Modeling with AMOS. In Structural Equation Modeling with AMOS; Routledge: New York, NY, USA, 2016. [Google Scholar]
- McDonald, R.P.; Ho, M.-H.R. Principles and Practice in Reporting Structural Equation Analyses. Psychol. Methods 2002, 7, 64–82. [Google Scholar] [CrossRef] [PubMed]
- West, S.G.; Taylor, A.B.; Wu, W. Model Fit and Model Selection in Structural Equation Modeling. In Handbook of Structural Equation Modeling; The Guilford Press: New York, NY, USA, 2012; pp. 209–231. [Google Scholar]
- Chen, F.; Curran, P.J.; Bollen, K.A.; Kirby, J.; Paxton, P. An Empirical Evaluation of the Use of Fixed Cutoff Points in RMSEA Test Statistic in Structural Equation Models. Sociol. Methods Res. 2008, 36, 462–494. [Google Scholar] [CrossRef] [PubMed] [Green Version]
- Arbuckle, J. Amos User’s Guide: Version 25; SmallWaters Corporation: Chicago, IL, USA, 2017. [Google Scholar]
- Hermida, R. The Problem of Allowing Correlated Errors in Structural Equation Modeling: Concerns and Consideration. Comput. Methods Soc. Sci. 2015, 3, 5–17. [Google Scholar]
- Muniz-Terrera, G.; Robitaille, A.; Kelly, A.; Johansson, B.; Hofer, S.M.; Piccinin, A.M. Latent Growth Models Matched to Research Questions to Answer Questions About Dynamics of Change in Multiple Processes. J. Clin. Epidemiol. 2017, 82, 158–166. [Google Scholar] [CrossRef] [Green Version]
- Cavanagh, A.; Wilson, C.J.; Kavanagh, D.J.; Caputi, P. Differences in the Expression of Symptoms in Men Versus Women with Depression: A Systematic Review and Meta-Analysis. Harv. Rev. Psychiatry 2017, 25, 29–38. [Google Scholar] [CrossRef]
- Martin, L.A.; Neighbors, H.W.; Griffith, D.M. The Experience of Symptoms of Depression in Men vs Women: Analysis of the National Comorbidity Survey Replication. JAMA Psychiatry 2013, 70, 1100–1106. [Google Scholar] [CrossRef] [Green Version]
- Richards, J.M.; Gross, J.J. Composure at Any Cost? The Cognitive Consequences of Emotion Suppression. Pers. Soc. Psychol. Bull. 1999, 25, 1033–1044. [Google Scholar] [CrossRef]
- Chapman, B.P.; Fiscella, K.; Kawachi, I.; Duberstein, P.; Muennig, P. Emotion Suppression and Mortality Risk Over a 12-Year Follow-Up. J. Psychosom. Res. 2013, 75, 381–385. [Google Scholar] [CrossRef] [PubMed] [Green Version]
- Hammer, J.H.; Heath, P.J.; Vogel, D.L. Fate of the Total Score: Dimensionality of the Conformity to Masculine Norms Inventory-46 (CMNI-46). Psychol. Men Masc. 2018, 19, 645–651. [Google Scholar] [CrossRef]
- Walther, A.; Grub, J.; Ehlert, E.; Wehrli, S.; Rice, S.; Seidler, Z.; Debelak., R. Male Depression Risk, Psychological Distress, and Psychotherapy Uptake: Validation of the German Version of the Male Depression Risk Scale. Submitted.
- O’Donnell, S.; Richardson, N. Intersectional Approaches to Equity in Men’s Health and Well-Being: No Country for Middle-Aged Men? Int. J. Mens Soc. Community Health 2020, 3, e32–e45. [Google Scholar] [CrossRef]
- Ferlatte, O.; Oliffe, J.L.; Salway, T.; Broom, A.; Bungay, V.; Rice, S. Using Photovoice to Understand Suicidality Among Gay, Bisexual, and Two-Spirit Men. Arch. Sex. Behav. 2019, 48, 1529–1541. [Google Scholar] [CrossRef] [PubMed]
- Heise, L.; Greene, M.E.; Opper, N.; Stavropoulou, M.; Harper, C.; Nascimento, M.; Zewdie, D.; Darmstadt, G.L.; Hawkes, S.; Henry, S.; et al. Gender Inequality and Restrictive Gender Norms: Framing the Challenges to Health. Lancet 2019, 393, 2440–2454. [Google Scholar] [CrossRef]
- Ferlatte, O.; Rice, S.; Kealy, D.; Oliffe, J.L.; Ogrodniczuk, J.S. Suicidality, Maladaptive Externalizing Behaviors and Sexual Orientation: Results from an Online Representative Sample of Canadian Men. Int. J. Ment. Health 2020, 49, 280–290. [Google Scholar] [CrossRef]

| Current Treatment n = 133 | No Current Treatment n = 101 | F, p-Value, Effect Size (η2) | ||
|---|---|---|---|---|
| MDRS Item | MDRS Subscale | M (SD) | M (SD) | |
| 1. I bottled up my negative feelings | Emot Supp | 4.62 (1.99) | 5.14 (1.96) | 3.77, 0.053, (0.016) |
| 2. I covered up my difficulties | Emot Supp | 4.83 (1.99) | 5.25 (1.81) | 2.69, 0.102, (0.012) |
| 3. I drank more alcohol than usual | Alcohol | 1.04 (1.71) | 1.32 (1.96) | 1.15, 0.284, (0.005) |
| 4. I drove dangerously or aggressively | Risk | 0.71 (1.42) | 1.04 (1.87) | 2.29, 0.132, (0.010) |
| 5. I had more heartburn than usual | Somatic | 1.04 (1.56) | 1.50 (2.00) | 3.48, 0.063, (0.015) |
| 6. I had regular headaches | Somatic | 1.94 (2.12) | 1.70 (1.99) | 1.03, 0.312, (0.004) |
| 7. I had stomach pains | Somatic | 1.76 (2.14) | 1.80 (2.13) | 0.02, 0.893, (0.000) |
| 8. I had to work things out by myself | Emot Supp | 4.77 (1.88) | 5.71 (1.72) | 15.02, <0.001, (0.061) |
| 9. I had unexplained aches and pains | Somatic | 2.43 (2.40) | 2.92 (2.56) | 3.72, 0.055, (0.016) |
| 10. I needed alcohol to help me unwind | Alcohol | 1.11 (2.09) | 1.35 (2.18) | 0.62, 0.431, (0.003) |
| 11. I needed to have easy access to alcohol | Alcohol | 0.81 (1.91) | 0.83 (1.87) | 0.00, 971, (0.000) |
| 12. I overreacted to situations with aggressive behaviour | Anger | 1.71 (1.84) | 2.19 (1.93) | 3.83, 0.052, (0.016) |
| 13. I sought out drugs | Drug Use | 1.05 (2.08) | 1.24 (2.29) | 0.54, 0.461, (0.002) |
| 14. I stopped caring about the consequences of my actions | Risk | 1.44 (1.82) | 2.18 (2.01) | 7.02, 0.009, (0.029) |
| 15. I stopped feeling so bad while drinking | Alcohol | 0.93 (1.86) | 1.24 (1.97) | 1.08, 0.300, (0.005) |
| 16. I took unnecessary risks | Risk | 0.98 (1.56) | 1.50 (1.80) | 4.32, 0.039, (0.018) |
| 17. I tried to ignore feeling down | Emot Supp | 3.89 (2.29) | 4.49 (2.46) | 2.64, 0.106, (0.011) |
| 18. I used drugs to cope | Drug Use | 0.95 (2.07) | 1.46 (2.54) | 3.03, 0.083, (0.013) |
| 19. I verbally lashed out at others without being provoked | Anger | 1.26 (1.68) | 1.45 (1.58) | 0.83, 0.363, (0.004) |
| 20. I was verbally aggressive to others | Anger | 1.28 (1.62) | 1.61 (1.69) | 2.41, 0.012, (0.010) |
| 21. It was difficult to manage my anger | Anger | 1.93 (2.06) | 2.48 (2.29) | 3.10, 0.808, (0.013) |
| 22. Using drugs provided temporary relief | Drug Use | 0.92 (1.97) | 1.20 (2.20) | 0.99, 0.320, (0.004) |
| Subscale/Total Score | α (ω) | |||
| MDRS- Emotion Suppression | 0.732 (0.729) | 18.12 (6.24) | 20.58 (5.60) | 8.91, 0.003, (0.037) |
| MDRS—Drug Use | 0.953 (0.956) | 2.92 (5.91) | 3.90 (6.67) | 1.50, 0.223, (0.006) |
| MDRS—Alcohol Use | 0.932 (0.936) | 3.89 (7.00) | 4.73 (7.34) | 0.65, 0.420, (0.003) |
| MDRS—Anger & Aggression | 0.856 (0.856) | 6.19 (6.19) | 7.72 (6.30) | 3.51, 0.062, (0.015) |
| MDRS—Somatic Symptoms | 0.776 (0.781) | 7.66 (6.93) | 7.42 (6.19) | 0.26, 0.871, (0.032) |
| MDRS—Risk Taking | 0.652 (0.695) | 3.13 (3.99) | 4.72 (4.13) | 7.69, 0.006, (0.032) |
| MDRS—22 total score | See Table 2 | 41.90 (21.50) | 49.08 (19.93) | 6.35, 0.012, (0.027) |
| PHQ-9 total score | See Table 2 | 16.06 (6.52) | 17.12 (6.07) | 1.60, 0.206, (0.007) |
| PHQ | MDRS | |||||
|---|---|---|---|---|---|---|
| Reliability | Baseline | 3-mo | 6-mo | Baseline | 3-mo | 6-mo |
| Cronbach alpha | 0.864 | 0.899 | 0.906 | 0.842 | 0.879 | 0.871 |
| McDonald omega | 0.861 | 0.897 | 0.905 | 0.806 | 0.861 | 0.852 |
| Pearson correlation | 1. | 2. | 3. | 4. | 5. | 6. |
| 1. PHQ baseline | - | |||||
| 2. PHQ 3-Mo | 0.705 *** | - | ||||
| 3. PHQ 6-Mo | 0.643 *** | 0.713 *** | - | |||
| 4. MDRS baseline | 0.557 *** | 0.318 *** | 0.360 *** | - | ||
| 5. MDRS 3-Mo | 0.484 *** | 0.602 *** | 0.534 *** | 0.599 *** | - | |
| 6. MDRS 6-Mo | 0.389 *** | 0.434 *** | 0.632 *** | 0.549 *** | 0.699 *** | - |
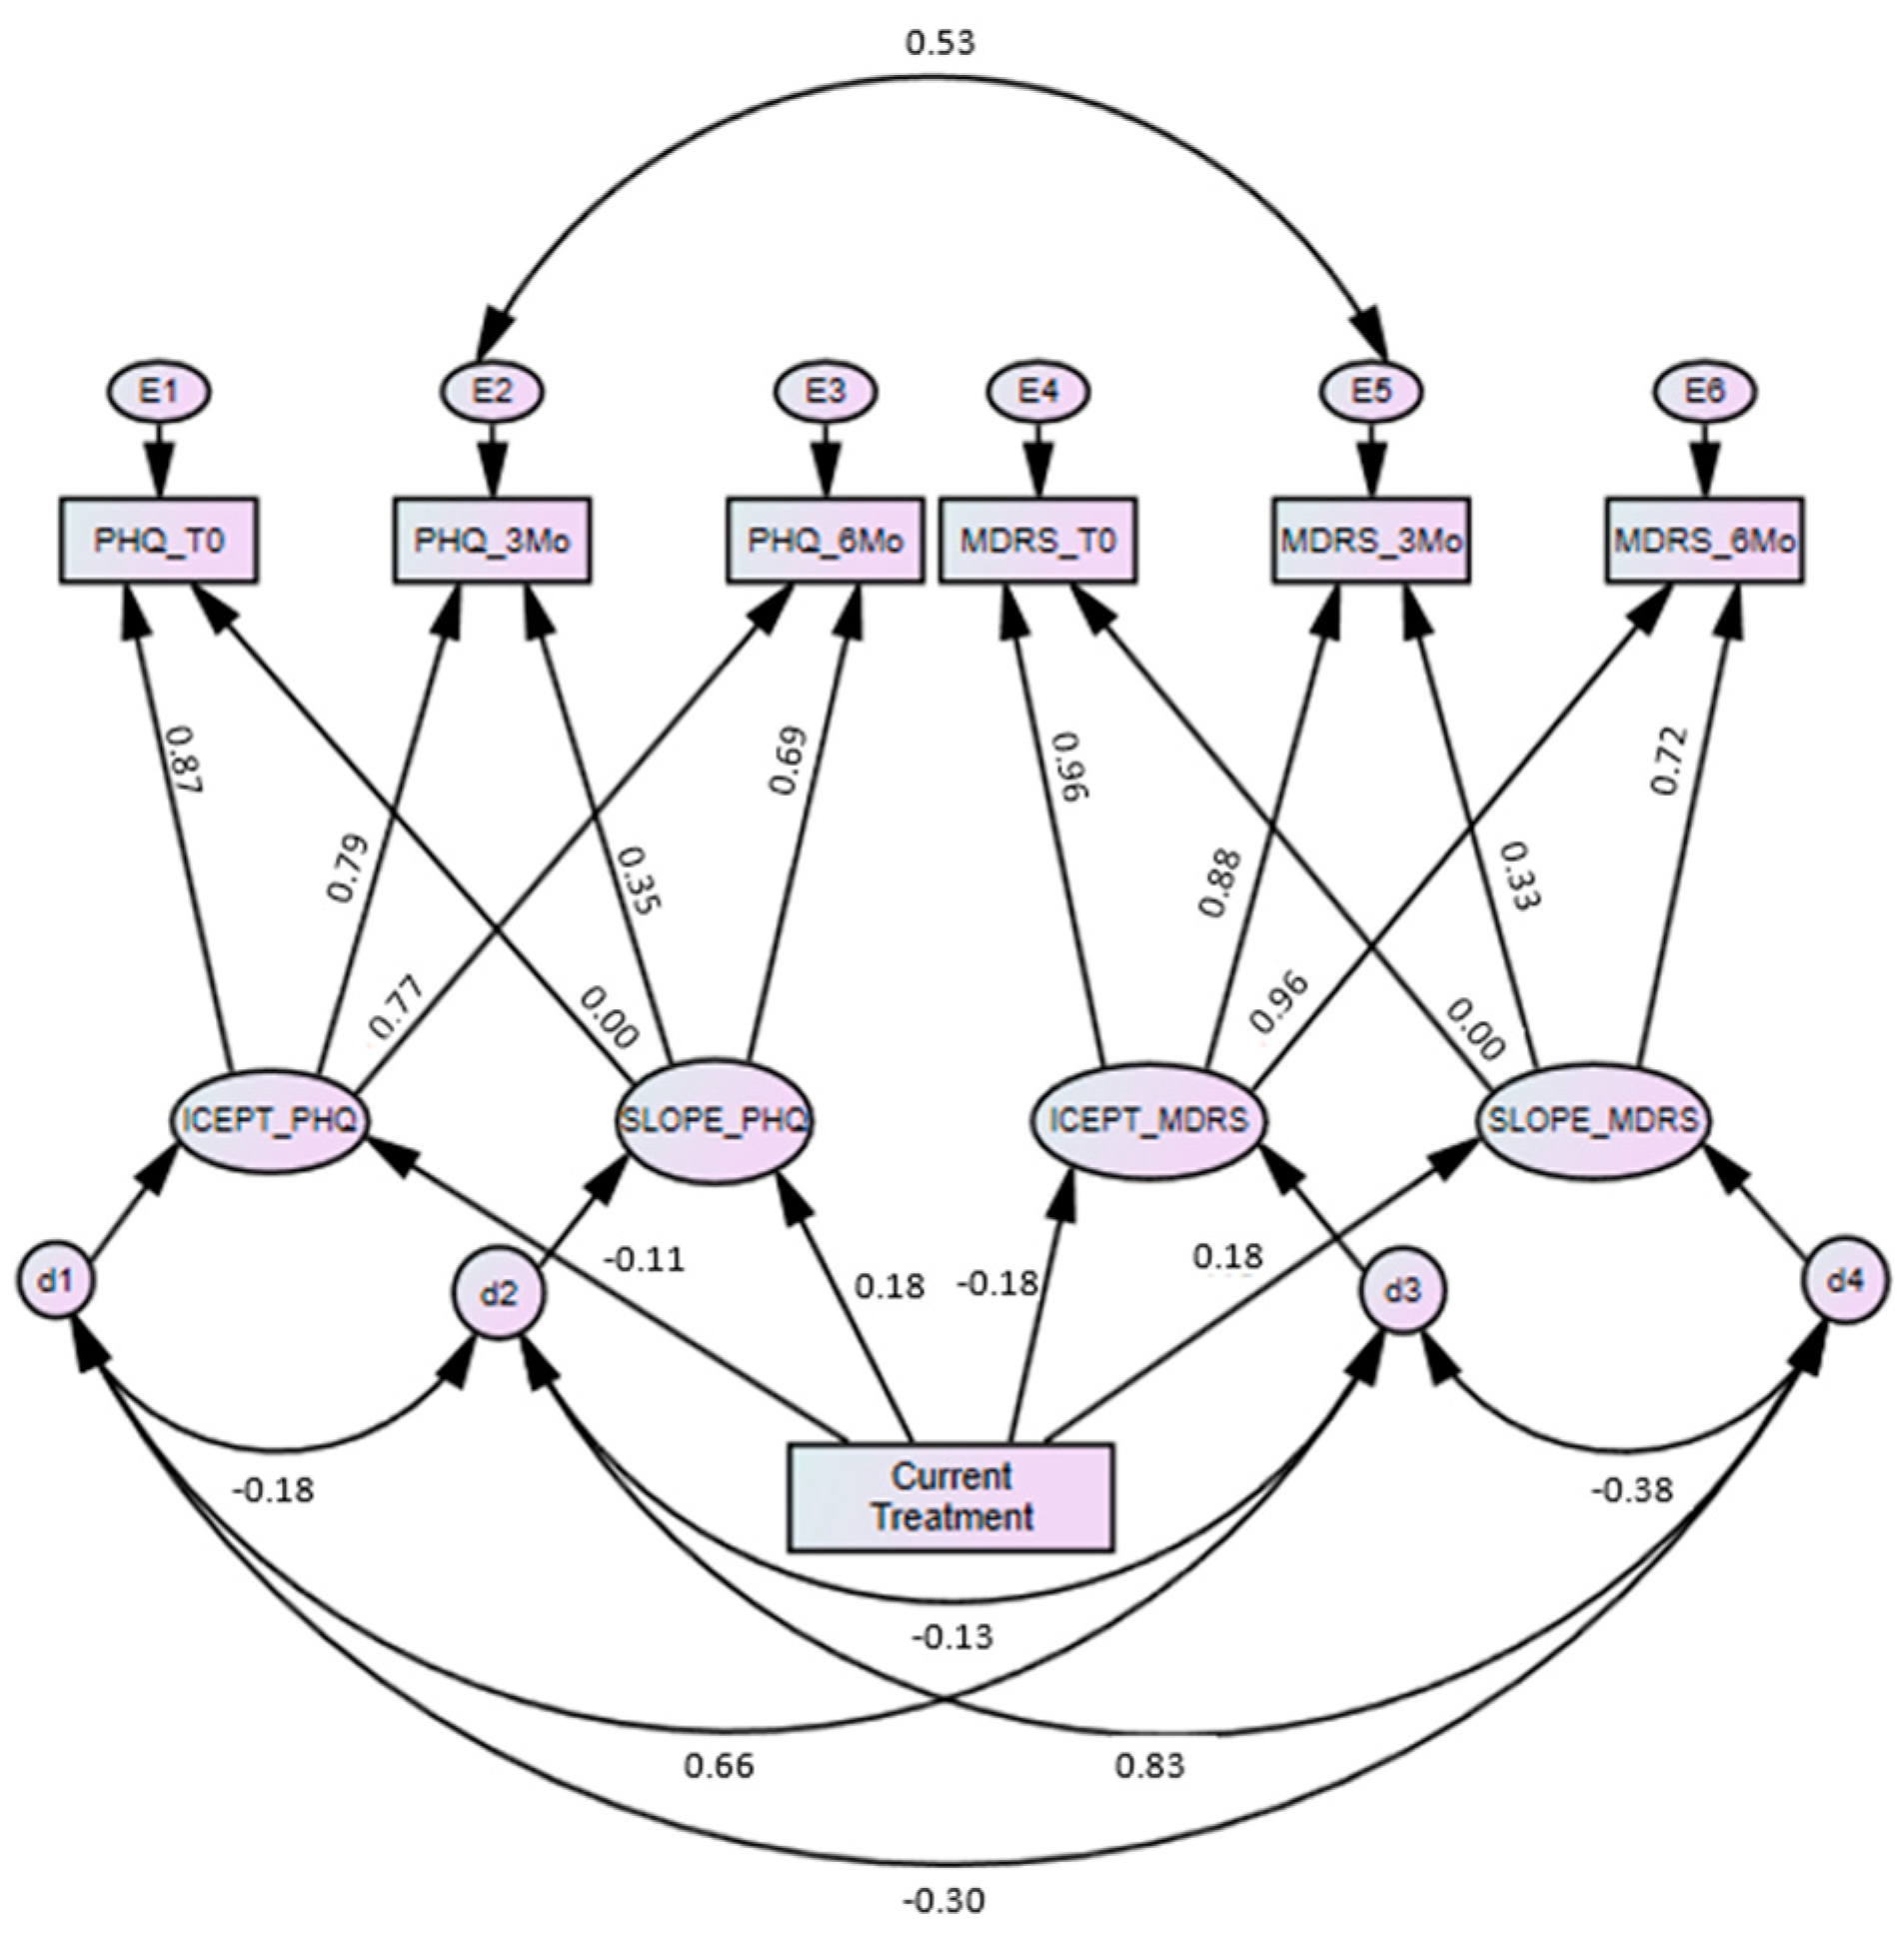
| Regression Weights | Estimate | SE | C.R. | p |
|---|---|---|---|---|
| PHQ intercept <- Current Tx | −1.202 | 0.825 | −1.456 | 0.145 |
| PHQ slope <- Current Tx | 0.897 | 0.421 | 2.131 | 0.033 |
| MDRS intercept <- Current Tx | −7.476 | 2.719 | −2.749 | 0.006 |
| MDRS slope <- Current Tx | 2.749 | 1.164 | 2.361 | 0.018 |
| Standardised estimates | ||||
| PHQ intercept <- Current Tx | −0.107 | |||
| PHQ slope <- Current Tx | 0.179 | |||
| MDRS intercept <- Current Tx | −0.184 | |||
| MDRS slope <- Current Tx | 0.179 | |||
| PHQ baseline <- PHQ intercept | 0.872 | |||
| PHQ baseline <- PHQ slope | 0.000 | |||
| PHQ 3-Mo <- PHQ intercept | 0.792 | |||
| PHQ 3-Mo <- PHQ slope | 0.353 | |||
| PHQ 6-Mo <- PHQ intercept | 0.774 | |||
| PHQ 6-Mo <- PHQ slope | 0.689 | |||
| MDRS baseline <- MDRS intercept | 0.959 | |||
| MDRS baseline <- MDRS slope | 0.000 | |||
| MDRS 3-Mo <- MDRS intercept | 0.884 | |||
| MDRS 3-Mo <- MDRS slope | 0.334 | |||
| MDRS 6-Mo <- MDRS intercept | 0.956 | |||
| MDRS 6-Mo <- MDRS slope | 0.723 |
© 2020 by the authors. Licensee MDPI, Basel, Switzerland. This article is an open access article distributed under the terms and conditions of the Creative Commons Attribution (CC BY) license (http://creativecommons.org/licenses/by/4.0/).
Share and Cite
Rice, S.M.; Kealy, D.; Seidler, Z.E.; Oliffe, J.L.; Levant, R.F.; Ogrodniczuk, J.S. Male-Type and Prototypal Depression Trajectories for Men Experiencing Mental Health Problems. Int. J. Environ. Res. Public Health 2020, 17, 7322. https://doi.org/10.3390/ijerph17197322
Rice SM, Kealy D, Seidler ZE, Oliffe JL, Levant RF, Ogrodniczuk JS. Male-Type and Prototypal Depression Trajectories for Men Experiencing Mental Health Problems. International Journal of Environmental Research and Public Health. 2020; 17(19):7322. https://doi.org/10.3390/ijerph17197322
Chicago/Turabian StyleRice, Simon M., David Kealy, Zac E. Seidler, John L. Oliffe, Ronald F. Levant, and John S. Ogrodniczuk. 2020. "Male-Type and Prototypal Depression Trajectories for Men Experiencing Mental Health Problems" International Journal of Environmental Research and Public Health 17, no. 19: 7322. https://doi.org/10.3390/ijerph17197322