
Effectiveness of Body Roundness Index (BRI) and a Body Shape Index (ABSI) in Predicting Hypertension: A Systematic Review and Meta-Analysis of Observational Studies

 , , and
Abstract
:1. Introduction
2. Methods
2.1. Search Strategy and Study Selection
- (1)
- Primary observational studies published in peer review journals: cross-sectional or prospective design.
- (2)
- Studies in humans ≥18 years.
- (3)
- Anthropometric indices: BRI and ABSI.
- (4)
- Purpose: to evaluate the predictive value of BRI and ABSI for hypertension or high BP.
- (5)
- For the meta-analysis: studies reporting predictive measures: area under the curve (AUC) with 95% confidence interval (95% CI).
- (1)
- Letters to the editor or abstracts from conference proceedings, protocols and review studies.
- (2)
- Studies of adolescents and/or children.
- (3)
- Papers that provided no predictive statistics (AUC 95% CI) for BRI and ABSI for hypertension or high BP.
- (4)
- Articles without an abstract and full text in Spanish or English.
2.2. Data Extraction
2.3. Data Synthesis and Analyses
3. Results
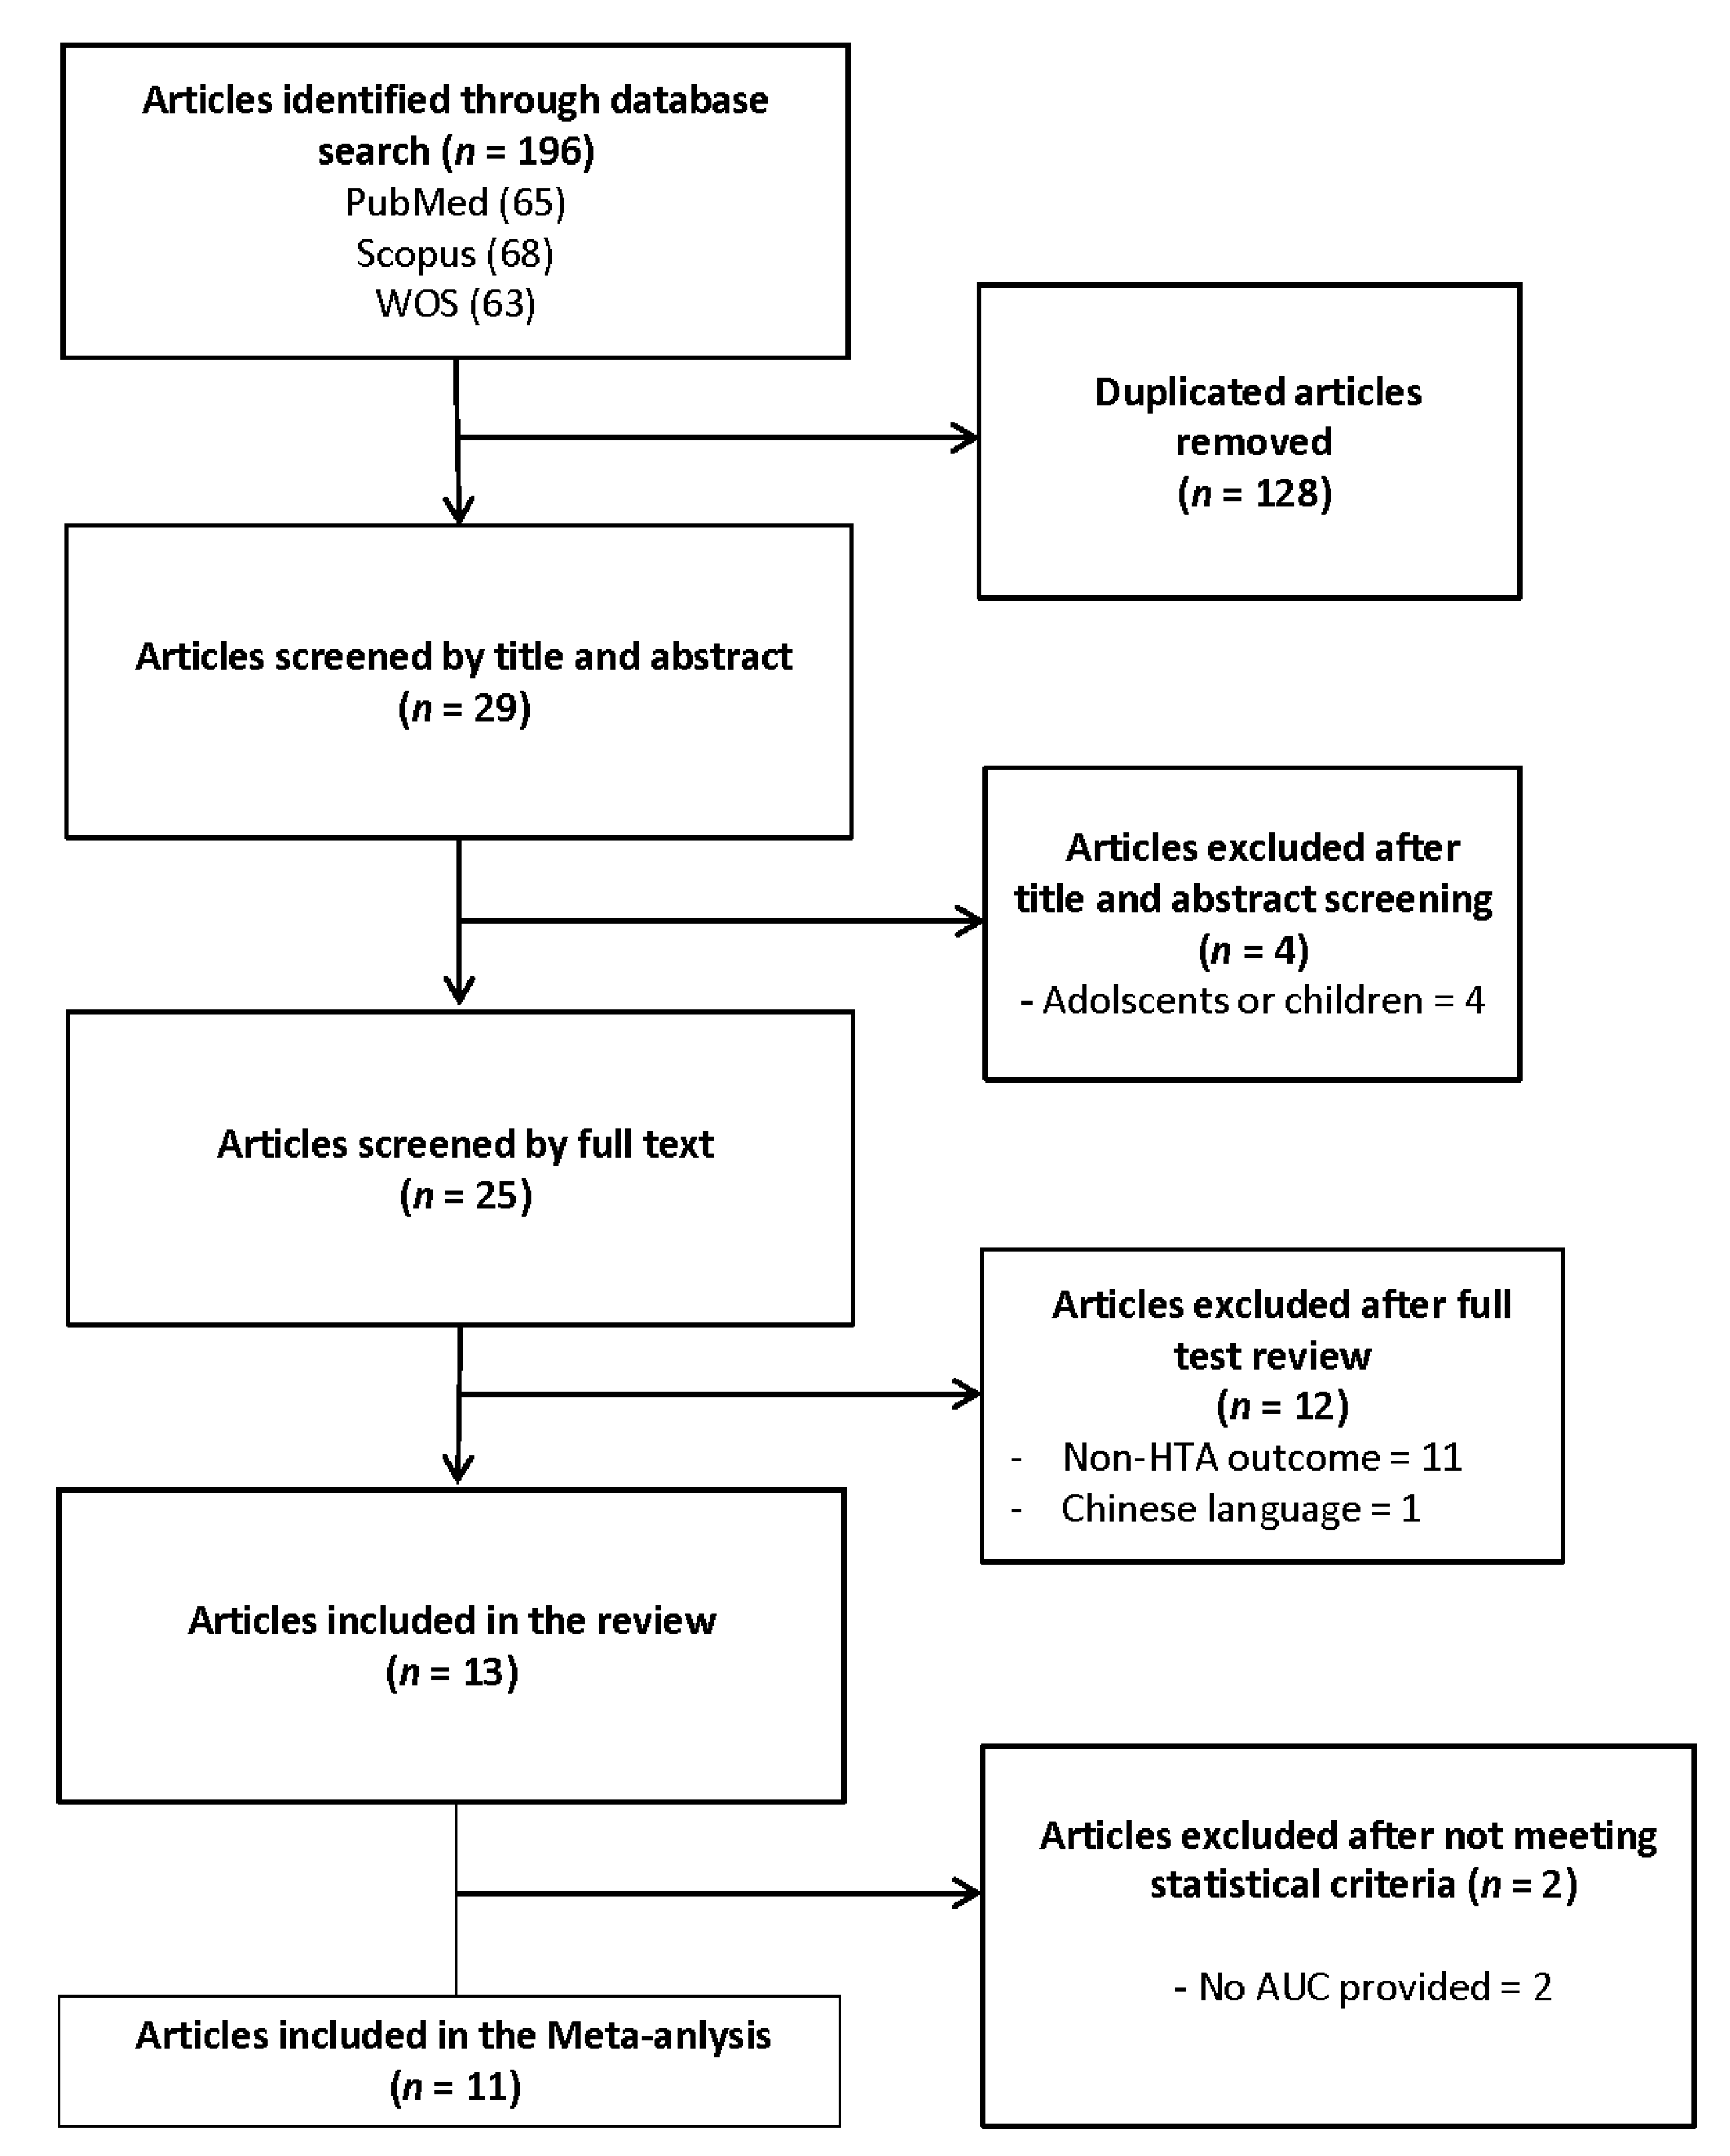
3.1. Study Selection
3.2. Study Characteristics
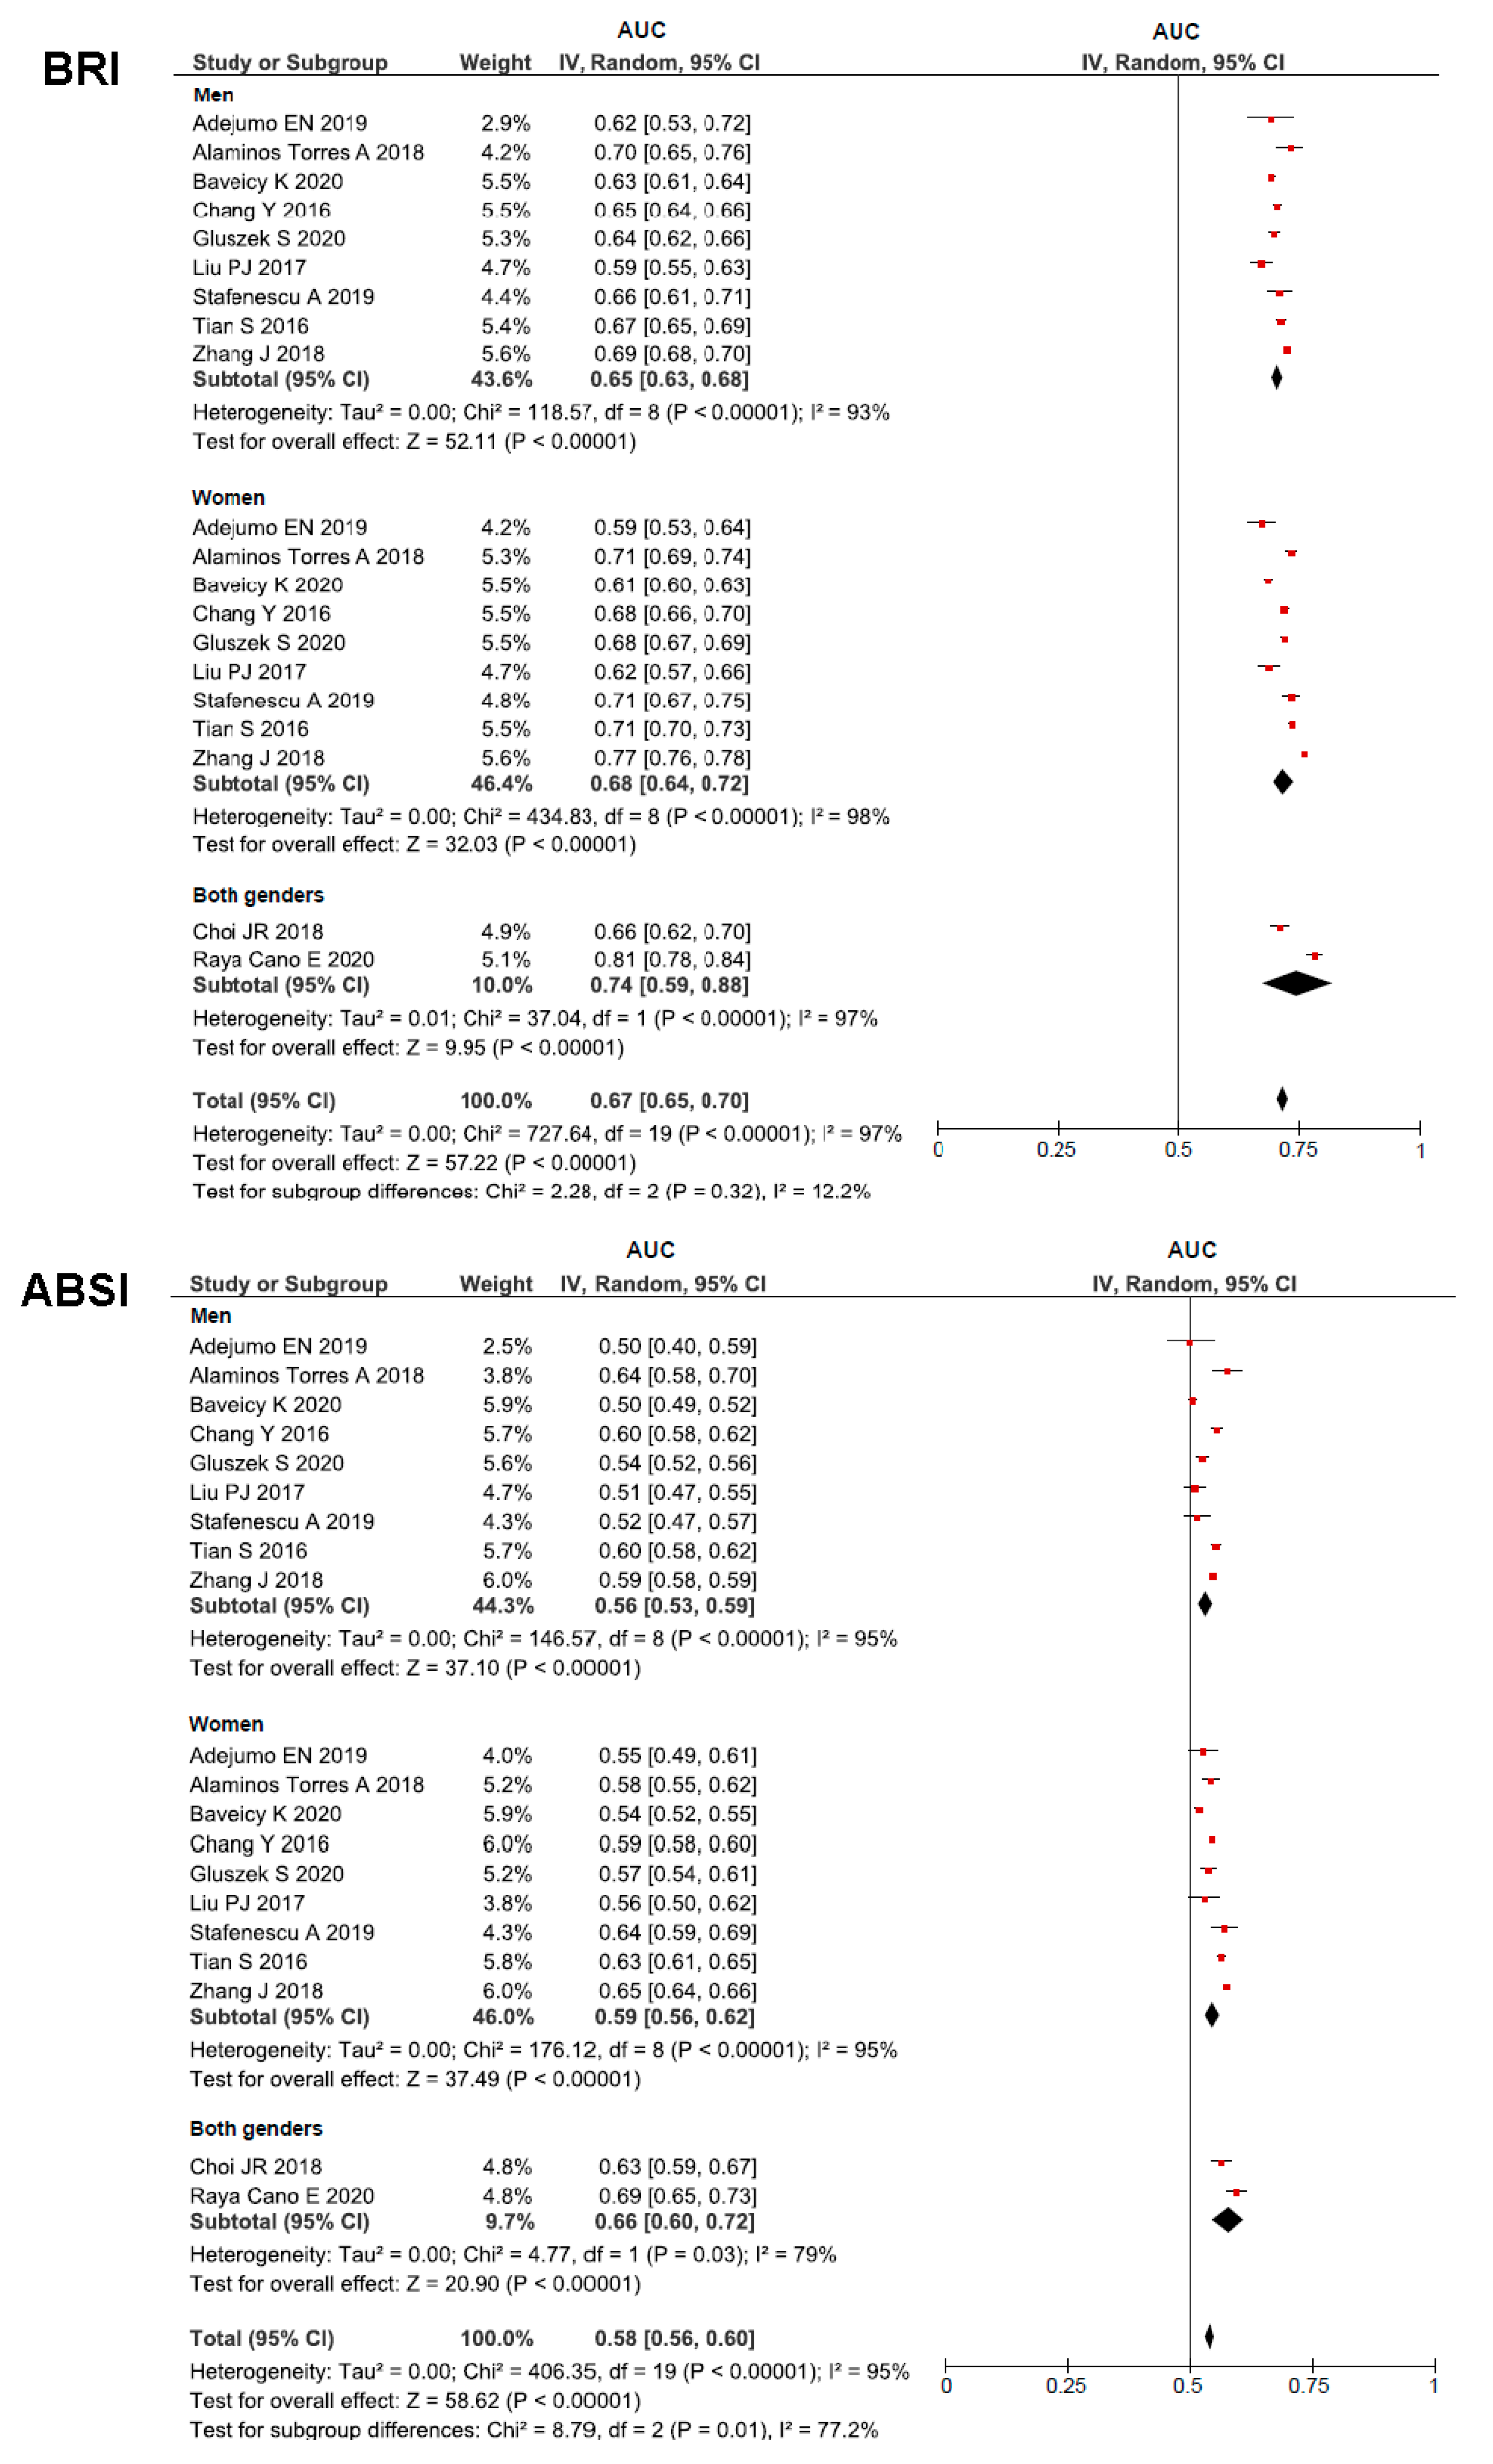
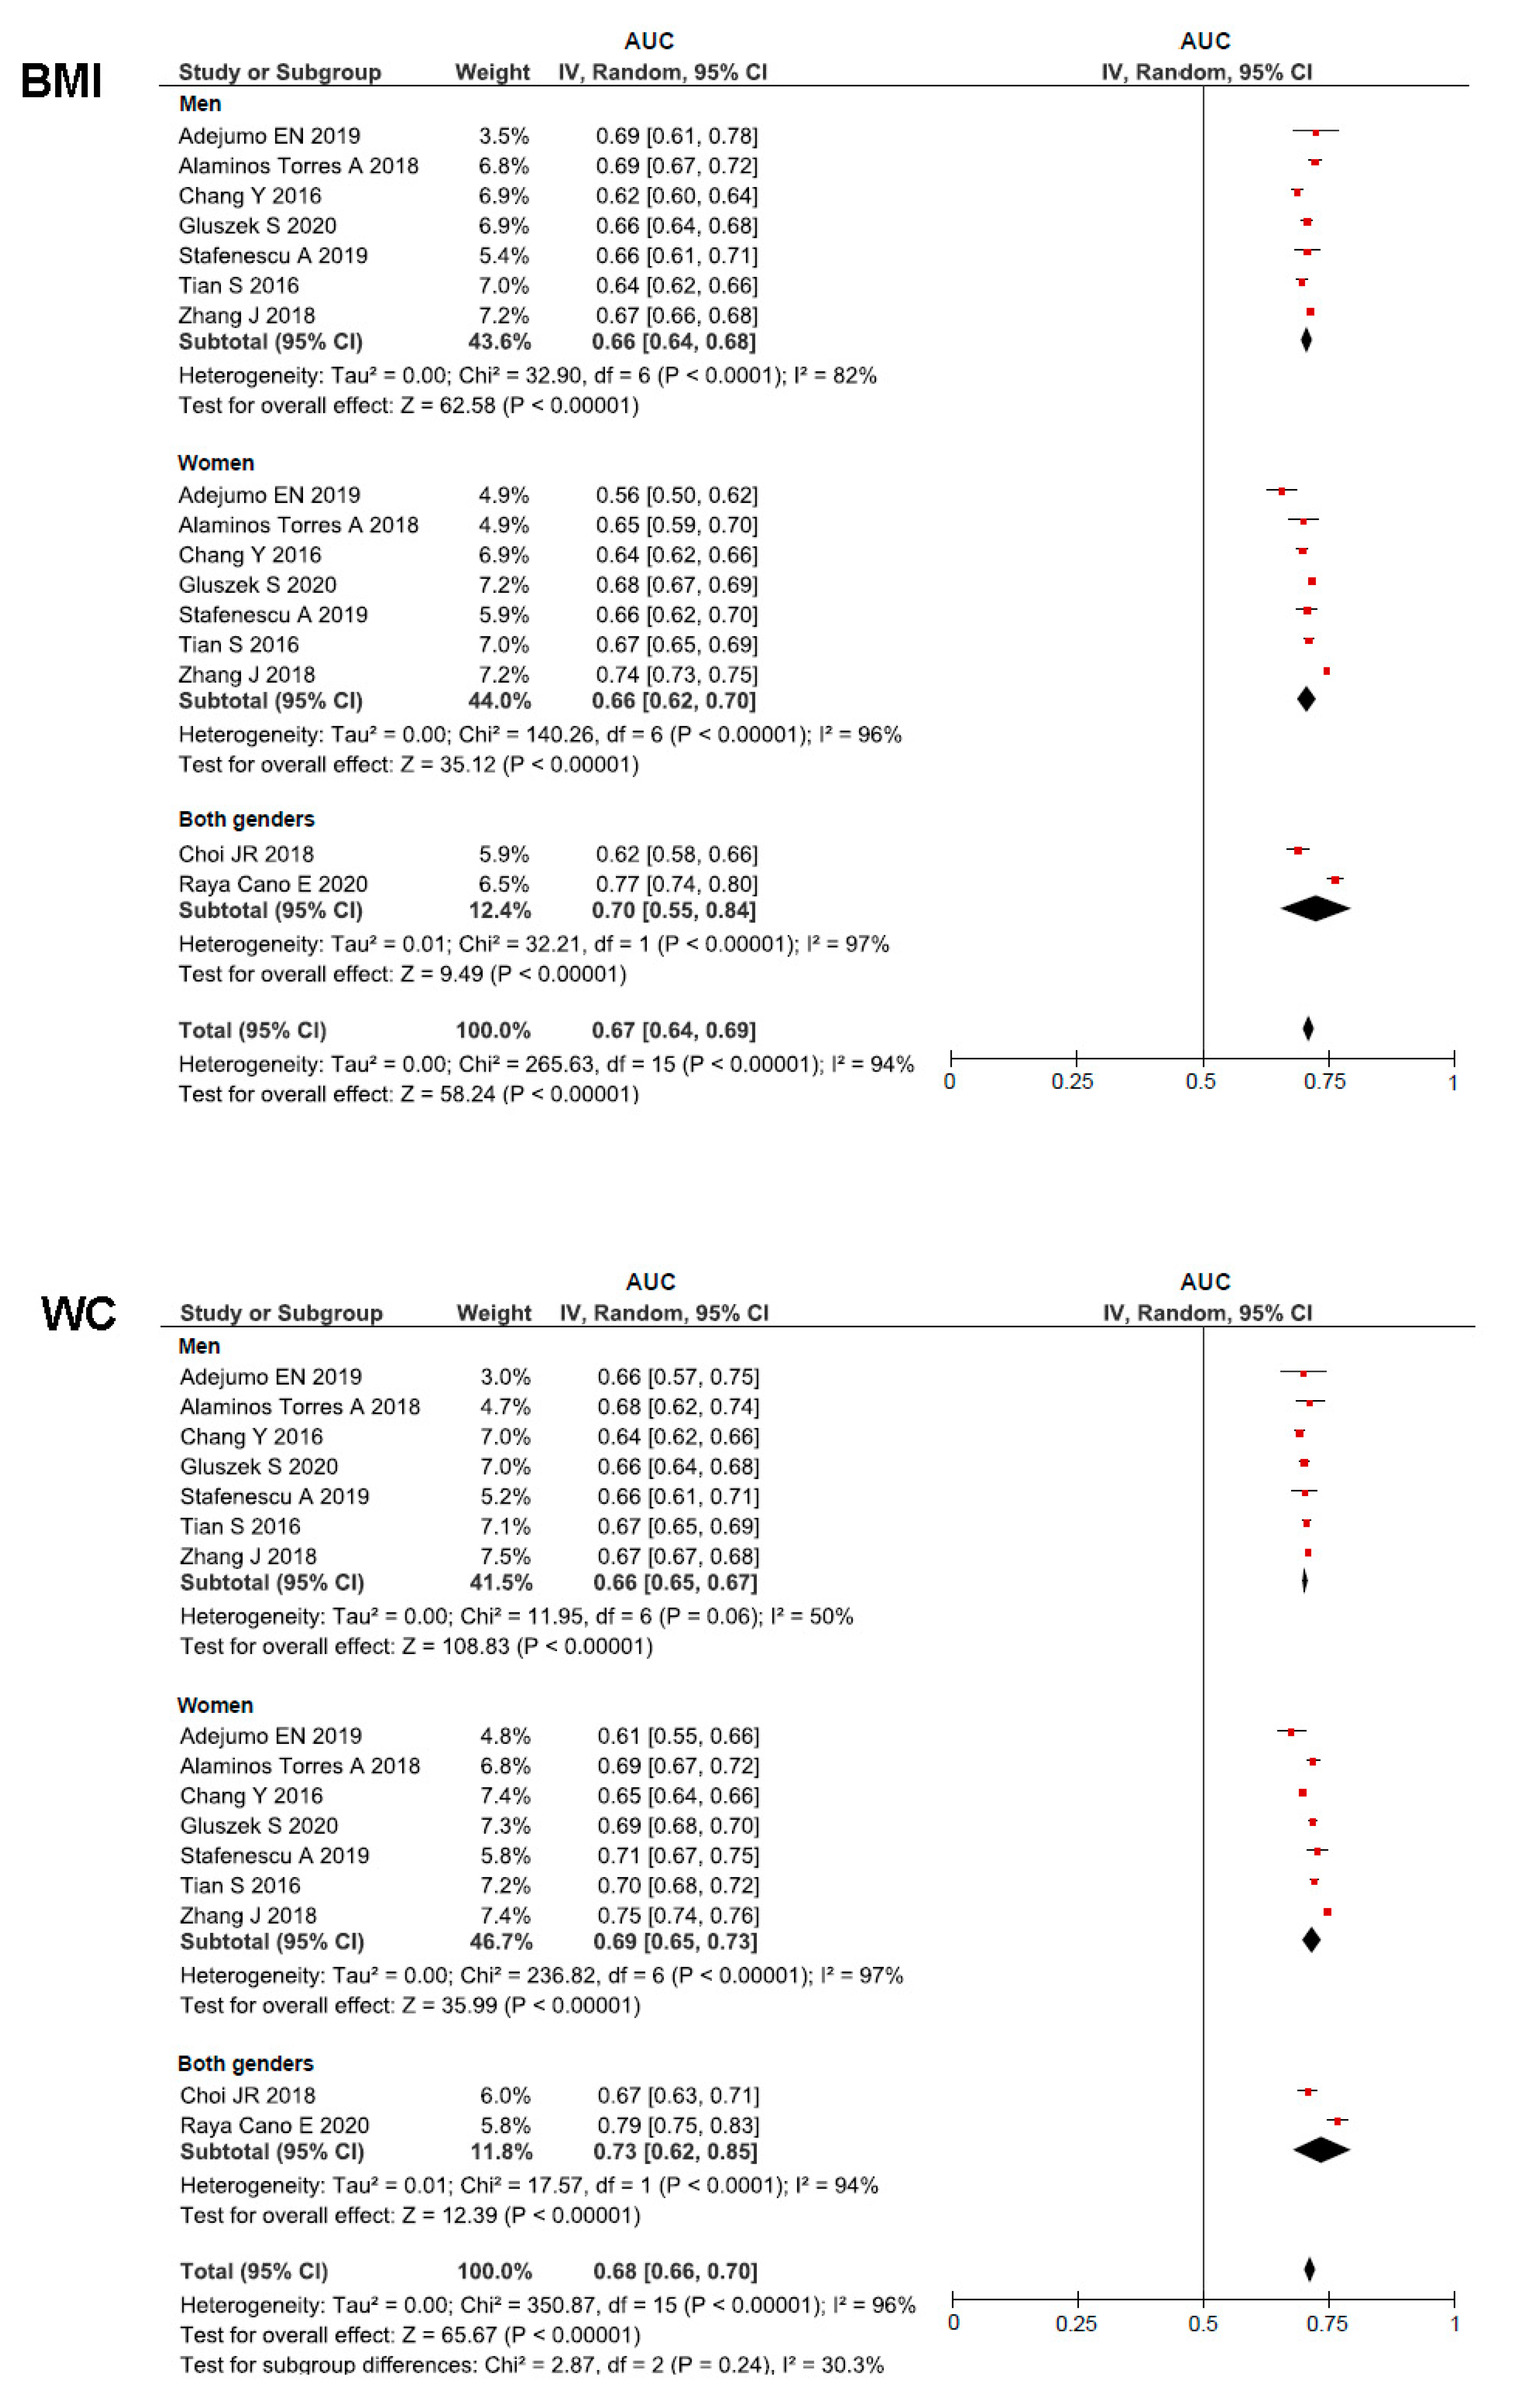
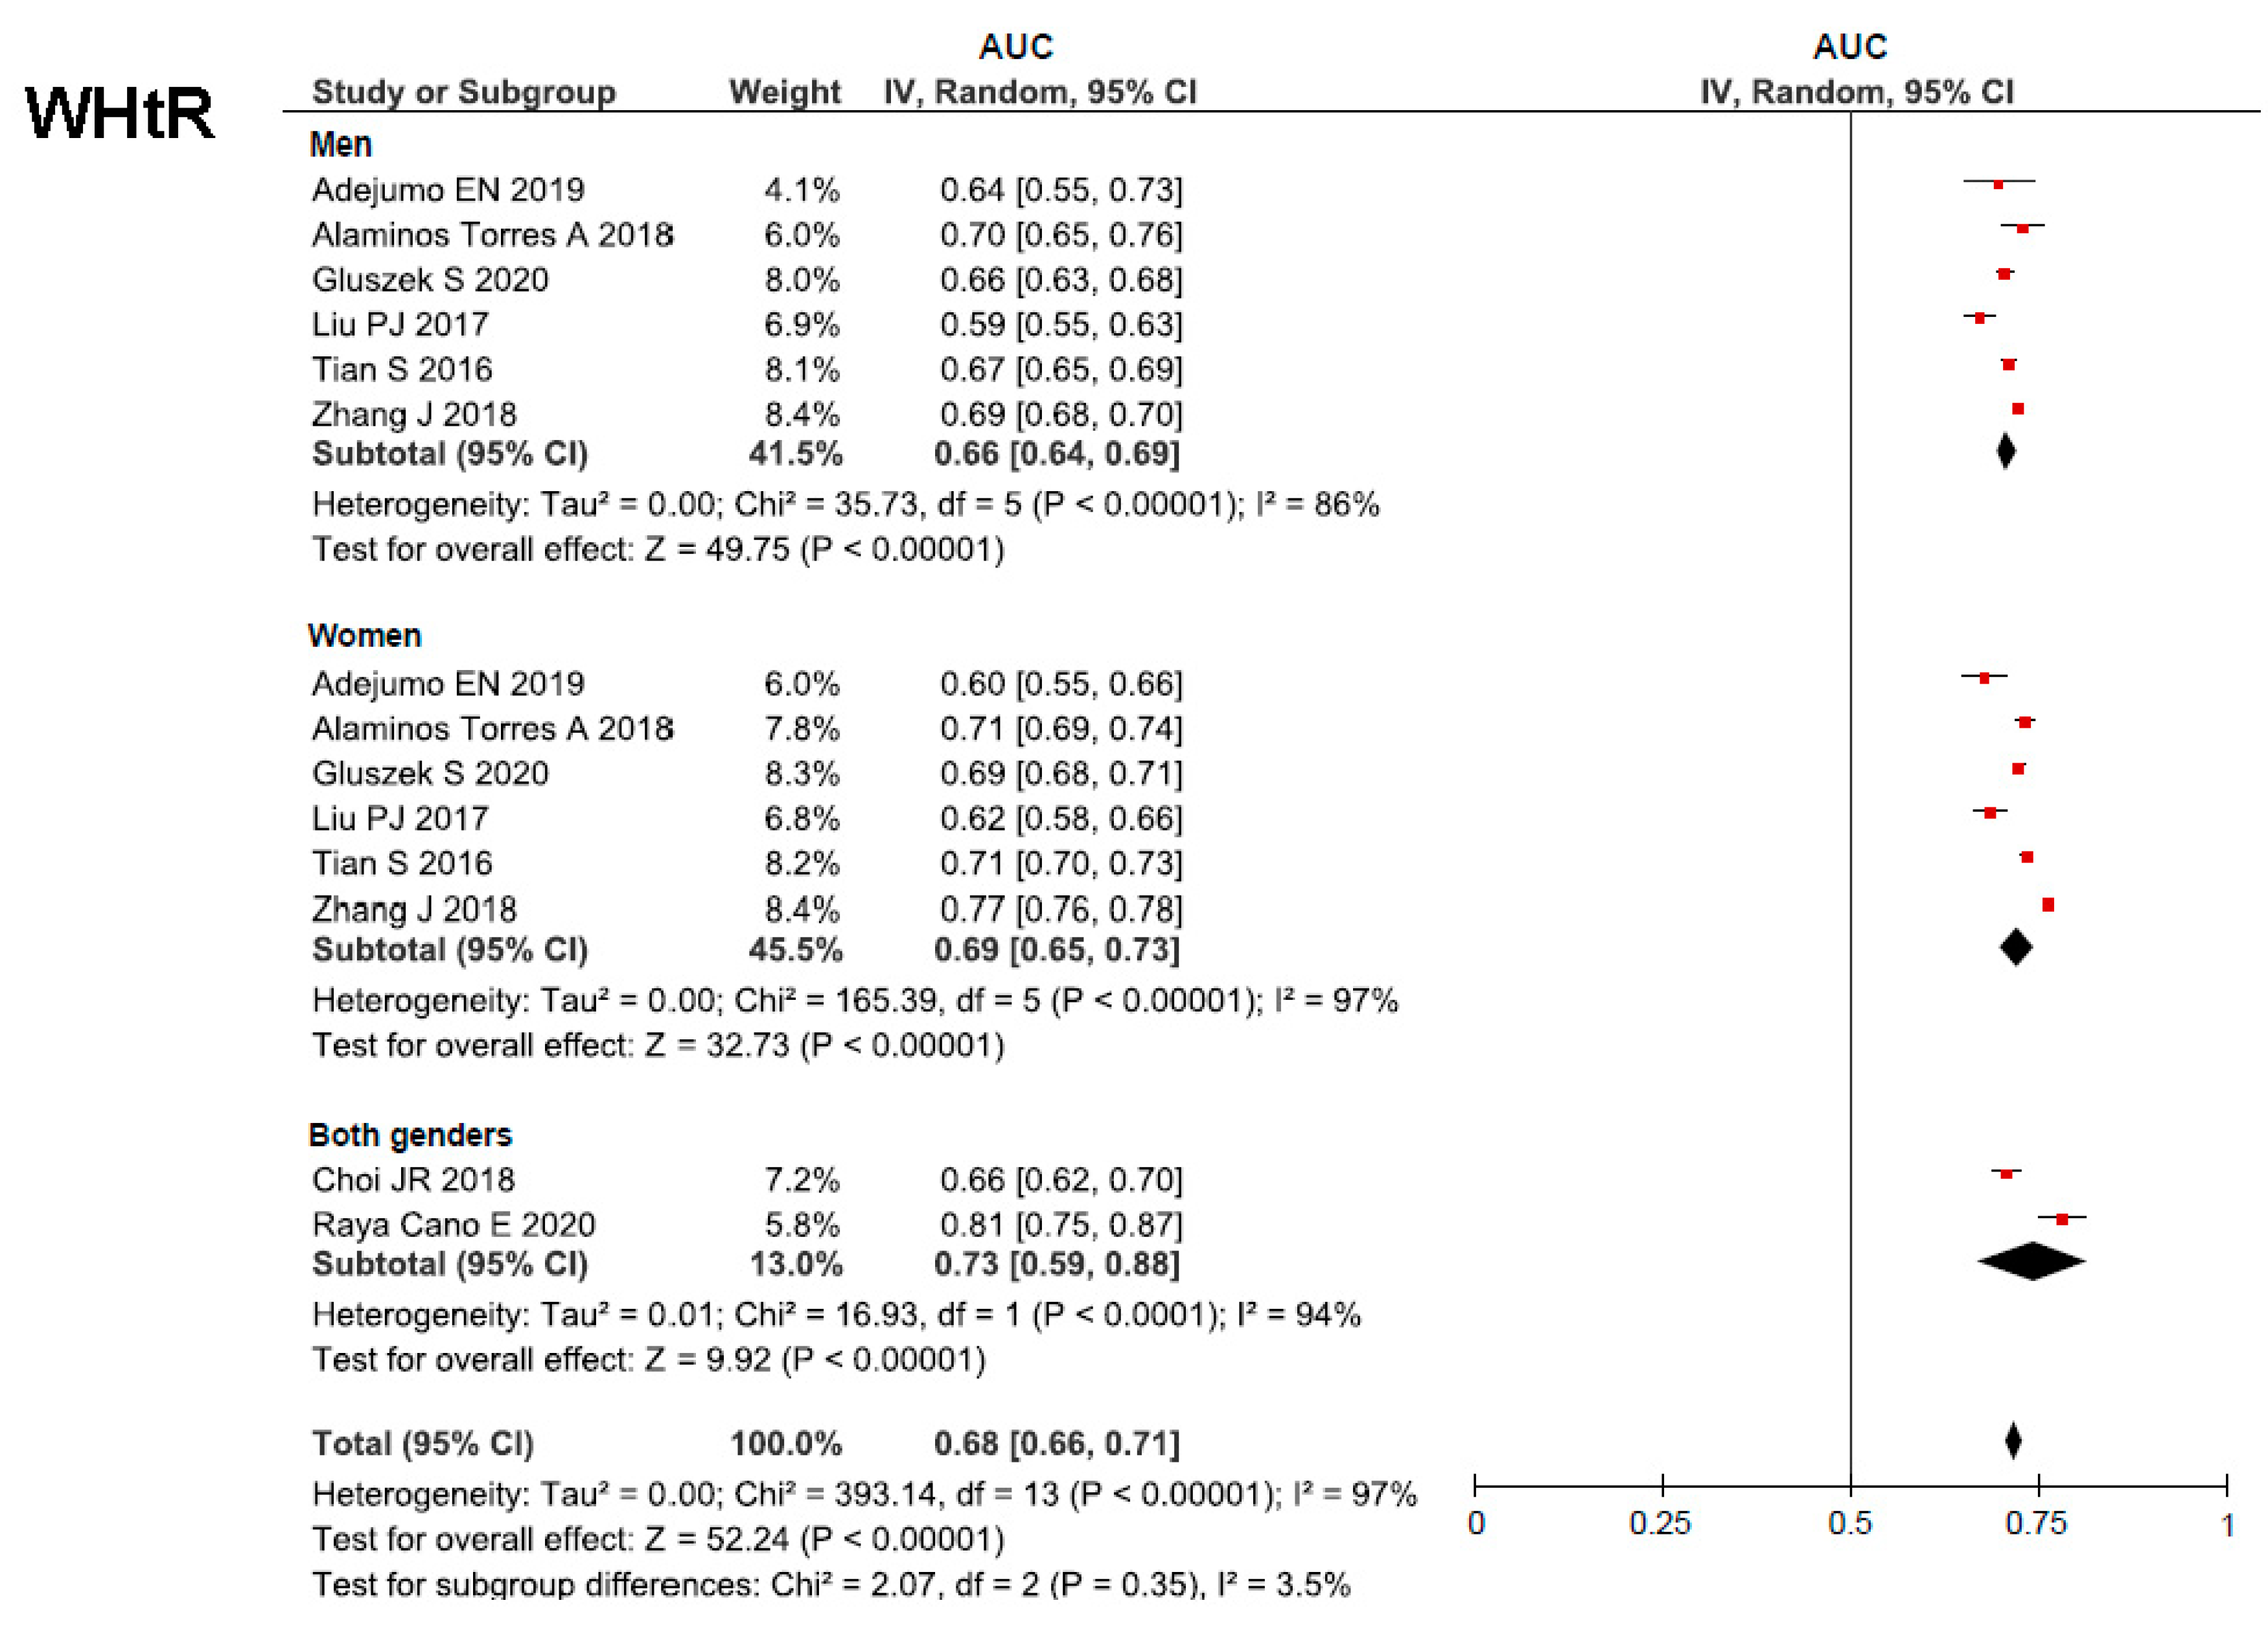
3.3. Meta-Analysis
3.4. Quality of Studies and Publication Bias
4. Discussion
5. Conclusions
Supplementary Materials
Author Contributions
Funding
Institutional Review Board Statement
Informed Consent Statement
Data Availability Statement
Conflicts of Interest
References
- Kannel, W.B. Blood pressure as a cardiovascular risk factor: Prevention and treatment. JAMA 1996, 275, 1571–1576. [Google Scholar] [CrossRef] [PubMed]
- Mills, K.T.; Bundy, J.D.; Kelly, T.N.; Reed, J.E.; Kearney, P.M.; Reynolds, K.; Chen, J.; He, J. Global Disparities of Hypertension Prevalence and Control: A Systematic Analysis of Population-Based Studies From 90 Countries. Circulation 2016, 134, 441–450. [Google Scholar] [CrossRef]
- Muntner, P.; Carey, R.M.; Gidding, S.; Jones, D.W.; Taler, S.J.; Wright, J.T.J.; Whelton, P.K. Potential US Population Impact of the 2017 ACC/AHA High Blood Pressure Guideline. Circulation 2018, 137, 109–118. [Google Scholar] [CrossRef] [PubMed]
- Yoon, S.S.; Gu, Q.; Nwankwo, T.; Wright, J.D.; Hong, Y.; Burt, V. Trends in blood pressure among adults with hypertension: United States, 2003 to 2012. Hypertension 2015, 65, 54–61. [Google Scholar] [CrossRef] [PubMed] [Green Version]
- Flint, A.C.; Conell, C.; Ren, X.; Banki, N.M.; Chan, S.L.; Rao, V.A.; Melles, R.B.; Bhatt, D.L. Effect of Systolic and Diastolic Blood Pressure on Cardiovascular Outcomes. N. Engl. J. Med. 2019, 381, 243–251. [Google Scholar] [CrossRef]
- Hsu, C.; McCulloch, C.E.; Darbinian, J.; Go, A.S.; Iribarren, C. Elevated blood pressure and risk of end-stage renal disease in subjects without baseline kidney disease. Arch. Intern. Med. 2005, 165, 923–928. [Google Scholar] [CrossRef] [Green Version]
- Emdin, C.A.; Anderson, S.G.; Callender, T.; Conrad, N.; Salimi-Khorshidi, G.; Mohseni, H.; Woodward, M.; Rahimi, K. Usual blood pressure, peripheral arterial disease, and vascular risk: Cohort study of 4.2 million adults. BMJ 2015, 351, h4865. [Google Scholar] [CrossRef] [Green Version]
- Lewington, S.; Clarke, R.; Qizilbash, N.; Peto, R.; Collins, R. Age-specific relevance of usual blood pressure to vascular mortality: A meta-analysis of individual data for one million adults in 61 prospective studies. Lancet 2002, 360, 1903–1913. [Google Scholar]
- Whelton, P.K.; Carey, R.M.; Aronow, W.S.; Casey, D.E.J.; Collins, K.J.; Dennison Himmelfarb, C.; DePalma, S.M.; Gidding, S.; Jamerson, K.A.; Jones, D.W.; et al. 2017 ACC/AHA/AAPA/ABC/ACPM/AGS/APhA/ASH/ASPC/NMA/PCNA Guideline for the Prevention, Detection, Evaluation, and Management of High Blood Pressure in Adults: A Report of the American College of Cardiology/American Heart Association Task Force on Clinical Pr. Hypertension 2018, 71, e13–e115. [Google Scholar]
- Forman, J.P.; Stampfer, M.J.; Curhan, G.C. Diet and lifestyle risk factors associated with incident hypertension in women. JAMA 2009, 302, 401–411. [Google Scholar] [CrossRef] [PubMed] [Green Version]
- Sonne-Holm, S.; Sørensen, T.I.; Jensen, G.; Schnohr, P. Independent effects of weight change and attained body weight on prevalence of arterial hypertension in obese and non-obese men. BMJ 1989, 299, 767–770. [Google Scholar] [CrossRef] [Green Version]
- Appel, L.J.; Brands, M.W.; Daniels, S.R.; Karanja, N.; Elmer, P.J.; Sacks, F.M. Dietary approaches to prevent and treat hypertension: A scientific statement from the American Heart Association. Hypertension 2006, 47, 296–308. [Google Scholar] [CrossRef] [Green Version]
- Schmieder, R.E.; Messerli, F.H. Does obesity influence early target organ damage in hypertensive patients? Circulation 1993, 87, 1482–1488. [Google Scholar] [CrossRef] [PubMed] [Green Version]
- Ahmed, S.B.; Fisher, N.D.L.; Stevanovic, R.; Hollenberg, N.K. Body mass index and angiotensin-dependent control of the renal circulation in healthy humans. Hypertension 2005, 46, 1316–1320. [Google Scholar] [CrossRef] [Green Version]
- Sarzani, R.; Salvi, F.; Dessì-Fulgheri, P.; Rappelli, A. Renin-angiotensin system, natriuretic peptides, obesity, metabolic syndrome, and hypertension: An integrated view in humans. J. Hypertens. 2008, 26, 831–843. [Google Scholar] [CrossRef]
- Hall, J.E.; do Carmo, J.M.; da Silva, A.A.; Wang, Z.; Hall, M.E. Obesity-induced hypertension: Interaction of neurohumoral and renal mechanisms. Circ. Res. 2015, 116, 991–1006. [Google Scholar] [CrossRef] [PubMed] [Green Version]
- Pischon, T.; Boeing, H.; Hoffmann, K.; Bergmann, M.; Schulze, M.B.; Overvad, K.; van der Schouw, Y.T.; Spencer, E.; Moons, K.G.M.; Tjonneland, A.; et al. General and abdominal adiposity and risk of death in Europe. N. Engl. J. Med. 2008, 359, 2105–2120. [Google Scholar] [CrossRef] [PubMed] [Green Version]
- Whitlock, G.; Lewington, S.; Sherliker, P.; Clarke, R.; Emberson, J.; Halsey, J.; Qizilbash, N.; Collins, R.; Peto, R. Body-mass index and cause-specific mortality in 900 000 adults: Collaborative analyses of 57 prospective studies. Lancet 2009, 373, 1083–1096. [Google Scholar]
- Nuttall, F.Q. Body Mass Index: Obesity, BMI, and Health: A Critical Review. Nutr. Today 2015, 50, 117–128. [Google Scholar] [CrossRef] [Green Version]
- WHO. Physical Status: The Use of and Reading of Anthropometry, Report by a WHO Expert Committee; World Health Organization: Geneva, Switzerland, 1995; Available online: https://apps.who.int/iris/handle/10665/37003 (accessed on 5 May 2021).
- Nevill, A.M.; Stewart, A.D.; Olds, T.; Holder, R. Relationship between adiposity and body size reveals limitations of BMI. Am. J. Phys. Anthropol. 2006, 129, 151–156. [Google Scholar] [CrossRef] [PubMed] [Green Version]
- Gomez-Ambrosi, J.; Silva, C.; Galofre, J.C.; Escalada, J.; Santos, S.; Millan, D.; Vila, N.; Ibanez, P.; Gil, M.J.; Valenti, V.; et al. Body mass index classification misses subjects with increased cardiometabolic risk factors related to elevated adiposity. Int. J. Obes. 2012, 36, 286–294. [Google Scholar] [CrossRef] [Green Version]
- Li, C.; Ford, E.S.; McGuire, L.C.; Mokdad, A.H. Increasing trends in waist circumference and abdominal obesity among US adults. Obesity 2007, 15, 216–224. [Google Scholar] [CrossRef] [PubMed] [Green Version]
- Esmaillzadeh, A.; Mirmiran, P.; Azizi, F. Waist-to-hip ratio is a better screening measure for cardiovascular risk factors than other anthropometric indicators in Tehranian adult men. Int. J. Obes. Relat. Metab. Disord. J. Int. Assoc. Study Obes. 2004, 28, 1325–1332. [Google Scholar] [CrossRef] [Green Version]
- Nishida, C.; Ko, G.T.; Kumanyika, S. Body fat distribution and noncommunicable diseases in populations: Overview of the 2008 WHO Expert Consultation on Waist Circumference and Waist-Hip Ratio. Eur. J. Clin. Nutr. 2010, 64, 2–5. [Google Scholar] [CrossRef] [Green Version]
- Ashwell, M.; Gunn, P.; Gibson, S. Waist-to-height ratio is a better screening tool than waist circumference and BMI for adult cardiometabolic risk factors: Systematic review and meta-analysis. Obes. Rev. 2012, 13, 275–286. [Google Scholar] [CrossRef] [PubMed]
- Jensen, M.D.; Ryan, D.H.; Apovian, C.M.; Ard, J.D.; Comuzzie, A.G.; Donato, K.A.; Hu, F.B.; Hubbard, V.S.; Jakicic, J.M.; Kushner, R.F.; et al. 2013 AHA/ACC/TOS guideline for the management of overweight and obesity in adults: A report of the American College of Cardiology/American Heart Association Task Force on Practice Guidelines and The Obesity Society. Circulation 2014, 129, S102–S138. [Google Scholar] [CrossRef] [Green Version]
- Deng, G.; Yin, L.; Liu, W.; Liu, X.; Xiang, Q.; Qian, Z.; Ma, J.; Chen, H.; Wang, Y.; Hu, B.; et al. Associations of anthropometric adiposity indexes with hypertension risk: A systematic review and meta-analysis including PURE-China. Medicine 2018, 97, e13262. [Google Scholar] [CrossRef]
- Jayedi, A.; Rashidy-Pour, A.; Khorshidi, M.; Shab-Bidar, S. Body mass index, abdominal adiposity, weight gain and risk of developing hypertension: A systematic review and dose-response meta-analysis of more than 2.3 million participants. Obes. Rev. Off. J. Int. Assoc. Study Obes. 2018, 19, 654–667. [Google Scholar] [CrossRef] [PubMed]
- Lee, C.M.Y.; Huxley, R.R.; Wildman, R.P.; Woodward, M. Indices of abdominal obesity are better discriminators of cardiovascular risk factors than BMI: A meta-analysis. J. Clin. Epidemiol. 2008, 61, 646–653. [Google Scholar] [CrossRef] [PubMed]
- Krakauer, N.Y.; Krakauer, J.C. A new body shape index predicts mortality hazard independently of body mass index. PLoS ONE 2012, 7, e39504. [Google Scholar] [CrossRef]
- Ji, M.; Zhang, S.; An, R. Effectiveness of A Body Shape Index (ABSI) in predicting chronic diseases and mortality: A systematic review and meta-analysis. Obes. Rev. Off. J. Int. Assoc. Study Obes. 2018, 19, 737–759. [Google Scholar] [CrossRef] [PubMed]
- Krakauer, N.Y.; Krakauer, J.C. Dynamic association of mortality hazard with body shape. PLoS ONE 2014, 9, e88793. [Google Scholar] [CrossRef] [PubMed]
- Rico-Martín, S.; Calderón-García, J.F.; Sánchez-Rey, P.; Franco-Antonio, C.; Martínez Alvarez, M.; Sánchez Muñoz-Torrero, J.F. Effectiveness of body roundness index in predicting metabolic syndrome: A systematic review and meta-analysis. Obes. Rev. Off. J. Int. Assoc. Study Obes. 2020, 21, e13023. [Google Scholar] [CrossRef]
- Thomas, D.M.; Bredlau, C.; Bosy-Westphal, A.; Mueller, M.; Shen, W.; Gallagher, D.; Maeda, Y.; McDougall, A.; Peterson, C.M.; Ravussin, E.; et al. Relationships between body roundness with body fat and visceral adipose tissue emerging from a new geometrical model. Obesity 2013, 21, 2264–2271. [Google Scholar] [CrossRef] [Green Version]
- Adejumo, E.N.; Adejumo, A.O.; Azenabor, A.; Ekun, A.O.; Enitan, S.S.; Adebola, O.K.; Ogundahunsi, O.A. Anthropometric parameter that best predict metabolic syndrome in South west Nigeria. Diabetes Metab. Syndr. 2019, 13, 48–54. [Google Scholar] [CrossRef]
- Baveicy, K.; Mostafaei, S.; Darbandi, M.; Hamzeh, B.; Najafi, F.; Pasdar, Y. Predicting Metabolic Syndrome by Visceral Adiposity Index, Body Roundness Index and a Body Shape Index in Adults: A Cross-Sectional Study from the Iranian RaNCD Cohort Data. Diabetes. Metab. Syndr. Obes. 2020, 13, 879–887. [Google Scholar] [CrossRef] [PubMed] [Green Version]
- Candan, S.; Candan, O.O.; Karabag, T. The relationship between nocturnal blood pressure drop and body composition indices among hypertensive patients. J. Clin. Hypertens. 2020, 22, 616–622. [Google Scholar] [CrossRef]
- Chang, Y.; Guo, X.; Guo, L.; Li, Z.; Li, Y.; Sun, Y. The feasibility of two new anthropometric indices to identify hypertension in rural China: A cross-sectional study. Medicine 2016, 95, e5301. [Google Scholar] [CrossRef]
- Choi, J.R.; Ahn, S.V.; Kim, J.Y.; Koh, S.B.; Choi, E.H.; Lee, G.Y.; Jang, Y.E. Comparison of various anthropometric indices for the identification of a predictor of incident hypertension: The ARIRANG study. J. Hum. Hypertens. 2018, 32, 294–300. [Google Scholar] [CrossRef]
- Głuszek, S.; Ciesla, E.; Głuszek-Osuch, M.; Kozieł, D.; Kiebzak, W.; Wypchło, Ł.; Suliga, E. Anthropometric indices and cut-off points in the diagnosis of metabolic disorders. PLoS ONE 2020, 15, e0235121. [Google Scholar] [CrossRef]
- Liu, P.J.; Ma, F.; Lou, H.P.; Zhu, Y.N. Comparison of the ability to identify cardiometabolic risk factors between two new body indices and waist-to-height ratio among Chinese adults with normal BMI and waist circumference. Public Health Nutr. 2017, 20, 984–991. [Google Scholar] [CrossRef] [PubMed] [Green Version]
- Raya-Cano, E.; Molina-Recio, G.; Romero-Saldaña, M.; Álvarez-Fernández, C.; Hernández-Reyes, A.; Molina-Luque, R. Comparison of classic and new anthropometric indexes for the screening of metabolic syndrome on the working population. Rev. Esp. Salud Publica 2020, 94, e202006042. [Google Scholar] [PubMed]
- Stefanescu, A.; Revilla, L.; Lopez, T.; Sanchez, S.E.; Williams, M.A.; Gelaye, B. Using A Body Shape Index (ABSI) and Body Roundness Index (BRI) to predict risk of metabolic syndrome in Peruvian adults. J. Int. Med. Res. 2019, 48, 300060519848854. [Google Scholar] [CrossRef] [PubMed] [Green Version]
- Tian, S.; Zhang, X.; Xu, Y.; Dong, H. Feasibility of body roundness index for identifying a clustering of cardiometabolic abnormalities compared to BMI, waist circumference and other anthropometric indices: The China Health and Nutrition Survey, 2008 to 2009. Medicine 2016, 95, e4642. [Google Scholar] [CrossRef]
- Tian, T.; Zhang, J.; Zhu, Q.; Xie, W.; Wang, Y.; Dai, Y. Predicting value of five anthropometric measures in metabolic syndrome among Jiangsu Province, China. BMC Public Health 2020, 20, 1317. [Google Scholar] [CrossRef] [PubMed]
- Torres, A.; Ejeda, L.; Mancheño, R.; Armesilla, C.; Serrano, M. Comparative analysis of abdominal obesity anthropometric indices for the diagnosis of physio-metabolic disorders. Nutr. Clin. Diet. Hosp. 2019, 39, 10–13. [Google Scholar]
- Zhang, J.; Zhu, W.; Qiu, L.; Huang, L.; Fang, L. Sex- and Age-Specific Optimal Anthropometric Indices as Screening Tools for Metabolic Syndrome in Chinese Adults. Int. J. Endocrinol. 2018, 2018, 1067603. [Google Scholar] [CrossRef] [PubMed]
- Yang, J.; Wang, F.; Han, X.; Yuan, J.; Yao, P.; Liang, Y.; Wei, S.; Zhang, X.M.; Guo, H.; Yang, H.D.; et al. Different anthropometric indices and incident risk of hypertension in elderly population: A prospective cohort study. Zhonghua Yu Fang Yi Xue Za Zhi 2019, 53, 272–278. [Google Scholar]
- Moher, D.; Liberati, A.; Tetzlaff, J.; Altman, D.G. Preferred reporting items for systematic reviews and meta-analyses: The PRISMA statement. Ann. Intern. Med. 2009, 151, 264–269, W64. [Google Scholar] [CrossRef] [Green Version]
- National Heart Lung and Blood Institute. Quality Assessment Tool for Observational Cohort and Cross-Sectional Studies; National Hear, Lung and Blood Inistitute: Bethesda, MD, USA, 2014. [Google Scholar]
- Moses, L.E.; Shapiro, D.; Littenberg, B. Combining independent studies of a diagnostic test into a summary ROC curve: Data-analytic approaches and some additional considerations. Stat. Med. 1993, 12, 1293–1316. [Google Scholar] [CrossRef]
- Chappell, F.M.; Raab, G.M.; Wardlaw, J.M. When are summary ROC curves appropriate for diagnostic meta-analyses? Stat. Med. 2009, 28, 2653–2668. [Google Scholar] [CrossRef]
- Swets, J.A. Measuring the accuracy of diagnostic systems. Science 1988, 240, 1285–1293. [Google Scholar] [CrossRef] [Green Version]
- DerSimonian, R.; Laird, N. Meta-analysis in clinical trials. Control. Clin. Trials 1986, 7, 177–188. [Google Scholar] [CrossRef]
- Higgins, J.P.T.; Thompson, S.G. Quantifying heterogeneity in a meta-analysis. Stat. Med. 2002, 21, 1539–1558. [Google Scholar] [CrossRef] [PubMed]
- Egger, M.; Davey Smith, G.; Schneider, M.; Minder, C. Bias in meta-analysis detected by a simple, graphical test. BMJ 1997, 315, 629–634. [Google Scholar] [CrossRef] [PubMed] [Green Version]
- Williams, B.; Mancia, G.; Spiering, W.; Agabiti Rosei, E.; Azizi, M.; Burnier, M.; Clement, D.L.; Coca, A.; de Simone, G.; Dominiczak, A.; et al. 2018 ESC/ESH Guidelines for the management of arterial hypertension: The Task Force for the management of arterial hypertension of the European Society of Cardiology and the European Society of Hypertension: The Task Force for the management of arterial hypertension of the European Society of Cardiology and the European Society of Hypertension. J. Hypertens. 2018, 36, 1953–2041. [Google Scholar]
- Neter, J.E.; Stam, B.E.; Kok, F.J.; Grobbee, D.E.; Geleijnse, J.M. Influence of weight reduction on blood pressure: A meta-analysis of randomized controlled trials. Hypertension 2003, 42, 878–884. [Google Scholar] [CrossRef]
- Semlitsch, T.; Krenn, C.; Jeitler, K.; Berghold, A.; Horvath, K.; Siebenhofer, A. Long-term effects of weight-reducing diets in people with hypertension. Cochrane Database Syst. Rev. 2016, 3, CD008274. [Google Scholar] [CrossRef] [Green Version]
- Huang, Z.; Willett, W.C.; Manson, J.E.; Rosner, B.; Stampfer, M.J.; Speizer, F.E.; Colditz, G.A. Body weight, weight change, and risk for hypertension in women. Ann. Intern. Med. 1998, 128, 81–88. [Google Scholar] [CrossRef] [PubMed]
- Shihab, H.M.; Meoni, L.A.; Chu, A.Y.; Wang, N.-Y.; Ford, D.E.; Liang, K.-Y.; Gallo, J.J.; Klag, M.J. Body mass index and risk of incident hypertension over the life course: The Johns Hopkins Precursors Study. Circulation 2012, 126, 2983–2989. [Google Scholar] [CrossRef] [Green Version]
- Zhao, Y.; Zhang, M.; Luo, X.; Wang, C.; Li, L.; Zhang, L.; Wang, B.; Ren, Y.; Zhou, J.; Han, C.; et al. Association of 6-year waist circumference gain and incident hypertension. Heart 2017, 103, 1347–1352. [Google Scholar] [CrossRef]
- Bigaard, J.; Frederiksen, K.; Tjonneland, A.; Thomsen, B.L.; Overvad, K.; Heitmann, B.L.; Sorensen, T.I.A. Body fat and fat-free mass and all-cause mortality. Obes. Res. 2004, 12, 1042–1049. [Google Scholar] [CrossRef] [PubMed]
- Browning, L.M.; Hsieh, S.D.; Ashwell, M. A systematic review of waist-to-height ratio as a screening tool for the prediction of cardiovascular disease and diabetes: 0·5 could be a suitable global boundary value. Nutr. Res. Rev. 2010, 23, 247–269. [Google Scholar] [CrossRef] [PubMed] [Green Version]
- Obesity in Asia Collaboration. Is central obesity a better discriminator of the risk of hypertension than body mass index in ethnically diverse populations? J. Hypertens. 2008, 26, 169–177. [Google Scholar] [CrossRef] [PubMed]
- de Koning, L.; Merchant, A.T.; Pogue, J.; Anand, S.S. Waist circumference and waist-to-hip ratio as predictors of cardiovascular events: Meta-regression analysis of prospective studies. Eur. Heart J. 2007, 28, 850–856. [Google Scholar] [CrossRef]
- Carmienke, S.; Freitag, M.H.; Pischon, T.; Schlattmann, P.; Fankhaenel, T.; Goebel, H.; Gensichen, J. General and abdominal obesity parameters and their combination in relation to mortality: A systematic review and meta-regression analysis. Eur. J. Clin. Nutr. 2013, 67, 573–585. [Google Scholar] [CrossRef] [PubMed] [Green Version]
- Darbandi, M.; Pasdar, Y.; Moradi, S.; Mohamed, H.J.J.; Hamzeh, B.; Salimi, Y. Discriminatory Capacity of Anthropometric Indices for Cardiovascular Disease in Adults: A Systematic Review and Meta-Analysis. Prev. Chronic Dis. 2020, 17, E131. [Google Scholar] [CrossRef]
- Jayawardena, R.; Ranasinghe, P.; Ranathunga, T.; Mathangasinghe, Y.; Wasalathanththri, S.; Hills, A.P. Novel anthropometric parameters to define obesity and obesity-related disease in adults: A systematic review. Nutr. Rev. 2020, 78, 498–513. [Google Scholar] [CrossRef] [PubMed]
- Krakauer, N.Y.; Krakauer, J.C. Untangling Waist Circumference and Hip Circumference from Body Mass Index with a Body Shape Index, Hip Index, and Anthropometric Risk Indicator. Metab. Syndr. Relat. Disord. 2018, 16, 160–165. [Google Scholar] [CrossRef]
- Haldar, S.; Chia, S.C.; Henry, C.J. Body Composition in Asians and Caucasians: Comparative Analyses and Influences on Cardiometabolic Outcomes. Adv. Food Nutr. Res. 2015, 75, 97–154. [Google Scholar]
- Lear, S.A.; Toma, M.; Birmingham, C.L.; Frohlich, J.J. Modification of the relationship between simple anthropometric indices and risk factors by ethnic background. Metabolism 2003, 52, 1295–1301. [Google Scholar] [CrossRef]
- Razak, F.; Anand, S.S.; Shannon, H.; Vuksan, V.; Davis, B.; Jacobs, R.; Teo, K.K.; McQueen, M.; Yusuf, S. Defining obesity cut points in a multiethnic population. Circulation 2007, 115, 2111–2118. [Google Scholar] [CrossRef] [Green Version]
- Patel, S.; Unwin, N.; Bhopal, R.; White, M.; Harland, J.; Ayis, S.A.; Watson, W.; Alberti, K.G. A comparison of proxy measures of abdominal obesity in Chinese, European and South Asian adults. Diabet. Med. 1999, 16, 853–860. [Google Scholar] [CrossRef] [PubMed]
- Ko, G.T.; Chan, J.C.; Woo, J.; Lau, E.; Yeung, V.T.; Chow, C.C.; Wai, H.P.; Li, J.K.; So, W.Y.; Cockram, C.S. Simple anthropometric indexes and cardiovascular risk factors in Chinese. Int. J. Obes. Relat. Metab. Disord. 1997, 21, 995–1001. [Google Scholar] [CrossRef] [Green Version]
- Rutter, C.M.; Gatsonis, C.A. A hierarchical regression approach to meta-analysis of diagnostic test accuracy evaluations. Stat. Med. 2001, 20, 2865–2884. [Google Scholar] [CrossRef]
- Reitsma, J.B.; Glas, A.S.; Rutjes, A.W.S.; Scholten, R.J.P.M.; Bossuyt, P.M.; Zwinderman, A.H. Bivariate analysis of sensitivity and specificity produces informative summary measures in diagnostic reviews. J. Clin. Epidemiol. 2005, 58, 982–990. [Google Scholar] [CrossRef]
- Harbord, R.M.; Whiting, P.; Sterne, J.A.C.; Egger, M.; Deeks, J.J.; Shang, A.; Bachmann, L.M. An empirical comparison of methods for meta-analysis of diagnostic accuracy showed hierarchical models are necessary. J. Clin. Epidemiol. 2008, 61, 1095–1103. [Google Scholar] [CrossRef] [PubMed]
- Simel, D.L.; Bossuyt, P.M.M. Differences between univariate and bivariate models for summarizing diagnostic accuracy may not be large. J. Clin. Epidemiol. 2009, 62, 1292–1300. [Google Scholar] [CrossRef] [PubMed]


| Ref. | Author (Year) [Reference] | Country | Study Design | Sample Size (% Male) | Population Chararsterics | Age Range and/or Mean ± SD | Follow up Years | HTA Criteria | Adjustment |
|---|---|---|---|---|---|---|---|---|---|
| 1 | Adejumo, EN (2019) [36] | Nigeria | Cross-sectional | 535 (27.3%) | General population | ≥18 47.05 ± 14.34 | - | 130/85 mm Hg or antihypertensive medication | - |
| 2 | Baveicy, K (2020) [37] | Iran | Cross-sectional | 8790 (52.2%) | General population | 35–65 | - | 130/85 mm Hg or antihypertensive medication | Age, smoking status (current/former, never), alcohol intake (units per week) and menopause. |
| 3 | Candan, S (2020) [38] | Turkey | Cross-sectional | 104 (51.9%) | Daytime hypertension | 47.6 ± 12.1 | - | 140/90 mm Hg or antihypertensive medication | - |
| 4 | Chang, Y (2016) [39] | China | Cross-sectional | 11,345 (46.3%) | General population | ≥35 | - | 140/90 mm Hg or antihypertensive medication | Age, ethnicity, family income, education, physical activity, salt intake, smoking and alcohol status, FPG, and serum lipid. |
| 5 | Choi, JR (2018) [40] | Republic of Korea | Prospective cohort | 1718 (36.7%) | General population | 39–72 | 2.8 | 140/90 mm Hg or antihypertensive medication | Age, gender, smoking status, alcohol intake, regular exercise, SBP and total cholesterol at baseline. |
| 6 | Głuszek, S (2020) [41] | Polish and Norwegian | Cross-sectional | 12,328 (33.2%) | General population | 55.7 ± 5.4 | - | 130/85 mm Hg or antihypertensive medication | - |
| 7 | Liu, PJ (2017) [42] | China | Cross-sectional | 1596 (44.5%) | Non-obeses adults | 20–60 | - | High BP = Prehypertension: 120–139/80–89 mm Hg and hypertension; 140/90 mm Hg or antihypertensive medication | - |
| 8 | Raya Cano, E (2020) [43] | Spain | Cross-sectional | 636 (32.1%) | Workers | 45.1 ± 8.8 | - | 130/85 mm Hg or antihypertensive medication | Age and gender. |
| 9 | Stafenescu, A (2019) [44] | Peru | Cross-sectional | 1518 (37.3%) | General population | 39.3 ± 15.0 | - | 130/85 mm Hg or antihypertensive medication | Age, smoking status and alcohol |
| 10 | Tian, S (2016) [45] | China | Cross-sectional | 8126 (46.5%) | General population | 18–85 | - | 140/90 mm Hg or antihypertensive medication | Age, smoking, alcohol status |
| 11 | Tian, T (2020) [46] | China | Cross-sectional | 8040 (44.9%) | General population | 54.7 ± 15.1 | 130/85 mm Hg or antihypertensive medication | Age, drinking and smoking conditions. | |
| 12 | Alaminos Torres, A (2019) [47] | Spain | Cross-sectional | 5225 (40.2%) | General population | 18–75 | - | 130/85 mm Hg or antihypertensive medication | - |
| 13 | Zhang J (2018) [48] | China | Cross-sectional | 59,029 (61.2%) | General population | 18–80 | - | 140/90 mm Hg or antihypertensive medication | Age |
| First Author (Year) [Reference] | Outcome Assesment | BRI | ABSI | BMI | WC | WHtR |
|---|---|---|---|---|---|---|
| Adejumo, EN (2019) [36] | AUC (95% CI) | Men: 0.624 (0.531–0.717) Women: 0.588 (0.532–0.644) | Men: 0.497 (0.402–0.592) Women: 0.553 (0.495–0.611) | Men: 0.694 (0.607–0.781) Women: 0.557 (0.498–0.615) | Men: 0.656 (0.565–0.747) Women: 0.607 (0.551–0.664) | Men: 0.641 (0.549–0.733) Women: 0.602 (0.546–0.658) |
| Baveicy, K (2020) [37] | AUC (95% CI) | Men: 0.628 (0.614–0.642) Women: 0.614 (0.599–0.629) | Men: 0.502 (0.487–0.516) Women: 0.537 (0.522–0.552) | |||
| OR (95% CI) | Men: 2.13 (1.78–2.54) Women: 1.85 (1.58–2.17) | Men: 1.85 (1.58–2.17) Women: 1.24 (1.06–1.46) | ||||
| Chang ,Y (2016) [39] | AUC (95% CI) | Men: 0.65 (0.64–0.67) Women: 0.68 (0.67–0.70) | Men: 0.60 (0.58–0.61) Women: 0.59 (0.58–0.61) | Men: 0.62 (0.60–0.63) Women: 0.64 (0.62–0.65) | Men: 0.64 (0.62–0.65) Women: 0.65 (0.64–0.67) | |
| OR (95% CI) | Men: Q1: Ref Q4: 3.49 (2.86–4.21) Women: Q1: Ref Q4: 3.06 (2.56–3.67) | Men: Q1: Ref Q4: 1.30 (1.06–1.58) Women: Q1: Ref Q4: 1.19 (1.04–1.34) | Men: Q1: Ref Q4: 2.43 (2.01–2.98) Women: Q1: Ref Q4: 2.10 (1.70–2.62) | Men: Q1: Ref Q4: 3.18 (2.55–3.94) Women: Q1: Ref Q4: 2.68 (2.22–3.23) | ||
| Choi, JR (2018) [40] | AUC (95% CI) | 0.662 (0.625–0.700) | 0.627 (0.587–0.667) | 0.623 (0.582–0.664) | 0.672 (0.634–0.711) | 0.662(0.625–0.700) |
| OR (95% CI) | Q1: Ref Q4: 4.46 (2.39–8.34) | Q1: Ref Q4: 1.72 (0.96–3.08) | Q1: Ref Q4: 3.18 (1.91–5.28) | Q1: Ref Q4: 4.79 (2.49–9.20) | Women: Q1: Ref Q4: 4.51 (2.41–8.43) | |
| Głuszek, S (2020) [41] | AUC (95% CI) | Men: 0.638 (0.616–0.659) Women: 0.681 (0.669–0.693) | Men: 0.542 (0.519–0.565) Women: 0.575 (0.541–0.608) | Men: 0.660 (0.638–0.681) Women: 0.681 (0.668–0.694) | Men: 0.657 (0.636–0.678) Women: 0.691 (0.678–0.704) | Men: 0.655 (0.633–0.676) Women: 0.694 (0.681–0.707) |
| Liu, PJ (2017) [42] | AUC (95% CI) | Men: 0.587 (0.545–0.629) Women: 0.618 (0.574–0.662) | Men: 0.511 (0.468–0.554) Women: 0.558 (0.497–0.620) | Men: 0.589 (0.547–0.631) Women: 0.619 (0.575–0.663) | ||
| Raya Cano, E (2020) [43] | AUC (95% CI) | 0.81 (0.78–0.85) | 0.69 (0.65–0.74) | 0.77 (0.74–0.81) | 0.79 (0.75–0.82) | 0.81 (0.75–0.85) |
| Stafenescu, A (2019) [44] | AUC (95% CI) | Men: 0.66 (0.61–0.71) Women: 0.71 (0.67–0.75) | Men: 0.52 (0.47–0.57) Women: 0.64 (0.59–0.68) | Men: 0.66 (0.61–0.71) Women: 0.66 (0.62–0.71) | Men: 0.66 (0.61–0.71) Women: 0.71 (0.67–0.75) | |
| OR (95% CI) | Men: 1.41 (1.21–1.66) Women: 1.29 (1.16–1.42) | Men: 0.98 (0.94–1.02) Women: 1.04 (1.01–1.07) | Men: 1.14 (1.08–1.20) Women: 1.09 (1.05–1.13) | Men: 1.05 (1.03–1.07) Women: 1.05 (1.03–1.07) | ||
| Tian, S (2016) [45] | AUC (95% CI) | Men: 0.668 (0.650–0.687) Women: 0.714 (0.698–0.730) | Men: 0.597 (0.578–0.616) Women: 0.628 (0.610–0.646) | Men: 0.639 (0.620–0.658) Women: 0.667 (0.649–0.686) | Men: 0.667 (0.649–0.686) Women: 0.698 (0.681–0.715) | Men: 0.668 (0.650–0.687) Women: 0.714 (0.698–0.730) |
| OR (95% CI) | Men: Q1: Ref Q4: 3.87 (3.11–4.82) Women: Q1: Ref Q4: 4.00 (3.11–5.15) | Men: Q1: Ref Q4: 1.48 (1.19–1.83) Women: Q1: Ref Q4: 1.42 (1.13–1.79) | Men: Q1: Ref Q4: 4.53 (3.62–5.65) Women: Q1: Ref Q4: 5.02 (3.97–6.34) | Men: Q1: Ref Q4: 4.67 (3.74–5.83) Women: Q1: Ref Q4: 4.32 (3.38–5.52) | Men: Q1: Ref Q4: 3.87 (3.11–4.82) Women: Q1: Ref Q4: 4.00 (3.11–5.15) | |
| Alaminos Torres, A (2019) [47] | AUC (95% CI) | Men: 0.705 (0.649–0.761) Women: 0.711 (0.686–0.735) | Men: 0.644 (0.583–0.704) Women: 0.583 (0.55–0.611) | Men: 0.692 (0.668–0.716) Women: 0.646 (0.588–0.705) | Men: 0.681 (0.624–0.738) Women: 0.692 (0.667–0.717) | Men: 0.705 (0.649–0.761) Women: 0.711 (0.686–0.735) |
| Zhang, J (2018) [48] | AUC (95% CI) | Men: 0.690 (0.685–0.695) Women: 0.769 (0.761–0.778) | Men: 0.586 (0.581–0.591) Women: 0.648 (0.638–0.659) | Men: 0.667 (0.662–0.672) Women: 0.738 (0.728–0.748) | Men: 0.673 (0.668–0.678) Women:0.752 (0.743–0.762) | Men: 0.690 (0.685–0.695) Women: 0.769 (0.761–0.778) |
| OR (95% CI) | Men: 1.807 (1.756–1.860) Women: 1.646 (1.572–1.723) | Men: 1.073 (1.043–1.104) Women: - | Men: 1.956 (1.899–2.014) Women: 1.930 (1.839–2.026) | Men: 1.837 (1.783–1.892) Women: 1.700 (1.622–1.781) | Men:1.860 (1.805–1.917) Women: 1.721 (1.640–1.807) |
| Men | Women | Total | ||||||||
|---|---|---|---|---|---|---|---|---|---|---|
| Subgroup Analyses | N | AUC (95% CI) | I2 | N | AUC (95% CI) | I2 | N | AUC (95% CI) | I2 | |
| Type of population | ||||||||||
| BRI | Chinese population | 4 | 0.65 (0.62–0.68) | 94% | 4 | 0.70 (0.64–0.75) | 98% | 5 | 0.67 (0.64–0.71) | 98% |
| Non-Chinese population | 5 | 0.64 (0.62–0.67) | 50% | 5 | 0.66 (0.62–0.71) | 48% | 6 | 0.67 (0.64–0.70) | 95% | |
| European population | 2 | 0.67 (0.60–0.73) | 79% | 2 | 0.69 (0.66–0.72) | 97% | 3 | 0.71 (0.66–0.76) | 97% | |
| HTA Criteria | ||||||||||
| 130/85 mmHg | 5 | 0.64 (0.62–0.67) | 50% | 5 | 0.66 (0.62–0.71) | 48% | 6 | 0.67 (0.64–0.84) | 95% | |
| 140/90 mmHg | 4 | 0.65 (0.62–0.68) | 94% | 4 | 0.70 (0.64–0.75) | 98% | 5 | 0.67 (0.64–0.71) | 98% | |
| ABSI | Type of population | |||||||||
| Chinese population | 4 | 0.58 (0.56–0.60) c | 80% | 4 | 0.61 (0.58–0.65) b | 96% | 5 | 0.60 (0.58–0.62) c | 95% | |
| Non-Chinese population | 5 | 0.54 (0.50–0.58) c | 84% | 5 | 0.57 (0.54–0.61) c | 81% | 6 | 0.57 (0.54–0.60) c | 91% | |
| European population | 2 | 0.59 (0.49–0.69) | 92% | 2 | 0.58 (0.56–0.60) c | 78% | 3 | 0.60 (0.55–0.65) c | 94% | |
| HTA Criteria | ||||||||||
| 130/85 mmHg | 5 | 0.54 (0.50–0.58) c | 84% | 5 | 0.57 (0.54–0.61) c | 81% | 6 | 0.57 (0.54–0.60) c | 91% | |
| 140/90 mmHg | 4 | 0.58 (0.56–0.60) c | 80% | 4 | 0.61 (0.58–0.65) b | 96% | 5 | 0.60 (0.58–0.62) c | 95% | |
| BMI | Type of population | |||||||||
| Chinese population | 3 | 0.64 (0.61–0.68) ‡ | 92% | 3 | 0.68 (0.62–0.75) * | 98% | 4 | 0.66 (0.62–0.69) † | 97% | |
| Non-Chinese population | 4 | 0.67 (0.65–0.69) ‡ | 29% | 4 | 0.64 (0.59–0.69) * | 83% | 5 | 0.67 (0.64–0.80) ‡ | 86% | |
| European population | 2 | 0.68 (0.64–0.71) ‡ | 73% | 2 | 0.68 (0.65–0.70) ‡ | 25% | 3 | 0.69 (0.66–0.73) ‡ | 90% | |
| HTA Criteria | ||||||||||
| 130/85 mmHg | 4 | 0.67 (0.65–0.69) ‡ | 29% | 4 | 0.64 (0.59–0.69) * | 83% | 5 | 0.67 (0.64–0.80) ‡ | 86% | |
| 140/90 mmHg | 3 | 0.64 (0.61–0.68) ‡ | 92% | 3 | 0.68 (0.62–0.75) * | 98% | 4 | 0.66 (0.62–0.69) † | 97% | |
| WC | Type of population | |||||||||
| Chinese population | 3 | 0.66 (0.64–0.68) ‡ | 80% | 3 | 0.70 (0.63–0.77) † | 99% | 4 | 0.68 (0.65–0.71) ‡ | 98% | |
| Non-Chinese population | 4 | 0.66 (0.64–0.68) ‡ | 0% | 4 | 0.68 (0.66–0.71) ‡ | 68% | 5 | 0.69 (0.66–0.71) ‡ | 82% | |
| European population | 2 | 0.66 (0.64–0.68) ‡ | 0% | 2 | 0.69 (0.68–0.70) ‡ | 0% | 3 | 0.70 (0.67–0.73) ‡ | 88% | |
| HTA Criteria | ||||||||||
| 130/85 mmHg | 4 | 0.66 (0.64–0.68) ‡ | 0% | 4 | 0.68 (0.66–0.71) ‡ | 68% | 5 | 0.69 (0.66–0.71) ‡ | 82% | |
| 140/90 mmHg | 3 | 0.66 (0.64–0.68) ‡ | 80% | 3 | 0.70 (0.63–0.77) * | 99% | 4 | 0.68 (0.65–0.71) ‡ | 98% | |
| WHtR | Type of population | |||||||||
| Chinese population | 3 | 0.66 (0.62–0.69) ‡ | 92% | 3 | 0.71 (0.64–0.77) † | 97% | 4 | 0.68 (0.64–0.71) ‡ | 98% | |
| Non-Chinese population | 3 | 0.67 (0.63–0.70) ‡ | 29% | 3 | 0.68 (0.64–0.72) ‡ | 83% | 4 | 0.69 (0.66–0.72) ‡ | 85% | |
| European population | 2 | 0.67 (0.63–0.72) ‡ | 62% | 2 | 0.70 (0.68–0.71) ‡ | 28% | 3 | 0.71 (0.67–0.74) ‡ | 86% | |
| HTA Criteria | ||||||||||
| 130/85 mmHg | 3 | 0.67 (0.63–0.70) ‡ | 29% | 3 | 0.68 (0.64–0.72) ‡ | 83% | 4 | 0.69 (0.66–0.72) ‡ | 85% | |
| 140/90 mmHg | 3 | 0.66 (0.62–0.69) ‡ | 92% | 3 | 0.71 (0.64–0.77) * | 97% | 4 | 0.68 (0.64–0.71) ‡ | 98% | |
| N | Sensitivity | Specificity | PLR | NLR | dOR | AUC-SROC | ||
|---|---|---|---|---|---|---|---|---|
| BRI | Men | 4 | 0.62 (0.61–0.63) | 0.60 (0.60–0.61) | 1.54 (1.35–1.75) | 0.65 (0.55–0.76) | 2.37 (1.82–3.08) | 0.64 (0.59–0.68) |
| Women | 4 | 0.65 (0.64–0.66) | 0.65 (0.65–0.66) | 1.60 (1.13–2.27) | 0.60 (0.44–0.82) | 2.66 (1,42–4.96) | 0.62 (0.52–0.72) | |
| Total | 4 | 0.63 (0.63–0.64) | 0.62 (0.62–0.63) | 1.57 (1.34–1.84) | 0.62 (0.54–0.72) | 2.50 (1.87–3.34) | 0.64 (0.60–0.69) | |
| ABSI | Men | 3 | 0.52 (0.51–0.53) | 0.51 (0.51–0.52) | 1.17 (1.02–1.34) | 0.86 (0.73–1.00) | 1.36 (1.05–1.77) b | 0.55 0.49–0.60) b |
| Women | 4 | 0.48 (0.47–0.49) | 0.55 (0.54–0.55) | 1.33 (1.16–1.53) | 0.75 (0.59–0.94) | 1.78 (1.28–2.46) | 0.59 (0.54–0.65) | |
| Total | 4 | 0.51 (0.50–0.51) | 0.53 (0.52–0.53) | 1.26 (1.15–1.38) | 0.79 (0.71–0.89) | 1.58 (1.30–1.92) b | 0.57 (0.53–0.61) b | |
| BMI | Men | 2 | 0.68 (0.67–0.69) | 0.54 (0.53–0.54) | 1.54 (1.51–1.57) | 0.56 (0.52–0.60) | 2.81 (2.67–2.97) ‡ | - |
| Women | 2 | 0.58 (0.54–0.56) | 0.67 (0.66–0.67) | 2.14 (1.95–2.35) | 0.54 (0.35–0.83) | 3.99 (2.99–5.31) | - | |
| Total | 2 | 0.63 (0.62–0.63) | 0.59 (0.59–0.60) | 1.84 (1.50–2.25) | 0.55 (0.46–0.65) | 3.33 (2.57–4.3) ‡ | 0.69 (0.65–0.73) ‡ | |
| WC | Men | 2 | 0.56 (0.55–0.57) | 0.58 (0.58–0.59) | 1.39 (1.06–1.83) | 0.72 (0.45–1.16) | 1.91 (0.93–3.923) | - |
| Women | 2 | 0.61 (0.60–0.62) | 0.65 (0.64–0.66) | 1.99 (1.93–2.04) | 0.52 (0.38–0.73) | 3.75 (2.75–5.12) | - | |
| Total | 2 | 0.58 (0.57–0.59) | 0.61 (0.61–0.62) | 1.67 (1.42–1.96) | 0.62 (0.48–0.79) | 2.69 (1.91–3.79) † | 0.68 (0.63–0.74) † | |
| WHtR | Men | 3 | 0.64 (0.63–0.64) | 0.61 (0.60–0.61) | 1.54 (0.30–1.82) | 0.61 (0.52–0.71) | 2.54 (1.95–3.31) ‡ | 0.66 (0.60–0.71) † |
| Women | 3 | 0.65 (0.64–0.66) | 0.69 (0.68–0.69) | 1.92 (1.51–2.44) | 0.56 (0.41–0.76) | 3.44 (2.08–5.67) | 0.72 (0.66–0.79) † | |
| Total | 3 | 0.64 (0.63–0.65) | 0.64 (0.64–0.65) | 1.71 (1.46–2.01) | 0.58 (0.51–0.67) | 2.94 (2.23–3.89) ‡ | 0.67 (0.61–0.72) † |
Publisher’s Note: MDPI stays neutral with regard to jurisdictional claims in published maps and institutional affiliations. |
© 2021 by the authors. Licensee MDPI, Basel, Switzerland. This article is an open access article distributed under the terms and conditions of the Creative Commons Attribution (CC BY) license (https://creativecommons.org/licenses/by/4.0/).
Share and Cite
Calderón-García, J.F.; Roncero-Martín, R.; Rico-Martín, S.; De Nicolás-Jiménez, J.M.; López-Espuela, F.; Santano-Mogena, E.; Alfageme-García, P.; Sánchez Muñoz-Torrero, J.F. Effectiveness of Body Roundness Index (BRI) and a Body Shape Index (ABSI) in Predicting Hypertension: A Systematic Review and Meta-Analysis of Observational Studies. Int. J. Environ. Res. Public Health 2021, 18, 11607. https://doi.org/10.3390/ijerph182111607
Calderón-García JF, Roncero-Martín R, Rico-Martín S, De Nicolás-Jiménez JM, López-Espuela F, Santano-Mogena E, Alfageme-García P, Sánchez Muñoz-Torrero JF. Effectiveness of Body Roundness Index (BRI) and a Body Shape Index (ABSI) in Predicting Hypertension: A Systematic Review and Meta-Analysis of Observational Studies. International Journal of Environmental Research and Public Health. 2021; 18(21):11607. https://doi.org/10.3390/ijerph182111607
Chicago/Turabian StyleCalderón-García, Julián F., Raúl Roncero-Martín, Sergio Rico-Martín, Jorge M. De Nicolás-Jiménez, Fidel López-Espuela, Esperanza Santano-Mogena, Pilar Alfageme-García, and Juan F. Sánchez Muñoz-Torrero. 2021. "Effectiveness of Body Roundness Index (BRI) and a Body Shape Index (ABSI) in Predicting Hypertension: A Systematic Review and Meta-Analysis of Observational Studies" International Journal of Environmental Research and Public Health 18, no. 21: 11607. https://doi.org/10.3390/ijerph182111607