
Nonlinear Relationships among the Natural Environment, Health, and Sociodemographic Characteristics across US Counties


Abstract
:1. Introduction
2. Methods
2.1. Data and Setting
2.2. Geocoding
2.3. Statistical Analysis
3. Results
4. Discussion
Supplementary Materials
Author Contributions
Funding
Institutional Review Board Statement
Informed Consent Statement
Data Availability Statement
Conflicts of Interest
References
- Feng, J.; Glass, T.A.; Curriero, F.C.; Stewart, W.F.; Schwartz, B.S. The built environment and obesity: A systematic review of the epidemiologic evidence. Health Place 2010, 16, 175–190. [Google Scholar] [CrossRef]
- Glazier, R.H.; Creatore, M.I.; Weyman, J.T.; Fazli, G.; Matheson, F.I.; Gozdyra, P.; Moineddin, R.; Kaufman-Shriqui, V.; Booth, G.L. Density, Destinations or Both? A Comparison of Measures of Walkability in Relation to Transportation Behaviors, Obesity and Diabetes in Toronto, Canada. PLoS ONE 2014, 9, e85295. [Google Scholar] [CrossRef] [Green Version]
- Muldoon, K.A.; Duff, P.K.; Fielden, S.; Anema, A. Food insufficiency is associated with psychiatric morbidity in a nationally representative study of mental illness among food insecure Canadians. Soc. Psychiatry 2013, 48, 795–803. [Google Scholar] [CrossRef] [PubMed]
- King, T.L.; Bentley, R.J.; Thornton, L.E.; Kavanagh, A.M. Using kernel density estimation to understand the influence of neighbourhood destinations on BMI. BMJ Open 2016, 6, e008878. [Google Scholar] [CrossRef] [PubMed] [Green Version]
- Pan, L.; Sherry, B.; Njai, R.; Blanck, H.M. Food Insecurity Is Associated with Obesity among US Adults in 12 States. J. Acad. Nutr. Diet. 2012, 112, 1403–1409. [Google Scholar] [CrossRef] [PubMed] [Green Version]
- Xu, F.; Jin, L.; Qin, Z.; Chen, X.; Xu, Z.; He, J.; Wang, Z.; Ji, W.; Ren, F.; Du, Q.; et al. Access to public transport and childhood obesity: A systematic review. Obes. Rev. 2021, 22 (Suppl. S1), e12987. [Google Scholar] [CrossRef] [Green Version]
- Brown, B.B.; Yamada, I.; Smith, K.R.; Zick, C.D.; Kowaleski-Jones, L.; Fan, J.X. Mixed land use and walkability: Variations in land use measures and relationships with BMI, overweight, and obesity. Health Place 2009, 15, 1130–1141. [Google Scholar] [CrossRef] [Green Version]
- Gunn, L.D.; Mavoa, S.; Boulange, C.; Hooper, P.; Kavanagh, A.; Giles-Corti, B. Designing healthy communities: Creating evidence on metrics for built environment features associated with walkable neighbourhood activity centres. Int. J. Behav. Nutr. Phys. Act. 2017, 14, 164. [Google Scholar] [CrossRef] [Green Version]
- Manisalidis, I.; Stavropoulou, E.; Stavropoulos, A.; Bezirtzoglou, E. Environmental and Health Impacts of Air Pollution: A Review. Front. Public Health 2020, 8, 14. [Google Scholar] [CrossRef] [Green Version]
- Leaning, J.; Guha-Sapir, D. Natural disasters, armed conflict, and public health. N. Engl. J. Med. 2013, 369, 1836–1842. [Google Scholar] [CrossRef]
- Alavanja, M.C.; Sandler, D.P.; McMaster, S.B.; Zahm, S.H.; McDonnell, C.J.; Lynch, C.F.; Pennybacker, M.; Rothman, N.; Dosemeci, M.; Bond, A.E.; et al. The Agricultural Health Study. Environ. Health Perspect. 1996, 104, 362–369. [Google Scholar] [CrossRef]
- Gianfredi, V.; Buffoli, M.; Rebecchi, A.; Croci, R.; Oradini-Alacreu, A.; Stirparo, G.; Marino, A.; Odone, A.; Capolongo, S.; Signorelli, C. Association between Urban Greenspace and Health: A Systematic Review of Literature. Int. J. Environ. Res. Public Health 2021, 18, 5137. [Google Scholar] [CrossRef]
- Kellert, S.R.; Wilson, E.O. The Biophilia Hypothesis; Island Press: Lahaina, HI, USA, 1993. [Google Scholar]
- Jimenez, M.; DeVille, N.; Elliott, E.; Schiff, J.; Wilt, G.; Hart, J.; James, P. Associations between Nature Exposure and Health: A Review of the Evidence. Int. J. Environ. Res. Public Health 2021, 18, 4790. [Google Scholar] [CrossRef]
- Lin, G.; Spann, S.; Hyman, D.; Pavlik, V. Climate Amenity and BMI. Obesity 2007, 15, 2120–2127. [Google Scholar] [CrossRef]
- Littenberg, B.; Bonnell, L.N.; LeBruin, A.S.; Lubetkin, D.A.; Troy, A.R.; Zia, A. The Relationship Between Access to Natural Environmental Amenities and Obesity. Cureus 2015, 7, e377. [Google Scholar] [CrossRef] [Green Version]
- Bonnell, L.N.; Troy, A.R.; Littenberg, B. Nonlinear relationship between nonresidential destinations and body mass index across a wide range of development. Prev. Med. 2021, 153, 106775. [Google Scholar] [CrossRef]
- James, P.; Kioumourtzoglou, M.-A.; Hart, J.E.; Banay, R.F.; Kloog, I.; Laden, F. Interrelationships Between Walkability, Air Pollution, Greenness, and Body Mass Index. Epidemiology 2017, 28, 780–788. [Google Scholar] [CrossRef]
- Yin, C.; Yao, X.; Sun, B. Population density and obesity in rural China: Mediation effects of car ownership. Transp. Res. Part D Transp. Environ. 2022, 105, 103228. [Google Scholar] [CrossRef]
- Crocker, A.M.; Kessler, R.; van Eeghen, C.; Bonnell, L.N.; Breshears, R.E.; Callas, P.; Clifton, J.; Elder, W.; Fox, C.; Frisbie, S.; et al. Integrating Behavioral Health and Primary Care (IBH-PC) to improve patient-centered outcomes in adults with multiple chronic medical and behavioral health conditions: Study protocol for a pragmatic cluster-randomized control trial. Trials 2021, 22, 200. [Google Scholar] [CrossRef]
- Cella, D.; Riley, W.; Stone, A.; Rothrock, N.; Reeve, B.; Yount, S.; Amtmann, D.; Bode, R.; Buysse, D.; Choi, S.; et al. The Patient-Reported Outcomes Measurement Information System (PROMIS) developed and tested its first wave of adult self-reported health outcome item banks: 2005–2008. J. Clin. Epidemiol. 2010, 63, 1179–1194. [Google Scholar] [CrossRef] [Green Version]
- Hays, R.D.; Spritzer, K.L.; Schalet, B.D.; Cella, D. PROMIS®-29 v2.0 profile physical and mental health summary scores. Qual. Life Res. 2018, 27, 1885–1891. [Google Scholar] [CrossRef] [Green Version]
- Natural Amenities Scale. U.S. Department of Agriculture. Economic Research Service. 1999. Available online: http://www.ers.usda.gov/data-products/natural-amenities-scale.aspx (accessed on 13 November 2021).
- McGranahan, D.A. Natural Amenities Drive Rural Population Change; Agricultural Economic Report No. (AER-781); United States Department of Agriculture Economic Research Service: Washington, DC, USA, 1999. [Google Scholar]
- Ratcliffe, M.; Burd, C.; Holder, K.; Fields, A. Defining Rural at the U.S. Census Bureau; ACSGEO-1; U.S. Census Bureau: Washington, DC, USA, 2016. [Google Scholar]
- Royston, P. Lowess Smoothing. Stata Tech. Bull. Repr. 1991, 1, 41–44. [Google Scholar]
- Bozdogan, H. Model selection and Akaike’s Information Criterion (AIC): The general theory and its analytical extensions. Psychometrika 1987, 52, 345–370. [Google Scholar] [CrossRef]
- Nieuwenhuijsen, M.J.; Khreis, H.; Triguero-Mas, M.; Gascon, M.; Dadvand, P. Fifty Shades of Green: Pathway to Healthy Urban Living. Epidemiology 2017, 28, 63–71. [Google Scholar] [CrossRef] [PubMed]
- Beyer, K.M.M.; Kaltenbach, A.; Szabo, A.; Bogar, S.; Nieto, F.J.; Malecki, K.M. Exposure to Neighborhood Green Space and Mental Health: Evidence from the Survey of the Health of Wisconsin. Int. J. Environ. Res. Public Health 2014, 11, 3453–3472. [Google Scholar] [CrossRef] [PubMed] [Green Version]
- Grahn, P.; Stigsdotter, U.K. The relation between perceived sensory dimensions of urban green space and stress restoration. Landsc. Urban Plan. 2010, 94, 264–275. [Google Scholar] [CrossRef]
- Yang, B.-Y.; Markevych, I.; Bloom, M.S.; Heinrich, J.; Guo, Y.; Morawska, L.; Dharmage, S.; Knibbs, L.; Jalaludin, B.; Jalava, P.; et al. Community greenness, blood pressure, and hypertension in urban dwellers: The 33 Communities Chinese Health Study. Environ. Int. 2019, 126, 727–734. [Google Scholar] [CrossRef] [PubMed]
- Dominski, F.H.; Lorenzetti Branco, J.H.; Buonanno, G.; Stabile, L.; Gameiro da Silva, M.; Andrade, A. Effects of air pollution on health: A mapping review of systematic reviews and meta-analyses. Environ. Res. 2021, 201, 111487. [Google Scholar] [CrossRef]
- Khan, K.M.; Karnati, J.; Hamid, I.; Koceja, D.; Islam, M.Z.; Khan, A. Residential Proximity to Agricultural Fields and Neurological and Mental Health Outcomes in Rural Adults in Matlab, Bangladesh. Int. J. Environ. Res. Public Health 2019, 16, 3228. [Google Scholar] [CrossRef] [Green Version]
- Rentfrow, P.J. Statewide differences in personality: Toward a psychological geography of the United States. Am. Psychol. 2010, 65, 548–558. [Google Scholar] [CrossRef]
- Rentfrow, P.J. Geographical psychology. Curr. Opin. Psychol. 2020, 32, 165–170. [Google Scholar] [CrossRef]
- Rentfrow, P.J.; Gosling, S.D.; Jokela, M.; Stillwell, D.J.; Kosinski, M.; Potter, J. Divided we stand: Three psychological regions of the United States and their political, economic, social, and health correlates. J. Pers. Soc. Psychol. 2013, 105, 996–1012. [Google Scholar] [CrossRef] [Green Version]
- Dark, S.J.; Bram, D. The modifiable areal unit problem (MAUP) in physical geography. Prog. Phys. Geogr. Earth Environ. 2007, 31, 471–479. [Google Scholar] [CrossRef] [Green Version]


| Low Amenities NAS < 0 | High Amenities NAS ≥ 0 | p | |
|---|---|---|---|
| N | 1140 | 2269 | |
| Mean age ±SD | 64 ± 12 | 63 ± 14 | 0.12 |
| Sex, female | 734 (65%) | 1398 (62%) | 0.11 |
| Race, White | 769 (69%) | 1873 (84%) | <0.001 |
| Ethnicity, Hispanic | 57 (5%) | 204 (9%) | <0.001 |
| Marital status, married | 515 (45%) | 1148 (51%) | 0.003 |
| Employment, working | 372 (33%) | 767 (34%) | 0.47 |
| Income, <USD 30 k/year | 666 (58%) | 1055 (47%) | <0.001 |
| Education, college graduate or more | 429 (38%) | 1183 (52%) | <0.001 |
| Mean physical health summary score ± SD | 45 ± 10 | 46 ± 10 | <0.001 |
| Mean mental health summary score ± SD | 50 ± 9 | 50 ± 9 | 0.96 |
| Mental Health ß (95% CI) | Physical Health ß (95% CI) | |||
|---|---|---|---|---|
| Low Amenities (NAS < 0) ß (95% CI) | High Amenities (NAS ≥ 0) ß (95% CI) | Low Amenities (NAS < 0) ß (95% CI) | High Amenities (NAS ≥ 0) ß (95% CI) | |
| Unadjusted models | ||||
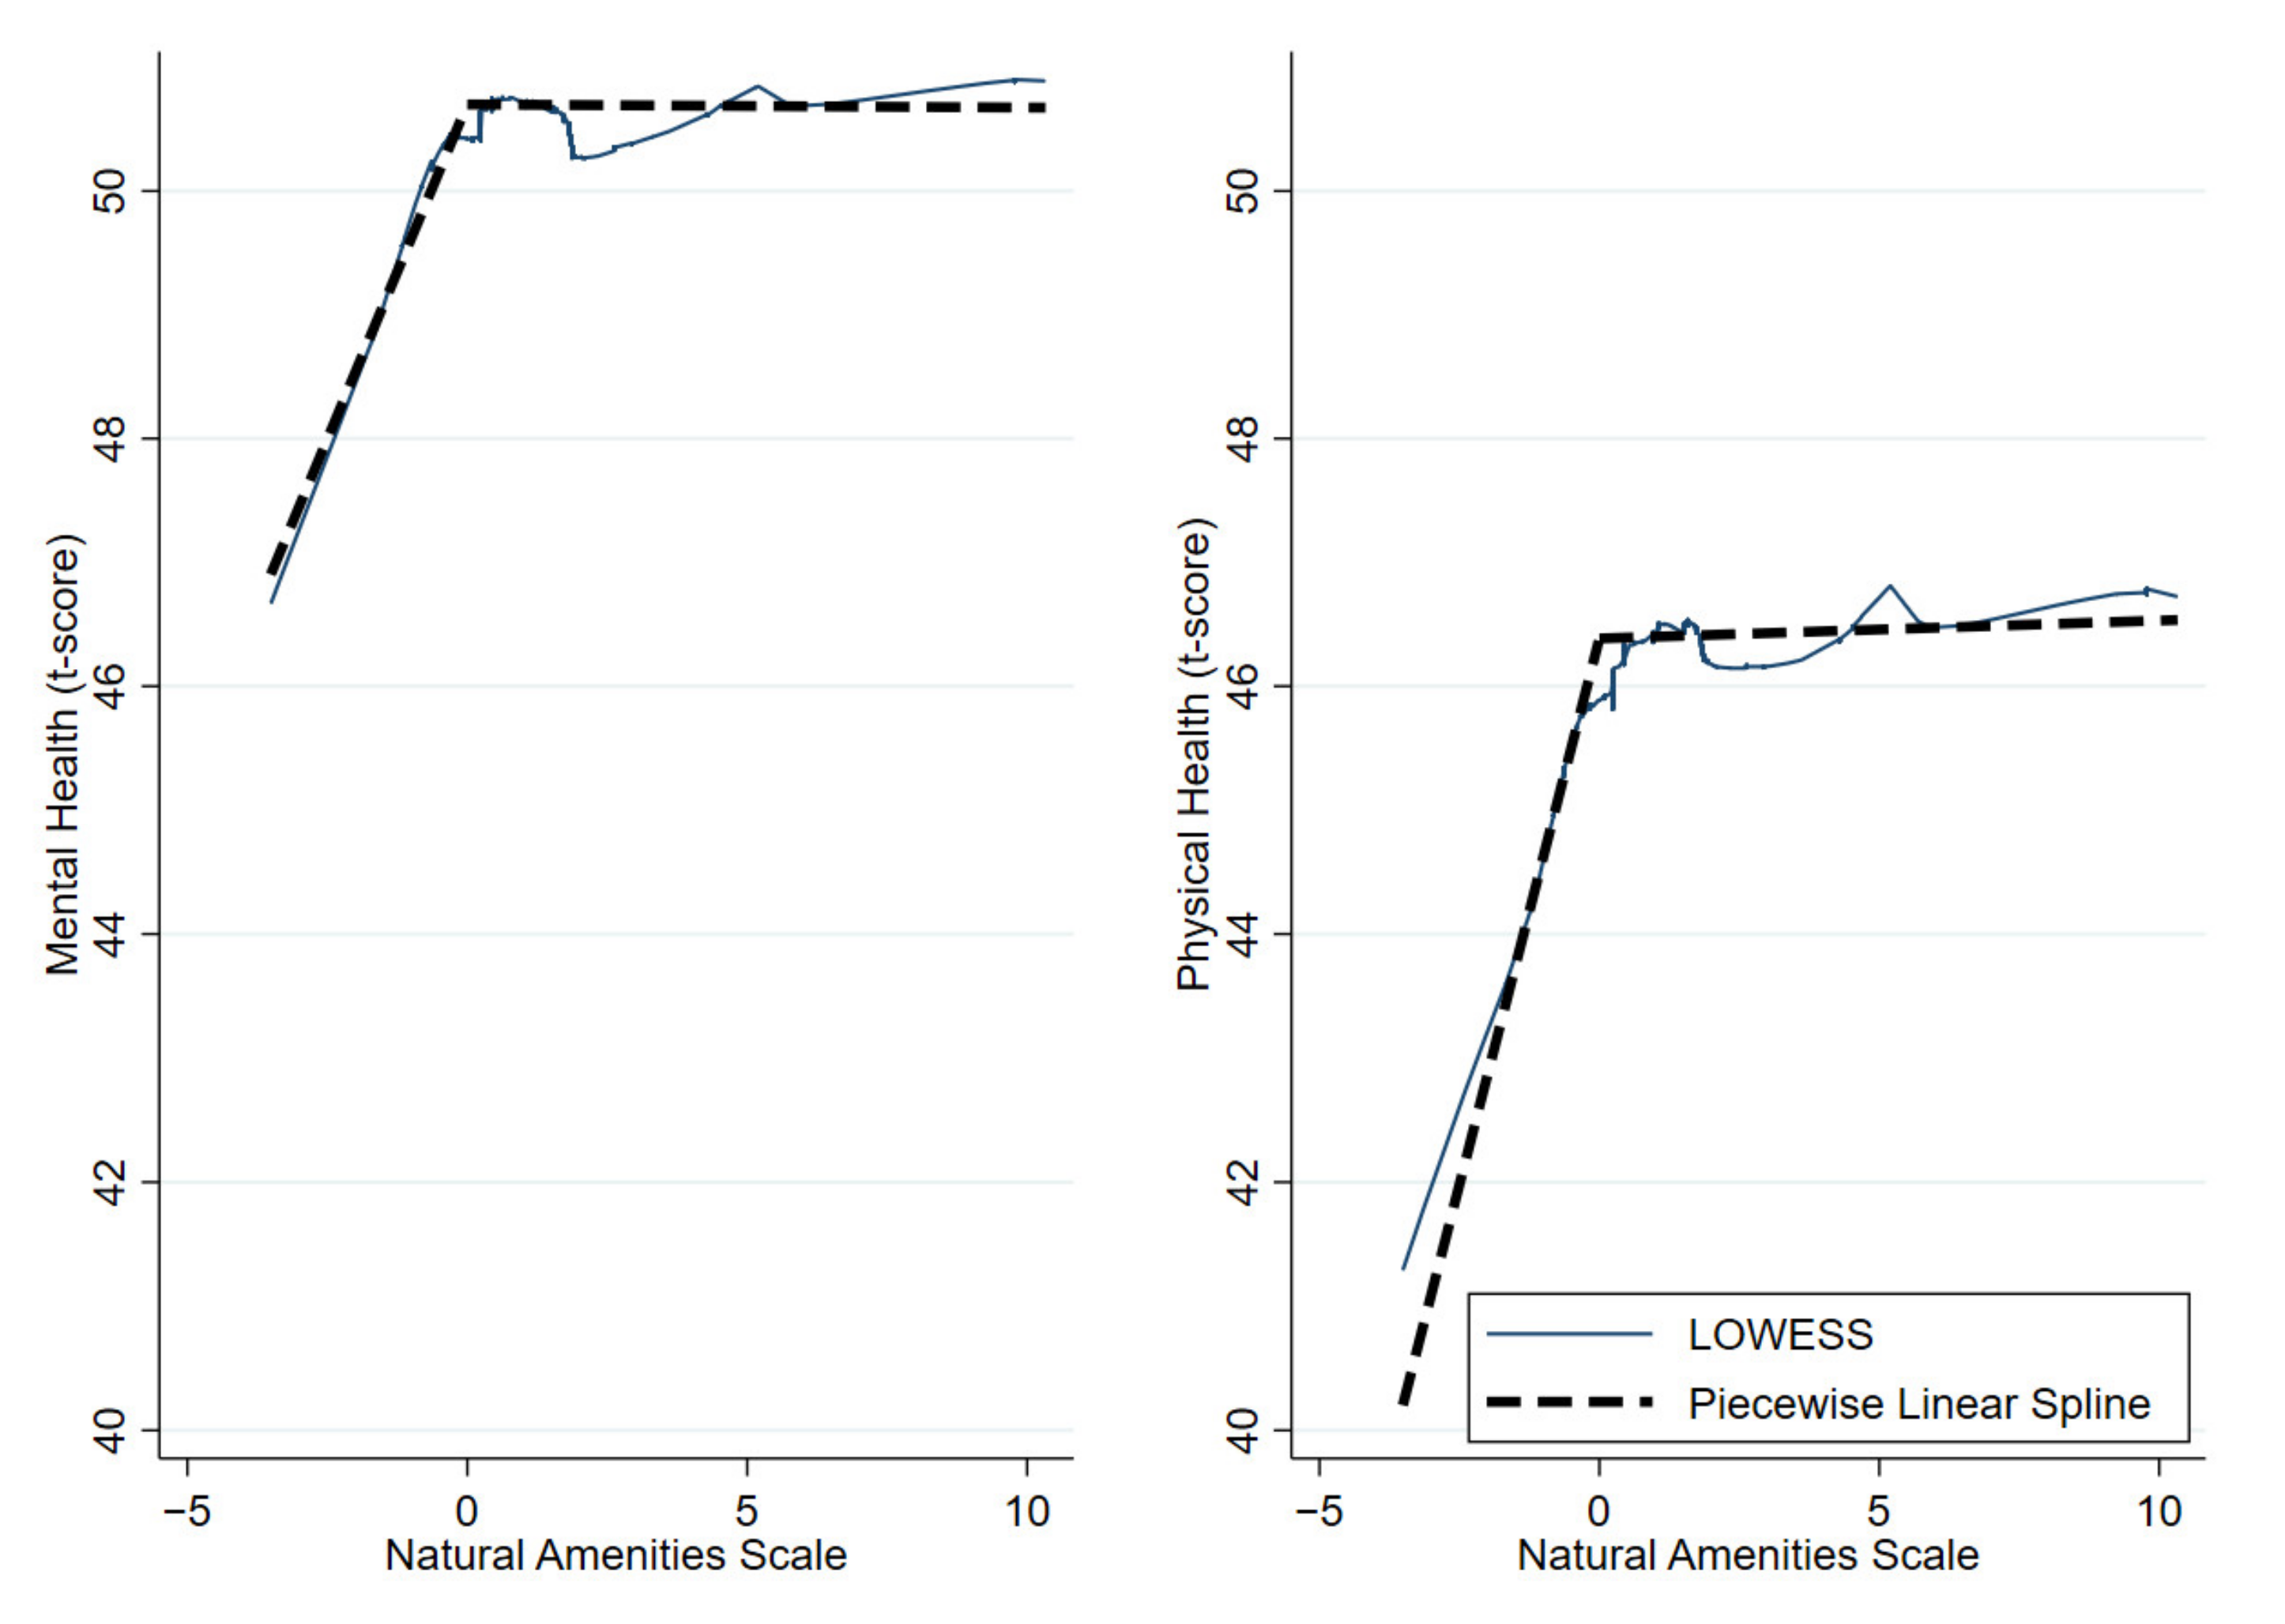
| Simple model | 1.08 (0.53, 1.63) * | −0.00 (−0.09, 0.09) * | 1.76 (1.17, 2.36) * | −0.01 (−0.09, 0.01) * |
| Subgroups | ||||
| Low income, y | 0.13 (−0.50, 0.76) * | −0.17 (−0.33, −0.02) * | 0.50 (−0.14, 1.12) | −0.14 (−0.29, 0.01) |
| Low income, n | 0.40 (−0.70, 1.51) | −0.00 (−0.11, 0.11) | 1.15 (−0.07, 2.41) | −0.02 (−0.15, 0.11) |
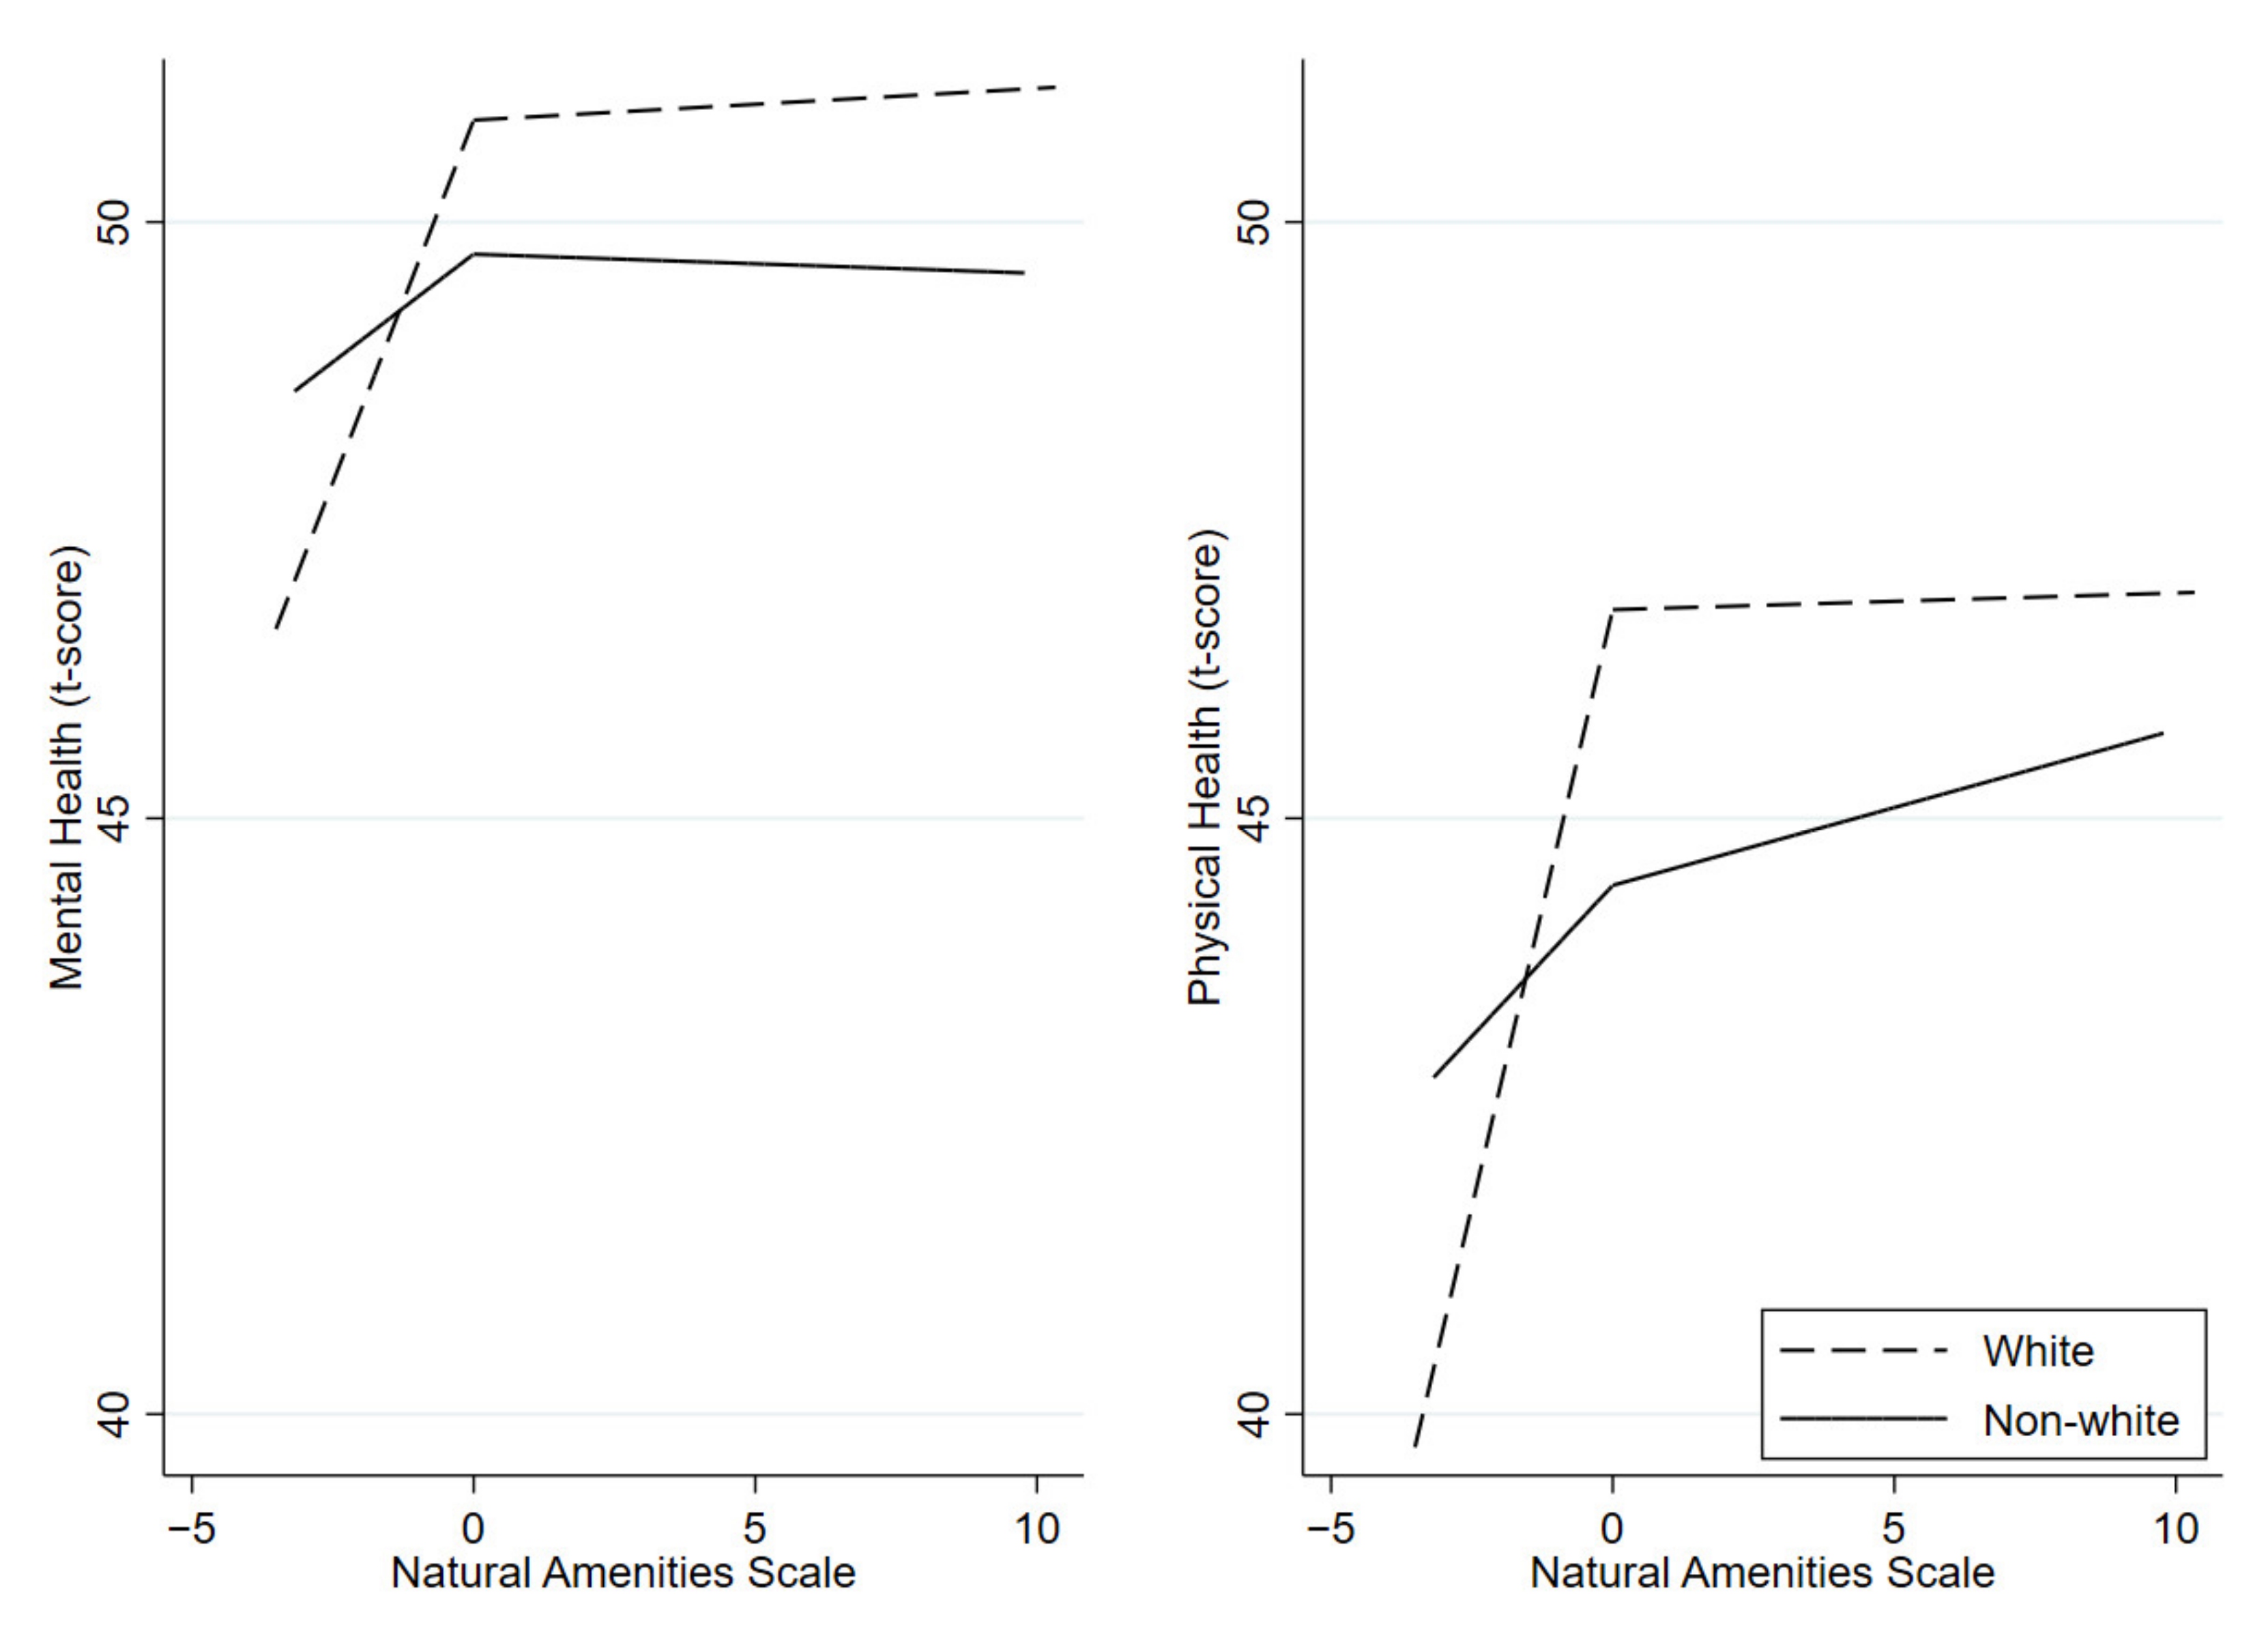
| White race, y | 1.21 (0.51, 1.91) * | 0.02 (−0.08, 0.13) * | 2.00 (1.23, 2.77) * | 0.01 (−0.11, 0.14) * |
| White race, n | 0.36 (−0.67, 1.39) | −0.02 (−0.23, 0.20) | 0.51 (−0.54, 1.56) | 0.13 (−0.09, 0.35) |
| Hispanic, y | 1.13 (−1.27, 3.52) | −0.03 (−0.36, 0.30) | 1.40 (−1.07, 3.87) | −0.03 (−0.37, 0.31) |
| Hispanic, n | 1.06 (0.48, 1.68) * | 0.01 (−0.36, 0.30) * | 1.75 (1.13, 2.37) * | 0.02 (−0.09, 0.13) * |
| Married, y | -- | -- | 1.51 (0.40, 2.63) * | 0.00 (−0.15, 0.16) * |
| Married, n | -- | -- | 1.07 (0.26, 1.88) | 0.06 (−0.10, 0.21) |
| Graduated college, y | 1.63 (0.61, 2.65) * | −0.05 (−0.17, 0.06) * | -- | -- |
| Graduated college, n | 0.56 (−0.11, 1.23) | −0.16 (−0.33, 0.01) | -- | -- |
| Rural residence, y | 1.59 (−0.22, 3.40) | −0.83 (−1.51, −0.16) | 1.97 (1.34, 2.61) | 0.06 (−0.04, 0.17) |
| Rural residence, n | 1.09 (0.51, 1.67) | 0.03 (−0.07, 0.13) | 1.53 (−0.39, 3.45) | −1.73 (−2.45, −1.02) |
| Mental Health ß (95% CI) | Physical Health ß (95% CI) | |||
|---|---|---|---|---|
| Low Amenities (NAS < 0) ß (95% CI) | High Amenities (NAS ≥ 0) ß (95% CI) | Low Amenities (NAS < 0) ß (95% CI) | High Amenities (NAS ≥ 0) ß (95% CI) | |
| Adjusted models | ||||
| Full model | 0.30 (−0.28, 0.88) | −0.09 (−0.20, 0.00) | 0.50 (−0.12, 1.13) | −0.05 (−0.15, 0.06) |
| Subgroups | ||||
| Low income, y | 0.64 (−0.08, 1.36) * | −0.27 (−0.44, −0.10) * | 0.64 (−0.09, 1.37) * | −0.21 (−0.39, −0.04) * |
| Low income, n | −0.07 (−1.18, 1.04) | −0.01 (−0.11, 0.13) | 0.43 (−0.83, 1.69) | 0.04 (−0.10, 0.17) |
| White race, y | 0.75 (0.04, 1.46) * | −0.08 (−0.19, 0.02) * | 1.03 (0.25, 1.81) * | −0.07 (−0.19, 0.05) * |
| White race, n | 0.00 (−1.14, 1.15) | −0.11 (−0.35, 0.13) | −0.13 (−1.26, 1.01) | 0.00 (−0.23, 0.24) |
| Hispanic, y | 0.01 (−2.81, 2.83) | 0.00 (−0.35, 0.36) | 0.31 (−2.52, 3.13) | −0.07 (−0.42, 0.29) |
| Hispanic, n | 0.45 (−0.16, 1.05) | −0.10 (−0.21, −0.00) | 0.57 (−0.09, 1.22) | −0.06 (−0.17, 0.06) |
| Married, y | -- | -- | 0.62 (−0.50, 1.73) | −0.05 (−0.20, 0.10) |
| Married, n | -- | -- | 0.45 (−0.32, 1.22) | −0.05 (−0.21, 0.10) |
| Graduated college, y | 0.40 (−0.64, 1.45) | −0.09 (−0.21, 0.02) | -- | -- |
| Graduated college, n | 0.36 (−0.37, 1.10) | −0.08 (−0.26, 0.10) | -- | -- |
| Rural residence, y | 0.62 (−1.15, 2.39) | 0.13 (−0.67, 0.70) | 0.51 (−1.38, 2.40) | −0.84 (−1.57, −0.10) |
| Rural residence, n | 0.30 (−0.34, 0.94) | −0.07 (−0.18, 0.03) | 0.64 (−0.04, 1.33) | −0.02 (−0.13, 0.09) |
Publisher’s Note: MDPI stays neutral with regard to jurisdictional claims in published maps and institutional affiliations. |
© 2022 by the authors. Licensee MDPI, Basel, Switzerland. This article is an open access article distributed under the terms and conditions of the Creative Commons Attribution (CC BY) license (https://creativecommons.org/licenses/by/4.0/).
Share and Cite
Bonnell, L.N.; Littenberg, B. Nonlinear Relationships among the Natural Environment, Health, and Sociodemographic Characteristics across US Counties. Int. J. Environ. Res. Public Health 2022, 19, 6898. https://doi.org/10.3390/ijerph19116898
Bonnell LN, Littenberg B. Nonlinear Relationships among the Natural Environment, Health, and Sociodemographic Characteristics across US Counties. International Journal of Environmental Research and Public Health. 2022; 19(11):6898. https://doi.org/10.3390/ijerph19116898
Chicago/Turabian StyleBonnell, Levi N., and Benjamin Littenberg. 2022. "Nonlinear Relationships among the Natural Environment, Health, and Sociodemographic Characteristics across US Counties" International Journal of Environmental Research and Public Health 19, no. 11: 6898. https://doi.org/10.3390/ijerph19116898