
Association between Gut Microbiota and Body Composition in Japanese General Population: A Focus on Gut Microbiota and Skeletal Muscle

 , , and
Abstract
:1. Introduction
2. Materials and Methods
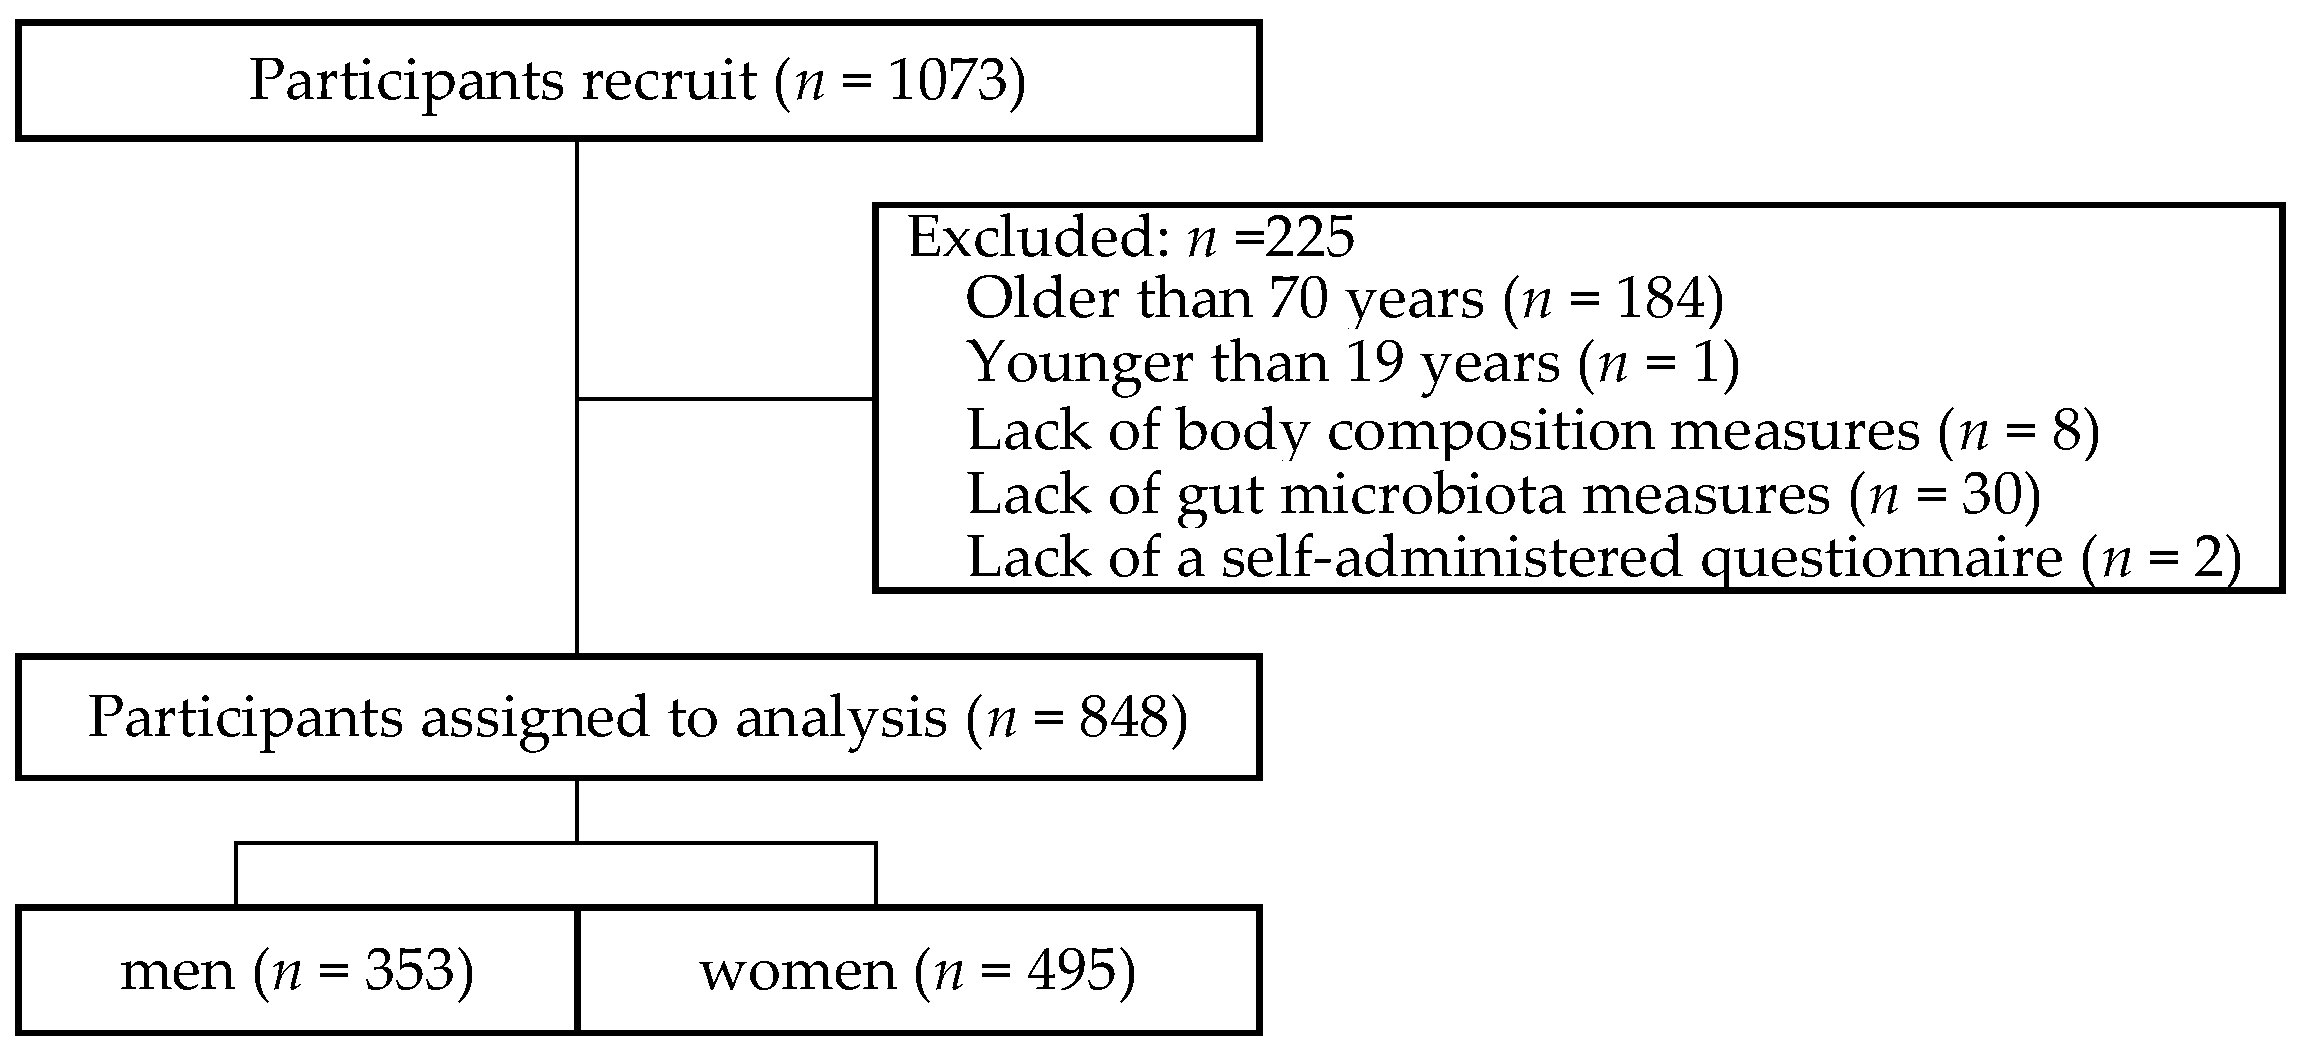
2.1. Study Participants
2.2. Measurements of Body Composition
2.3. Measurements of the Gut Microbiota
2.4. Self-Reported Questionnaire
2.5. Statistical Analysis
3. Results
3.1. Characteristics of participants
3.2. Gut Microbiota Composition of the Participants
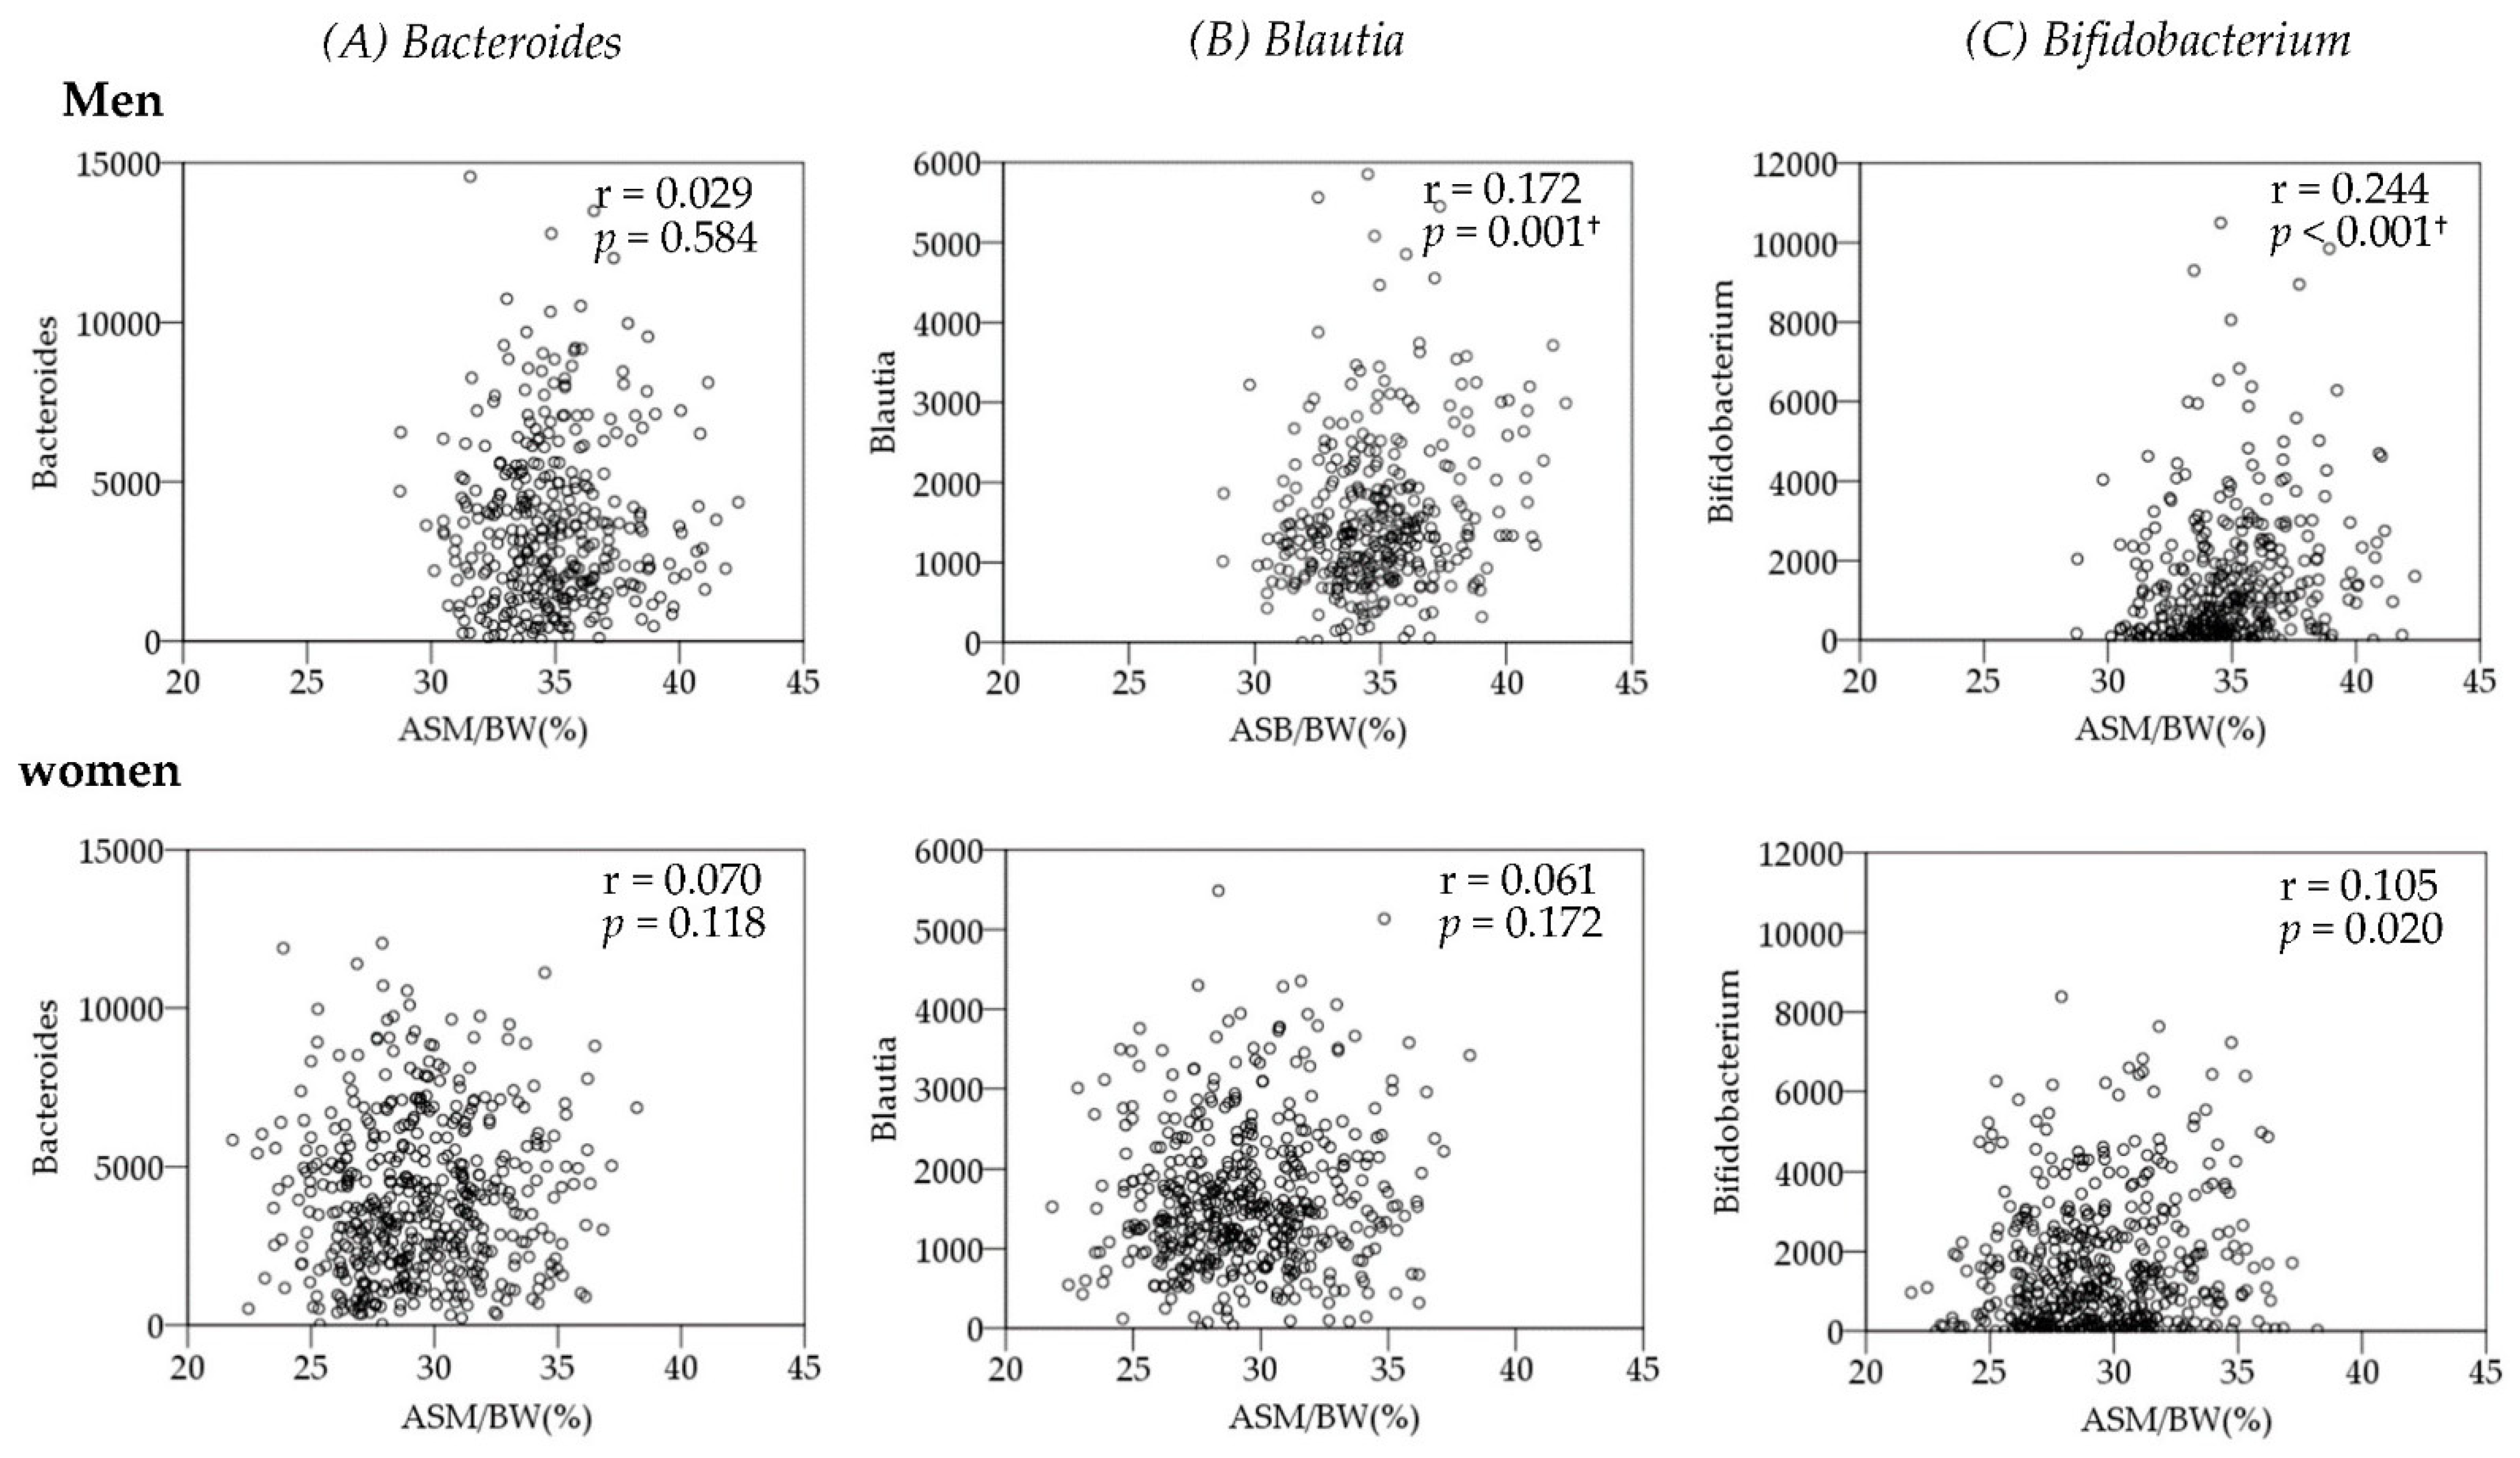
3.3. Association between Gut Microbiota and Body Composition
4. Discussion
5. Conclusions
Author Contributions
Funding
Institutional Review Board Statement
Informed Consent Statement
Data Availability Statement
Acknowledgments
Conflicts of Interest
References
- Baumgartner, R.N.; Koehler, K.M.; Gallagher, D.; Romero, L.; Heymsfield, S.B.; Ross, R.R.; Garry, P.J.; Lindeman, R.D. Epidemiology of sarcopenia among the elderly in New Mexico. Am. J. Epidemiol. 1998, 147, 755–763. [Google Scholar] [CrossRef] [PubMed]
- Lexell, J.; Downham, D.; Sjöström, M. Distribution of different fibre types in human skeletal muscles. J. Neurol. Sci. 1986, 72, 211–222. [Google Scholar] [CrossRef]
- Janssen, I.; Heymsfield, S.B.; Ross, R. Low relative skeletal muscle mass (sarcopenia) in older persons is associated with functional impairment and physical disability. J. Am. Geriatr. Soc. 2002, 50, 889–896. [Google Scholar] [CrossRef] [PubMed] [Green Version]
- Abramowitz, M.K.; Hall, C.B.; Amodu, A.; Sharma, D.; Androga, L.; Hawkins, M. Muscle mass, BMI, and mortality among adults in the United States: A population-based cohort study. PLoS ONE 2018, 13, e0194697. [Google Scholar] [CrossRef]
- Zhao, J.; Huang, Y.; Yu, X. A narrative review of gut-muscle axis and sarcopenia: The potential role of gut microbiota. Int. J. Gen. Med. 2021, 14, 1263–1273. [Google Scholar] [CrossRef]
- Siddharth, J.; Chakrabarti, A.; Pannérec, A.; Karaz, S.; Morin-Rivron, D.; Masoodi, M.; Feige, J.N.; Parkinson, S.J. Aging and sarcopenia associate with specific interactions between gut microbes, serum biomarkers and host physiology in rats. Aging 2017, 9, 1698–1720. [Google Scholar] [CrossRef] [Green Version]
- Munukka, E.; Rintala, A.; Toivonen, R.; Nylund, M.; Yang, B.; Takanen, A.; Hänninen, A.; Vuopio, J.; Huovinen, P.; Jalkanen, S.; et al. Faecalibacterium prausnitzii treatment improves hepatic health and reduces adipose tissue inflammation in high-fat fed mice. ISME J. 2017, 11, 1667–1679. [Google Scholar] [CrossRef] [Green Version]
- Lahiri, S.; Kim, H.; Garcia-Perez, I.; Reza, M.M.; Martin, K.A.; Kundu, P.; Cox, L.M.; Selkrig, J.; Posma, J.M.; Zhang, H.; et al. The gut microbiota influences skeletal muscle mass and function in mice. Sci. Transl. Med. 2019, 11, eaan5662. [Google Scholar] [CrossRef] [Green Version]
- Van Tongeren, S.P.; Slaets, J.P.; Harmsen, H.J.; Welling, G.W. Fecal microbiota composition and frailty. Appl. Environ. Microbiol. 2005, 71, 6438–6442. [Google Scholar] [CrossRef] [Green Version]
- Kang, L.; Li, P.; Wang, D.; Wang, T.; Hao, D.; Qu, X. Alterations in intestinal microbiota diversity, composition, and function in patients with sarcopenia. Sci. Rep. 2021, 11, 4628. [Google Scholar] [CrossRef]
- Bressa, C.; Bailén-Andrino, M.; Pérez-Santiago, J.; González-Soltero, R.; Pérez, M.; Montalvo-Lominchar, M.G.; Maté-Muñoz, J.L.; Domínguez, R.; Moreno, D.; Larrosa, M. Differences in gut microbiota profile between women with active lifestyle and sedentary women. PLoS ONE 2017, 12, e0171352. [Google Scholar] [CrossRef] [PubMed] [Green Version]
- Lee, M.C.; Tu, Y.T.; Lee, C.C.; Tsai, S.C.; Hsu, H.Y.; Tsai, T.Y.; Liu, T.H.; Young, S.L.; Lin, J.S.; Huang, C.C. Lactobacillus plantarum TWK10 improves muscle mass and functional performance in frail older adults: A randomized, double-blind clinical trial. Microorganisms 2021, 9, 1466. [Google Scholar] [CrossRef] [PubMed]
- Clarke, S.F.; Murphy, E.F.; O’Sullivan, O.; Lucey, A.J.; Humphreys, M.; Hogan, A.; Hayes, P.; O’Reilly, M.; Jeffery, I.B.; Wood-Martin, R.; et al. Exercise and associated dietary extremes impact on gut microbial diversity. Gut 2014, 63, 1913–1920. [Google Scholar] [CrossRef] [PubMed] [Green Version]
- Canfora, E.E.; Jocken, J.W.; Blaak, E.E. Short-chain fatty acids in control of body weight and insulin sensitivity. Nat. Rev. Endocrinol. 2015, 11, 577–591. [Google Scholar] [CrossRef]
- Khawaja, A.; Sabbagh, P.; Prioux, J.; Zunquin, G.; Baquet, G.; Maalouf, G.; Hage, Z.E.; Antoun, A.; El Hage, R. The relationships between skeletal muscle index and bone variables in a group of young adults. J. Clin. Densitom. 2021, 24, 78–87. [Google Scholar] [CrossRef]
- Lim, S.; Kim, J.H.; Yoon, J.W.; Kang, S.M.; Choi, S.H.; Park, Y.J.; Kim, K.W.; Lim, J.Y.; Park, K.S.; Jang, H.C. Sarcopenic obesity: Prevalence and association with metabolic syndrome in the Korean Longitudinal Study on Health and Aging (KLoSHA). Diabetes Care 2010, 33, 1652–1654. [Google Scholar] [CrossRef] [Green Version]
- Bijlsma, A.Y.; Meskers, C.G.; van Heemst, D.; Westendorp, R.G.; de Craen, A.J.; Maier, A.B. Diagnostic criteria for sarcopenia relate differently to insulin resistance. Age 2013, 35, 2367–2375. [Google Scholar] [CrossRef] [Green Version]
- Campa, F.; Toselli, S.; Mazzilli, M.; Gobbo, L.A.; Coratella, G. Assessment of body composition in athletes: A narrative review of available methods with special reference to quantitative and qualitative bioimpedance analysis. Nutrients 2021, 13, 1620. [Google Scholar] [CrossRef]
- Lukaski, H.; Raymond-Pope, C.J. New frontiers of body composition in sport. Int. J. Sports Med. 2021, 42, 588–601. [Google Scholar] [CrossRef]
- Nakaji, S.; Ihara, K.; Sawada, K.; Parodi, S.; Umeda, T.; Takahashi, I.; Murashita, K.; Kurauchi, S.; Tokuda, I. Social innovation for life expectancy extension utilizing a platform-centered system used in the Iwaki Health Promotion Project: A protocol paper. SAGE Open Med. 2021, 9, 20503121211002606. [Google Scholar] [CrossRef]
- Odamaki, T.; Kato, K.; Sugahara, H.; Hashikura, N.; Takahashi, S.; Xiao, J.Z.; Abe, F.; Osawa, R. Age-related changes in gut microbiota composition from newborn to centenarian: A cross-sectional study. BMC Microbiol. 2016, 16, 90. [Google Scholar] [CrossRef] [PubMed] [Green Version]
- Pietrobelli, A.; Rubiano, F.; St-Onge, M.P.; Heymsfield, S.B. New bioimpedance analysis system: Improved phenotyping with whole-body analysis. Eur. J. Clin. Nutr. 2004, 58, 1479–1484. [Google Scholar] [CrossRef] [PubMed] [Green Version]
- Tanita, M.C. Instruction Manual. Available online: www.tanita.co.jp/cms/common/pdf/support/mc_series/mc190.pdf (accessed on 28 February 2022).
- Verney, J.; Schwartz, C.; Amiche, S.; Pereira, B.; Thivel, D. Comparisons of a multi-frequency bioelectrical impedance analysis to the dual-energy X-Ray absorptiometry scan in healthy young adults depending on their physical activity level. J. Hum. Kinet 2015, 47, 73–80. [Google Scholar] [CrossRef] [PubMed] [Green Version]
- Silva, A.M.; Matias, C.N.; Nunes, C.L.; Santos, D.A.; Marini, E.; Lukaski, H.C.; Sardinha, L.B. Lack of agreement of in vivo raw bioimpedance measurements obtained from two single and multi-frequency bioelectrical impedance devices. Eur. J. Clin. Nutr. 2019, 73, 1077–1083. [Google Scholar] [CrossRef]
- Stratton, M.T.; Smith, R.W.; Harty, P.S.; Rodriguez, C.; Johnson, B.A.; Dellinger, J.R.; Williams, A.D.; White, S.J.; Benavides, M.L.; Tinsley, G.M. Longitudinal agreement of four bioimpedance analyzers for detecting changes in raw bioimpedance during purposeful weight gain with resistance training. Eur. J. Clin. Nutr. 2021, 75, 1060–1068. [Google Scholar] [CrossRef]
- Tinsley, G.M.; Moore, M.L.; Silva, A.M.; Sardinha, L.B. Cross-sectional and longitudinal agreement between two multifrequency bioimpedance devices for resistance, reactance, and phase angle values. Eur. J. Clin. Nutr. 2020, 74, 900–911. [Google Scholar] [CrossRef]
- Coratella, G.; Campa, F.; Matias, C.N.; Toselli, S.; Koury, J.C.; Andreoli, A.; Sardinha, L.S.B.; Silva, A.M. Generalized bioelectric impedance-based equations underestimate body fluids in athletes. Scand. J. Med. Sci. Sports 2021, 31, 2123–2132. [Google Scholar] [CrossRef]
- Hosomi, K.; Ohno, H.; Murakami, H.; Natsume-Kitatani, Y.; Tanisawa, K.; Hirata, S.; Suzuki, H.; Nagatake, T.; Nishino, T.; Mizuguchi, K.; et al. Method for preparing DNA from feces in guanidine thiocyanate solution affects 16S rRNA-based profiling of human microbiota diversity. Sci. Rep. 2017, 7, 4339. [Google Scholar] [CrossRef]
- Kawada, Y.; Naito, Y.; Andoh, A.; Ozeki, M.; Inoue, R. Effect of storage and DNA extraction method on 16S rRNA-profiled fecal microbiota in Japanese adults. J. Clin. Biochem. Nutr. 2019, 64, 106–111. [Google Scholar] [CrossRef] [Green Version]
- Ozato, N.; Saito, S.; Yamaguchi, T.; Katashima, M.; Tokuda, I.; Sawada, K.; Katsuragi, Y.; Kakuta, M.; Imoto, S.; Ihara, K.; et al. Blautia genus associated with visceral fat accumulation in adults 20–76 years of age. NPJ Biofilms Microbiomes 2019, 5, 28. [Google Scholar] [CrossRef] [Green Version]
- Takahashi, S.; Tomita, J.; Nishioka, K.; Hisada, T.; Nishijima, M. Development of a prokaryotic universal primer for simultaneous analysis of bacteria and archaea using next-generation sequencing. PLoS ONE 2014, 9, e105592. [Google Scholar] [CrossRef] [PubMed] [Green Version]
- Hisada, T.; Endoh, K.; Kuriki, K. Inter- and intra-individual variations in seasonal and daily stabilities of the human gut microbiota in Japanese. Arch. Microbiol. 2015, 197, 919–934. [Google Scholar] [CrossRef] [Green Version]
- Kobayashi, S.; Murakami, K.; Sasaki, S.; Okubo, H.; Hirota, N.; Notsu, A.; Fukui, M.; Date, C. Comparison of relative validity of food group intakes estimated by comprehensive and brief-type self-administered diet history questionnaires against 16 d dietary records in Japanese adults. Public Health Nutr. 2011, 14, 1200–1211. [Google Scholar] [CrossRef] [PubMed]
- Benjamini, Y.; Hochberg, Y. Controlling the false discovery rate: A practical and powerful approach to multiple testing. J. R. Stat. Soc. Series B Stat. Methodol. 1995, 57, 289–300. [Google Scholar] [CrossRef]
- Maruta, H.; Yamashita, H. Acetic acid stimulates G-protein-coupled receptor GPR43 and induces intracellular calcium influx in L6 myotube cells. PLoS ONE 2020, 15, e0239428. [Google Scholar] [CrossRef] [PubMed]
- Liu, X.; Mao, B.; Gu, J.; Wu, J.; Cui, S.; Wang, G.; Zhao, J.; Zhang, H.; Chen, W.; New, B.-A. Functional genus with potential probiotic properties? Gut Microbes 2021, 13, 1875796. [Google Scholar] [CrossRef]
- Inoue, R.; Ohue-Kitano, R.; Tsukahara, T.; Tanaka, M.; Masuda, S.; Inoue, T.; Yamakage, H.; Kusakabe, T.; Hasegawa, K.; Shimatsu, A.; et al. Prediction of functional profiles of gut microbiota from 16S RRNA metagenomic data provides a more robust evaluation of gut dysbiosis occurring in Japanese type 2 diabetic patients. J. Clin. Biochem. Nutr. 2017, 61, 217–221. [Google Scholar] [CrossRef] [Green Version]
- Tong, X.; Xu, J.; Lian, F.; Yu, X.; Zhao, Y.; Xu, L.; Zhang, M.; Zhao, X.; Shen, J.; Wu, S.; et al. Structural alteration of gut microbiota during the amelioration of human type 2 diabetes with hyperlipidemia by metformin and a traditional Chinese herbal formula: A multicenter, randomized, open label clinical trial. mBio 2018, 9, e02392-17. [Google Scholar] [CrossRef] [Green Version]
- Mesinovic, J.; Zengin, A.; De Courten, B.; Ebeling, P.R.; Scott, D. Sarcopenia and type 2 diabetes mellitus: A bidirectional relationship. Diabetes Metab. Syndr. Obes. 2019, 12, 1057–1072. [Google Scholar] [CrossRef] [Green Version]
- Ni, Y.; Yang, X.; Zheng, L.; Wang, Z.; Wu, L.; Jiang, J.; Yang, T.; Ma, L.; Fu, Z. Lactobacillus and Bifidobacterium improves physiological function and cognitive ability in aged mice by the regulation of gut microbiota. Mol. Nutr. Food Res. 2019, 63, e1900603. [Google Scholar] [CrossRef]
- Minami, J.; Iwabuchi, N.; Tanaka, M.; Yamauchi, K.; Xiao, J.Z.; Abe, F.; Sakane, N. Effects of Bifidobacterium breve B-3 on body fat reductions in pre-obese adults: A randomized, double-blind, placebo-controlled trial. Biosci. Microbiota Food Health 2018, 37, 67–75. [Google Scholar] [CrossRef] [PubMed] [Green Version]
- Bailén, M.; Bressa, C.; Martínez-López, S.; González-Soltero, R.; Montalvo Lominchar, M.G.; San Juan, C.; Larrosa, M. Microbiota features associated with a high-fat/low-fiber diet in healthy adults. Front. Nutr. 2020, 7, 583608. [Google Scholar] [CrossRef] [PubMed]
- Jang, L.G.; Choi, G.; Kim, S.W.; Kim, B.Y.; Lee, S.; Park, H. The combination of sport and sport-specific diet is associated with characteristics of gut microbiota: An observational study. J. Int. Soc. Sports Nutr. 2019, 16, 21. [Google Scholar] [CrossRef] [PubMed] [Green Version]
- Wang, Y.; Ames, N.P.; Tun, H.M.; Tosh, S.M.; Jones, P.J.; Khafipour, E. High molecular weight barley β-glucan alters gut microbiota toward reduced cardiovascular disease risk. Front. Microbiol. 2016, 7, 129. [Google Scholar] [CrossRef] [PubMed] [Green Version]
- Naderpoor, N.; Mousa, A.; Gomez-Arango, L.F.; Barrett, H.L.; Dekker Nitert, M.; de Courten, B. Faecal microbiota are related to insulin sensitivity and secretion in overweight or obese adults. J. Clin. Med. 2019, 8, 452. [Google Scholar] [CrossRef] [Green Version]
- Haro, C.; Rangel-Zúñiga, O.A.; Alcalá-Díaz, J.F.; Gómez-Delgado, F.; Pérez-Martínez, P.; Delgado-Lista, J.; Quintana-Navarro, G.M.; Landa, B.B.; Navas-Cortés, J.A.; Tena-Sempere, M.; et al. Intestinal microbiota is influenced by gender and body mass index. PLoS ONE 2016, 11, e0154090. [Google Scholar] [CrossRef] [Green Version]
- Takagi, T.; Naito, Y.; Inoue, R.; Kashiwagi, S.; Uchiyama, K.; Mizushima, K.; Tsuchiya, S.; Dohi, O.; Yoshida, N.; Kamada, K.; et al. Differences in gut microbiota associated with age, sex, and stool consistency in healthy Japanese subjects. J. Gastroenterol. 2019, 54, 53–63. [Google Scholar] [CrossRef]
- Markle, J.G.; Frank, D.N.; Mortin-Toth, S.; Robertson, C.E.; Feazel, L.M.; Rolle-Kampczyk, U.; von Bergen, M.; McCoy, K.D.; Macpherson, A.J.; Danska, J.S. Sex differences in the gut microbiome drive hormone-dependent regulation of autoimmunity. Science 2013, 339, 1084–1088. [Google Scholar] [CrossRef] [Green Version]
- Stevens, J.; Katz, E.G.; Huxley, R.R. Associations between gender, age and waist circumference. Eur. J. Clin. Nutr. 2010, 64, 6–15. [Google Scholar] [CrossRef] [Green Version]


| Men | Women | |
|---|---|---|
| n = 353 | n = 495 | |
| Mean ± SD | Mean ± SD | |
| Age (years) | 50.0 ± 12.9 | 50.8 ± 12.8 |
| Body composition | ||
| Body weight (kg) | 69.4 ± 11.3 | 54.7 ± 9.4 |
| ASM (kg) | 24.1 ± 3.5 | 15.9 ± 1.9 |
| ASM/BW (%) | 34.9 ± 2.4 | 29.4 ± 2.9 |
| Nutrition | ||
| Protein intake (g/d) | 75.8 ± 25.8 | 64.4 ± 21.7 |
| Fat intake (g/d) | 56.3 ± 19.5 | 50.6 ± 16.7 |
| Carbohydrate intake (g/d) | 290.4 ± 85.9 | 217.4 ± 64.4 |
| Total dietary fiber intake (g/d) | 11.3 ± 4.6 | 10.3 ± 3.9 |
| Alcohol intake (g/d) | 22.6 ± 26.4 | 5.4 ± 12.2 |
| Lifestyle | ||
| Smoking (s/d) | 7.4 ± 13.6 | 2.3 ± 7.9 |
| Physical activity (min/wk) | 52.8 ± 149.2 | 35.7 ± 103.6 |
| Sleep time (min/d) | 419.1 ± 64.3 | 400.6 ± 64.5 |
| Habitual medicine use (No, %) | 194 (55.0) | 245 (49.5) |
| (Yes, %) | 159 (45.0) | 250 (50.5) |
| Men (n = 353) | Women (n = 495) | p-Value | |
|---|---|---|---|
| Mean ± SD | Mean ± SD | ||
| Phylum | |||
| Firmicutes | 10442.9 ± 3334.0 | 10986.7 ± 3103.6 | 0.014 |
| Bacteroidetes | 6324.0 ± 3264.8 | 5802.2 ± 2645.7 | 0.056 |
| Actinobacteria | 2214.3 ± 1944.5 | 2232.3 ± 1813.7 | 0.782 |
| Proteobacteria | 632.1 ± 873.4 | 460.7 ± 560.7 | <0.001 |
| Genera | |||
| B_Bacteroides | 3663.8 ± 2595.0 | 3993.9 ± 2442.8 | 0.014 |
| F_Blautia | 1550.8 ± 937.9 | 1658.4 ± 1001.2 | 0.063 |
| A_Bifidobacterium | 1498.5 ± 1685.8 | 1619.7 ± 1609.3 | 0.189 |
| F_Fusicatenibacter | 521.1 ± 510.5 | 536.1 ± 556.4 | 0.707 |
| B_Parabacteroides | 420.2 ± 597.9 | 437.1 ± 509.9 | 0.019 |
| F_Gemmiger | 345.3 ± 400.9 | 461.1 ± 443.4 | <0.001 |
| F_Ruminococcus2 | 343.2 ± 391.6 | 341.0 ± 384.8 | 0.500 |
| F_Dorea | 203.0 ± 184.7 | 177.1 ± 180.1 | 0.009 |
| F_Clostridium XlVa | 145.6 ± 140.5 | 170.7 ± 153.0 | 0.002 |
| F_Clostridium IV | 100.8 ± 184.9 | 178.5 ± 309.5 | <0.001 |
| F_Holdemanella | 147.0 ± 306.3 | 120.3 ± 306.2 | 0.081 |
| F_Clostridium XVIII | 122.1 ± 204.0 | 130.8 ± 186.8 | 0.071 |
| F_Coprococcus | 119.2 ± 155.7 | 124.3 ± 176.3 | 0.429 |
| P_Escherichia/Shigella | 91.5 ± 408.7 | 110.1 ± 358.2 | 0.752 |
| F_Dialister | 82.1 ± 165.8 | 106.0 ± 193.3 | 0.001 |
| F_Lactobacillus | 114.0 ± 540.1 | 40.5 ± 142.9 | 0.855 |
| P_Parasutterella | 66.5 ± 135.9 | 77.1 ± 151.2 | 0.708 |
| B_Paraprevotella | 63.2 ± 145.0 | 45.8 ± 125.5 | 0.002 |
| F_Bacillus | 38.1 ± 119.7 | 41.1 ± 95.9 | 0.071 |
| F_Clostridium XlVb | 40.7 ± 61.3 | 39.1 ± 72.8 | 0.964 |
| B_Acidaminococcus | 42.6 ± 107.5 | 29.7 ± 101.9 | 0.001 |
| F_Flavonifractor | 29.6 ± 39.5 | 41.6 ± 42.9 | <0.001 |
| B_Barnesiella | 23.1 ± 62.1 | 35.9 ± 78.7 | 0.338 |
| A_Eggerthella | 23.0 ± 43.2 | 36.6 ± 54.1 | <0.001 |
| F_Odoribacter | 21.9 ± 47.6 | 30.1 ± 42.4 | <0.001 |
| F_Erysipelotrichaceae_incertae_sedis | 20.1 ± 46.2 | 28.5 ± 84.7 | 0.195 |
| P_Bilophila | 21.9 ± 37.9 | 27.2 ± 37.3 | 0.109 |
| P_Enterobacter | 21.0 ± 146.6 | 5.8 ± 56.8 | 0.291 |
| F_Terrisporobacter | 14.6 ± 57.3 | 14.0 ± 57.6 | 0.290 |
| B_Butyricimonas | 12.1 ± 30.0 | 13.7 ± 26.3 | 0.158 |
| A_Senegalimassilia | 12.7 ± 39.0 | 8.9 ± 30.4 | <0.001 |
| B_Allisonella | 9.3 ± 17.5 | 5.3 ± 12.5 | <0.001 |
| P_Raoultella | 6.7 ± 39.0 | 6.9 ± 67.9 | 0.800 |
| F_Intestinimonas | 5.1 ± 13.8 | 8.6 ± 16.8 | <0.001 |
| P_Succinivibrio | 8.2 ± 88.8 | 1.5 ± 23.0 | 0.219 |
| P_Desulfovibrio | 4.4 ± 21.5 | 2.2 ± 12.6 | 0.389 |
| A_Olsenella | 3.0 ± 12.0 | 1.9 ± 8.4 | 0.003 |
| A_Gordonibacter | 1.6 ± 3.6 | 3.0 ± 4.9 | <0.001 |
| A_Rothia | 2.4 ± 5.6 | 1.9 ± 3.7 | 0.131 |
| F_Eisenbergiella | 1.0 ± 4.1 | 3.3 ± 11.6 | <0.001 |
| P_Serratia | 0.0 ± 0.3 | 2.3 ± 48.2 | 0.410 |
| F_Pseudoflavonifractor | 1.1 ± 8.7 | 1.0 ± 2.8 | 0.001 |
| Men (n = 353) | Women (n = 353) | |||||||||||
|---|---|---|---|---|---|---|---|---|---|---|---|---|
| ASM/BW (%) | ASM (kg) | Body Weight (kg) | ASM/BW (%) | ASM (kg) | Body Weight (kg) | |||||||
| r | p | r | p | r | p | r | p | r | p | r | p | |
| B_Bacteroides | 0.029 | 0.584 | 0.086 | 0.105 | 0.079 | 0.140 | 0.070 | 0.118 | −0.065 | 0.147 | −0.094 | 0.037 |
| F_Blautia | 0.172 | 0.001 † | −0.014 | 0.800 | −0.100 | 0.061 | 0.061 | 0.172 | −0.082 | 0.068 | −0.094 | 0.036 |
| A_Bifidobacterium | 0.244 | 0.000 † | 0.115 | 0.031 | −0.017 | 0.745 | 0.105 | 0.020 | 0.125 | 0.005 | 0.012 | 0.792 |
| F_Fusicatenibacter | 0.007 | 0.898 | 0.109 | 0.041 | 0.074 | 0.165 | −0.09 | 0.045 | 0.030 | 0.503 | 0.094 | 0.036 |
| B_Parabacteroides | 0.108 | 0.043 | 0.005 | 0.933 | −0.029 | 0.583 | 0.108 | 0.016 | 0.096 | 0.033 | −0.003 | 0.939 |
| F_Gemmiger | 0.113 | 0.033 | 0.097 | 0.069 | 0.023 | 0.667 | 0.066 | 0.144 | 0.011 | 0.811 | −0.035 | 0.442 |
| F_Ruminococcus2 | −0.082 | 0.122 | 0.117 | 0.028 | 0.137 | 0.010 | −0.068 | 0.129 | 0.09 | 0.046 | 0.121 | 0.007 |
| F_Dorea | −0.011 | 0.830 | 0.103 | 0.053 | 0.102 | 0.056 | −0.136 | 0.002 † | 0.086 | 0.054 | 0.158 | 0.000 † |
| F_Clostridium XlVa | −0.039 | 0.461 | 0.046 | 0.387 | 0.062 | 0.248 | 0.066 | 0.145 | −0.074 | 0.101 | −0.106 | 0.018 |
| F_Clostridium IV | 0.032 | 0.544 | 0.018 | 0.738 | −0.002 | 0.965 | 0.042 | 0.349 | 0.122 | 0.007 | 0.076 | 0.092 |
| F_Holdemanella | −0.099 | 0.062 | 0.045 | 0.404 | 0.104 | 0.051 | −0.111 | 0.013 | 0.021 | 0.634 | 0.077 | 0.087 |
| F_Clostridium XVIII | 0.066 | 0.219 | −0.040 | 0.455 | −0.061 | 0.251 | −0.028 | 0.530 | −0.108 | 0.016 | −0.051 | 0.254 |
| F_Coprococcus | −0.044 | 0.413 | 0.083 | 0.120 | 0.113 | 0.033 | −0.118 | 0.009 | 0.028 | 0.527 | 0.093 | 0.039 |
| P_Escherichia/Shigella | −0.048 | 0.364 | 0.005 | 0.925 | 0.031 | 0.568 | 0.122 | 0.007 | 0.022 | 0.622 | −0.061 | 0.173 |
| F_Dialister | 0.032 | 0.553 | 0.050 | 0.345 | 0.036 | 0.505 | −0.107 | 0.017 | 0.083 | 0.066 | 0.126 | 0.005 |
| F_Lactobacillus | −0.14 | 0.008 | −0.035 | 0.508 | 0.050 | 0.353 | −0.076 | 0.093 | 0.070 | 0.118 | 0.099 | 0.027 |
| P_Parasutterella | 0.024 | 0.658 | 0.115 | 0.031 | 0.088 | 0.097 | 0.014 | 0.760 | 0.068 | 0.131 | 0.041 | 0.362 |
| B_Paraprevotella | 0.013 | 0.812 | −0.002 | 0.972 | 0.007 | 0.901 | −0.099 | 0.027 | 0.049 | 0.273 | 0.094 | 0.036 |
| F_Bacillus | −0.034 | 0.521 | −0.053 | 0.319 | −0.021 | 0.695 | −0.043 | 0.342 | −0.102 | 0.024 | −0.030 | 0.512 |
| F_Clostridium XlVb | −0.121 | 0.023 | 0.043 | 0.420 | 0.091 | 0.089 | 0.014 | 0.758 | 0.063 | 0.164 | 0.046 | 0.308 |
| F_Acidaminococcus | −0.017 | 0.757 | 0.096 | 0.071 | 0.137 | 0.010 | −0.088 | 0.050 | 0.024 | 0.599 | 0.073 | 0.103 |
| F_Flavonifractor | 0.138 | 0.009 | 0.061 | 0.255 | −0.007 | 0.891 | 0.157 | 0.000 † | 0.004 | 0.930 | −0.089 | 0.047 |
| B_Barnesiella | −0.033 | 0.538 | 0.032 | 0.543 | 0.041 | 0.442 | 0.004 | 0.936 | 0.096 | 0.032 | 0.080 | 0.077 |
| A_Eggerthella | 0.134 | 0.011 | −0.010 | 0.851 | −0.087 | 0.102 | 0.143 | 0.001 † | −0.012 | 0.793 | −0.093 | 0.038 |
| B_Odoribacter | 0.014 | 0.786 | 0.078 | 0.142 | 0.060 | 0.259 | 0.086 | 0.055 | 0.136 | 0.003 | 0.052 | 0.245 |
| F_Erysipelotrichaceae_incertae_sedis | 0.110 | 0.038 | 0.014 | 0.792 | −0.030 | 0.572 | 0.146 | 0.001 † | −0.006 | 0.902 | −0.104 | 0.020 |
| P_Bilophila | 0.014 | 0.787 | 0.058 | 0.280 | 0.078 | 0.144 | 0.056 | 0.211 | 0.115 | 0.010 | 0.059 | 0.192 |
| F_Eisenbergiella | 0.049 | 0.363 | 0.019 | 0.717 | −0.004 | 0.935 | 0.183 | 0.000 † | −0.025 | 0.585 | −0.135 | 0.003 |
| Explanatory Variables | ASM/BW (%) | ASM (kg) | Body Weight (kg) | |
|---|---|---|---|---|
| (95%Cl) | (95%Cl) | (95%Cl) | ||
| Men | F_Blautia | 0.0003 (0.0001, 0.0006) * | −0.0017 (−0.0029, −0.0005) ** | |
| age | −0.08 (−0.1, −0.06) *** | −0.16 (−0.25, −0.07) ** | ||
| sleep time | −0.03 (−0.05, −0.01) ** | |||
| fat intake | 0.09 (0.03, 0.15) ** | |||
| A_Bifidobacterium | 0.0001 (0.00001, 0.0003) * | |||
| age | −0.08 (−0.1, −0.06) *** | |||
| Women | F_Dorea | −0.0016 (−0.0029, −0.0003) * | 0.0056 (0.001, 0.0102) * | |
| age | −0.11 (−0.13, −0.09) *** | |||
| F_Flavonifractor | −0.0056 (−0.0094, −0.0018) ** | −0.0271 (−0.0463, −0.0079) ** | ||
| age | −0.06 (−0.08, −0.05) *** | |||
| A_Eggerthella | −0.0044 (−0.0073, −0.0015) ** | −0.0207 (−0.0358, −0.0055) ** | ||
| age | −0.062 (−0.07, −0.05) *** | |||
| F_Erysipelotrichaceae_incertae_sedis | −0.0022 (−0.0041, −0.0004) * | |||
| age | −0.06 (−0.07, −0.05) *** | |||
| F_Eisenbergiella | 0.0209 (0.0011, 0.0407) * | −0.0769 (−0.1481, −0.0057) * | ||
| age | −0.113 (−0.132, −0.094) *** | |||
| total fiber | 0.063 (0.002, 0.125) * |
Publisher’s Note: MDPI stays neutral with regard to jurisdictional claims in published maps and institutional affiliations. |
© 2022 by the authors. Licensee MDPI, Basel, Switzerland. This article is an open access article distributed under the terms and conditions of the Creative Commons Attribution (CC BY) license (https://creativecommons.org/licenses/by/4.0/).
Share and Cite
Sugimura, Y.; Kanda, A.; Sawada, K.; Wai, K.M.; Tanabu, A.; Ozato, N.; Midorikawa, T.; Hisada, T.; Nakaji, S.; Ihara, K. Association between Gut Microbiota and Body Composition in Japanese General Population: A Focus on Gut Microbiota and Skeletal Muscle. Int. J. Environ. Res. Public Health 2022, 19, 7464. https://doi.org/10.3390/ijerph19127464
Sugimura Y, Kanda A, Sawada K, Wai KM, Tanabu A, Ozato N, Midorikawa T, Hisada T, Nakaji S, Ihara K. Association between Gut Microbiota and Body Composition in Japanese General Population: A Focus on Gut Microbiota and Skeletal Muscle. International Journal of Environmental Research and Public Health. 2022; 19(12):7464. https://doi.org/10.3390/ijerph19127464
Chicago/Turabian StyleSugimura, Yoshikuni, Akira Kanda, Kaori Sawada, Kyi Mar Wai, Asano Tanabu, Naoki Ozato, Tatsuyuki Midorikawa, Takayoshi Hisada, Shigeyuki Nakaji, and Kazushige Ihara. 2022. "Association between Gut Microbiota and Body Composition in Japanese General Population: A Focus on Gut Microbiota and Skeletal Muscle" International Journal of Environmental Research and Public Health 19, no. 12: 7464. https://doi.org/10.3390/ijerph19127464