Article

Assessment of Exercise Intensity for Uphill Walking in Healthy Adults Performed Indoors and Outdoors

1
Institute of Preventive Pediatrics, Faculty of Sport and Health Sciences, Technical University of Munich, 80992 Munich, Germany
2
Institute of Sports Medicine, Prevention and Rehabilitation and Research Institute of Molecular Sports Medicine and Rehabilitation, Paracelsus Medical University, 5020 Salzburg, Austria
3
Ludwig Boltzmann Institute for Digital Health and Prevention, 5020 Salzburg, Austria
4
Salzburg Research Forschungsgesellschaft mbH, 5020 Salzburg, Austria
5
Department of Medical Engineering, Carinthia University of Applied Sciences, 9524 Villach, Austria
6
St. Irmingard Klinik Prien, Clinic for Cardiology, 83209 Prien am Chiemsee, Germany
*
Author to whom correspondence should be addressed.
Int. J. Environ. Res. Public Health 2022, 19(24), 16662; https://doi.org/10.3390/ijerph192416662
Submission received: 9 November 2022 / Revised: 2 December 2022 / Accepted: 9 December 2022 / Published: 12 December 2022

Abstract

:
Background: Borg’s rating of perceived exertion (BRPE) scale is a simple, but subjective tool to grade physical strain during exercise. As a result, it is widely used for the prescription of exercise intensity, especially for cardiovascular disease prevention. The purpose of this study was to assess and compare relationships between BRPE and physiological measures of exercise intensity during uphill walking indoors and outdoors. Methods: 134 healthy participants [median age: 56 years (IQR 52–63)] completed a maximal graded walking test indoors on a treadmill using the modified Bruce protocol, and a submaximal 1 km outdoor uphill cardio-trekking test (1 km CTT). Heart rate (HR) and oxygen consumption (V̇O2) were continuously measured throughout both tests. BRPE was simultaneously assessed at the end of each increment on the treadmill, while the maximal BRPE value was noted at the end of the 1 km CTT. Results: On the treadmill, BRPE correlated very high with relative HR (%HRmax) (ρ = 0.88, p < 0.001) and V̇O2 (%V̇O2max) (ρ = 0.89, p < 0.001). During the 1 km CTT, a small correlation between BRPE and %HRmax (ρ = 0.24, p < 0.05), respectively %V̇O2max was found (ρ = 0.24, p < 0.05). Conclusions: Criterion validity of BRPE during uphill walking depends on the environment and is higher during a treadmill test compared to a natural environment. Adding sensor-based, objective exercise-intensity parameters such as HR holds promise to improve intensity prescription and health safety during uphill walking in a natural environment.

1. Introduction

Cardiovascular diseases (CVD) are a significant health problem worldwide, despite the fact that several risk factors are modifiable [1,2]. The prevalence of CVD almost doubled between 1990 and 2019, from 271 to 523 million cases [2]. A healthy lifestyle that includes regular physical exercise is an important preventive strategy [3,4]. Physical activity (PA) clearly has numerous benefits for preventing CVD, as reported in several sets of guidelines [5,6,7]. Unfortunately, in modern societies, the general population spends too little time on physical activity (PA), and therefore, there is an urgent need to improve aerobic exercise in order to reduce CVD burden [8,9,10].
To assess the PA intensity during exercise interventions, tools are required. Cardiopulmonary exercise testing (CPET) is the criterion measurement to assess exercise capacity objectively, and is an essential and widely used tool in clinical applications to prescribe exercise intensity, especially for patients with CVD [11]. Exercise tests have been around for more than 50 years [12]. Despite its methodological complexity and high cost, ventilatory gas analysis is a very popular and accurate test method for the objective assessment of exercise intensity [13]. Instead, subjectively experienced intensity of effort while being physically active such as the Borg’s Rating of Perceived Exertion (BRPE) [14,15,16] is commonly used to assess and prescribe exercise intensity.
The rationale for Borg’s 6–20 scale was based on the linear increase of the values of heart rate (HR) and oxygen consumption (V̇O2) during cycling and running [17]. Only a few studies investigated the relationship during walking, although walking is the most often reported PA among adults [18]. Previous findings demonstrated the usefulness of Borg’s 6–20 scale as a tool for prescribing and monitoring exercise intensity from young to elderly participants [19,20,21,22,23]. Additionally, several studies have shown a clear benefit of using BRPE to control exercise intensity for both men and women [24,25,26]. According to the National Institutes of Health Development Panel on Physical Activity and Cardiovascular Health (USA), many people do not see walking as appropriate moderate-level exercise with preventive effects [27]. Although there is substantial evidence that moderate PA, such as brisk walking, is sufficient to reduce the risk of CVD in all male and female age groups, as well as in healthy and patient populations [28,29,30,31], there is still a lack of appreciation for the benefits related to walking. However, walking is reported to be the most common PA (15.0% to 41.8%) among adults in most countries [18] and can help reduce physical inactivity [29]. Notably, hiking which usually consists of walking uphill is gaining popularity, even among elderly individuals [32,33], and is considered to be beneficial to health [34,35]. Thus, exercise testing protocols using walking/hiking yield advantages compared to running.
There have been studies using BRPE in the laboratory to validate exercise intensity assessment; nevertheless, no study has been performed within a more ecologically valid environment, such as outdoor hiking trails. The use of BRPE in a clinical setting supports patients to monitor their exercise intensity if maximal testing is not possible [36]. BRPE has been shown to be a good predictor of exercise intensity in young healthy adults [20,21,24], middle-aged [37,38] and elderly adults [25,39]. In addition, the control of exercise intensity by using BRPE in young and healthy adults leads to cardiorespiratory and muscular fitness improvements [40]. Therefore, exercise recommendations for a patient, as well as a healthy population, already include BRPE [36,41,42,43]. To this end, we set out to examine the relationship between the BRPE scale and physiological measures of exercise intensity during a graded walking test on the treadmill and a 1 km cardio-trekking test (1 km CTT) on an uphill terrain in nature.

2. Materials and Methods

2.1. Participants and Study Design

We included 134 healthy adults [median age: 56 years (IQR 52–63)], 58 men [median age: 56 years (IQR 52–62)], and 76 women [median age: 57 years (IQR 51–63)] in the Connect2Move project [44,45]. The European cross-border study aimed to highlight natural and safe cardio-trekking trails for the sustainable promotion of cross-generational and health-oriented tourism. Study participants aged ≥45 years were screened by detailed physical and cardiac examinations. These examinations included an anamnesis, anthropometric and blood pressure measurements, a fastening blood sample, pulmonary function testing, resting electrocardiography, and an echocardiography in order to exclude those with cardiovascular or chronic diseases. The Technical University of Munich (Germany) and the Ludwig Boltzmann Institute for Digital Health and Prevention in Salzburg (Austria) conducted the laboratory and field testing. A detailed description of the study design, the inclusion criteria, and the recruitment process is provided elsewhere [44].
The study was performed in accordance with the Declaration of Helsinki and its latest amendments and was approved by the Ethical Committee of the State of Salzburg (EK-Nr.:1090/2020) and the Ethics Committee of the Faculty of Medicine of the Technical University of Munich (527/20S). The present project was registered at ClinicalTrials.gov (NCT05226806). All participants provided written informed consent before their study participation.

2.2. Walking Test Settings

After medical examinations, all participants performed a stepwise incremental walking test on the treadmill (h/p/cosmos Sports & Medical GmbH, Nussdorf-Traunstein, Germany) using the modified Bruce protocol [46] (Table 1) until physical exertion. The Bruce protocol is a treadmill test, where both speed and incline is increased every three minutes. The modified Bruce protocol includes two additional stages as a warm-up (stage one and two with 2.7 km·h−1 and 0% incline, respectively 5% incline) in addition to the original Bruce protocol. The participants were instructed to walk as long and fast as possible without running. The treadmill was stopped if participants reached maximal exhaustion or started running. BRPE was recorded at each stage. Maximal exhaustion was assumed when the participants achieved at least two of the following four criteria [47,48]:
(1)
Maximal Borg value of at least 18 (Borgmax ≥ 18);
(2)
Respiratory exchange ratio of at least 1.1 (RER ≥ 1.1);
(3)
Maximal heart rate of at least 85% of the age-predicted HRmax using the equation: 220–age (HRmax ≥ 85%);
(4)
Leveling-off oxygen consumption despite an increasing workload, increase in O2 ≤ 150 mL·min−1.
A day after the laboratory testing, all participants performed a submaximal 1 km CTT outdoors either in Aschau im Chiemgau (Germany) or in Werfenweng (Austria) controlled by the 6–20 BRPE scale (Table 2). The 1 km CTT was an uphill outdoor walking test at moderate altitude (<3000 m) [49] with a maximum incline of 26% [45]. Participants were instructed to reach a submaximal effort with a maximum value of 15 (“hard”) on the Borg’s scale throughout the entire 1 km CTT. At the end of the 1 km CTT, the participants were asked to rate their maximal BRPE (BRPEmax) during the test. The CTT was postponed in adverse weather conditions, e.g., at temperatures above 26 degrees, to avoid the influence of environmental-related risk factors [44,50,51].

2.3. Exercise Intensity Measurements

During indoor and outdoor testing HR was measured using a Garmin HRM-Dual chest strap (Garmin, Olathe, KS, USA), and V̇O2 was measured using a portable spirometry device (K5, COSMED Deutschland GmbH, Fridolfing, Germany) in dynamic mixing chamber mode (DMC) [53] to objectively determine exercise intensity. BRPE was assessed to determine the subjective exercise intensity of the participants during the two test settings (indoors and outdoors). Before starting the walking test on the treadmill, BRPE 6–20 scale [54] was explained in detail to each subject by the study staff. Participants were asked to assess their BRPE on the scale at the end of every stage of the modified Bruce protocol (every third minute) and the end of the exercise test. In the 1 km CTT, the exercise intensity was rated by the BRPE scale, with a target value of 15/20. The study team continuously showed the scale to the participants to ensure submaximal intensity during the 1 km CTT. At the end of the test, the maximal BRPE was documented.

2.4. Statistical Analysis

The statistical analyses were performed using the software IBM SPSS Statistics version 28 (SPSS, Inc., Chicago, IL, USA), and p values < 0.05 (two-sided) were considered statistically significant. Data were corrected by identifying errors or outliers. For further statistical analysis, due to the DMC mode, V̇O2 values were taken 30 s after each stage change. HR and Borg values were noted at the end of each stage. All variables were tested for normal distribution by using the Kolmogorov–Smirnov test. For the descriptive analyses, means and standard deviations [SD] for normal distribution and medians and interquartile ranges [IQR, 25th–75th percentiles] for non-normal distribution were reported. Data are expressed as the mean ± SD or median + IQR. The statistical significance of the means of the descriptive results of men and women was tested by Student’s t-tests for normally distributed data or Mann–Whitney U tests for non-normally distributed data. Linear regression analysis models were performed for all BRPE values and the corresponding HRs and V̇O2 values in the laboratory. It was confirmed that the assumptions of linear regression models held. The adjusted coefficient of determination (adjusted r2) was used to illustrate the goodness of fit. Correlations were calculated with Spearman’s correlation (Spearman’s rho, ρ) for the treadmill walking testing and the 1 km CTT if at least one variable was non-parametric. The cut-off points for the interpretation of the strength of the correlations were reported by Hopkins [55].

3. Results

Characteristics of the participants are presented in Table 3. In total, 27.6% (n = 37, men = 25, women = 12), and 3.7% (n = 5, men = 3, women = 2) of them had a body mass index (BMI) of 25–30 kg/m2, and 30–35 kg/m2, respectively. On average, women had a significantly lower BMI than men, p < 0.001.

3.1. HR, V̇O2, and BRPE Measurements during the Walking Tests

All participants fulfilled at least two out of our four criteria of maximal exhaustion. The performance parameters are presented in Table 4. The total cohort (TC) achieved a mean relative V̇O2max of 39.3 ± 7.7 mL·min−1·kg−1 during treadmill walking testing and a mean relative V̇O2peak of 37.3 ± 6.3 mL·min−1·kg−1 in the submaximal 1 km CTT. Male participants [median age: 56 years (IQR 52–62)] showed a mean relative V̇O2max of 42.8 ± 8.6 mL·min−1·kg−1 in the treadmill walking test and female participants [median age: 57 (IQR 51–63)] showed a mean relative V̇O2max of 36.6 ± 5.8 mL·min−1·kg−1. During both the treadmill and 1 km CTT testing, women had significantly lower cardiorespiratory fitness than men (p < 0.001).
Women showed significantly higher HRpeak during the submaximal 1 km CTT than men (p < 0.01). During both test settings, male participants had significantly higher maximal walking speeds than women (p < 0.001 on the treadmill, and p < 0.05 outdoors).
At the end of the walking test on the treadmill, seven participants (5.2%) reported a BRPEmax value of 20/20 on the Borg 6–20 scale. Most of the participants (n = 98, 73.1%) reported a BRPEmax value between 17/20 and 19/20. Twenty-nine participants (21.6%) reported a BRPEmax value between 14/20 and 16/20.
At the end of the submaximal 1 km CTT, 98 participants (71.8%) reported a BRPEpeak value between 14/20 and 16/20, 6 participants (4.4%) a value between 11/20 and 13/20, 27 participants (20.1%) a value of 17/20, and 3 participants (2.2%) a value of 18/20. BRPE was not influenced by gender (p = 0.913 on the treadmill, p = 0.790 in the 1 km CTT).

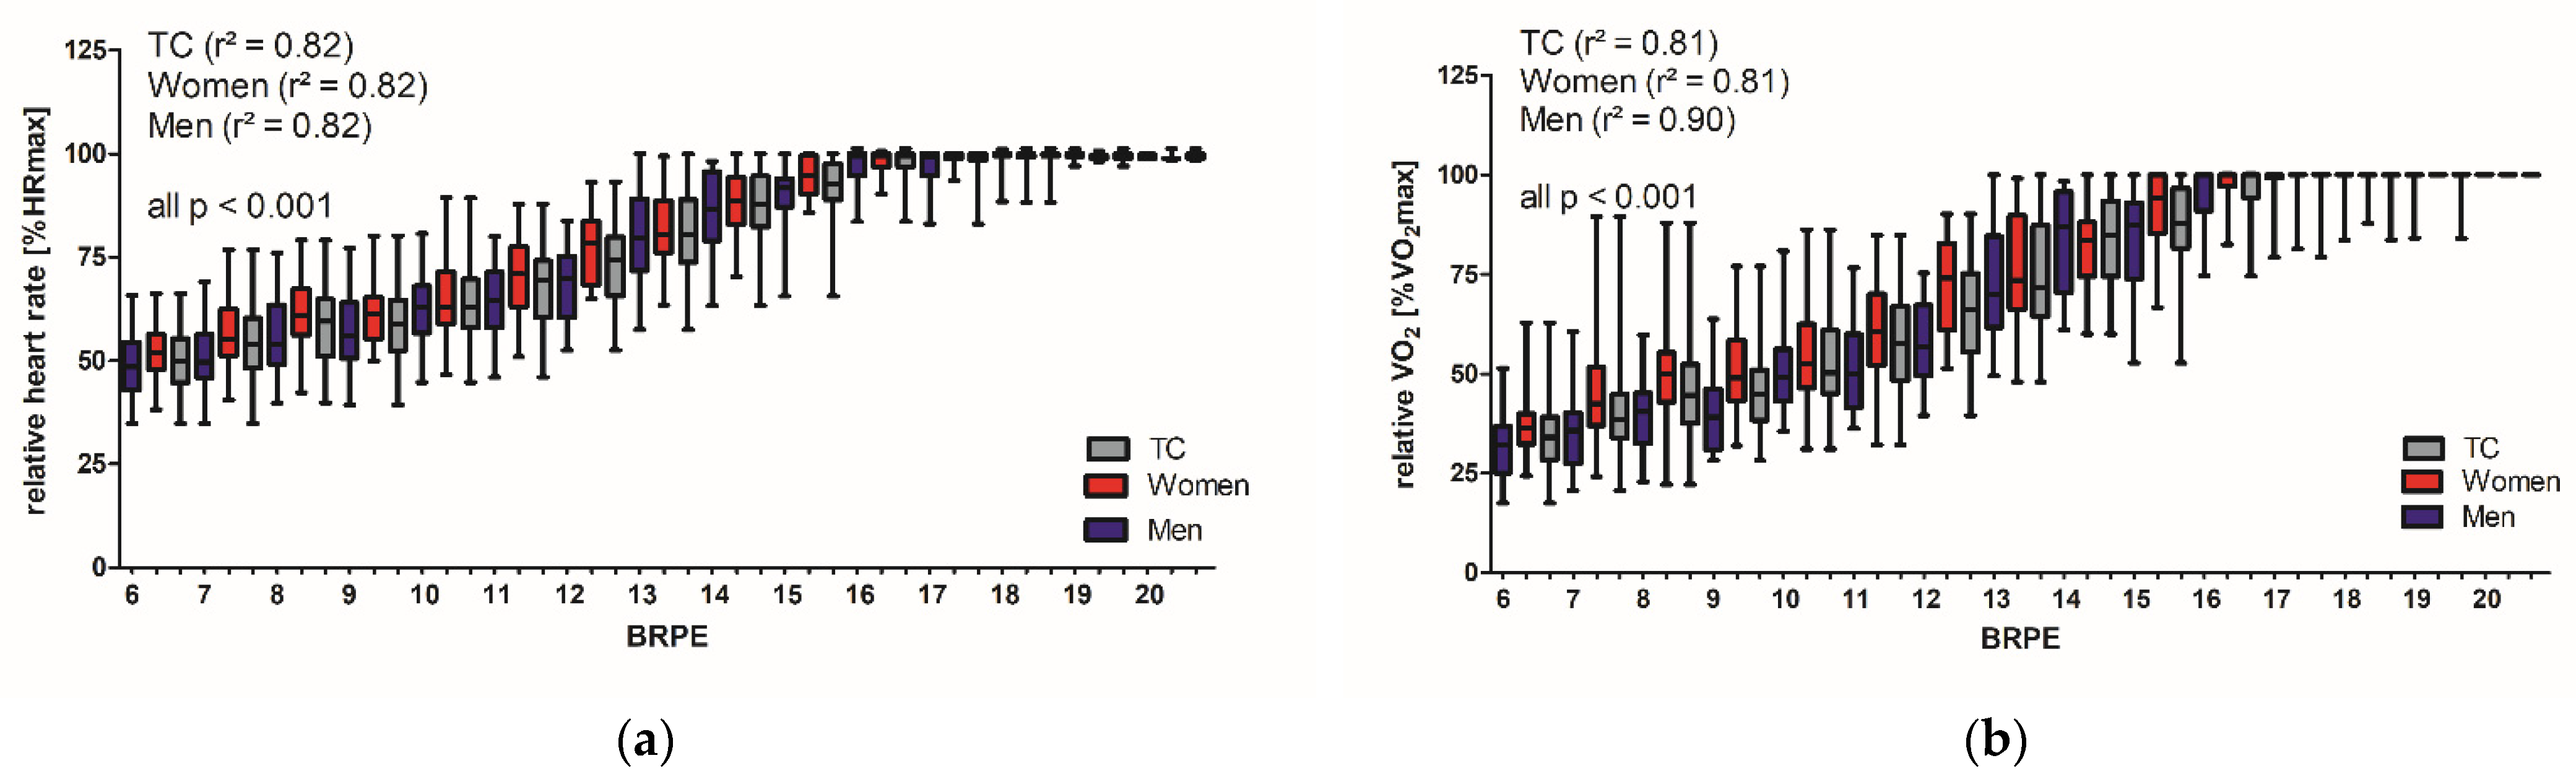
3.2. BRPE in Relation to HR and V̇O2 during the Treadmill Walking Test

During the treadmill walking test, BRPE significantly correlated with relative HR (%HRmax) (TC ρ = 0.88, men ρ = 0.88, women ρ = 0.89, all p < 0.001), as well as BRPE and relative V̇O2 (%V̇O2max) (TC ρ = 0.89, men ρ = 0.90, women ρ = 0.89 p < 0.001) at any given step (Figure 1).
For the estimation of physiological measures of exercise intensity, the cohort was divided into the sexes. Estimates for relative HR at each BRPE can be calculated according to the equation HRmen [%] = 20.85 + 4.35 x BRPE (adjusted r2 = 0.82, p < 0.001) and HRwomen [%] = 27.11 + 4.13 × BRPE (adjusted r2 = 0.82, p < 0.001). Relative V̇O2 at each BRPE can be estimated according to the equation V̇O2men [%] = −6.82 + 5.87 x BRPE (adjusted r2 = 0.90, p < 0.001) and V̇O2women [%] = 4.78 + 5.40 × BRPE (adjusted r2 = 0.81, p < 0.001). Significant differences between the regression equations for men and women were found (p < 0.001).

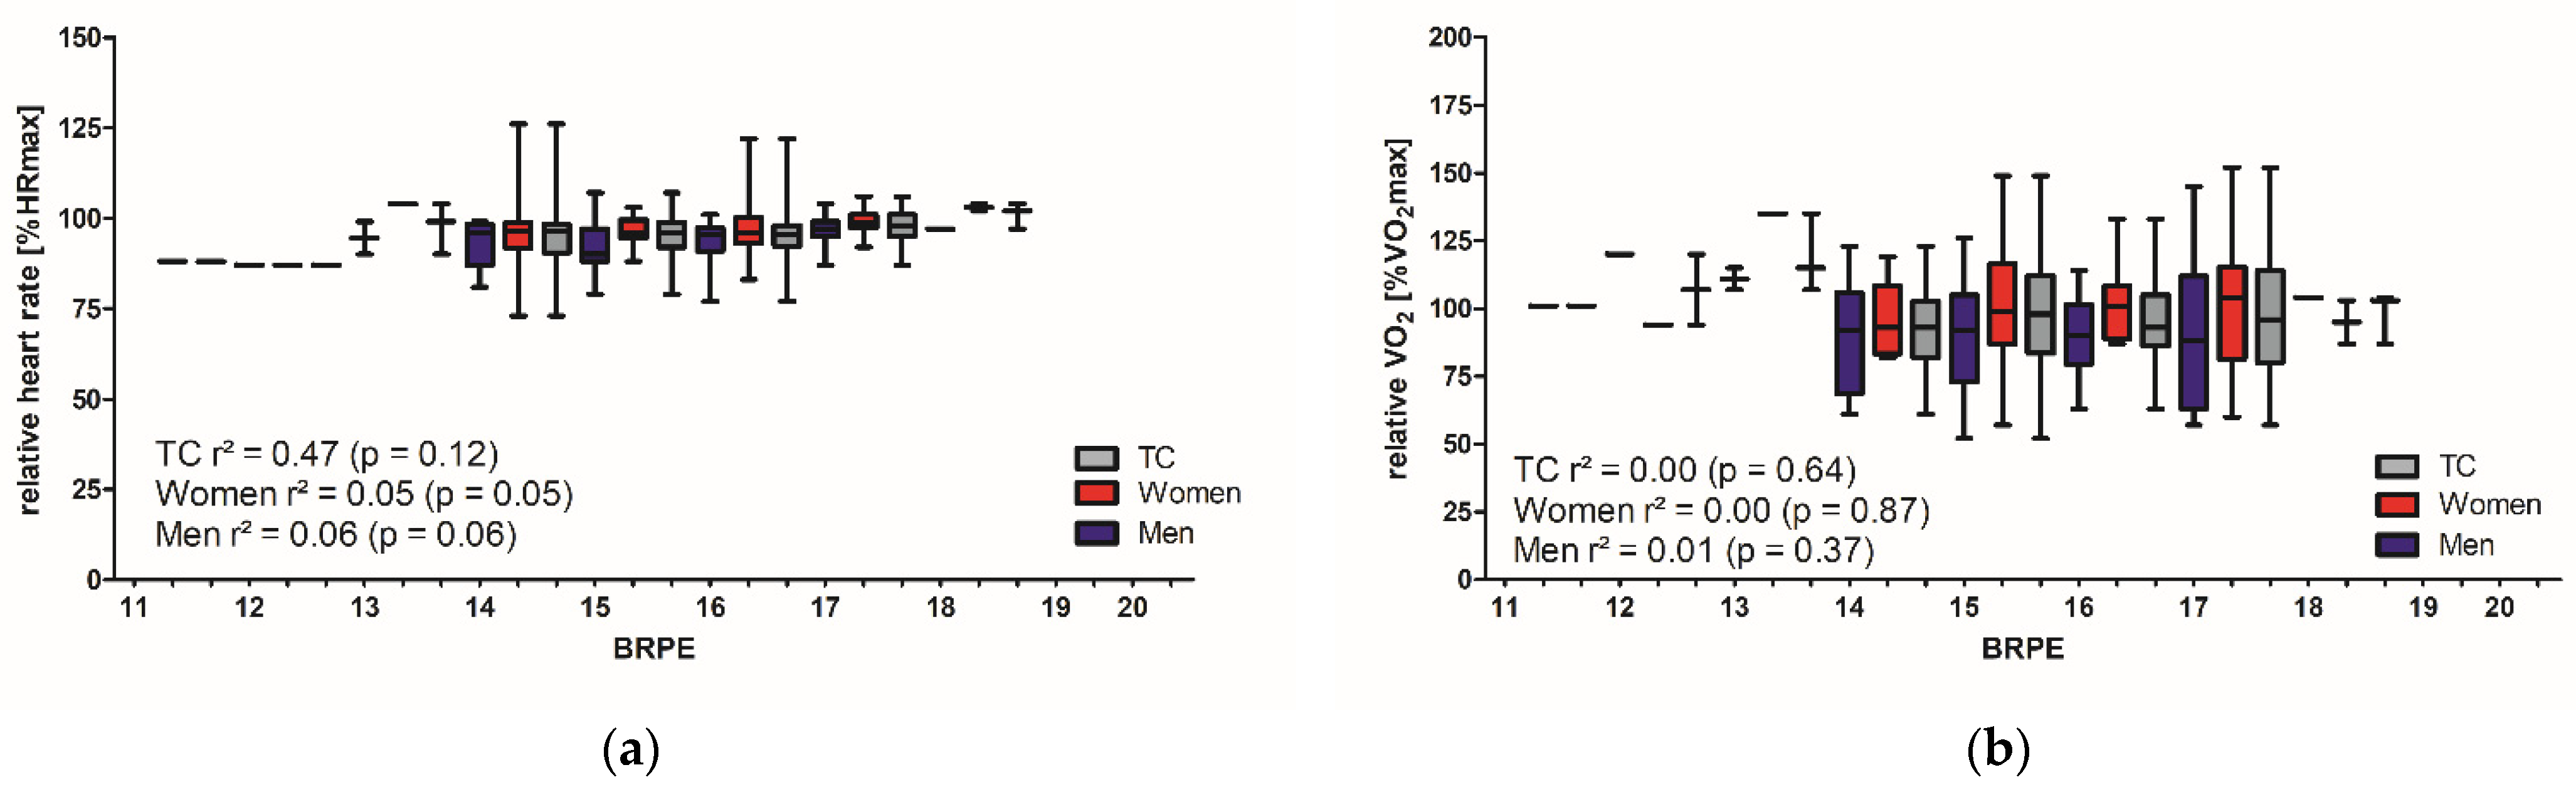
3.3. BRPE in Relation to HR and V̇O2 during the 1 km CTT

During the 1 km CTT, only a small correlation was observed between BRPEmax and %HRmax (TC ρ = 0.24, p < 0.01; men ρ = 0.26, p < 0.05; women ρ = 0.26, p < 0.05), respectively %V̇O2max (TC ρ = 0.24, p < 0.01; men ρ = 0.30, p < 0.05). No significant correlation was found for the %V̇O2max for women (Figure 2).

4. Discussion

This is the first study investigating the relationship between BRPE and objective measures of exercise intensity during uphill walking on the treadmill and in a natural environment.
The participants represent a healthy and fit study group. Male participants showed a mean relative V̇O2max of 42.8 ± 8.6 mL·min−1·kg−1 during the treadmill walking testing and according to the American College of Sports Medicine’s (ASCM) guidelines for exercise testing and prescription corresponds with an excellent fitness level [56]. Female participants showed a mean relative V̇O2max of 36.6 ± 5.8 mL·min−1·kg−1 and according to the ASCM guidelines corresponds with a superior fitness level. The present work demonstrated a high validity of the study group in assessing their perceived exertion during a graded walking test in the laboratory. During exercise interventions, it is important that individuals are capable of complying with the given exercise prescriptions and therefore of adhering independently to exercise intensities [43,57,58,59]. However, BRPE assessment was less valid during uphill walking in a natural environment. Even if the influence of exercise experience should not be underestimated, several studies [60,61,62] showed that trained and untrained people assess their intensity during training comparably well, regardless of age. Therefore, our findings with fit and healthy adults can also be assigned to healthy adults with a lower fitness level than the participants in our study.
Since HR is a valid and easy way to measure relative exercise intensity, many researchers examined the correlations between BRPE and HR to assess the criterion validity of BRPE. So far, most of the studies have investigated the relationships between subjective and objective measures of exercise intensity during cycling or running indoors. They showed high correlations between BRPE and HR, blood lactate, and/or V̇O2 [21,22,23,25]. Only a few studies have investigated the comparison of subjectively assessed BRPE values and objective measures during walking indoors [63,64,65] showing lower correlations between HR and BRPE than our results. None of the studies examined the correlations during uphill walking or hiking in nature. Investigations were only rarely carried out both in the laboratory and in the field [66,67,68]. No study used uphill walking as an exercise mode in their research. Ceci and Hassmén [67] investigated the comparison of running on a treadmill and an outdoor track with physically active men. They used a BRPE production protocol, where participants were asked to regulate their exertion related to BRPE of 11, 13, and 15. The study also showed lower correlations between HR and BRPE on the outdoor track compared to their treadmill running test. Furthermore, they suspected the influence of the environment on BRPE levels.
On a bicycle ergometer, Borg [17] found among the significant correlations the highest correlation value between BRPE and HR among teenagers (r = 0.70 to 0.90) and the lowest correlation value among 50 to 68 years old active men (r = 0.60). However, the present work showed a stronger correlation for HR and BRPE with r = 0.88 (p < 0.001) in elderly adults [median age of 56 years (IQR 52–63)] during uphill walking on a treadmill. With a comparable age group, the study of Miller, Bell, Collis and Hoshizaki [63] examined 202 post-50-year-old adults in a timed 600 m walk and a 2 min on-the-spot walk. They showed lower correlations between BRPE and HR (r = 0.25 to r = 048, p < 0.05). A meta-analysis by Chen, Fan, and Moe [23] demonstrated a mean validity coefficient of 0.62 for HR and BRPE (n = 3708) and 0.67 for %V̇O2max and BRPE (n = 549). The very high correlation between BRPE and relative HR on the treadmill walking test in our study indicates a high validity of the predictive value of the objective measures of exercise intensity (HR and V̇O2) as a function of BRPE during the treadmill walking test (Figure 1). Our regression analysis explained 81% of the variance in %HRmax and %V̇O2max with BRPE during the treadmill walking test. Compared to our results, Scherr, Wolfarth, Christle, Pressler, Wagenpfeil, and Halle [21] explained 55% of the variance in HR with BRPE. In our study, BRPE was not influenced by gender, which supports previous findings [21,69,70].
Several studies have already investigated and demonstrated the influence of nature on subjective perception. Krinski, Machado, Lirani, DaSilva, Costa, Hardcastle, and Elsangedy [68] reported lower ratings of perceived exertion during outdoor exercise in women with obesity. The environmental setting when walking outdoors has influenced BRPE. Participants of our study have shown nearly the same maximal respiratory exchange ratio (RERmax) during the treadmill walking test and the 1 km CTT (Table 3), while they rated their subjectively perceived exertion lower in the 1 km CTT. This result indicates an existing influence of the natural environment on BRPE. In the literature, it is indicated that perceived pleasure while exercising with self-selected intensity plays an important role in being physically active [71,72,73]. Additionally, it has been repeatedly reported that people tend to walk faster outside than on the treadmill [74,75,76,77], which we have also confirmed with our results. Dasilva, Guidetti, Buzzachera, Elsangedy, Krinski, De Campos, Goss, and Baldari [77] approved the influence of the environment on walking at a self-selected pace. Given that when exercising outdoors, people tend to underestimate their exercise intensity, not so much in healthy subjects, but certainly, in patients, this has to be accounted for when prescribing exercise training outdoors. For preventive measures outdoors, such as the 1 km CTT, which requires a self-selected speed, we recommend a lower specification of the subjective assessment of exercise intensity be made to represent an essential safety measure. Moreover, adding sensor-based, objective exercise-intensity parameters such as HR holds promise to improve intensity prescription and health safety during uphill walking in a natural environment.
In summary, BRPE is a valid tool for healthy adults to monitor and prescribe exercise intensity in a laboratory setting. It should be determined whether our findings can be observed in a patient population. Our results support the use of BRPE in laboratory exercise tests with a healthy population. The influence of a natural environment on BRPE needs to be considered in future exercise interventions. For accurate intensity guidance, BRPE should be used in addition to HR monitoring in public health practice. Furthermore, future research is recommended for a detailed description of the relationship between subjective and objective measures of exercise intensity in an outdoor setting, also with regard to high altitudes (>3000 m).

4.1. Study Limitations

The current study has certain limitations. First, the participants of the study were all healthy without any known chronic disease. Additionally, they had a very good endurance capacity. Transferring our results from healthy adults to people with CDV risk factors or chronic diseases must be done with caution. Moreover, we identified large SD for HR and V̇O2 (Figure 1 and Figure 2), but according to further investigations, the standard error of the mean was quite small, demonstrating high accuracy of the estimated measures.

4.2. Perspective

The present work supports the BRPE scale as a useful tool for healthy adults to estimate and monitor their exercise intensity in the laboratory during a standardized graded walking test on the treadmill. Therefore, BRPE is a valid tool for prescribing exercise intensities during treadmill uphill walking indoors such as used in gyms or rehabilitation centers. However, during outside uphill walking lower Borg values should be recommended to achieve the right exercise intensity, especially for inactive or inexperienced people.

5. Conclusions

This is the first study investigating the relationships between the BRPE 6–20 scale and exercise intensity–assessed by heart rate and oxygen consumption–both during treadmill testing as well as during outdoor uphill walking. The present work demonstrated the value of using BRPE scales for the prescription of exercise intensity during uphill walking through subjective control of physical performance among healthy adults. This work identified a very high correlation between subjective and objective parameters of exercise intensity in the laboratory, where standardized protocols are used. A natural environment reduced criterion validity of BRPE during uphill walking and needs to be further investigated, especially in CVD patients with increased risk for adverse events.

Author Contributions

Conceptualization, L.E., B.M., M.B., A.M., M.S., R.O.-F., J.N. and B.B.; methodology, L.E., B.M., C.K. and B.B; software, L.E., B.M., C.K. and B.B.; validation, L.E.; formal analysis, L.E., B.M., C.K. and B.B.; investigation, L.E., B.M., M.B., A.M., I.J., M.S. and B.B.; resources, R.O.-F. and J.N.; data curation, L.E., B.M., C.K. and B.B.; writing—original draft preparation, L.E.; writing—review and editing, B.M., V.V., C.K., M.S., J.N. and B.B.; visualization, L.E.; supervision, M.S., R.O.-F., J.N. and B.B.; project administration, B.B.; funding acquisition, B.B. All authors have read and agreed to the published version of the manuscript.

Funding

This study was funded by the European Regional Development Fund, INTERREG V-A Program Austria-Bavaria 2014–2020 (Project AB296).

Institutional Review Board Statement

The study was performed in accordance with the Declaration of Helsinki and its current amendments and was approved by the Ethical Committee of the State of Salzburg (EK-Nr.:1090/2020) and the Ethics Committee of the Faculty of Medicine of the Technical University of Munich (527/20S). The present project was registered at ClinicalTrials.gov (NCT05226806).

Informed Consent Statement

Informed consent was obtained from all subjects involved in the study.

Data Availability Statement

The data presented in this study are available on request from the corresponding author.

Conflicts of Interest

The authors declare no conflict of interest.

Abbreviations

%HRmaxRelative maximal heart rate
%V̇O2maxRelative maximal oxygen consumption
CPETCardiopulmonary exercise testing
CRFCardiorespiratory fitness
CTTCardio-trekking test
CVDCardiovascular disease
HRHeart rate
HRmaxMaximal heart rate
PAPhysical activity
RERRespiratory exchange ratio
RERmaxMaximal respiratory exchange ratio
BRPEBorg’s rating of perceived exertion
BRPEmaxMaximal value of Borg’s rating of perceived exertion
TCTotal cohort
V̇O2Oxygen consumption
V̇O2maxMaximal oxygen consumption (treadmill)
V̇O2peakPeak oxygen consumption (1 km CTT)

References

  1. Fletcher, G.F.; Ades, P.A.; Kligfield, P.; Arena, R.; Balady, G.J.; Bittner, V.A.; Coke, L.A.; Fleg, J.L.; Forman, D.E.; Gerber, T.C.; et al. Exercise Standards for Testing and Training. Circulation 2013, 128, 873–934. [Google Scholar] [CrossRef] [PubMed]
  2. Roth, G.A.; Mensah, G.A.; Johnson, C.O.; Addolorato, G.; Ammirati, E.; Baddour, L.M.; Barengo, N.C.; Beaton, A.Z.; Benjamin, E.J.; Benziger, C.P.; et al. Global Burden of Cardiovascular Diseases and Risk Factors, 1990–2019: Update From the GBD 2019 Study. J. Am. Coll. Cardiol. 2020, 76, 2982–3021. [Google Scholar] [CrossRef] [PubMed]
  3. Fletcher, G.F.; Landolfo, C.; Niebauer, J.; Ozemek, C.; Arena, R.; Lavie, C.J. Promoting Physical Activity and Exercise. J. Am. Coll. Cardiol. 2018, 72, 1622–1639. [Google Scholar] [CrossRef]
  4. World Health Organization. Global Action Plan on Physical Activity 2018–2030: More Active People for Healthier World; World Health Organization Stylus Publishing: Geneva, Switzerland; LLC [Distributor]: Herndon, VA, USA, 2019; p. 101. [Google Scholar]
  5. Visseren, F.L.J.; Mach, F.; Smulders, Y.M.; Carballo, D.; Koskinas, K.C.; Bäck, M.; Benetos, A.; Biffi, A.; Boavida, J.-M.; Capodanno, D.; et al. 2021 ESC guidelines on cardiovascular disease prevention in clinical practice. Eur. Heart J. 2021, 42, 3227–3337. [Google Scholar] [CrossRef] [PubMed]
  6. Arnett, D.K.; Blumenthal, R.S.; Albert, M.A.; Buroker, A.B.; Goldberger, Z.D.; Hahn, E.J.; Himmelfarb, C.D.; Khera, A.; Lloyd-Jones, D.; McEvoy, J.W.; et al. 2019 ACC/AHA Guideline on the Primary Prevention of Cardiovascular Disease: A Report of the American College of Cardiology/American Heart Association Task Force on Clinical Practice Guidelines. Circulation 2019, 140, e596–e646. [Google Scholar] [CrossRef]
  7. World Health Organization. WHO Guidelines on Physical Activity and Sedentary Behaviour: Web Annex: Evidence Profiles; World Health Organization: Geneva, Switzerland, 2020. [Google Scholar]
  8. Harber, M.P.; Kaminsky, L.A.; Arena, R.; Blair, S.N.; Franklin, B.A.; Myers, J.; Ross, R. Impact of Cardiorespiratory Fitness on All-Cause and Disease-Specific Mortality: Advances Since 2009. Prog. Cardiovasc. Dis. 2017, 60, 11–20. [Google Scholar] [CrossRef]
  9. Vuori, I.M.; Lavie, C.J.; Blair, S.N. Physical Activity Promotion in the Health Care System. Mayo Clin. Proc. 2013, 88, 1446–1461. [Google Scholar] [CrossRef] [Green Version]
  10. Wisloff, U.; Lavie, C.J. Taking Physical Activity, Exercise, and Fitness to a Higher Level. Prog. Cardiovasc. Dis. 2017, 60, 1–2. [Google Scholar] [CrossRef] [PubMed]
  11. Albouaini, K.; Egred, M.; Alahmar, A.; Wright, D.J. Cardiopulmonary exercise testing and its application. Postgrad. Med. J. 2007, 83, 675–682. [Google Scholar] [CrossRef] [Green Version]
  12. Balady, G.J.; Arena, R.; Sietsema, K.; Myers, J.; Coke, L.; Fletcher, G.F.; Forman, D.; Franklin, B.; Guazzi, M.; Gulati, M.; et al. Clinician’s Guide to Cardiopulmonary Exercise Testing in Adults. Circulation 2010, 122, 191–225. [Google Scholar] [CrossRef] [PubMed]
  13. Arena, R.; Myers, J.; Williams, M.A.; Gulati, M.; Kligfield, P.; Balady, G.J.; Collins, E.; Fletcher, G. Assessment of Functional Capacity in Clinical and Research Settings. Circulation 2007, 116, 329–343. [Google Scholar] [CrossRef] [PubMed]
  14. Borg, G.; Dahlstrom, H. A pilot study of perceived exertion and physical working capacity. Acta Soc. Med. Ups. 1962, 67, 21–27. [Google Scholar] [PubMed]
  15. Borg, G.; Linderholm, H. Perceived Exertion and Pulse Rate during Graded Exercise in Various Age Groups. Acta Med. Scand. 1967, 181, 194–206. [Google Scholar] [CrossRef]
  16. Borg, G.A. Perceived exertion: A note on “history” and methods. Med. Sci. Sports Exerc. 1973, 5, 90–93. [Google Scholar] [CrossRef]
  17. Borg, G. Borg’s Perceived Exertion and Pain Scales; Human Kinetics: Champaign, IL, USA, 1998. [Google Scholar]
  18. Hulteen, R.M.; Smith, J.J.; Morgan, P.J.; Barnett, L.M.; Hallal, P.C.; Colyvas, K.; Lubans, D.R. Global participation in sport and leisure-time physical activities: A systematic review and meta-analysis. Prev. Med. 2017, 95, 14–25. [Google Scholar] [CrossRef]
  19. Ciolac, E.G.; Mantuani, S.S.; Neiva, C.M.; Verardi, C.; Pessôa-Filho, D.M.; Pimenta, L. Rating of perceived exertion as a tool for prescribing and self regulating interval training: A pilot study. Biol. Sport 2015, 32, 103–108. [Google Scholar] [CrossRef] [Green Version]
  20. Dunbar, C.C.; Robertson, R.J.; Baun, R.; Blandin, M.F.; Metz, K.; Burdett, R.; Goss, F.L. The validity of regulating exercise intensity by ratings of perceived exertion. Med. Sci. Sports Exerc. 1992, 24, 94–99. [Google Scholar] [CrossRef]
  21. Scherr, J.; Wolfarth, B.; Christle, J.W.; Pressler, A.; Wagenpfeil, S.; Halle, M. Associations between Borg’s rating of perceived exertion and physiological measures of exercise intensity. Eur. J. Appl. Physiol. 2013, 113, 147–155. [Google Scholar] [CrossRef] [PubMed]
  22. Bar-or, O.; Skinner, J.S.; Buskirk, E.R.; Borg, G.A.V. Physiological and perceptual indicators of physical stress in 41-to 60-year-old men who vary in conditioning level and in body fatness. Med. Sci. Sports Exerc. 1972, 4, 96–100. [Google Scholar] [CrossRef]
  23. Chen, M.J.; Fan, X.; Moe, S.T. Criterion-related validity of the Borg ratings of perceived exertion scale in healthy individuals: A meta-analysis. J. Sports Sci. 2002, 20, 873–899. [Google Scholar] [CrossRef] [PubMed]
  24. Eston, R.; Davies, B.; Williams, J. Use of perceived effort ratings to control exercise intensity in young healthy adults. Eur. J. Appl. Physiol. Occup. Physiol. 1987, 56, 222–224. [Google Scholar] [CrossRef] [PubMed]
  25. Shigematsu, R.; Ueno, L.M.; Nakagaichi, M.; Nho, H.; Tanaka, K. Rate of Perceived Exertion as a Tool to Monitor Cycling Exercise Intensity in Older Adults. J. Aging Phys. Act. 2004, 12, 3–9. [Google Scholar] [CrossRef] [PubMed] [Green Version]
  26. Shi Uk, L.; Tai Ryoon, H. Study on Usefulness of RPE Scale for the Prescription of Exercise Intensity. J. Korean Acad. Rehabil. Med. 1997, 21, 1167–1174. [Google Scholar]
  27. Physical activity and cardiovascular health. NIH Consensus Development Panel on Physical Activity and Cardiovascular Health. JAMA 1996, 276, 241–246. [Google Scholar] [CrossRef] [Green Version]
  28. Wannamethee, S.G.; Shaper, A.G. Physical Activity in the Prevention of Cardiovascular Disease. Sports Med. 2001, 31, 101–114. [Google Scholar] [CrossRef] [PubMed]
  29. Murtagh, E.M.; Murphy, M.H.; Boone-Heinonen, J. Walking: The first steps in cardiovascular disease prevention. Curr. Opin. Cardiol. 2010, 25, 490–496. [Google Scholar] [CrossRef] [Green Version]
  30. Stamatakis, E.; Kelly, P.; Strain, T.; Murtagh, E.M.; Ding, D.; Murphy, M.H. Self-rated walking pace and all-cause, cardiovascular disease and cancer mortality: Individual participant pooled analysis of 50,225 walkers from 11 population British cohorts. Br. J. Sports Med. 2018, 52, 761. [Google Scholar] [CrossRef] [PubMed] [Green Version]
  31. Johansson, M.S.; Søgaard, K.; Prescott, E.; Marott, J.L.; Schnohr, P.; Holtermann, A.; Korshøj, M. Can we walk away from cardiovascular disease risk or do we have to ‘huff and puff’? A cross-sectional compositional accelerometer data analysis among adults and older adults in the Copenhagen City Heart Study. Int. J. Behav. Nutr. Phys. Act. 2020, 17, 84. [Google Scholar] [CrossRef]
  32. Fredman, P.; Tyrväinen, L. Frontiers in nature-based tourism. Scand. J. Hosp. Tour. 2010, 10, 177–189. [Google Scholar] [CrossRef]
  33. Burtscher, M. Endurance performance of the elderly mountaineer: Requirements, limitations, testing, and training. Wien. Klin. Wochenschr. 2004, 116, 703–714. [Google Scholar] [CrossRef]
  34. Mitten, D.; Overholt, J.R.; Haynes, F.I.; D’Amore, C.C.; Ady, J.C. Hiking: A Low-Cost, Accessible Intervention to Promote Health Benefits. Am. J. Lifestyle Med. 2018, 12, 302–310. [Google Scholar] [CrossRef] [PubMed]
  35. Lloyd-Jones, D.; Adams, R.; Brown, T. Health benefits of hiking. Circulation 2010, 121, e1–e170. [Google Scholar]
  36. Noble, B.J. Clinical applications of perceived exertion. Med. Sci. Sports Exerc. 1982, 14, 406–411. [Google Scholar] [CrossRef] [PubMed]
  37. Eston, R.; Lambrick, D.; Sheppard, K.; Parfitt, G. Prediction of maximal oxygen uptake in sedentary males from a perceptually regulated, sub-maximal graded exercise test. J. Sports Sci. 2008, 26, 131–139. [Google Scholar] [CrossRef]
  38. Whaley, M.H.; Woodall, T.; Kaminsky, L.A.; Emmett, J.D. Reliability of perceived exertion during graded exercise testing in apparently healthy adults. J. Cardiopulm. Rehabil. Prev. 1997, 17, 37–42. [Google Scholar] [CrossRef] [PubMed]
  39. Groslambert, A.; Mahon, A.D. Perceived exertion: Influence of age and cognitive development. Sports Med. 2006, 36, 911–928. [Google Scholar] [CrossRef]
  40. Garnacho-Castaño, M.V.; Domínguez, R.; Muñoz González, A.; Feliu-Ruano, R.; Serra-Payá, N.; Maté-Muñoz, J.L. Exercise Prescription Using the Borg Rating of Perceived Exertion to Improve Fitness. Int. J. Sports Med. 2018, 39, 115–123. [Google Scholar] [CrossRef]
  41. Whaley, M.H.; Brubaker, P.H.; Kaminsky, L.A.; Miller, C.R. Validity of Rating of Perceived Exertion During Graded Exercise Testing in Apparently Healthy Adults and Cardiac Patients. J. Cardiopulm. Rehabil. Prev. 1997, 17, 261–267. [Google Scholar] [CrossRef] [PubMed]
  42. American College of Sports Medicine. ACSM’s Guidelines for Exercise Testing and Prescription, 11th ed.; Wolters Kluwer: Philadelphia, PA, USA, 2021. [Google Scholar]
  43. Pelliccia, A.; Sharma, S.; Gati, S.; Bäck, M.; Börjesson, M.; Caselli, S.; Collet, J.-P.; Corrado, D.; Drezner, J.A.; Halle, M.; et al. 2020 ESC Guidelines on sports cardiology and exercise in patients with cardiovascular disease: The Task Force on sports cardiology and exercise in patients with cardiovascular disease of the European Society of Cardiology (ESC). Eur. Heart J. 2020, 42, 17–96. [Google Scholar] [CrossRef]
  44. Mayr, B.; Beck, M.; Eisenberger, L.; Venek, V.; Kranzinger, C.; Menzl, A.; Reich, B.; Hornung-Prähauser, V.; Oberhoffer-Fritz, R.; Böhm, B.; et al. Valorization of Natural Cardio Trekking Trails Through Open Innovation for the Promotion of Sustainable Cross-generational Health-Oriented Tourism in the Connect2Move Project: Protocol for a Cross-sectional Study. JMIR Res. Protoc. 2022, 11, e39038. [Google Scholar] [CrossRef] [PubMed]
  45. Eisenberger, L.; Mayr, B.; Beck, M.; Venek, V.; Kranzinger, C.; Menzl, A.; Jahn, I.; Sareban, M.; Oberhoffer-Fritz, R.; Niebauer, J.; et al. Development and validation of a 1-km cardio-trekking test to estimate cardiorespiratory fitness in healthy adults. Prev. Med. Rep. 2022, 30, 102039. [Google Scholar] [CrossRef]
  46. Bruce, R.A.; Kusumi, F.; Hosmer, D. Maximal oxygen intake and nomographic assessment of functional aerobic impairment in cardiovascular disease. Am. Heart J. 1973, 85, 546–562. [Google Scholar] [CrossRef]
  47. Yang, H.i.; Cho, W.; Lee, D.H.; Suh, S.-H.; Jeon, J.Y. Development of a New Submaximal Walk Test to Predict Maximal Oxygen Consumption in Healthy Adults. Sensors 2021, 21, 5726. [Google Scholar] [CrossRef] [PubMed]
  48. Kline, G.M.; Porcari, J.P.; Hintermeister, R.; Freedson, P.S.; Ward, A.; McCarron, R.F.; Ross, J.; Rippe, J.M. Estimation of VO2max from a one-mile track walk, gender, age, and body weight. Med. Sci. Sports Exerc. 1987, 19, 253–259. [Google Scholar] [CrossRef] [PubMed]
  49. Bärtsch, P.; Saltin, B. General introduction to altitude adaptation and mountain sickness. Scand. J. Med. Sci. Sports 2008, 18 (Suppl. 1), 1–10. [Google Scholar] [CrossRef] [PubMed]
  50. Brocherie, F.; Girard, O.; Millet, G.P. Emerging Environmental and Weather Challenges in Outdoor Sports. Climate 2015, 3, 492–521. [Google Scholar] [CrossRef]
  51. Armstrong, L.E.; Casa, D.J.; Millard-Stafford, M.; Moran, D.S.; Pyne, S.W.; Roberts, W.O. American College of Sports Medicine position stand. Exertional heat illness during training and competition. Med. Sci. Sports Exerc. 2007, 39, 556–572. [Google Scholar] [CrossRef]
  52. Borg, G. Perceived exertion as an indicator of somatic stress. Scand. J. Rehabil. Med. 1970, 2, 92–98. [Google Scholar] [PubMed]
  53. Winkert, K.; Kirsten, J.; Kamnig, R.; Steinacker, J.M.; Treff, G. Differences in VO2max Measurements Between Breath-by-Breath and Mixing-Chamber Mode in the COSMED K5. Int. J. Sports Physiol. Perform. 2021, 16, 1335–1340. [Google Scholar] [CrossRef]
  54. Borg, G.A. Psychophysical bases of perceived exertion. Med. Sci. Sports Exerc. 1982, 14, 377–381. [Google Scholar] [CrossRef]
  55. Hopkins, W.G. A New View of Statistics. Available online: https://sportsci.org/resource/stats/ (accessed on 4 November 2022).
  56. Riebe, D.; Ehrman, J.K.; Liguori, G.; Magal, M. (Eds.) ACSM’s Guidelines for Exercise Testing and Prescription, 10th ed.; Wolters Kluwer: Philadelphia, PA, USA; Baltimore, MD, USA; New York, NY, USA, 2018; p. 472. [Google Scholar]
  57. Gondoni, L.A.; Nibbio, F.; Caetani, G.; Augello, G.; Titon, A.M. What are we measuring? Considerations on subjective ratings of perceived exertion in obese patients for exercise prescription in cardiac rehabilitation programs. Int. J. Cardiol. 2010, 140, 236–238. [Google Scholar] [CrossRef] [PubMed]
  58. Travlos, A.K.; Marisi, D.Q. Perceived Exertion during Physical Exercise among Individuals High and Low in Fitness. Percept. Mot. Ski. 1996, 82, 419–424. [Google Scholar] [CrossRef]
  59. Lucini, D.; Pagani, M. Exercise Prescription to Foster Health and Well-Being: A Behavioral Approach to Transform Barriers into Opportunities. Int. J. Environ. Res. Public Health 2021, 18, 968. [Google Scholar] [CrossRef] [PubMed]
  60. Winborn, M.D.; Meyers, A.W.; Mulling, C. The Effects of Gender and Experience on Perceived Exertion. J. Sport Exerc. Psychol. 1988, 10, 22–31. [Google Scholar] [CrossRef]
  61. Eston, R.; Evans, H.; Faulkner, J.; Lambrick, D.; Al-Rahamneh, H.; Parfitt, G. A perceptually regulated, graded exercise test predicts peak oxygen uptake during treadmill exercise in active and sedentary participants. Eur. J. Appl. Physiol. 2012, 112, 3459–3468. [Google Scholar] [CrossRef] [PubMed]
  62. Demello, J.J.; Cureton, K.J.; Boineau, R.E.; Singh, M.M. Ratings of perceived exertion at the lactate threshold in trained and untrained men and women. Med. Sci. Sports Exerc. 1987, 19, 354–362. [Google Scholar] [CrossRef]
  63. Miller, G.D.; Bell, R.D.; Collis, M.L.; Hoshizaki, T.B. The relationship between perceived exertion and heart rate of post 50 year-old volunteers in two different walking activites. J. Hum. Mov. Stud. 1985, 11, 187–195. [Google Scholar]
  64. Grant, S. A comparison of physiological responses and rating of perceived exertion in two modes of aerobic exercise in men and women over 50 years of age. Br. J. Sports Med. 2002, 36, 276–281. [Google Scholar] [CrossRef] [PubMed] [Green Version]
  65. Flairty, J.E.; Scheadler, C.M. Perceived and Heart Rate-based Intensities during Self-paced Walking: Magnitudes and Comparison. Int. J. Exerc. Sci. 2020, 13, 677–688. [Google Scholar] [PubMed]
  66. Hassmén, P. Environmental effects on the ratings of perceived exertion in males and females. J. Sport Behav. 1996, 19, 235. [Google Scholar]
  67. Ceci, R.; Hassmén, P. Self-monitored exercise at three different RPE intensities in treadmill vs field running. Med. Sci. Sports Exerc. 1991, 23, 732–738. [Google Scholar] [CrossRef] [PubMed]
  68. Krinski, K.; Machado, D.G.S.; Lirani, L.S.; DaSilva, S.G.; Costa, E.C.; Hardcastle, S.J.; Elsangedy, H.M. Let’s Walk Outdoors! Self-Paced Walking Outdoors Improves Future Intention to Exercise in Women With Obesity. J. Sport Exerc. Psychol. 2017, 39, 145–157. [Google Scholar] [CrossRef]
  69. Faulkner, J.; Parfitt, G.; Eston, R. Prediction of maximal oxygen uptake from the ratings of perceived exertion and heart rate during a perceptually-regulated sub-maximal exercise test in active and sedentary participants. Eur. J. Appl. Physiol. 2007, 101, 397–407. [Google Scholar] [CrossRef] [PubMed]
  70. Pincivero, D.M.; Polen, R.R.; Byrd, B.N. Gender and contraction mode on perceived exertion. Int. J. Sports Med. 2010, 31, 359–363. [Google Scholar] [CrossRef] [PubMed]
  71. Ekkekakis, P. Let them roam free? Physiological and psychological evidence for the potential of self-selected exercise intensity in public health. Sports Med. (Auckland, N.Z.) 2009, 39, 857–888. [Google Scholar] [CrossRef] [PubMed]
  72. Rose, E.A.; Parfitt, G. Can the feeling scale be used to regulate exercise intensity? Med. Sci. Sports Exerc. 2008, 40, 1852–1860. [Google Scholar] [CrossRef]
  73. Rose, E.A.; Parfitt, G. Exercise experience influences affective and motivational outcomes of prescribed and self-selected intensity exercise. Scand. J. Med. Sci. Sports 2012, 22, 265–277. [Google Scholar] [CrossRef]
  74. Marsh, A.P.; Katula, J.A.; Pacchia, C.F.; Johnson, L.C.; Koury, K.L.; Rejeski, W.J. Effect of treadmill and overground walking on function and attitudes in older adults. Med. Sci. Sports Exerc. 2006, 38, 1157–1164. [Google Scholar] [CrossRef]
  75. Parvataneni, K.; Ploeg, L.; Olney, S.J.; Brouwer, B. Kinematic, kinetic and metabolic parameters of treadmill versus overground walking in healthy older adults. Clin. Biomech. (Bristol, Avon) 2009, 24, 95–100. [Google Scholar] [CrossRef]
  76. Pearce, M.E.; Cunningham, D.A.; Donner, A.P.; Rechnitzer, P.A.; Fullerton, G.M.; Howard, J.H. Energy cost of treadmill and floor walking at self-selected paces. Eur. J. Appl. Physiol. Occup. Physiol. 1983, 52, 115–119. [Google Scholar] [CrossRef]
  77. Dasilva, S.G.; Guidetti, L.; Buzzachera, C.F.; Elsangedy, H.M.; Krinski, K.; De Campos, W.; Goss, F.L.; Baldari, C. Psychophysiological responses to self-paced treadmill and overground exercise. Med. Sci. Sports Exerc. 2011, 43, 1114–1124. [Google Scholar] [CrossRef] [PubMed]
Figure 1. Measurements of exercise intensity and BRPE on the treadmill: differences between genders. (a) Relative HR (%HRmax) and (b) relative V̇O2 (%VO2max) at different BRPE values for the total cohort (TC), women and men.
Ijerph 19 16662 g001
Figure 2. Measurements of exercise intensity and BRPE during the 1 km CTT: differences between genders. (a) Relative HR (%HRmax) and (b) relative V̇O2 (%VO2max) at different maximal BRPE values for the total cohort (TC), women and men.
Ijerph 19 16662 g002
Table 1. The modified Bruce protocol (modification of the original protocol of Bruce [46]).
Percent Grad (%)Speed (km·h−1)
Stage 102.7
Stage 252.7
Stage 3102.7
Stage 4124.0
Stage 5145.4
Stage 6166.7
Stage 7188.0
Stage 8208.8
Table 2. Borg’s 15-grade scale for ratings of perceived exertion with values ranging from 6 to 20 (modified table according to Borg [52]).
6
7Very, very light
8
9Very light
10
11Fairly light
12
13Somewhat hard
14
15Hard
16
17Very hard
18
19Very, very hard
20
Table 3. Characteristics of the study population.
Total Cohort
(n = 134)
Men
(n = 58)
Women
(n = 76)
p
Anthropometrics
Age (years)
56 [52–63]56 [52–62]57 [51–63]<0.731 1
Height (cm)171.6 [8.4]178.4 [6.9]166.5 [5.2]
Weight (kg)71.1 [13.3]80.6 [11.2]63.8 [9.8]
BMI (kg/m2)24.0 [3.4]25.3 [2.8]23.0 [3.5]<0.001 *,1
Note: Data are shown as mean (SD) for normally distributed data or median (IQR 25th–75th percentile) for non-normally distributed data. * p < 0.05; 1 Student’s t-test Abbreviations: BMI, body mass index.
Table 4. Performance parameters during the maximal laboratory testing on the treadmill and the submaximal 1 km field testing.
Total Cohort
(n = 134)
Men
(n = 58)
Women
(n = 76)
p
Exercise capacity on the treadmill
V̇O2max (mL·min−1·kg−1)39.3 [7.7]42.8 [8.6]36.6 [5.8]<0.001 *,1
HRmax (bpm)165 [14]165 [16]165 [12]0.834 1
RERmax1.1 [0.1]1.1 [0.1]1.1 [0.1]0.907 1
Borgmax18 [17–19]18 [17–19]17 [17,18]0.180 2
vmax (km·h−1)5.6 [5.0–5.9]5.8 [5.6–6.3]5.4 [4.9–5.8]<0.001 *,2
Exercise capacity in the 1 km CTT
V̇O2peak (mL·min−1·kg−1)37.3 [6.3]40.2 [6.1]35.1 [5.6]<0.001 *,1
HRpeak (bpm)157 [15]154 [15]160 [14]<0.01 *,1
RERpeak1.1 [1.0–1.2]1.1 [1.0–1.2]1.1 [1.0–1.1]0.724 2
Borgpeak15 [15,16]16 [15,16]15 [15,16]0.687 2
vpeak (km·h−1)6.4 [5.7–7.2]6.8 [5.9–7.3]6.3 [5.4–7.0]<0.05 *,2
Note: Data are shown as mean (SD) for normally distributed data or median (IQR 25th–75th percentile) for non-normally distributed data. * p < 0.05; 1 Student’s t-test; 2 Mann-Whitney U test. Abbreviations: V̇O2max, maximal oxygen uptake; HRmax, maximal heart rate; RERmax, maximal respiratory exchange ratio; Borgmax, maximal Borg value; vmax, maximal speed; V̇O2peak, peak oxygen uptake; HRpeak, peak heart rate; RERpeak, peak respiratory exchange ratio; Borgpeak, peak Borg value; vpeak, peak speed.
Publisher’s Note: MDPI stays neutral with regard to jurisdictional claims in published maps and institutional affiliations.

