
GATR: A Road Network Traffic Violation Prediction Method Based on Graph Attention Network


Abstract
:1. Introduction
2. Materials
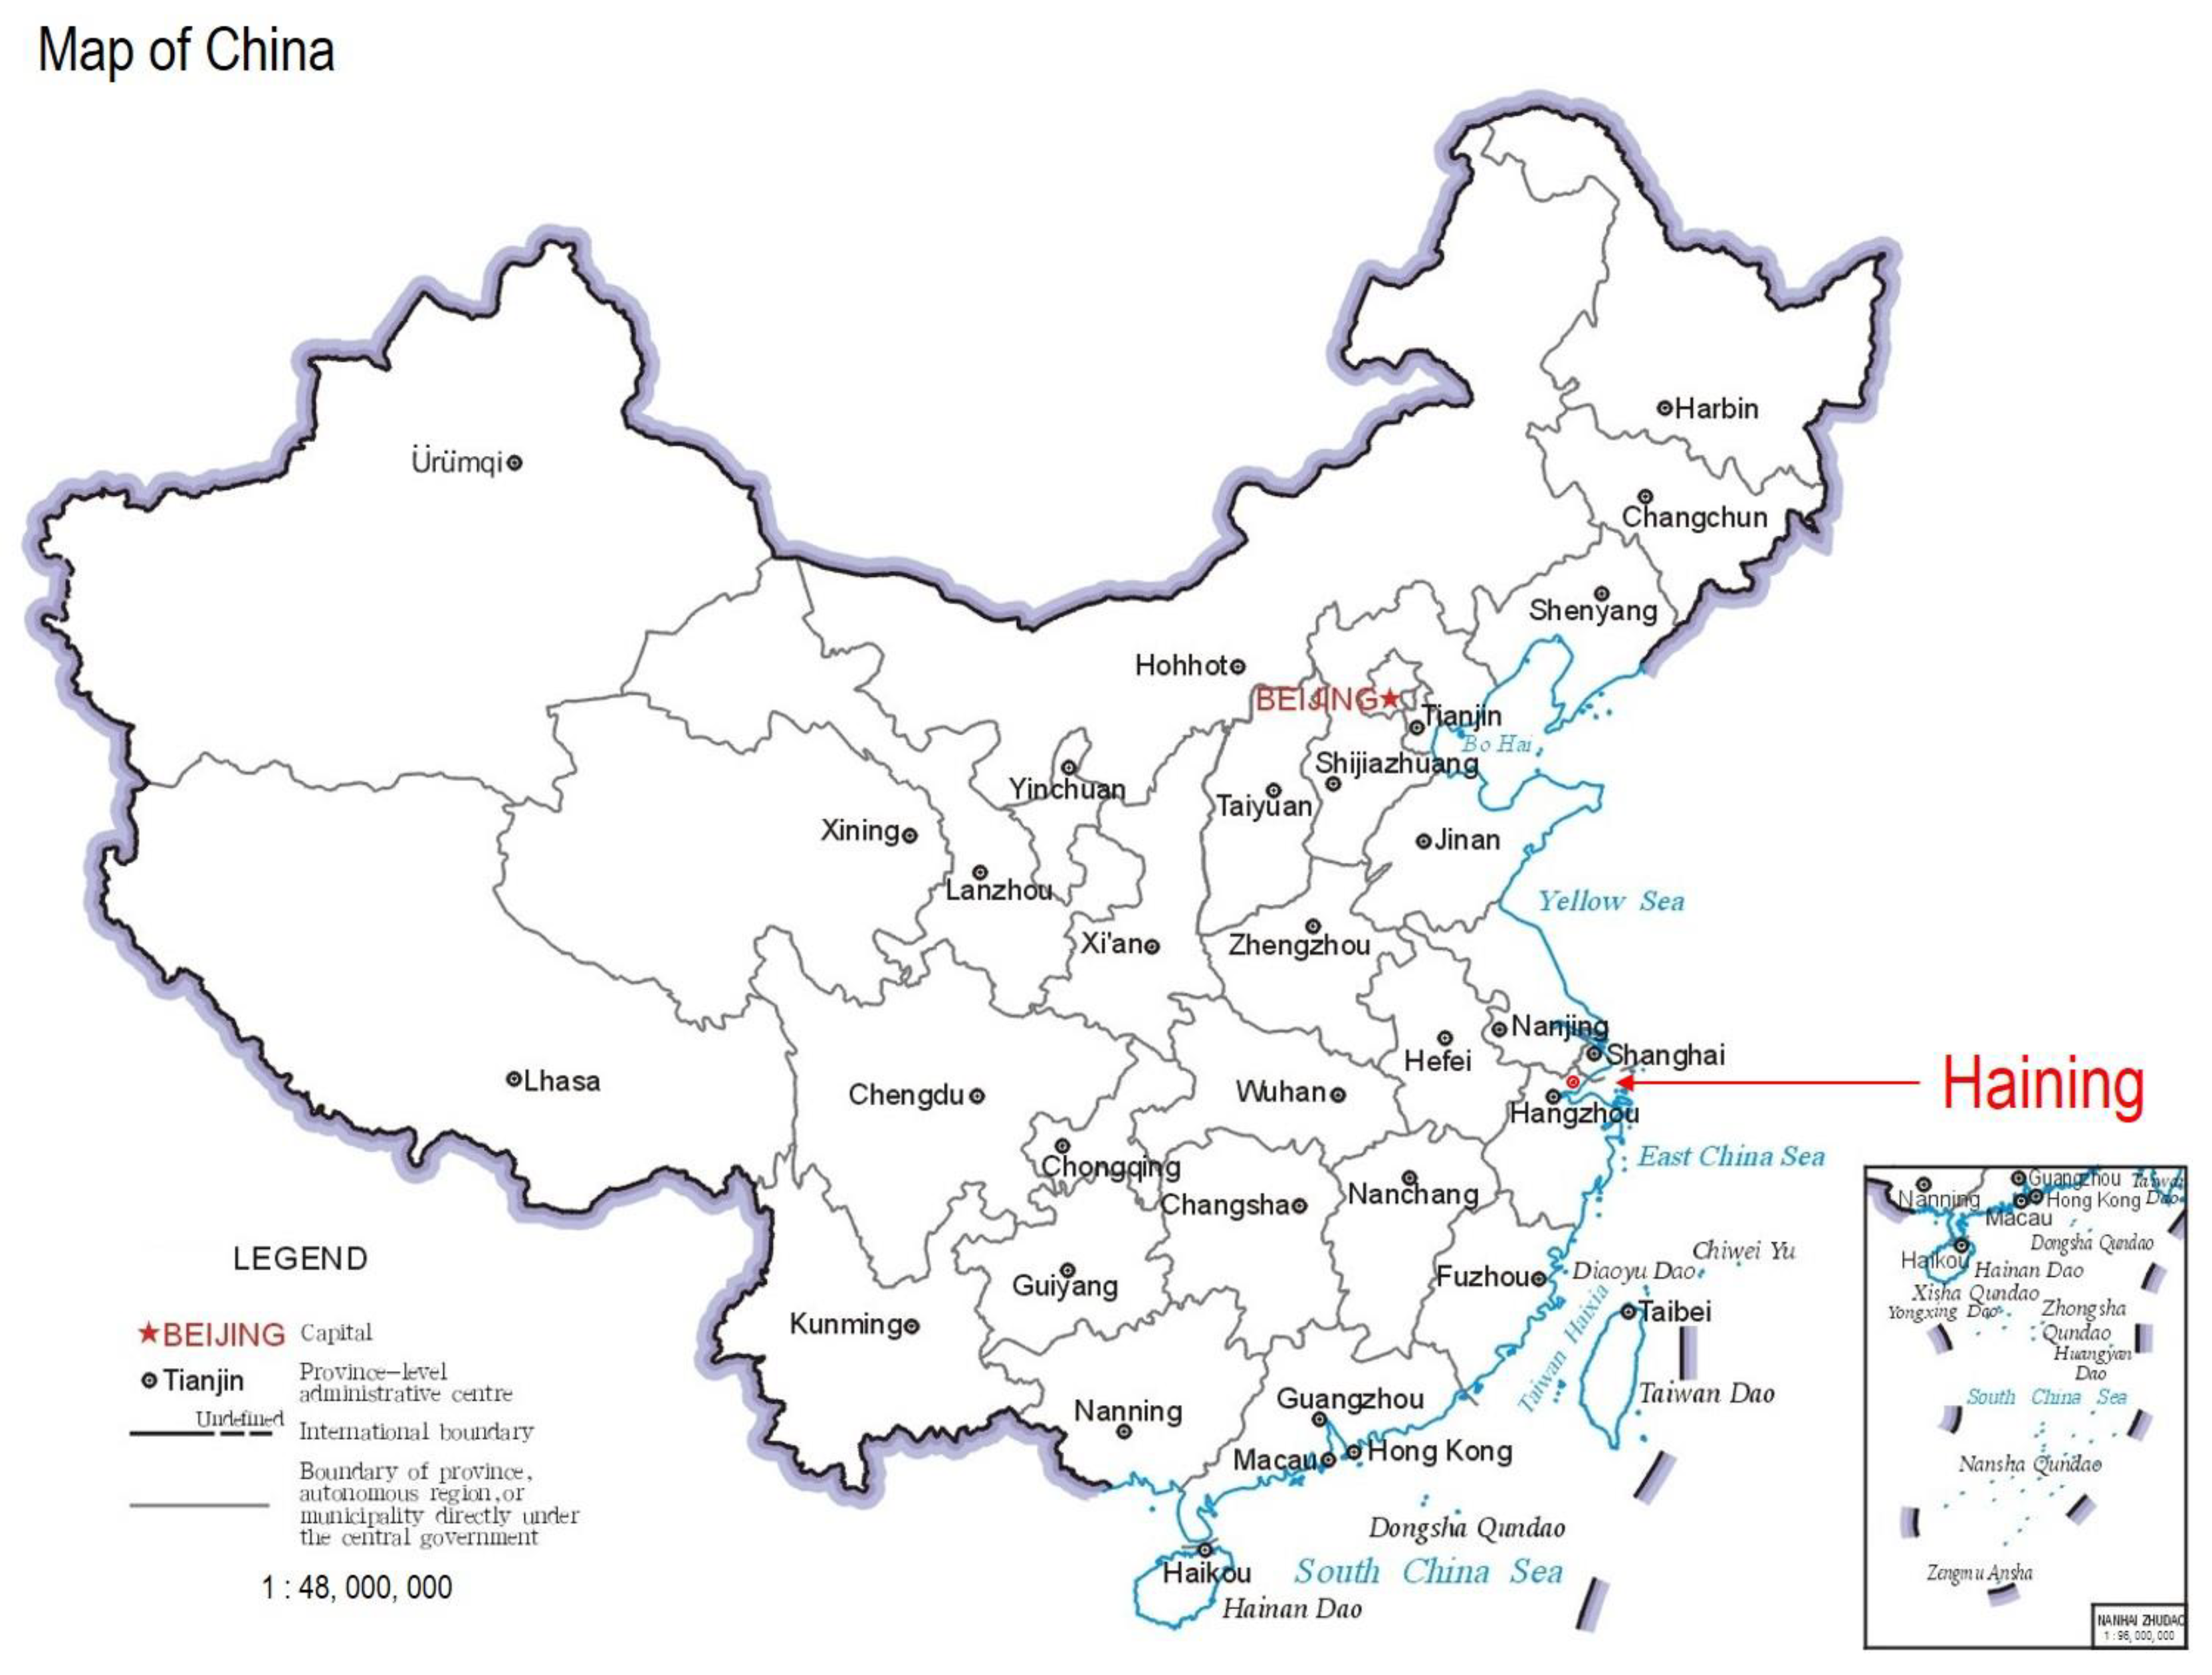
2.1. Study Area
2.2. Datasets
3. Methods
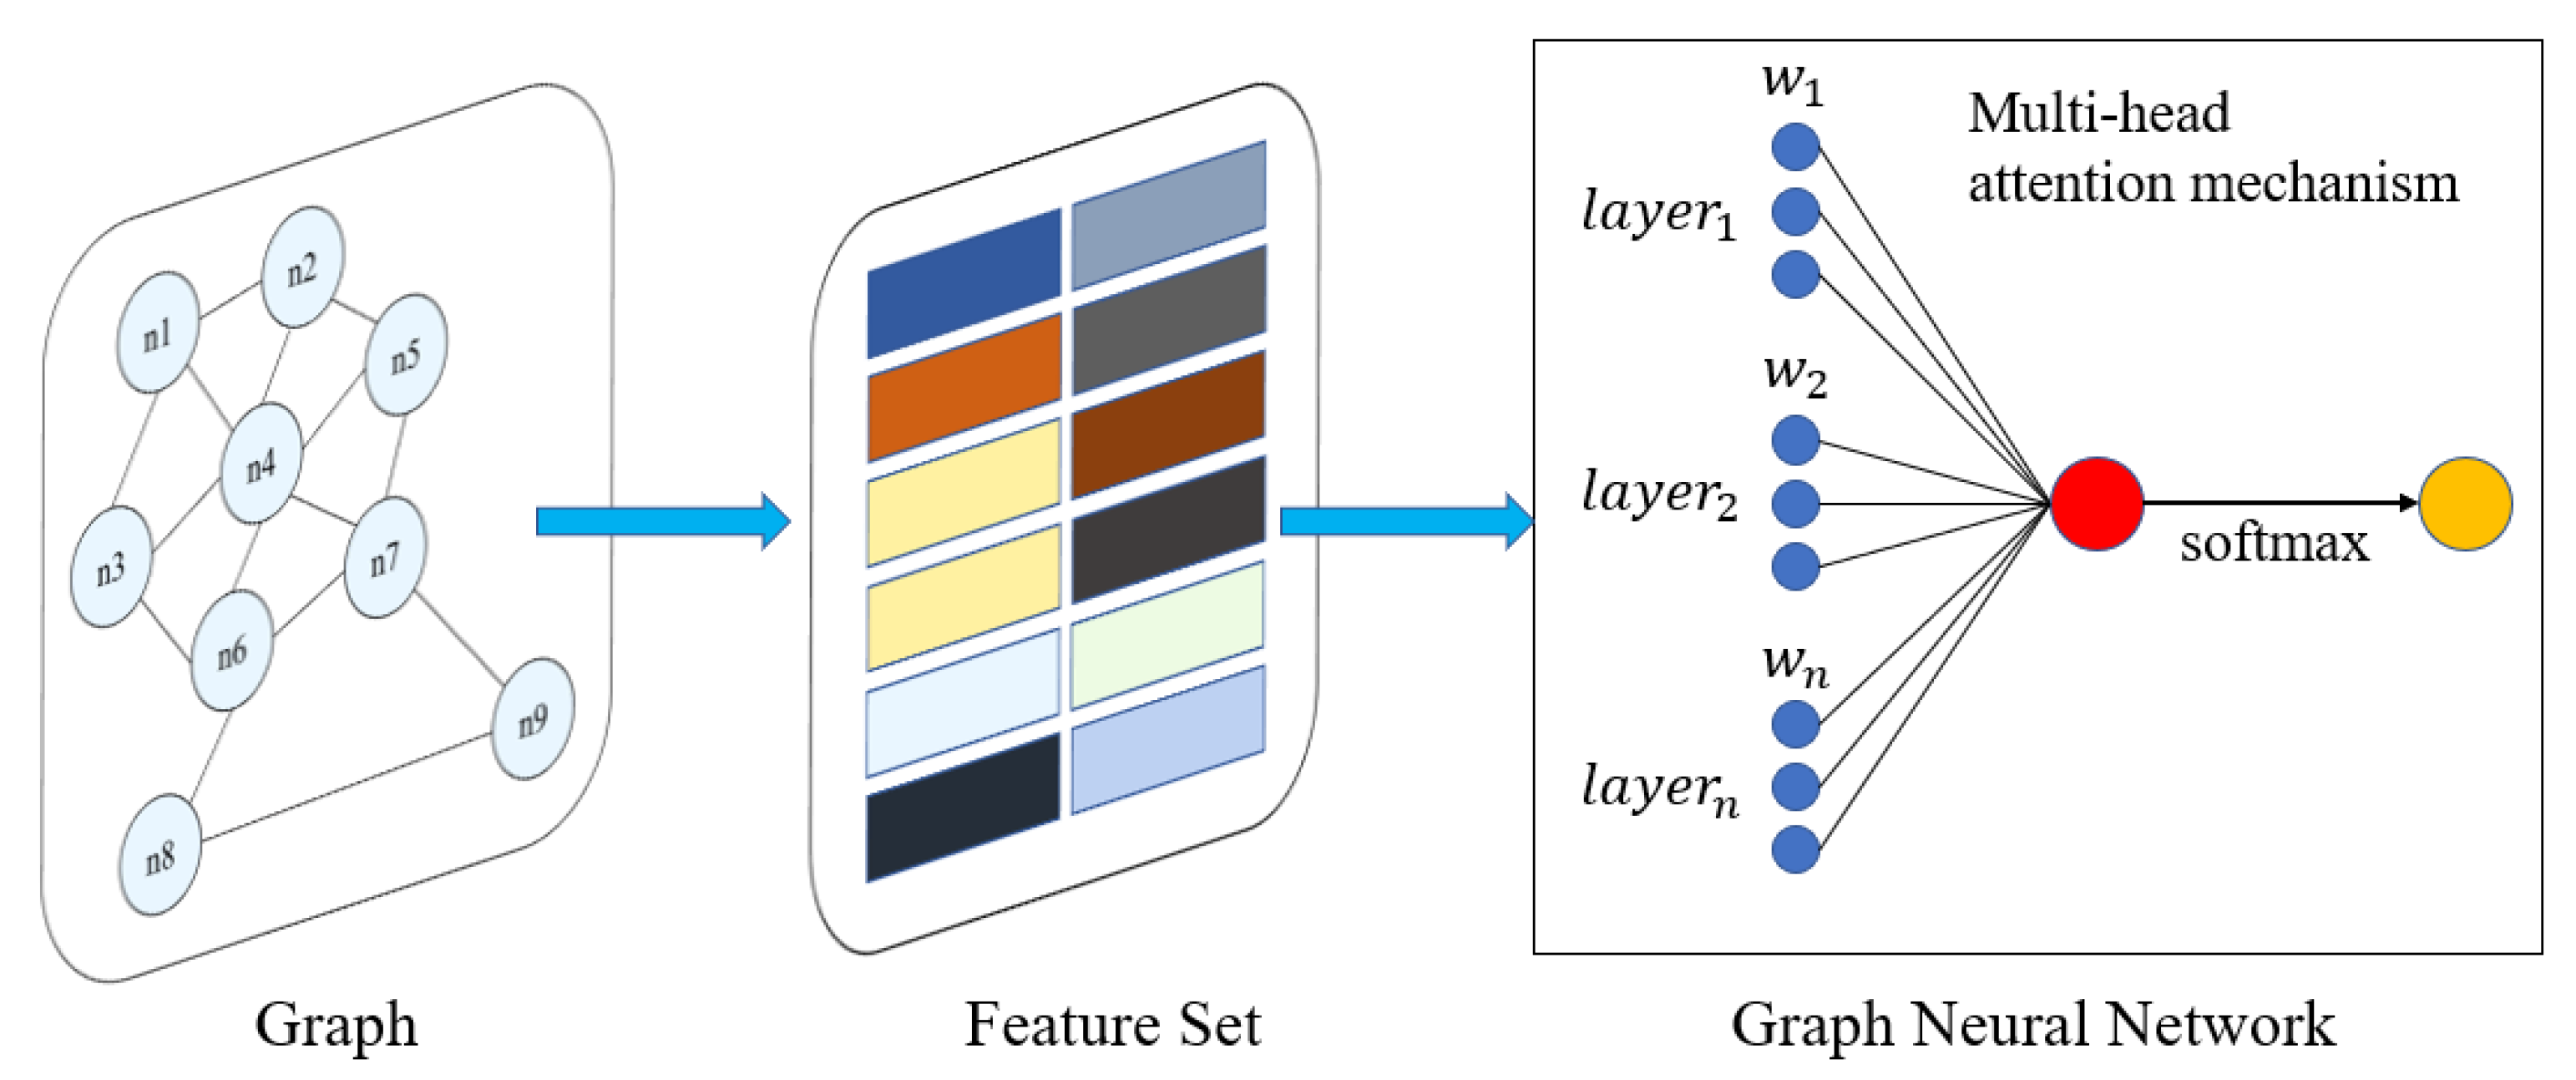
3.1. GAT
3.2. GATR
- Three matrices are generated, including graph matrix, feature matrix and label matrix. The ranks of these matrices are [N, N], [N, H, D], [N, 1, D]. N is the number of nodes. H is the number of the features. D is the number of days. The graph matrix records the connectivity between nodes. The feature matrix records the features of every node in every day. The label matrix records the traffic violation number of every node in every day.
- In each training cycle, the data of different days is randomly selected for training. The feature data is input, the training result is compared with the label data, and the parameters are updated by backward propagation.
- The selected data enters n attention layers and the results are spliced, which is the multiple attention mechanism. Then the spliced result enters into another attention layer and a Relu layer to complete a forward operation.
- In an attention layer, first the data is entered into a linear layer to extract the features, then the data is calculated with its own transposition, then the data is filtered through the graph matrix. Finally, the data is entered into a Softmax layer and an offset is added to obtain the attention result.
- After all training cycles are completed, a model for the spatiotemporal prediction of traffic violations is obtained, which is tested on the test data.
4. Experiment
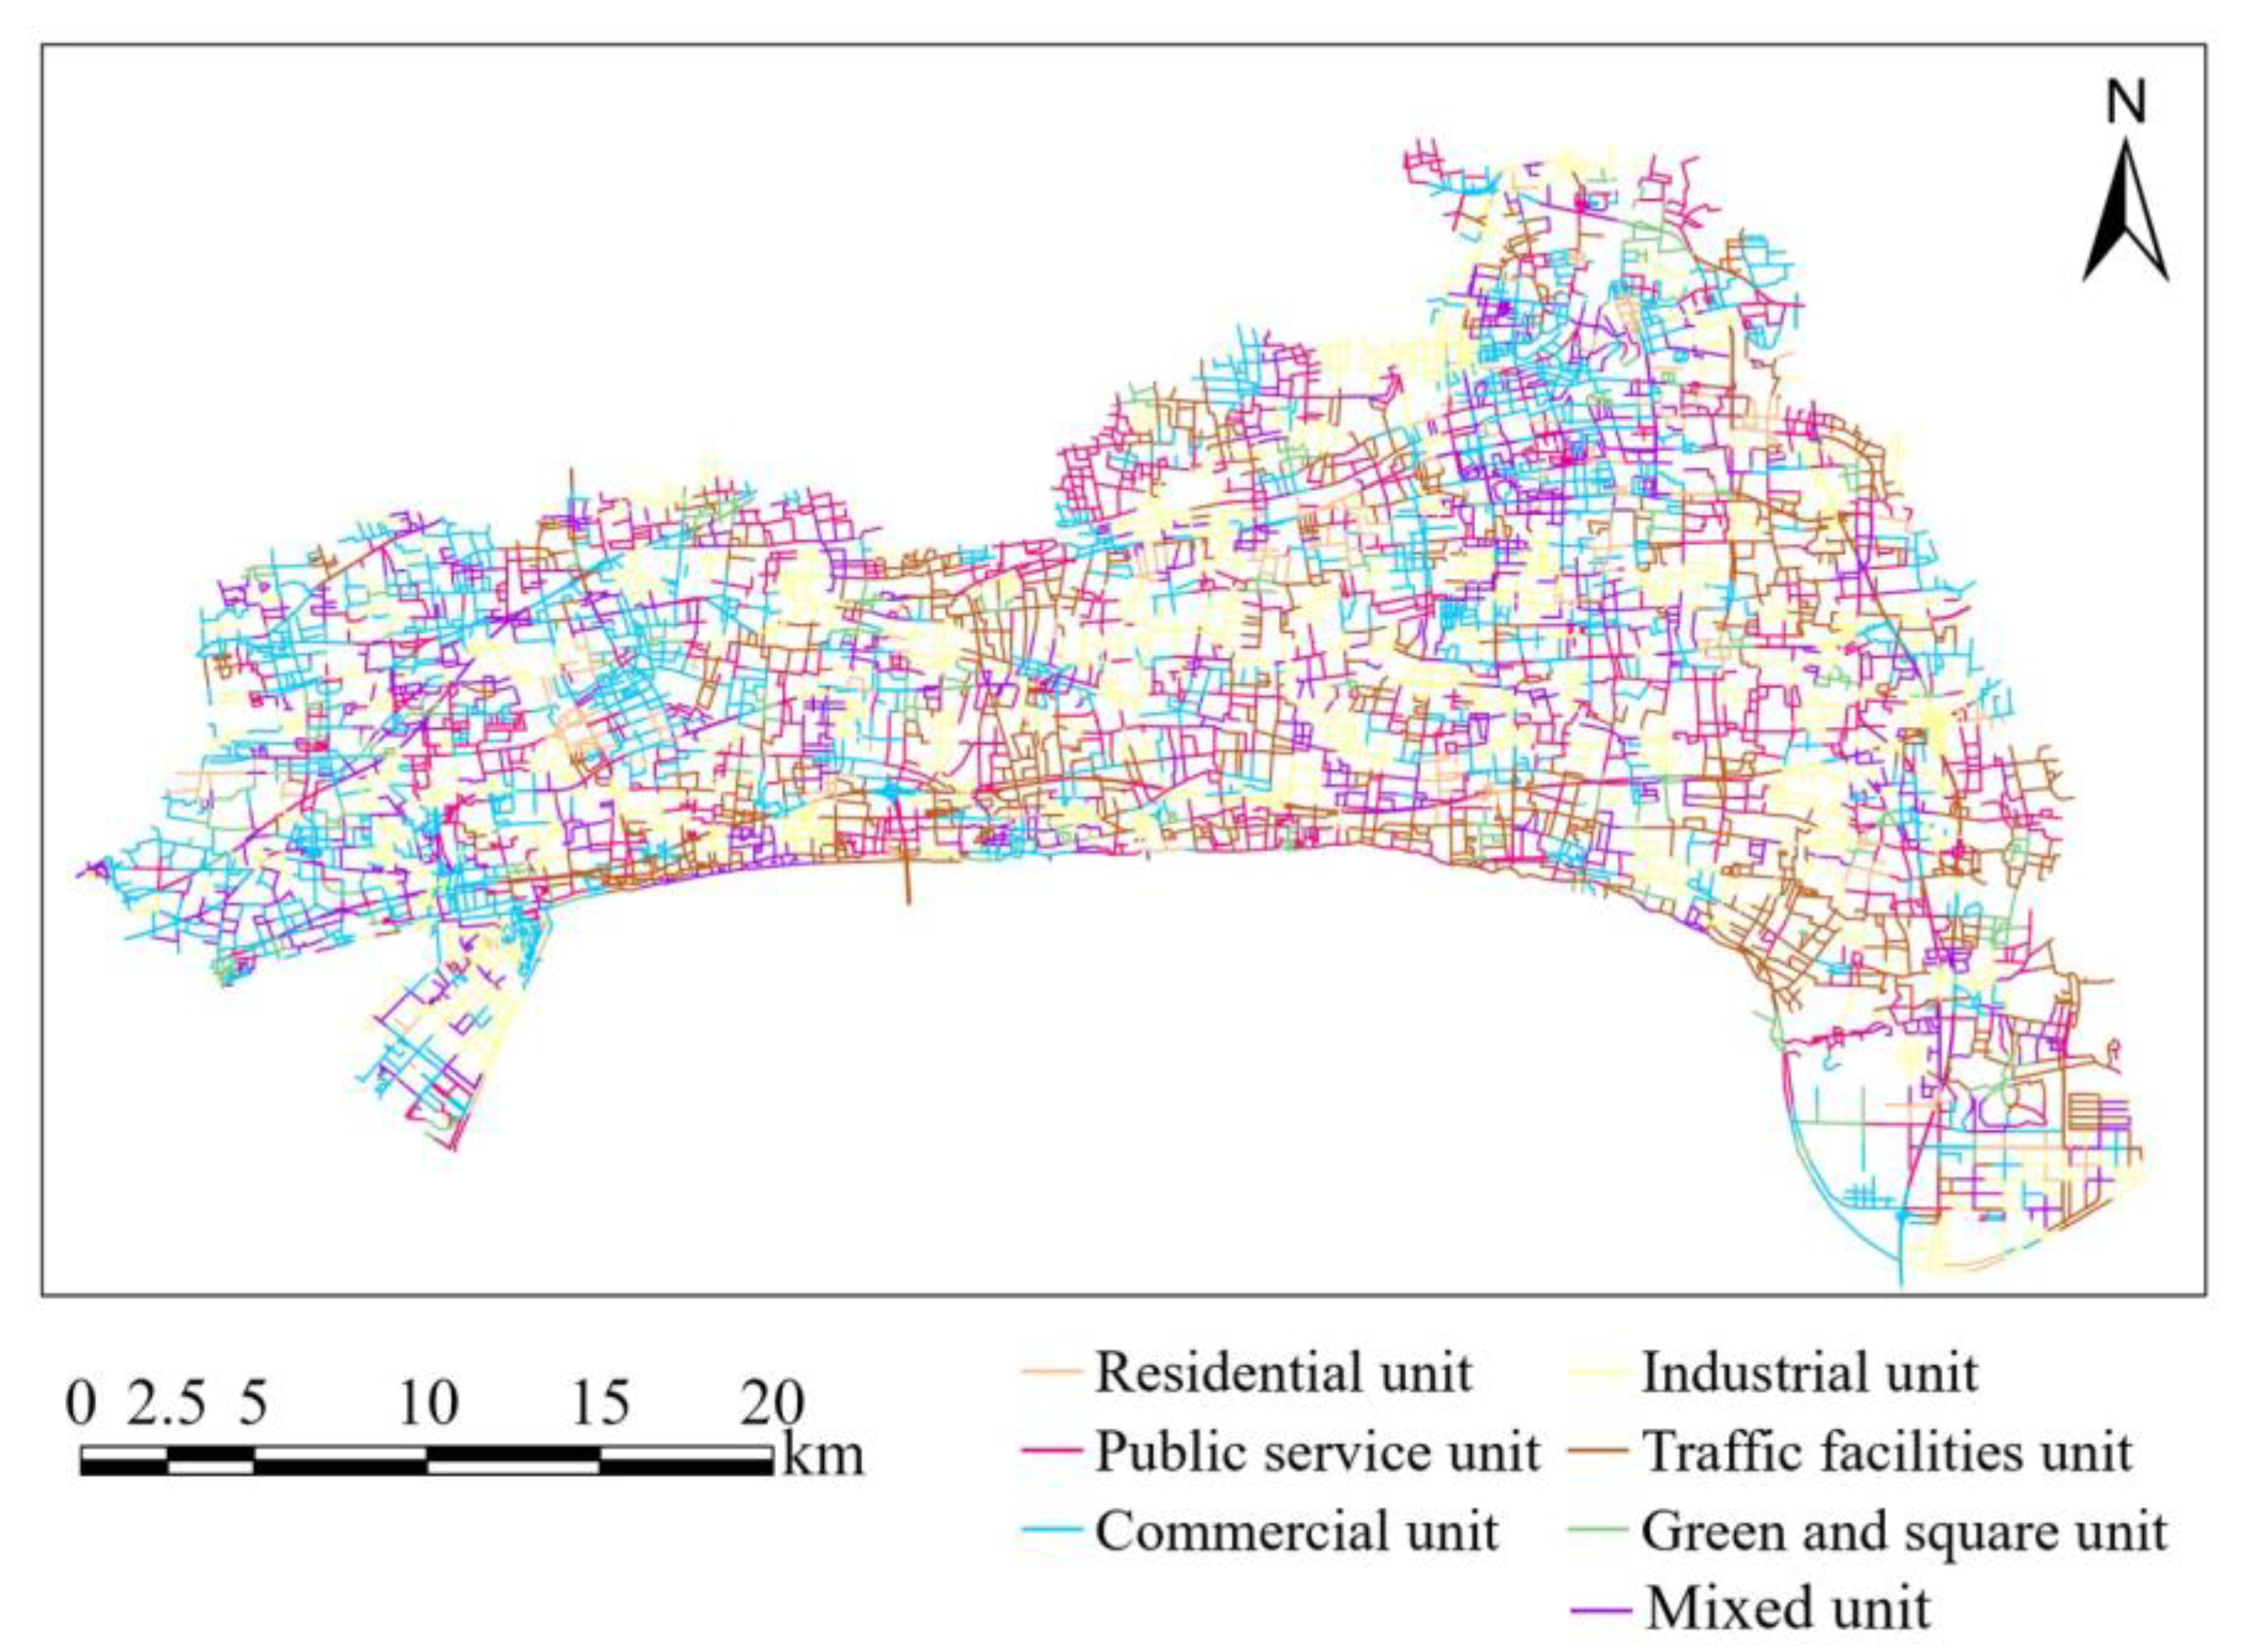
4.1. Graph Construction Based on Road Network
4.2. Feature Set
4.2.1. Historical Traffic Violation Features
4.2.2. External Environmental Features
4.2.3. Urban Functional Feature
5. Results
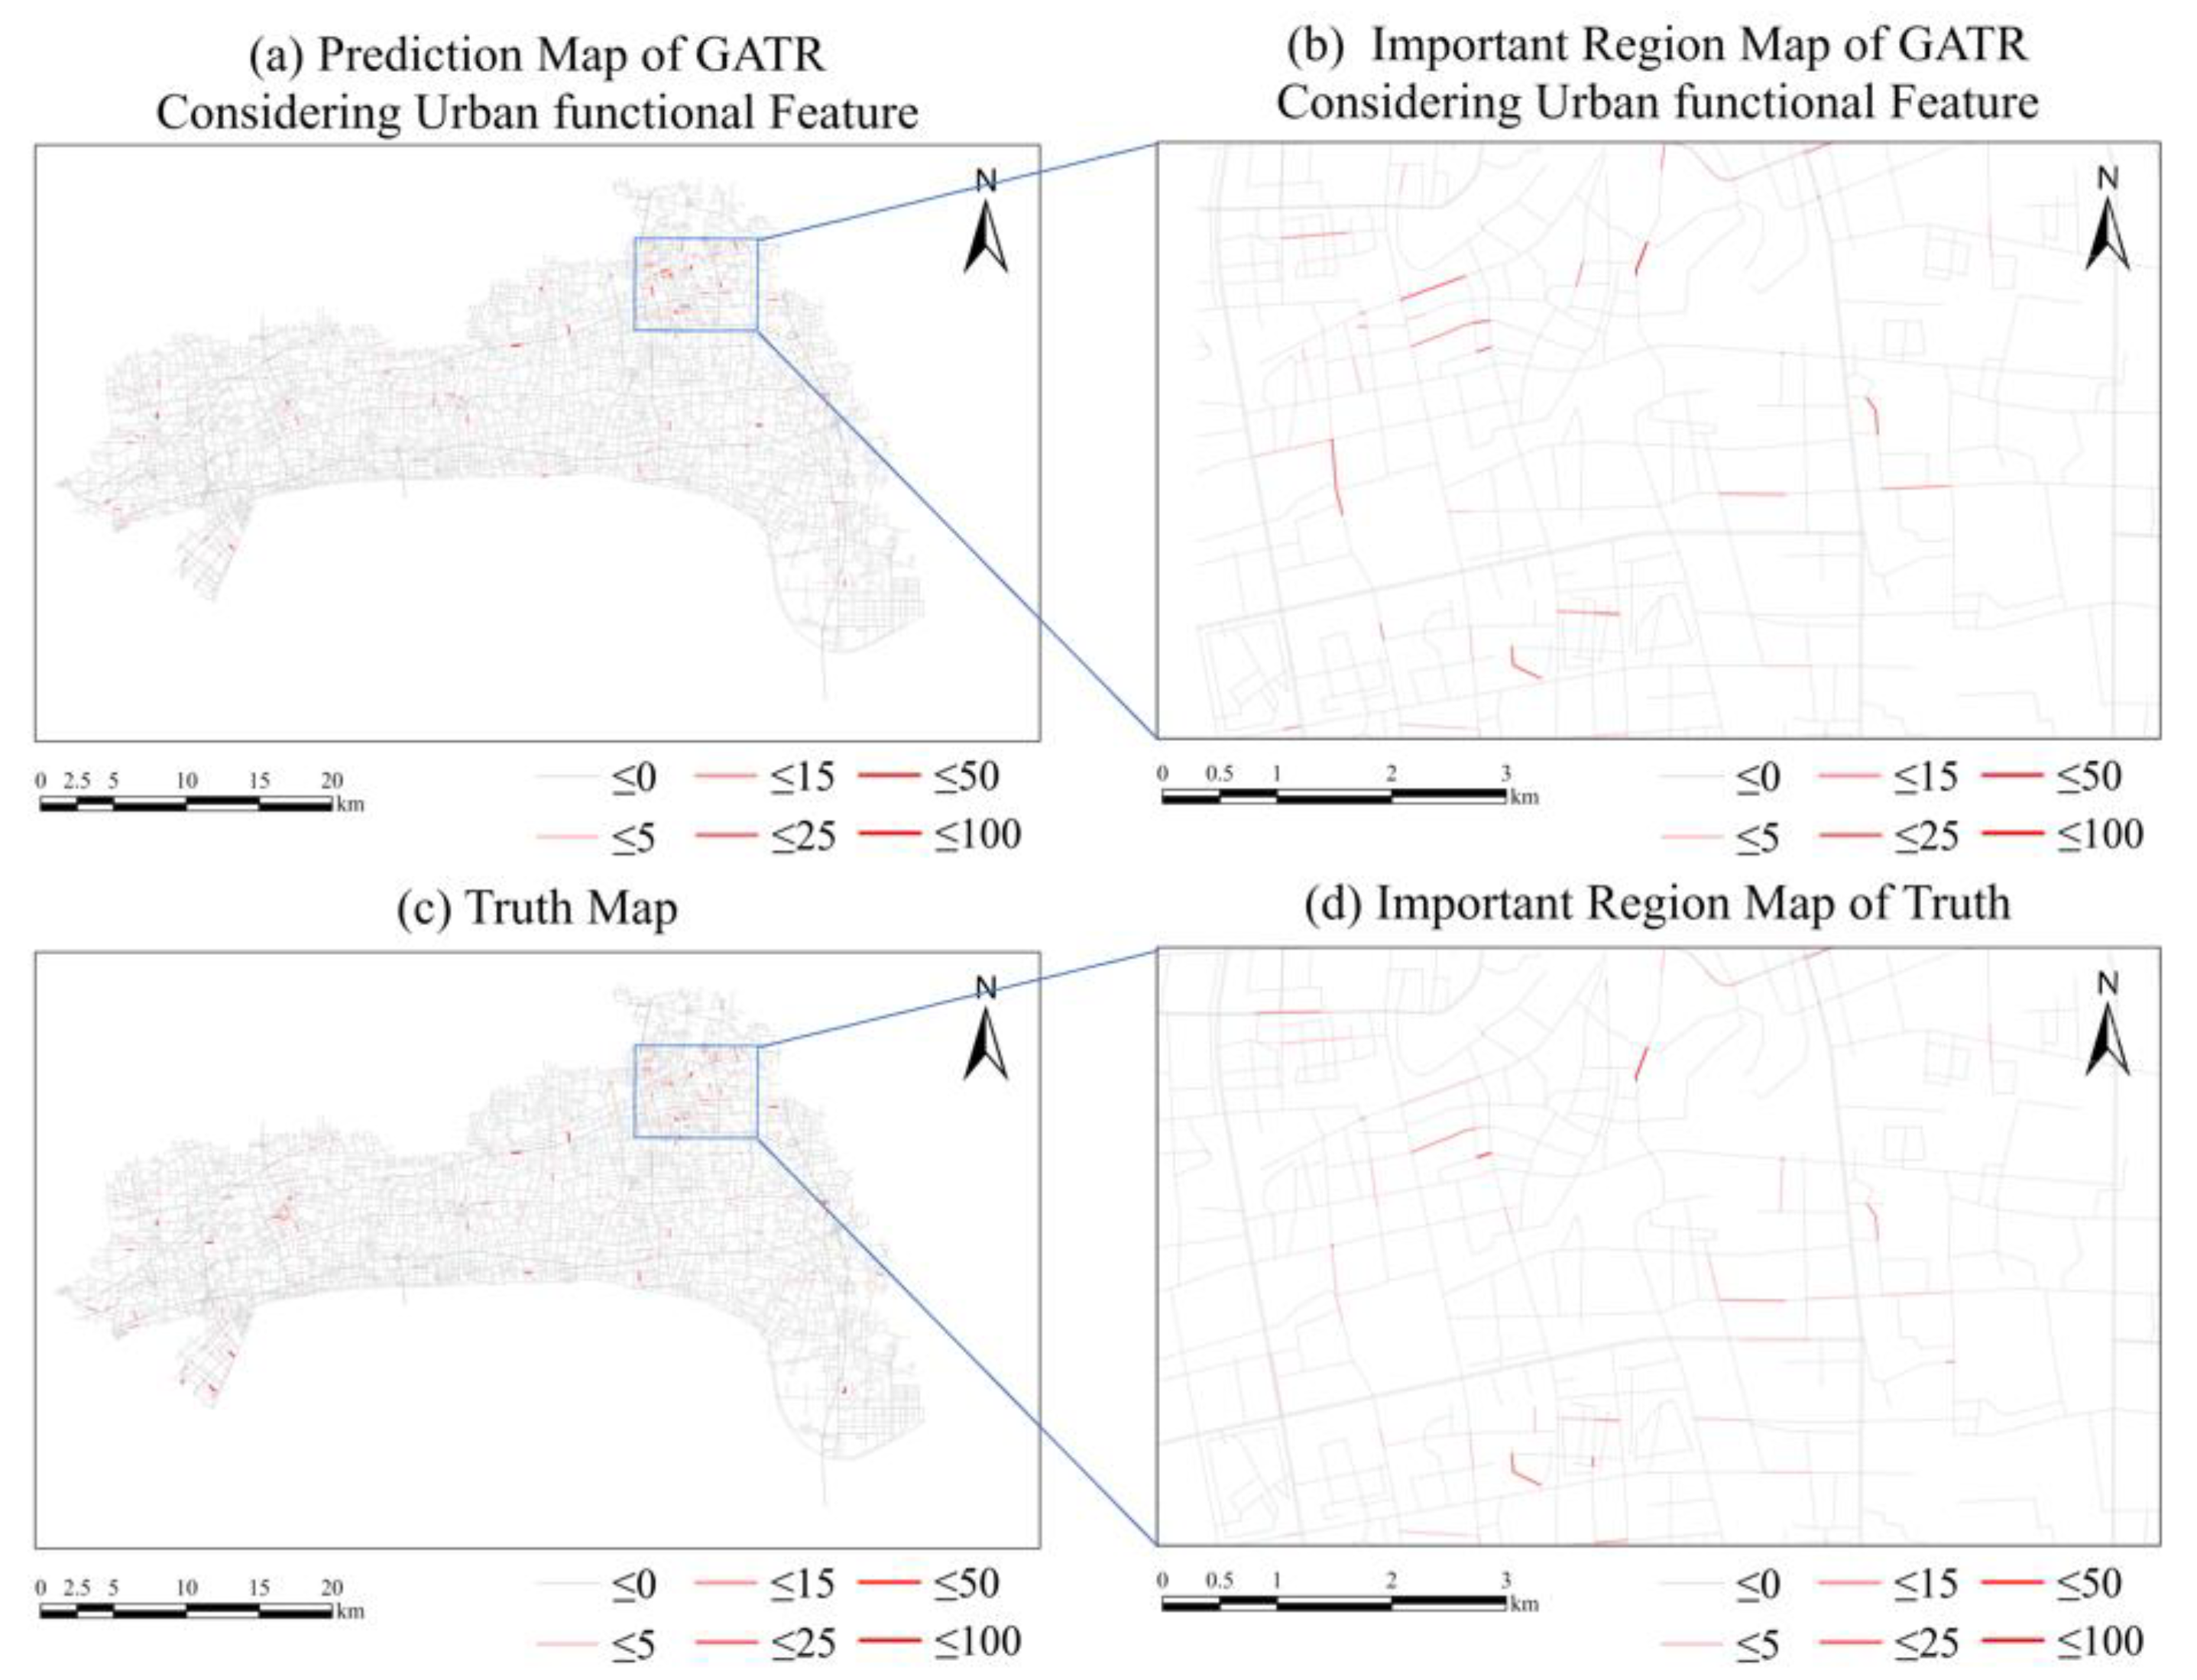
5.1. Performance of GATR
5.2. Performance of Conv-LSTM
6. Discussions
6.1. Comparison between GATR and Conv-LSTM
6.2. Interpretation of GATR Model Based on GNN Explainer
7. Conclusions
Author Contributions
Funding
Institutional Review Board Statement
Informed Consent Statement
Data Availability Statement
Conflicts of Interest
References
- Road Traffic Injuries. Available online: https://www.who.int/health-topics/road-safety#tab=tab_1 (accessed on 9 January 2023).
- Zhang, G.; Yau, K.K.; Chen, G. Risk factors associated with traffic violations and accident severity in China. Accid. Anal. Prev. 2013, 59, 18–25. [Google Scholar] [CrossRef] [PubMed]
- Zheng, L.; Gu, P.; Lu, J. A Cause Analysis of Extraordinarily Severe Traffic Crashes Based on T-S Fuzzy Fault Tree and Bayesian Network. J. Transp. Inf. Saf. 2021, 39, 43–51+59. [Google Scholar]
- Erdogan, S.; Yilmaz, I.; Baybura, T.; Gullu, M. Geographical information systems aided traffic accident analysis system case study: City of Afyonkarahisar. Accid. Anal. Prev. 2008, 40, 174–181. [Google Scholar] [CrossRef] [PubMed]
- Liu, Y.; Wang, Y.; Wang, L.; Zhang, F.; Du, Z.; Liu, R. Spatial-temporal hotspots analysis on traffic accidents. J. Zhejiang Univ. 2020, 47, 52–59. [Google Scholar]
- Suprihatiningsih, W.; Leman, A.; Feriyanto, D.; Pranoto, H.; Shuaib, N.A. Impact on Driver Behavior, Performance, Fatigue, Over Speed and Infrastructure as A Factor of Road Accident: A Review. IOP Conf. Ser. Mater. Sci. Eng. 2020, 864, 012105. [Google Scholar] [CrossRef]
- Wang, Y.; Mao, Y.; Wang, L. Analysis on the Causes of Traffic Accident Prone Points Based on Association Rules. J. Chin. Peoples Public Secur. Univ. 2021, 27, 56–62. [Google Scholar]
- Wei, Q.; Chen, B.; Jin, W.; Fu, R.; Yuan, W. Analyzing Road Factor in Traffic Accident Based on Layer-interrelating Analysis Method. J. Transp. Sci. Eng. 2005, 21, 82–86. [Google Scholar]
- Xv, H.; Zhang, H.; Zong, F. Bayesian network modeling for causation analysis of traffic accident. J. Jilin Univ. 2011, 89–94. [Google Scholar]
- Zhou, Z.; Wang, Y.; Xie, X.; Chen, L.; Liu, H. RiskOracle: A minute-level citywide traffic accident forecasting framework. In Proceedings of the AAAI Conference on Artificial Intelligence, New York, NY, USA, 7–12 February 2020; pp. 1258–1265. [Google Scholar]
- Anderson, T.K. Kernel density estimation and K-means clustering to profile road accident hotspots. Accid. Anal. Prev. 2009, 41, 359–364. [Google Scholar] [CrossRef]
- Caliendo, C.; Guida, M.; Parisi, A. A crash-prediction model for multilane roads. Accid. Anal. Prev. 2007, 39, 657–670. [Google Scholar] [CrossRef]
- Lin, L.; Wang, Q.; Sadek, A.W. A novel variable selection method based on frequent pattern tree for real-time traffic accident risk prediction. Transp. Res. Part C Emerg. Technol. 2015, 55, 444–459. [Google Scholar] [CrossRef]
- Chen, Q.; Song, X.; Fan, Z.; Xia, T.; Yamada, H.; Shibasaki, R. A context-aware nonnegative matrix factorization framework for traffic accident risk estimation via heterogeneous data. In Proceedings of the 2018 IEEE Conference on Multimedia Information Processing and Retrieval (MIPR), Miami, FL, USA, 10–12 April 2018; pp. 346–351. [Google Scholar]
- Xu, Q.; Tao, G. Traffic accident hotspots identification based on clustering ensemble model. In Proceedings of the 2018 5th IEEE International Conference on Cyber Security and Cloud Computing (CSCloud)/2018 4th IEEE International Conference on Edge Computing and Scalable Cloud (EdgeCom), Shanghai, China, 22–24 June 2018; pp. 1–4. [Google Scholar]
- Zeng, K.-H.; Chou, S.-H.; Chan, F.-H.; Carlos Niebles, J.; Sun, M. Agent-centric risk assessment: Accident anticipation and risky region localization. In Proceedings of the IEEE Conference on Computer Vision and Pattern Recognition, Honolulu, HI, USA, 21–26 July 2017; pp. 2222–2230. [Google Scholar]
- Chan, F.-H.; Chen, Y.-T.; Xiang, Y.; Sun, M. Anticipating accidents in dashcam videos. In Proceedings of the Computer Vision–ACCV 2016: 13th Asian Conference on Computer Vision, Taipei, Taiwan, 20–24 November 2016; Revised Selected Papers, Part IV 13, 2017. pp. 136–153. [Google Scholar]
- Xiao, T.; Lu, H.; Wang, J.; Wang, K. Predicting and interpreting spatial accidents through MDLSTM. Int. J. Environ. Res. Public Health 2021, 18, 1430. [Google Scholar] [CrossRef] [PubMed]
- Najjar, A.; Kaneko, S.; Miyanaga, Y. Combining satellite imagery and open data to map road safety. In Proceedings of the Thirty-First AAAI Conference on Artificial Intelligence, San Francisco, CA, USA, 4–9 February 2017. [Google Scholar]
- Ren, H.; Song, Y.; Liu, J.; Hu, Y.; Lei, J. A deep learning approach to the prediction of short-term traffic accident risk. arXiv 2017, arXiv:09543.2017. [Google Scholar]
- Ren, H.; Song, Y.; Wang, J.; Hu, Y.; Lei, J. A deep learning approach to the citywide traffic accident risk prediction. In Proceedings of the 2018 21st International Conference on Intelligent Transportation Systems (ITSC), Muai, HI, USA, 4–7 November 2018; pp. 3346–3351. [Google Scholar]
- Liu, Y.; Zheng, H.; Feng, X.; Chen, Z. Short-term traffic flow prediction with Conv-LSTM. In Proceedings of the 2017 9th International Conference on Wireless Communications and Signal Processing (WCSP), Nanjing, China, 11–13 October 2017; pp. 1–6. [Google Scholar]
- Yuan, Z.; Zhou, X.; Yang, T. Hetero-convlstm: A deep learning approach to traffic accident prediction on heterogeneous spatio-temporal data. In Proceedings of the 24th ACM SIGKDD International Conference on Knowledge Discovery & Data Mining, London, UK, 19–23 August 2018; pp. 984–992. [Google Scholar]
- Tian, J.; Fang, H.; Wang, Y.; Ren, C. On the degree correlation of urban road networks. Trans. GIS 2018, 22, 119–148. [Google Scholar] [CrossRef]
- Cai, L.; Janowicz, K.; Mai, G.; Yan, B.; Zhu, R. Traffic transformer: Capturing the continuity and periodicity of time series for traffic forecasting. Trans. GIS 2020, 24, 736–755. [Google Scholar] [CrossRef]
- Dalai, B.; Landge, V.S. Risky zones in urban area: An analysis using fault tree and risk matrix method. Innov. Infrastruct. Solut. 2022, 7, 101. [Google Scholar] [CrossRef]
- Diao, C.; Zhang, D.; Liang, W.; Li, K.-C.; Hong, Y.; Gaudiot, J.-L. A Novel Spatial-Temporal Multi-Scale Alignment Graph Neural Network Security Model for Vehicles Prediction. IEEE Trans. Intell. Transp. Syst. 2022, 24, 904–914. [Google Scholar] [CrossRef]
- Ma, M. Research of Urban Road Crash Analysis based on Multivariate Statistical Techniques. Ph.D. Thesis, Wuhan University of Technology, Wuhan, China, 2010. [Google Scholar]
- Liu, S. Study on the Accessibility of Urban and Rural Public Transport in Haining Based on ArcGIS Spatial Network Analysis. Master’s Thesis, Chang’an University, Xi’an, China, 2017. [Google Scholar]
- Scarselli, F.; Gori, M.; Tsoi, A.C.; Hagenbuchner, M.; Monfardini, G. The graph neural network model. IEEE Trans. Neural Netw. 2008, 20, 61–80. [Google Scholar] [CrossRef] [Green Version]
- Veličković, P.; Cucurull, G.; Casanova, A.; Romero, A.; Lio, P.; Bengio, Y. Graph attention networks. arXiv 2017, arXiv:10903. [Google Scholar]
- Tobler, W.R. A Computer Movie Simulating Urban Growth in the Detroit Region. Econ. Geogr. 1970, 46, 234–240. [Google Scholar] [CrossRef]
- Mao, X.; Yuan, C.; Gan, J.; Zhang, S. Risk Factors Affecting Traffic Accidents at Urban Weaving Sections: Evidence from China. Int. J. Environ. Res. Public Health 2019, 16, 1542. [Google Scholar] [CrossRef] [Green Version]
- Zhang, Y.; Lu, H.; Qu, W. Geographical Detection of Traffic Accidents Spatial Stratified Heterogeneity and Influence Factors. Int. J. Environ. Res. Public Health 2020, 17, 572. [Google Scholar] [CrossRef] [PubMed] [Green Version]
- Wang, Y.; Cao, J.; Li, W.; Gu, T. Mining traffic congestion correlation between road segments on GPS trajectories. In Proceedings of the 2016 IEEE International Conference on Smart Computing (SMARTCOMP), St. Louis, MO, USA, 18–20 May 2016; pp. 1–8. [Google Scholar]
- Wang, M.; Yang, S.; Sun, Y.; Gao, J. Discovering urban mobility patterns with PageRank based traffic modeling and prediction. Phys. A Stat. Mech. Appl. 2017, 485, 23–34. [Google Scholar] [CrossRef]
- Liu, T.; Liang, Y.; Hu, J.; Pei, X. Analysis on Traffic Patterns of Urban Functional Zones Based on Big Data. In Proceedings of the 14th China Intelligent Transportation Annual Conference, Qingdao, China, 31 October–2 November 2019; pp. 579–590. [Google Scholar]
- Salton, G.; Yu, C.T. On the construction of effective vocabularies for information retrieval. ACM Sigplan Not. 1973, 10, 48–60. [Google Scholar] [CrossRef]
- Salton, G.; Fox, E.A.; Wu, H. Extended Boolean information retrieval. Commun. ACM 1983, 26, 1022–1036. [Google Scholar] [CrossRef]
- Zhao, J.; Li, H.; Deng, S.; Jiang, J. Identifying urban functional regions based on POI data and spatial analysis of main transit hubs. Geomat. Spat. Inf. Technol 2019, 42, 38–42. [Google Scholar]
- Ying, Z.; Bourgeois, D.; You, J.; Zitnik, M.; Leskovec, J. GNNExplainer: Generating Explanations for Graph Neural Networks. In Advances in Neural Information Processing Systems 32; Neural Information Processing Systems Foundation, Inc.: Vancouver, BC, Canada, 2019; Volume 32. [Google Scholar]


| Road Type | Value |
|---|---|
| Expressway | 7 |
| National highway | 6 |
| Provincial highway | 5 |
| Urban road class 1 | 4 |
| Urban road class 2 | 3 |
| County highway | 2 |
| Township village road | 1 |
| Others | 0 |
| Weather Description | Weather Categories | Value |
|---|---|---|
| Rainstorm, blizzard, heavy rain, heavy snow, etc. | Extreme weather | 3 |
| Moderate rain, moderate snow, etc. | Worse weather | 2 |
| Light rain, snow, fog, haze, etc. | Bad weather | 1 |
| Overcast, sunny, etc. | General weather | 0 |
| Urban Function | Value |
|---|---|
| Residential area | 6 |
| Public service area | 5 |
| Commercial area | 4 |
| Industrial area | 3 |
| Traffic facilities area | 2 |
| Green and square area | 1 |
| Mixed area | 0 |
| Feature Name | Feature Categories | Influence Degree |
|---|---|---|
| Historical traffic violations | Historical traffic violation feature | 0.828 |
| Road type | External environmental features | 0.469 |
| Whether contains an intersection | 0.551 | |
| Temperature | 0.359 | |
| Weather | 0.788 | |
| Weekday | 0.903 | |
| Season | 0.646 | |
| Whether it is a holiday | 0.698 | |
| Urban functional feature | Urban functional feature | 0.847 |
Disclaimer/Publisher’s Note: The statements, opinions and data contained in all publications are solely those of the individual author(s) and contributor(s) and not of MDPI and/or the editor(s). MDPI and/or the editor(s) disclaim responsibility for any injury to people or property resulting from any ideas, methods, instructions or products referred to in the content. |
© 2023 by the authors. Licensee MDPI, Basel, Switzerland. This article is an open access article distributed under the terms and conditions of the Creative Commons Attribution (CC BY) license (https://creativecommons.org/licenses/by/4.0/).
Share and Cite
Zhou, Y.; Wang, Y.; Zhang, F.; Zhou, H.; Sun, K.; Yu, Y. GATR: A Road Network Traffic Violation Prediction Method Based on Graph Attention Network. Int. J. Environ. Res. Public Health 2023, 20, 3432. https://doi.org/10.3390/ijerph20043432
Zhou Y, Wang Y, Zhang F, Zhou H, Sun K, Yu Y. GATR: A Road Network Traffic Violation Prediction Method Based on Graph Attention Network. International Journal of Environmental Research and Public Health. 2023; 20(4):3432. https://doi.org/10.3390/ijerph20043432
Chicago/Turabian StyleZhou, Yuquan, Yingzhi Wang, Feng Zhang, Hongye Zhou, Keran Sun, and Yuhan Yu. 2023. "GATR: A Road Network Traffic Violation Prediction Method Based on Graph Attention Network" International Journal of Environmental Research and Public Health 20, no. 4: 3432. https://doi.org/10.3390/ijerph20043432