
Numerical Simulation Study on Spatial Diffusion Behavior of Non-Point Source Fugitive Dust under Different Enclosure Heights

Abstract
:1. Introduction
2. Basic Theory of Gas-Solid Two-Phase Flow Model
2.1. Fundamental Equation
2.2. Turbulence Model
2.3. Particle Balance Equation
3. Numerical Setup
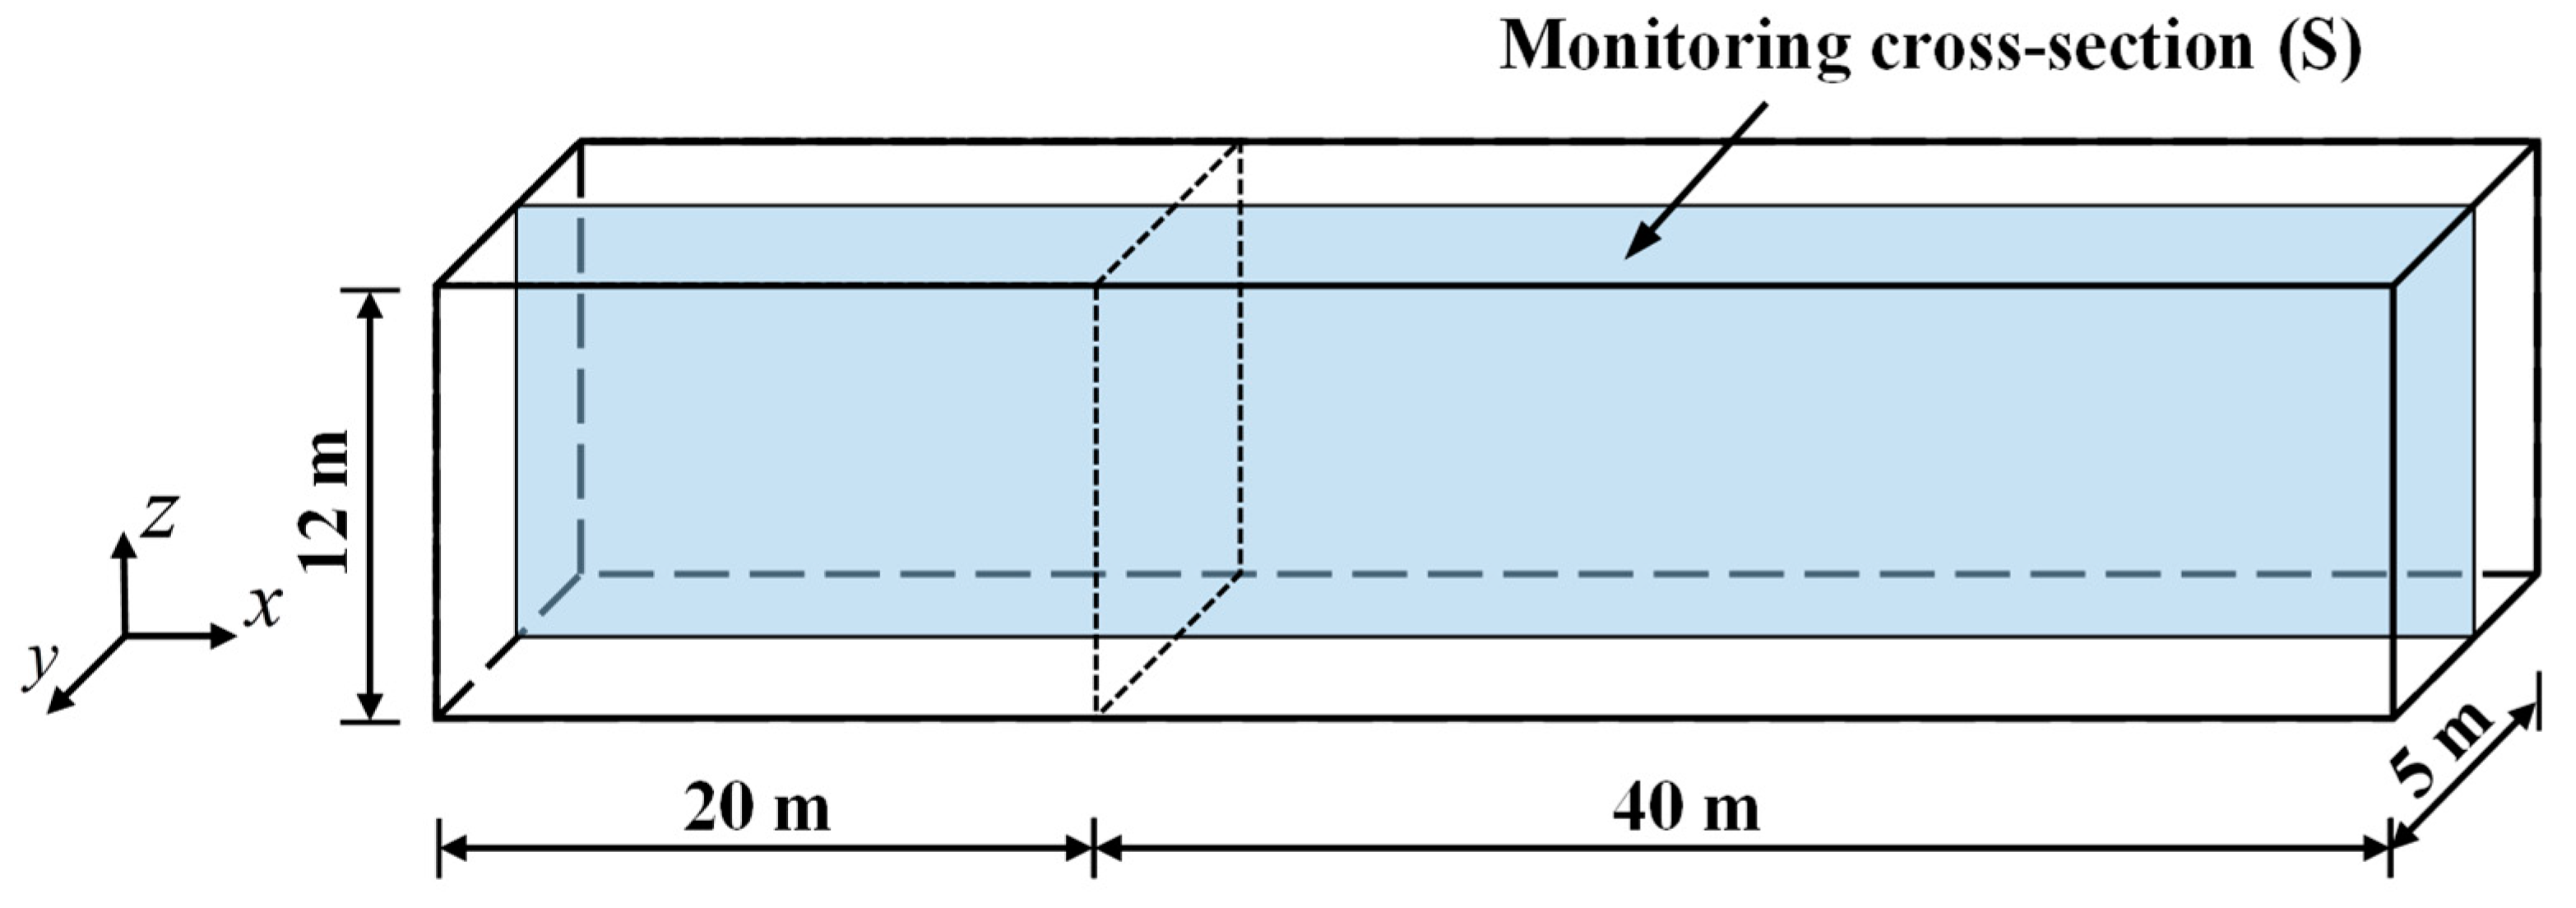
3.1. Model Sizes
3.2. Boundary Conditions

| No. | Condition | Parameter |
|---|---|---|
| 1 | Release position of PM | PM inlet |
| 2 | Minimum particle size | 1.81 × 10⁻⁷ m |
| 3 | Average particle size | 3.52 × 10⁻⁵ m |
| 4 | Maximum particle size | 2.72 × 10⁻⁴ m |
| 5 | Mass flow rate | 1.0 × 10⁻⁶ kg/s |
| 6 | Initial particle concentration | 0 kg/m3 |
3.3. Working Condition Settings
4. Analysis of Simulation Results of Spatial Diffusion Behavior of Non-Point Source Fugitive Dust
4.1. State of Airflow Considering Different Enclosure Heights
4.2. Diffusion Process of NPSD Particles with Enclosure
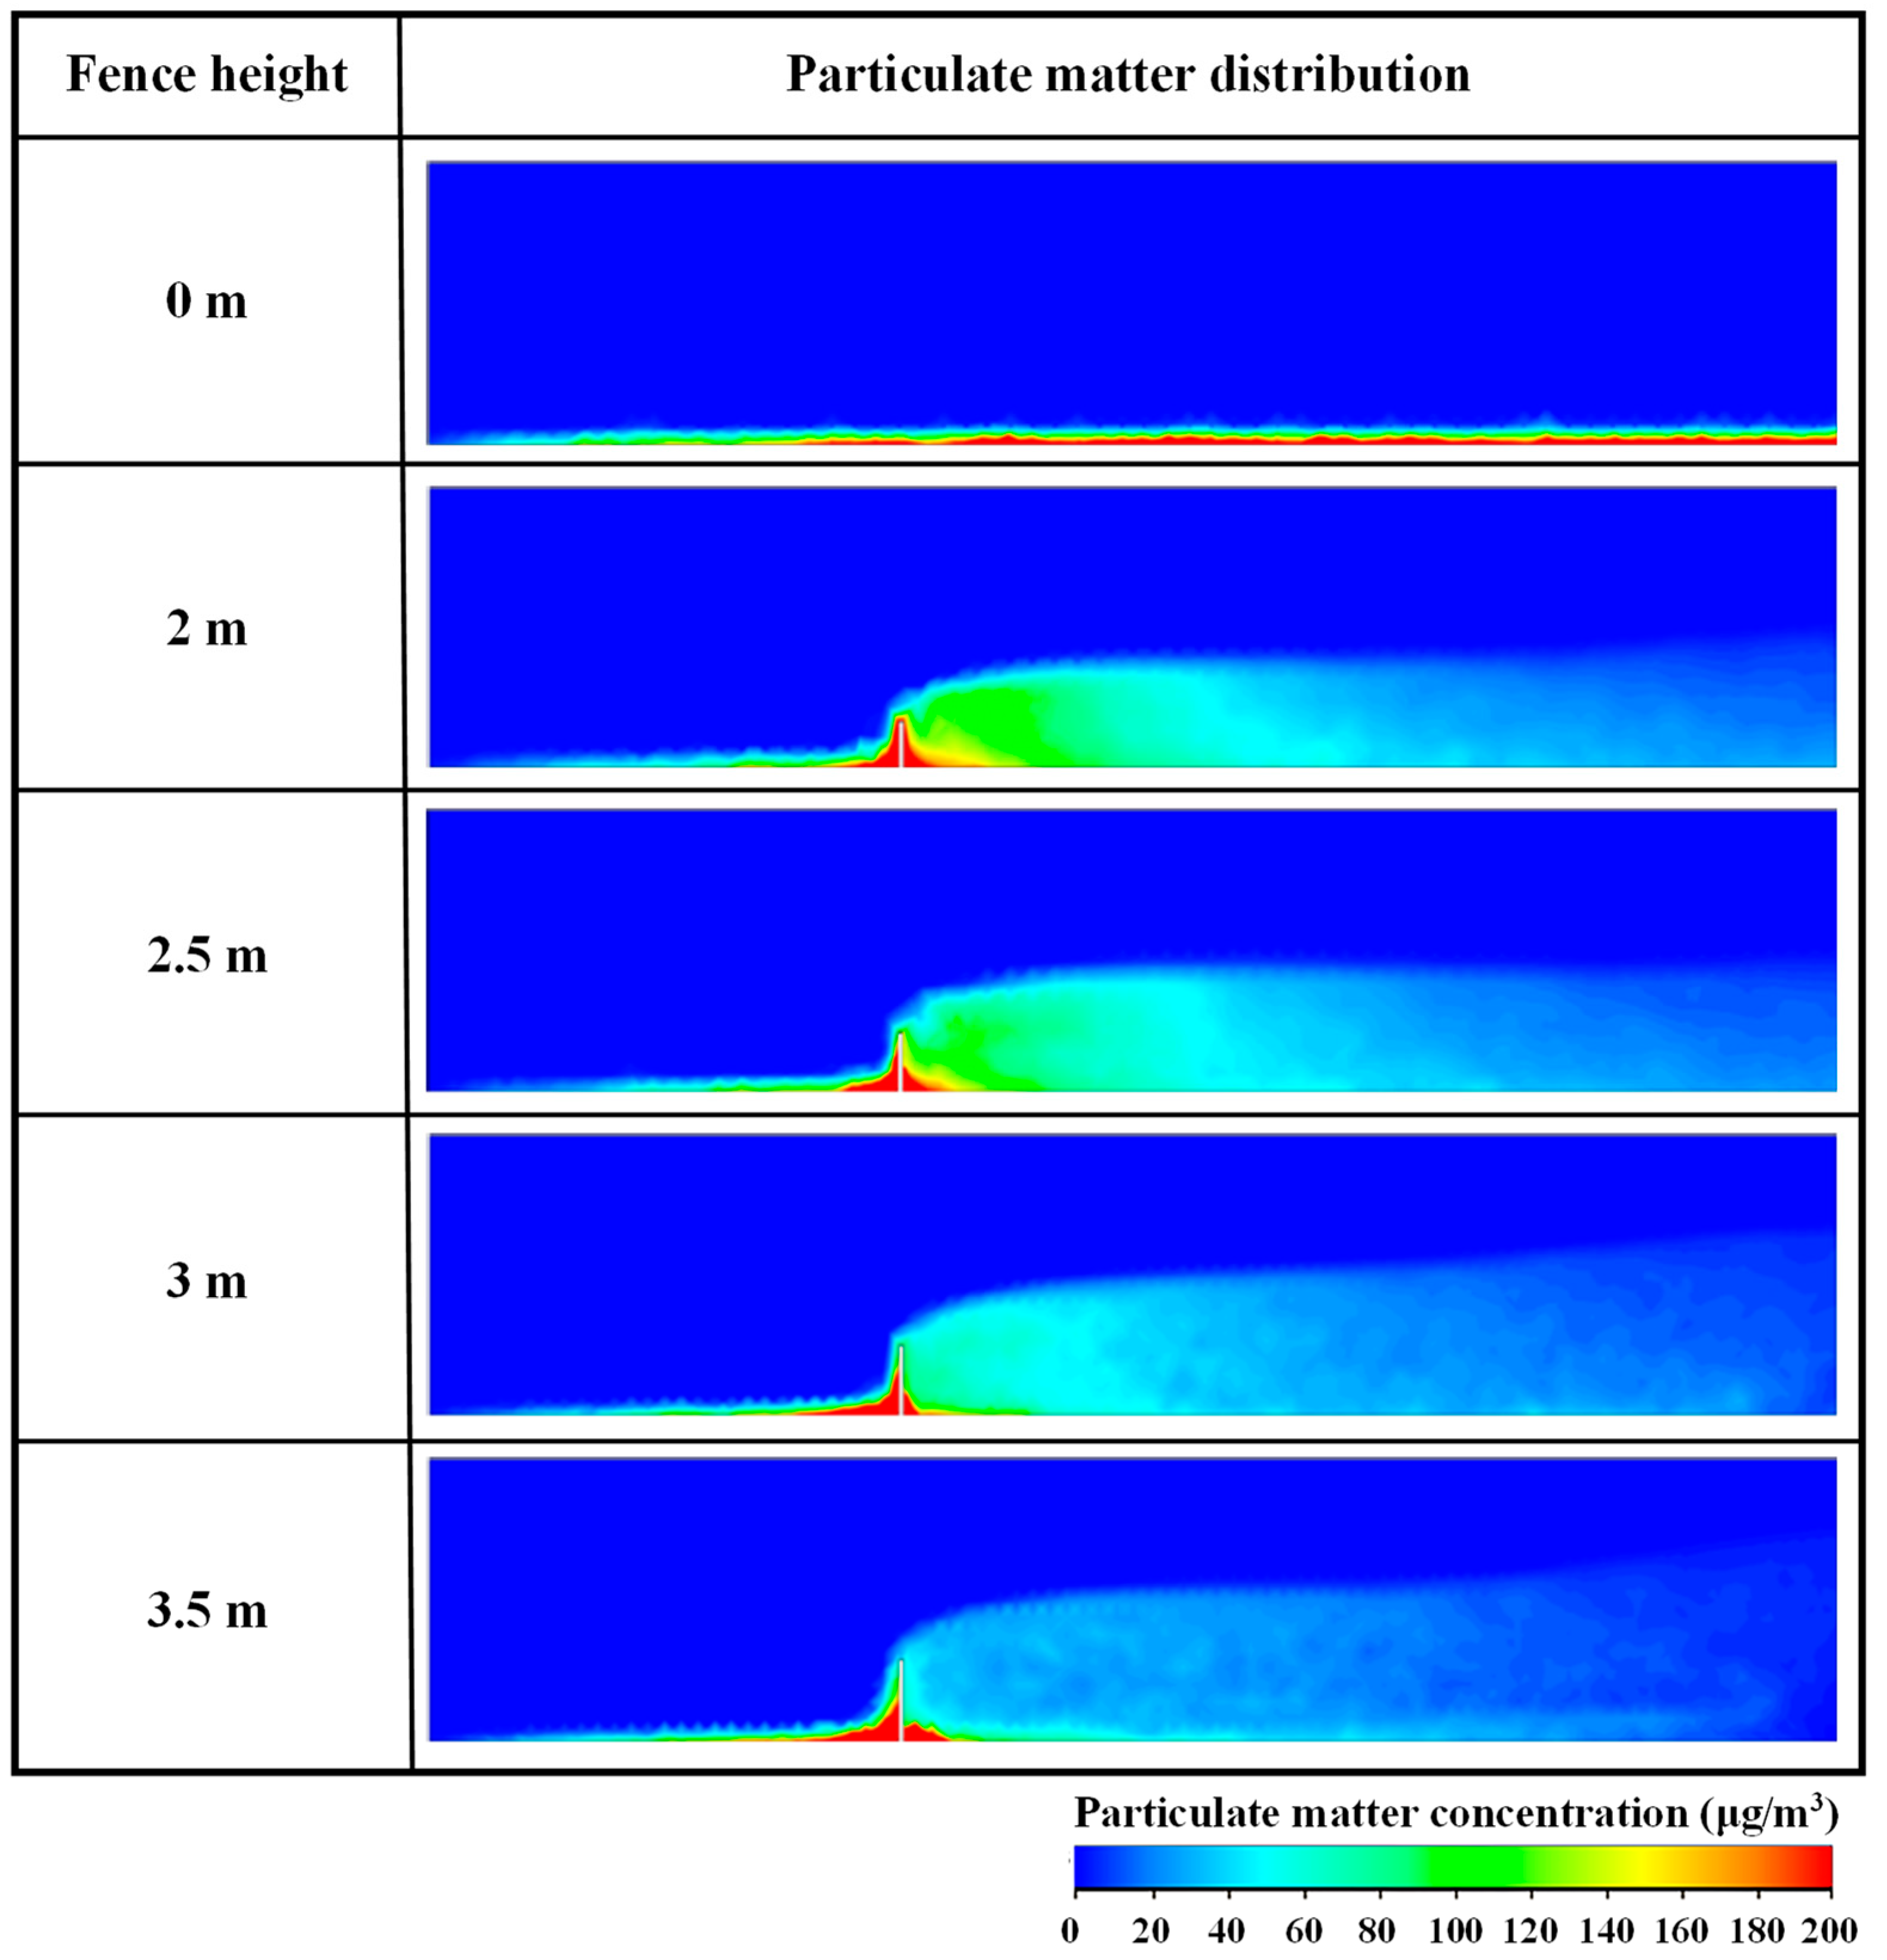
4.3. Effect of Different Enclosure Heights on Concentration Distribution of Dust Particles
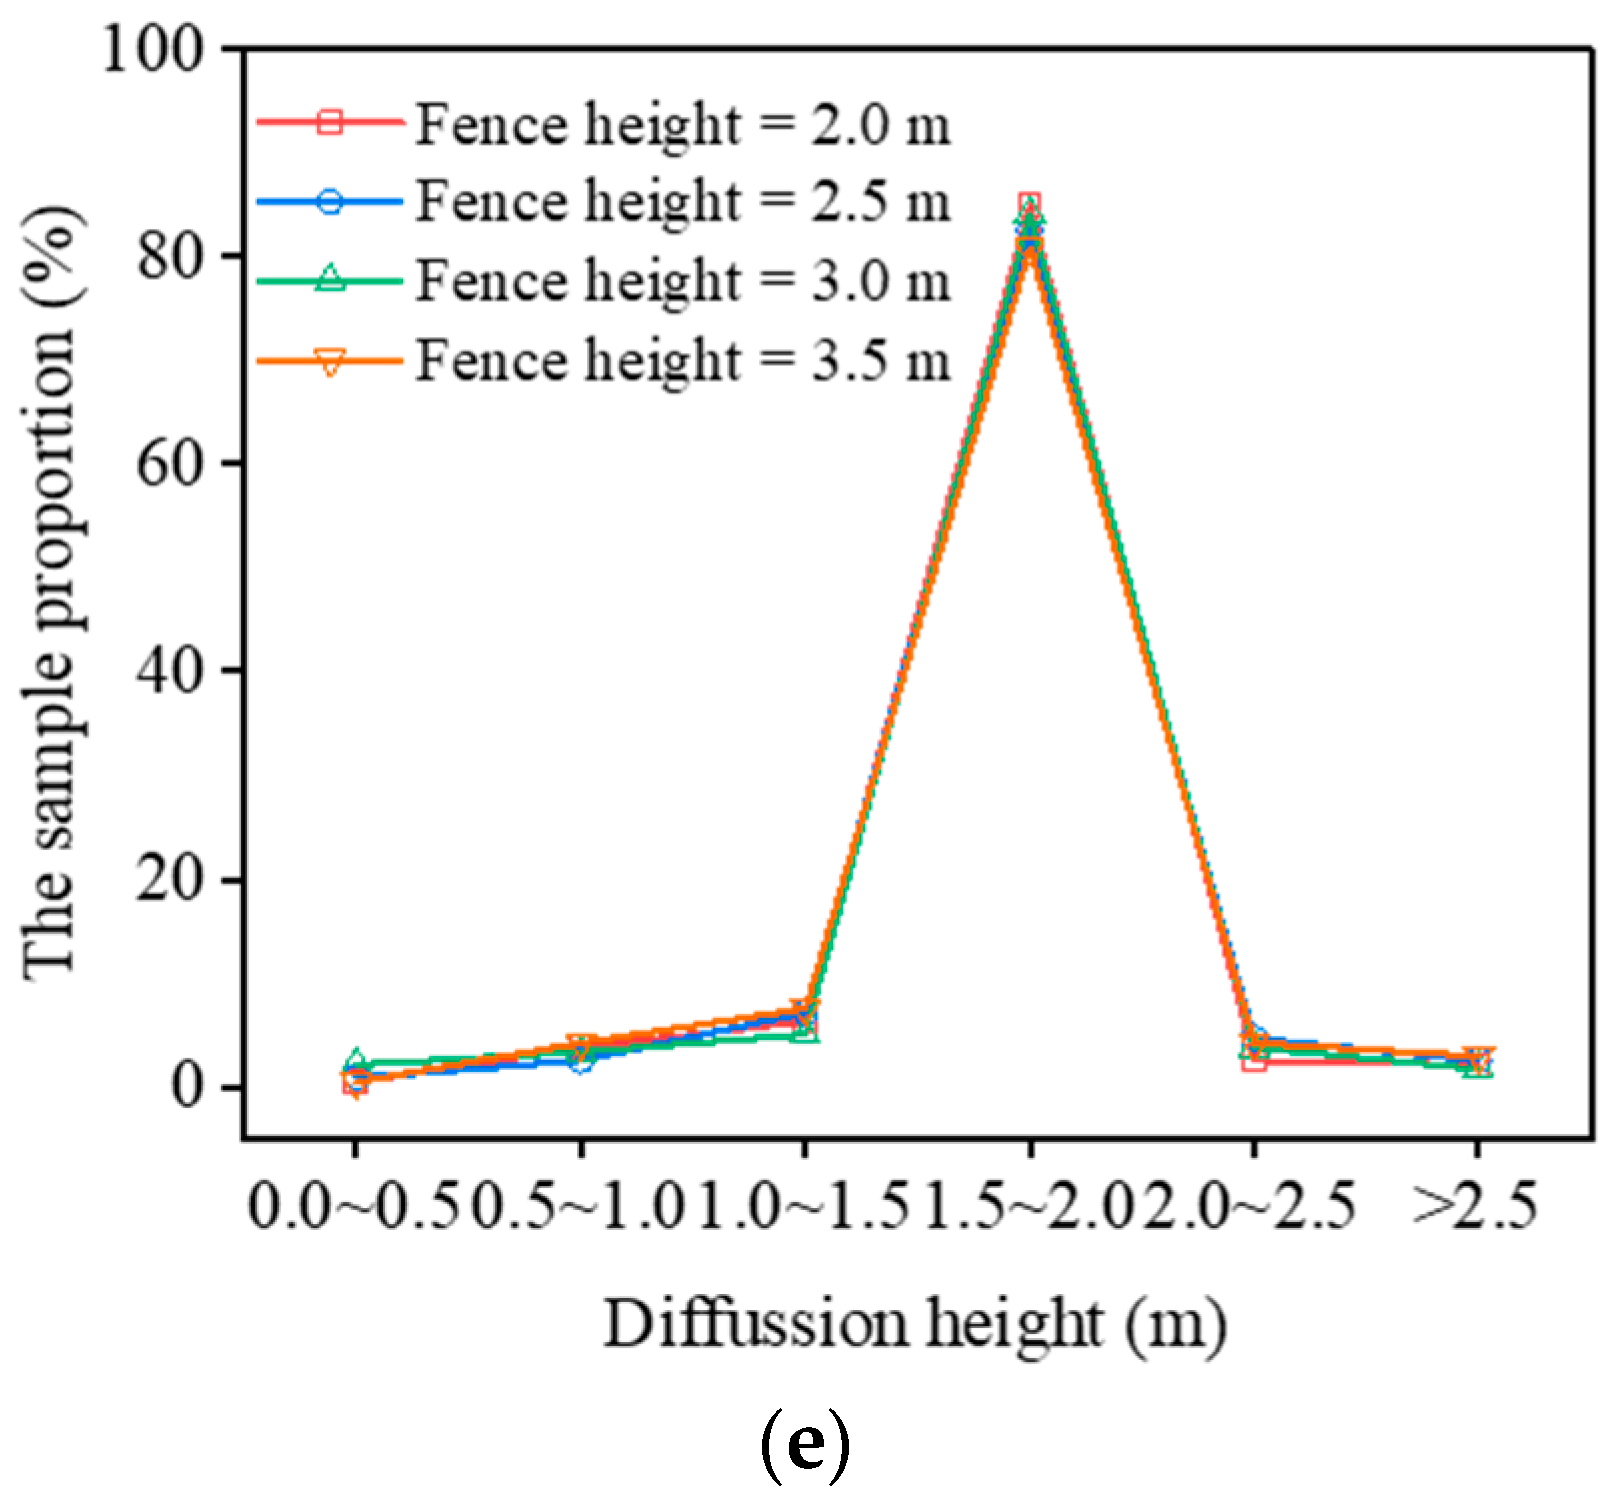
4.4. Effects of Different Wind Speeds and Enclosure Heights on Diffusion Height of Dust Particles
4.5. Comprehensive Control of NPSD
5. Conclusions
Author Contributions
Funding
Institutional Review Board Statement
Informed Consent Statement
Data Availability Statement
Conflicts of Interest
References
- Pianalto, F.S. A remote sensing model of construction-related soil disturbance in southern Arizona. In Proceedings of the Conference on Sensors, Systems, and Next-Generation Satellites XIV, Toulouse, France, 20–23 September 2010; Spie-Int Soc Optical Engineering: Toulouse, France, 2010. [Google Scholar]
- Luo, Q.M.; Huang, L.P.; Xue, X.Y.; Chen, Z.S.; Zhou, F.B.; Wei, L.H.; Hua, J.M. Occupational health risk assessment based on dust exposure during earthwork construction. J. Build. Eng. 2021, 44, 15. [Google Scholar] [CrossRef]
- Luo, Q.M.; Huang, L.P.; Liu, Y.H.; Xue, X.Y.; Zhou, F.B.; Hua, J.M. Monitoring Study on Dust Dispersion Properties during Earthwork Construction. Sustainability 2021, 13, 8451. [Google Scholar] [CrossRef]
- Sanfelix, V.; Escrig, A.; Lopez-Lilao, A.; Celades, I.; Monfort, E. On the source inversion of fugitive surface layer releases. Part II. Complex sources. Atmos. Environ. 2017, 158, 27–35. [Google Scholar] [CrossRef]
- Muleski, G.E.; Cowherd, C.; Kinsey, J.S. Particulate emissions from construction activities. J. Air Waste Manage. Assoc. 2005, 55, 772–783. [Google Scholar] [CrossRef] [PubMed] [Green Version]
- Yao, Z.Y.; Yao, K.; Zhuang, P.Z.; Zhang, K. Study on discharge and diffusion of raised dust during subgrade construction in the Yellow River flood area. In Proceedings of the 4th International Conference on Technology of Architecture and Structure (ICTAS 2011), Xian Univ Architecture & Technol, Xi’an, China, 22–24 September 2011; Trans Tech Publications Ltd., Xian Univ Architecture & Technol: Xi’an, China, 2011; pp. 759–763. [Google Scholar]
- Xue, Y.-F.; Zhou, Z.; Huang, Y.-H.; Wang, K.; Nie, T.; Nie, L.; Qin, J.-P. Fugitive Dust Emission Characteristics from Building Construction Sites of Beijing. Huan Jing Ke Xue = Huanjing Kexue 2017, 38, 2231–2237. [Google Scholar]
- Liu, W.; Huang, X.H.; Chen, H.P.; Han, L.Y. Analyzed and Simulated Prediction of Emission Characteristics of Construction Dust Particles under Multiple Pollution Sources. Comput. Intell. Neurosci. 2022, 2022, 12. [Google Scholar] [CrossRef]
- Sun, J.; Shen, Z.X.; Zhang, L.M.; Lei, Y.L.; Gong, X.S.; Zhang, Q.; Zhang, T.; Xu, H.M.; Cui, S.; Wang, Q.Y.; et al. Chemical source profiles of urban fugitive dust PM2.5 samples from 21 cities across China. Sci. Total Environ. 2019, 649, 1045–1053. [Google Scholar] [CrossRef]
- Pang, X.-C.; Han, X.-Y.; Shi, J.-W.; Bao, Y.-Z.; Ning, P.; Zhang, C.-N.; Xiang, F. Pollution Characteristics and Health Risk of Heavy Metals in Fugitive Dust Around Zhaotong City. Huan Jing Ke Xue = Huanjing Kexue 2022, 43, 180–188. [Google Scholar]
- Behrooz, R.D.; Tashakor, M.; Asvad, R.; Esmaili-Sari, A.; Kaskaoutis, D.G. Characteristics and Health Risk Assessment of Mercury Exposure via Indoor and Outdoor Household Dust in Three Iranian Cities. Atmosphere 2022, 13, 18. [Google Scholar]
- Liu, S.; Zhang, X.H.; Zhan, C.L.; Zhang, J.Q.; Xu, J.; Wang, A.; Zhang, H.D.; Xu, J.Y.; Guo, J.L.; Liu, X.L.; et al. Evaluating heavy metals contamination in campus dust in Wuhan, the university cluster in Central China: Distribution and potential human health risk analysis. Environ. Earth Sci. 2022, 81, 13. [Google Scholar] [CrossRef]
- Xie, Z.; Xu, M. Technology on pollution prevention of urban construction fugitive dust. In Proceedings of the 2009 International Conference on Management and Service Science (MASS), Wuhan, China, 16–18 September 2009; p. 5. [Google Scholar]
- Xu, Y.; Yang, D.; Zhang, Y. Tunnel construction dust monitoring and dust control technology of high altitude and high and cold area. Appl. Mech. Mater. 2014, 587–589, 703–708. [Google Scholar] [CrossRef]
- Azarov, V.N.; Manzhilevskaya, S.E.; Petrenko, L.K. Environmental monitoring of ecological safety during construction works. IOP Conf. Ser. Mater. Sci. Eng. 2019, 698, 055003. [Google Scholar] [CrossRef]
- Fuchs, N.A.; Dailey, R.E.; Davies, C.N. The Mechanics of Aerosols. Phys. Today 1965, 18, 249. [Google Scholar] [CrossRef]
- Li, N.; Long, X.; Tie, X.X.; Cao, J.J.; Huang, R.J.; Zhang, R.; Feng, T.; Liu, S.X.; Li, G.H. Urban dust in the Guanzhong basin of China, part II: A case study of urban dust pollution using the WRF-Dust model. Sci. Total Environ. 2016, 541, 1614–1624. [Google Scholar] [CrossRef]
- Ketchman, K.; Bilec, M. Quantification of Particulate Matter from Commercial Building Excavation Activities Using Life-Cycle Approach. J. Constr. Eng. Manag. 2013, 139, 10. [Google Scholar] [CrossRef]
- Srimuruganandam, B.; Nagendra, S.M.S. Chemical characterization of PM10 and PM2.5 mass concentrations emitted by heterogeneous traffic. Sci. Total Environ. 2011, 409, 3144–3157. [Google Scholar] [CrossRef] [PubMed]
- Rai, P.; Gupta, T. Chemical Speciation and Source Apportionment of Airborne Coarse Particles at Kanpur. In Measurement, Analysis and Remediation of Environmental Pollutants; Gupta, T., Singh, S.P., Rajput, P., Agarwal, A.K., Eds.; Springer-Verlag Singapore Pte Ltd.: Singapore, 2020; pp. 131–141. [Google Scholar]
- Azarmi, F.; Kumar, P.; Mulheron, M. The exposure to coarse, fine and ultrafine particle emissions from concrete mixing, drilling and cutting activities. J. Hazard. Mater. 2014, 279, 268–279. [Google Scholar] [CrossRef] [PubMed] [Green Version]
- Azarmi, F.; Kumar, P.; Mulheron, M.; Colaux, J.L.; Jeynes, C.; Adhami, S.; Watts, J.F. Physicochemical characteristics and occupational exposure to coarse, fine and ultrafine particles during building refurbishment activities. J. Nanopart. Res. 2015, 17, 19. [Google Scholar] [CrossRef] [Green Version]
- Faber, P.; Drewnick, F.; Borrmann, S. Aerosol particle and trace gas emissions from earthworks, road construction, and asphalt paving in Germany: Emission factors and influence on local air quality. Atmos. Environ. 2015, 122, 662–671. [Google Scholar] [CrossRef]
- Chalvatzaki, E.; Aleksandropoulou, V.; Glytsos, T.; Lazaridis, M. The effect of dust emissions from open storage piles to particle ambient concentration and human exposure. Waste Manag. 2012, 32, 2456–2468. [Google Scholar] [CrossRef]
- Mueller, S.F.; Mallard, J.W.; Mao, Q.; Shaw, S.L. Variability of Natural Dust Erosion from a Coal Pile. J. Appl. Meteorol. Climatol. 2015, 54, 3–14. [Google Scholar] [CrossRef]
- Li, T.-K.; Feng, Y.-C.; Bi, X.-H.; Zhang, Y.-F.; Wu, J.-H. Main Problems and Refined Solutions of Urban Fugitive Dust Pollution in China. Huan Jing Ke Xue = Huanjing Kexue 2022, 43, 1323–1331. [Google Scholar]
- Chen, Y.X.; Wu, Y.H.; Ma, J.; An, Y.F.; Liu, Q.Y.; Yang, S.H.; Qu, Y.J.; Chen, H.Y.; Zhao, W.H.; Tian, Y.X. Microplastics pollution in the soil mulched by dust-proof nets: A case study in Beijing, China. Environ. Pollut. 2021, 275, 8. [Google Scholar] [CrossRef]
- Kim, H.G.; Kim, M.K.; Kim, B.E.; Yoon, H.Y. Optimization of fugitive dust control system according to weather conditions. In Proceedings of the 9th International Conference on Environmental Science and Technology, Rhodes Isl, Greece, 1–3 September 2005; Univ Aegean: Rhodes Isl, Greece, 2005; pp. A762–A767. [Google Scholar]
- Li, Z.L.; Guo, H.D.; Zhang, L.; Liang, D.; Zhu, Q.; Liu, T.; Zhou, H. Time-Series Monitoring of Dust-Proof Nets Covering Urban Construction Waste by Multispectral Images in Zhengzhou, China. Remote Sens. 2022, 14, 3805. [Google Scholar] [CrossRef]
- Jose, J.; Srimuruganandam, B. Application of micro-morphology in the physical characterization of urban road dust. Particuology 2021, 54, 146–155. [Google Scholar] [CrossRef]
- Li, M.; Du, H.P.; Zhou, L.; Chai, S.X.; Wang, M. Analysis on the applicability of modified polyvinyl alcohol (MPA) for temporary controlling the dust from soil in construction site. J. Air Waste Manag. Assoc. 2021, 71, 422–432. [Google Scholar] [CrossRef] [PubMed]
- Piras, L.; Dentoni, V.; Massacci, G.; Lowndes, I.S. Dust dispersion from haul roads in complex terrain: The case of a mineral reclamation site located in Sardinia (Italy). Int. J. Min. Reclam. Environ. 2014, 28, 323–341. [Google Scholar] [CrossRef]
- Dong, Z.; Qi, Q.; Yu, W.; Zhou, X.; Wu, X. Numerical simulation about concentration of raising dust caused by trackless rubber tire vehicle in auxiliary haulage roadway. Chin. J. Environ. Eng. 2016, 10, 5755–5762. [Google Scholar]
- Hu, S.; Liao, Q.; Wang, H.; Feng, G.; Xu, L.; Huang, Y.; Shao, H.; Gao, Y.; Hu, F. Gas-solid two-phase flow at high-gassy fully mechanized within high gassy coal seam. J. China Coal Soc. 2019, 44, 3921–3930. [Google Scholar]
- Cao, P.; Zhang, B.T. Research and Implementation of Suppression Method of Dust Pollution Environment in Large-Scale Construction. Ekoloji 2019, 28, 2813–2823. [Google Scholar]
- Zhao, X.-Y.; Cheng, S.-Y.; Tian, G.; Guo, X.-R.; Wang, H.-Y. Construction fugitive dust pollution and control in Beijing. J. Beijing Univ. Technol. 2007, 33, 1086–1090. [Google Scholar]
- Jeong, M.; Paul, S.; Chang, J.; Lee, H.K.; Mukhopadhyay, S. Development of Coursework on Studying Fugitive Dust From Construction Site Using Optical-Type Dust Sensor. IEEE Sens. J. 2021, 21, 17318–17326. [Google Scholar] [CrossRef]
- Hilton, J.E.; Cleary, P.W. Dust modelling using a combined CFD and discrete element formulation. Int. J. Numer. Methods Fluids 2013, 72, 528–549. [Google Scholar] [CrossRef]
- Wang, H.; Cheng, W.M.; Sun, B.; Ma, Y.Y. Effects of radial air flow quantity and location of an air curtain generator on dust pollution control at fully mechanized working face. Adv. Powder Technol. 2017, 28, 1780–1791. [Google Scholar] [CrossRef]
- Jia, L.; Wang, D.X.; Yu, C.W.; Liang, B. Research of Dust Transport Rule of Large Difference Chute Based on FLUENT. In Proceedings of the International Conference on Energy Development and Environmental Protection (EDEP), Nanjing, China, 17–19 August 2018; Atlantis Press: Nanjing, China, 2018; pp. 208–215. [Google Scholar]
- Gui, C.G.; Geng, F.; Tang, J.H.; Niu, H.W.; Zhou, F.B.; Liu, C.; Hu, S.D.; Teng, H.X. Gas-solid two-phase flow in an underground mine with an optimized air-curtain system: A numerical study. Process Saf. Environ. Protect. 2020, 140, 137–150. [Google Scholar] [CrossRef]
- Liu, W.; Yuan, Z.; Hu, W.; Wang, Y. Spatial diffusion characteristics and hierarchical control measures of construction dust. Chin. J. Environ. Eng. 2021, 15, 1976–1987. [Google Scholar]
- Eckhardt, B.; Mersmann, A. Transition to turbulence in a shear flow. Phys. Rev. E 1999, 60, 509–517. [Google Scholar] [CrossRef] [PubMed] [Green Version]
- Teodosiu, C.; Ilie, V.; Teodosiu, R. Appropriate CFD Turbulence Model for Improving Indoor Air Quality of Ventilated Spaces. Math. Model. Civ. Eng. 2014, 10, 28–42. [Google Scholar] [CrossRef] [Green Version]
- Zhang, Y.S.; Tang, W.; Li, H.; Guo, J.J.; Wu, J.J.; Guo, Y.F. The Evaluation of Construction Dust Diffusion and Sedimentation Using Wind Tunnel Experiment. Toxics 2022, 10, 412. [Google Scholar] [CrossRef]
- Duan, S.-G.; Jiang, N.; Yang, L.-M.; Zhang, R.-Q. Transport Pathways and Potential Sources of PM2.5 During the Winter in Zhengzhou. Huan Jing Ke Xue = Huanjing Kexue 2019, 40, 86–93. [Google Scholar]
- Wang, Z.S.; Wu, T.; Che, F.; Wang, S.; Zhou, Y.; Qian, X.; Wu, X. Comparison between Domestic and International Ambient Air Quality Standards. Res. Environ. Sci. 2010, 23, 253–260. [Google Scholar]


Disclaimer/Publisher’s Note: The statements, opinions and data contained in all publications are solely those of the individual author(s) and contributor(s) and not of MDPI and/or the editor(s). MDPI and/or the editor(s) disclaim responsibility for any injury to people or property resulting from any ideas, methods, instructions or products referred to in the content. |
© 2023 by the authors. Licensee MDPI, Basel, Switzerland. This article is an open access article distributed under the terms and conditions of the Creative Commons Attribution (CC BY) license (https://creativecommons.org/licenses/by/4.0/).
Share and Cite
Guo, J.; Lin, W.; Li, H.; Zhang, Z.; Qin, X. Numerical Simulation Study on Spatial Diffusion Behavior of Non-Point Source Fugitive Dust under Different Enclosure Heights. Int. J. Environ. Res. Public Health 2023, 20, 4361. https://doi.org/10.3390/ijerph20054361
Guo J, Lin W, Li H, Zhang Z, Qin X. Numerical Simulation Study on Spatial Diffusion Behavior of Non-Point Source Fugitive Dust under Different Enclosure Heights. International Journal of Environmental Research and Public Health. 2023; 20(5):4361. https://doi.org/10.3390/ijerph20054361
Chicago/Turabian StyleGuo, Jinjun, Weiqi Lin, Hao Li, Zhongshan Zhang, and Xiangnan Qin. 2023. "Numerical Simulation Study on Spatial Diffusion Behavior of Non-Point Source Fugitive Dust under Different Enclosure Heights" International Journal of Environmental Research and Public Health 20, no. 5: 4361. https://doi.org/10.3390/ijerph20054361