
User-Specific Route Planning for People with Motor Disabilities: A Fuzzy Approach


1
Center for Research in Geospatial Data and Intelligence, Laval University, Quebec City, QC G1V 0A6, Canada
2
Center for Interdisciplinary Research in Rehabilitation and Social Integration, Laval University, Quebec City, QC G1V 0A6, Canada
*
Author to whom correspondence should be addressed.
ISPRS Int. J. Geo-Inf. 2021, 10(2), 65; https://doi.org/10.3390/ijgi10020065
Submission received: 4 December 2020
/
Revised: 27 January 2021
/
Accepted: 28 January 2021
/
Published: 3 February 2021
Abstract
:Mobility is fundamental for social participation. Everyone benefits from pedestrian networks for their mobility and daily activities. People without disabilities may have little difficulty walking on narrow sidewalks, over potholes, and so on. However, people with motor disabilities (PWMD) may find it more difficult to deal with such conditions. For PWMD, even routine trips are often fraught with problems, with many different obstacles restricting their mobility and consequently rendering their participation in social and recreational activities difficult. The potential problems and risks associated with mobility for PWMD could be significantly reduced if navigation systems provided them with appropriate accessible routes. These routes should consider PWMD’s personal capabilities as well as sidewalk-network conditions. In this paper, we propose a novel approach for computing a user-specific route for PWMD. Such a route is personalized based on the user’s confidence to deal with obstacles such as slopes, uneven pavement, etc. We show how user reported confidence levels could be used to aggregate sidewalk conditions in a routing model to offer user-specific routes. The proposed methodology was developed using a fuzzy approach and is evaluated by manual wheelchair users in Quebec City.
1. Introduction
According to the United Nations Convention on the Rights of People with Disabilities [1], there is a consensus about the need for equal access to the physical environment regardless of people’s capabilities [2]. People with motor disabilities (PWMD) represent a significant portion of the overall population, and many are users of pedestrian networks [3,4]. For PWMD, routine trips are often fraught with problems, with many different obstacles restricting their mobility. For example, they may experience diverse obstacles on sidewalks, such as high curbs, steps, uneven surfaces, and long inclines. These obstacles may be especially challenging in an unfamiliar environment. Although routing applications are used increasingly by people in their mobility, most of the commonly used routing applications do not consider the special needs of PWMD, and consequently, are not helpful to their mobility. In fact, a one-size-fits-all solution is not sufficient, and hence, diversities in capabilities and preferences of PWMD must be considered in routing tools development.
According to the hierarchical model of walking needs developed by Alfonzo (2005), the decision-making process that occurs during walking can be categorized into five levels, ranging from the most fundamental, concerning the feasibility of walking (i.e., related to personal limits), to higher-order levels including accessibility, safety, comfort, and pleasure [5]. The same hierarchical structure can be employed to prioritize the needs of PWMD in a routing computation for wheelchair mobility. In this model, feasibility is considered to be affected by the user’s physical condition, age, and weight. In our research, we assume that a PWMD is capable of using his/her mobility assistive technology such as a wheelchair; hence, the feasibility level is implicitly addressed. Thus, accessibility would become the basic need, and safety, comfort, and pleasure would correspond to higher levels. For PWMD, a higher-order need cannot be addressed if the most basic need has not already been met. For example, the landscape and scenery may provide pleasure, but it is irrelevant if accessibility is unsuitable; these considerations become redundant. To satisfy these requirements, there is a need to create accurate datasets that include information on both user profiles (e.g., user capabilities and preferences) and information on aspects of the environment in relation to the mobility task. Relevant environmental characteristics include information on accessibility (e.g., the surface quality of sidewalks), safety (e.g., number of crossings), comfort (e.g., sidewalk widths), and potential user pleasures (e.g., points of interest).
In this paper, the accessibility of pedestrian networks is considered to be a fundamental requirement for determining accessible routes for PWMD. We propose a fuzzy approach to assess accessible routes for target users and personalize each user’s routes based on his/her capabilities. The proposed approach has several advantages, including (1) dealing with vague expressions (e.g., narrow sidewalks) without any need for defining complex if-then rules, and (2) identifying the optimal routes quickly and efficiently. In this approach, first, we thoroughly investigate mobility accessibility criteria to determine the most important ones. The chosen criteria are fuzzified, and the membership functions are generated based on the existing sidewalk standards for PWMD. Then, for each segment of a sidewalk, the chosen criteria are aggregated considering user capabilities, and the cost values in terms of accessibility are calculated. Finally, the proposed approach for user-specific routing is implemented in a web-based platform and was tested by manual-wheelchair users in a neighborhood of Quebec City.
The novelty of our approach resides in its capacity to assess and aggregate diverse interactions of a user with each sidewalk parameters while considering specific users’ capabilities. In the proposed framework, confidence values representing the difficulty level for traveling along each sidewalk segment are determined in such a way that these values can be aggregated and used to calculate the cost value of each segment. Hence, users’ confidence levels with respect to environmental factors are used rather than the value associated with the environmental factors (e.g., very low confidence to move in a steep slope instead of a steep slope value itself). To the best of our knowledge, this is the first time that user confidence levels have been used to evaluate the accessibility of the sidewalks in an urban area. To validate the proposed aggregation method, the calculated cost values using our approach are compared with the values obtained by an if-then rules-based method. Although the results of accessibility evaluation are similar, our approach tackles the issues related to defining and aggregating accurate if-then rules in fuzzy-logic based approaches.
The remainder of this paper is organized as follows: Section 2 provides relevant information found in the literature on routing for PWMD. Section 3 describes our methodology. Section 4 presents a simulation of the proposed methodology for a simple context. In Section 5, the proposed approach is implemented for three manual wheelchair users with different capabilities living in Saint-Roch, Quebec City and determines user-specific routes for them. Section 6 describes the validation process of the proposed methodology. Finally, the paper is concluded in Section 7.
2. Related Works
The past decade has seen the rapid development of accessibility assessment platforms as well as route planning systems for PWMD. For example, crowdsourced solutions do exist, such as [6,7,8,9], which provides information on the accessibility of indoor places. However, there is a lack of accessibility applications that provide the required information for the navigation of PWMD in outdoor urban environments. Several attempts have been made to design and develop personalized routing approaches [10,11,12,13,14,15]. According to Kasemsuppakorn et al. (2014), the main characteristics stated in most of these approaches include identifying the routing criteria based on the perception and experience of PWMD, generating accurate routing network databases in a scalable and affordable manner, developing models and algorithms that reflect the needs and preferences of PWMD, and capturing and adequately quantifying all the parameters that affect routing choices. In this section, we present some of these studies along with their advantages and limitations.
Matthews et al. (2003) and Beale et al. (2006) used a geographical information system (GIS) to generate accessibility maps for wheelchair users in a paper called modeling access with GIS in urban systems (MAGUS). MAGUS employed the feedback of wheelchair users to identify the most important barriers for PWMD, to quantify these, and to incorporate them into the GIS model. They identified and quantified 10 key barriers that impede access and mobility in urban environments including steps, deep gutters, narrow pavements, ramps/local slope, cambers, poor pathway maintenance, raised manhole covers, fixed street furniture, and (un)supervised crossings. In MAGUS, the impedance value (traversal difficulty) of each network segment is calculated using mathematical models and then optimal routes are calculated. This model is sophisticated and necessitates information on sidewalk parameters involving user perceptions.
Kasemsuppakorn and Karimi (2009) developed a model to personalize routing for wheelchair users. The research was focused on user priorities and sidewalk parameters. Sidewalk parameters included slope, surface quality, sidewalk width, steps, distance, and sidewalk traffic. This research used three different weighting methods to modulate the relative importance of the different criteria within the routing calculation, including the absolute restriction method, the relative restriction method, and the path reduction method. Each method was carried out in four steps, including (1) weighting the sidewalk parameters, (2) quantifying the impedance value of each segment, (3) modeling the routes for wheelchair users, and (4) choosing the optimal route. They used an analytical hierarchy process (AHP) method to derive a numerical weight for each sidewalk parameter based on user preferences. A fuzzy logic approach was then used to quantify the impedance of each segment by aggregating parameter weights (e.g., slope weighted by the user) and segment data values (e.g., the slope is 2°). Along similar lines, Hashemi and Karimi (2016) used the AHP approach instead of fuzzy logic to assign an impedance value to each segment. They applied Z-test statistics to compare the accessibility of computed routes to those proposed by Kasemsuppakorn and Karimi (2009). In this paper, a collaborative wayfinding approach was presented to update and augment the pedestrian database considering users’ feedback in the optimal future routes. The quality of the suggested routes was assessed by users and then employed to adjust the database.
In another attempt, Neis (2015) introduced a novel approach to assess and evaluate a personalized routing algorithm for PWMD influenced by wheelchair users’ restrictions and needs. The routing approach was embedded in a network, which was based upon the volunteered geographic information (VGI) derived from Open Street Map (OSM). Since the VGI dataset quality is not completely consistent, the author proposed to use a reliability factor for the computed routes, by which wheelchair users could obtain extra information on the quality of the generated routes. The reliability factor was calculated by dividing the lengths of segments that contained values for potential barriers by the total length of that route multiplied by the individual weights. This algorithm was evaluated and tested for an area in Bonn, Germany.
In general, existing mobility aids such as those mentioned above present approaches for providing information regarding the accessibility of outdoor environments based on user profiles. However, most of the research works incorporated only the users’ preferences-assigned ratings concerning the different criteria (e.g., the width vs. the slope) and did not thoroughly consider the capability of users for various categories of each criterion (e.g., gentle vs. moderate slopes). For PWMD, not only the value of each criterion is extremely important, but also the direction of the criterion (e.g., going down a gentle slope vs. going up a gentle slope). A key strength of the present study is that we use the perceptions of PWMD concerning both their preferences and capabilities, the latter expressed through confidence levels in order to assess optimal routes.
3. A Fuzzy Approach for User-Specific Route Planning for PWMD
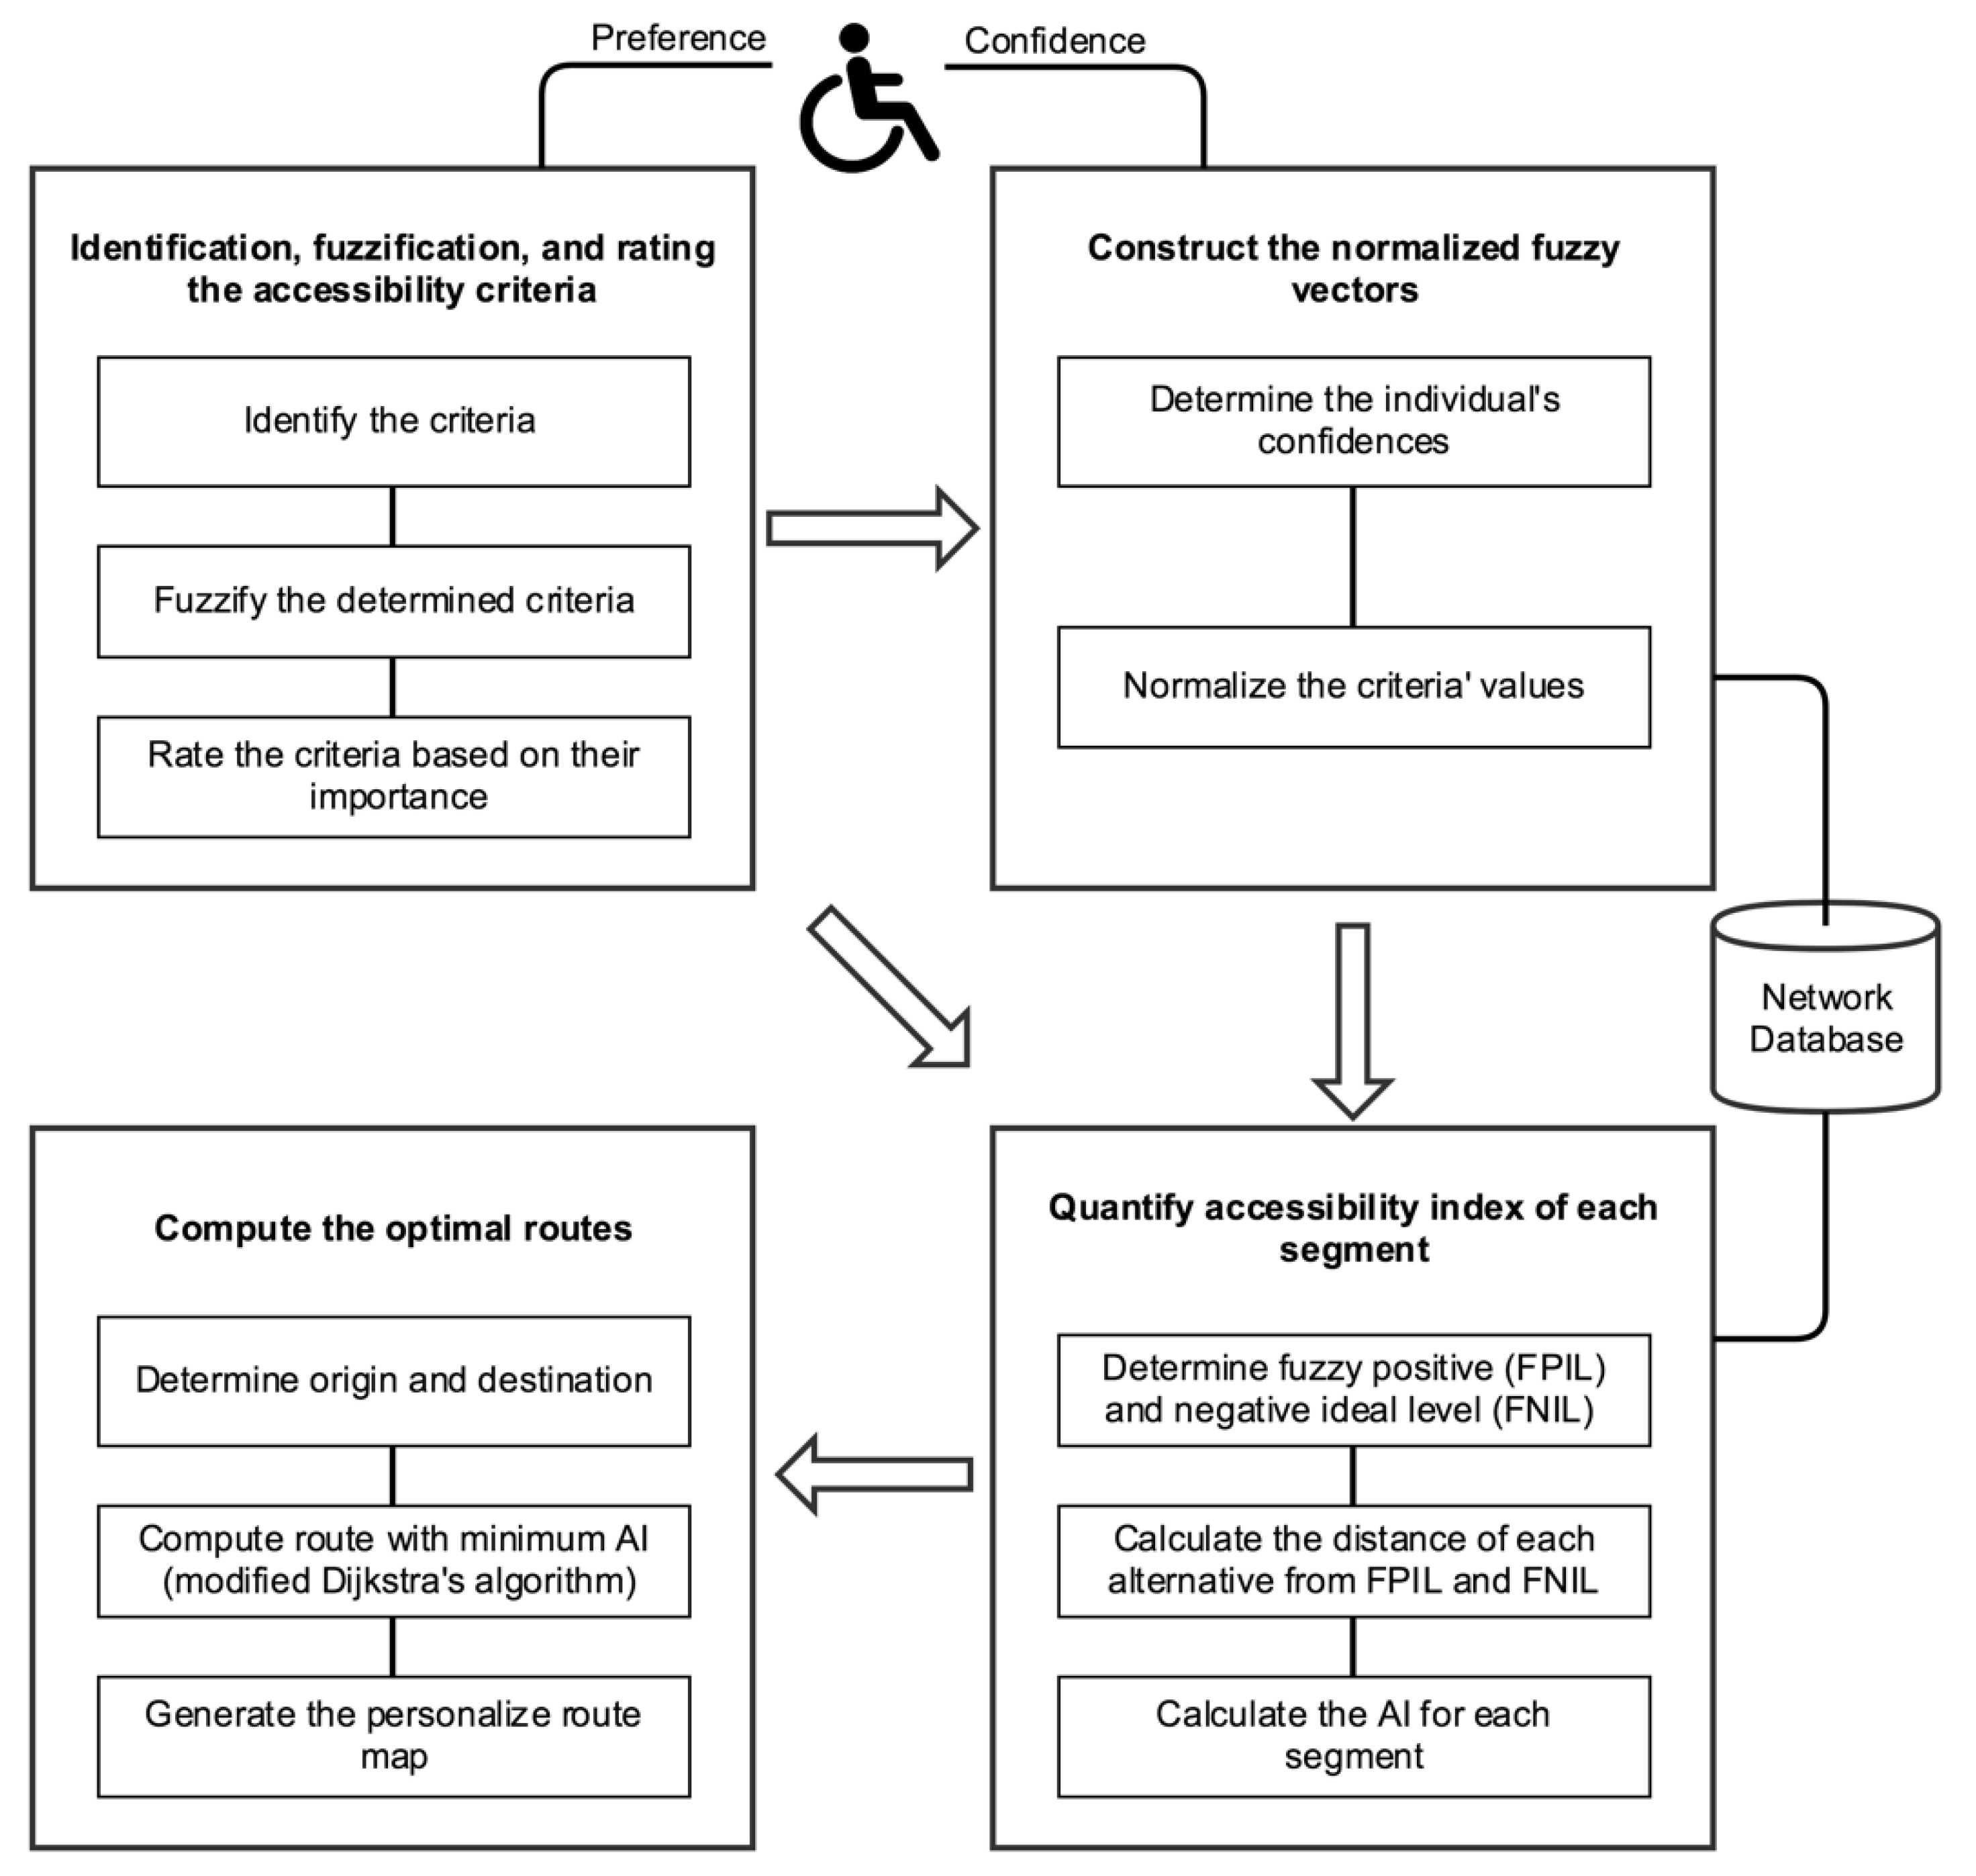
In general, route-planning algorithms for PWMD are composed of two steps, including the quantification of route segment cost values as well as the route calculation. The quantification of route cost values consists of determining weights for the criteria of each network segment based on the individual preferences concerning what makes a segment favorable for travel. The weighted segments are then used for the optimal route calculation process. These weights may vary in relation to concepts such as distance and time. For example, the cost function for the shortest route simply sums the lengths of all segments as the weights of segments along a given route. Ordinarily, the optimal route is calculated by solving a corresponding minimization problem. In this study, accessibility levels are assigned to the cost values of segments, which are in turn calculated by aggregating user capabilities with respect to multiple properties of a sidewalk segment. The proposed approach is based on the foundations of the fuzzy theory for the evaluation of the accessibility levels and includes four main steps:
- Step 1: identifying, fuzzifying, and rating of accessibility criteria;
- Step 2: constructing normalized fuzzy vectors;
- Step 3: quantifying an accessibility index ();
- Step 4: representing the cost of each segment and computing the optimal routes.
Figure 1 illustrates the steps of the proposed methodology. These steps are explained in detail in the following sections.
3.1. Step1: Identification, Fuzzification, and Rating of the Accessibility Criteria
The role of this step is to prioritize the sidewalk criteria based on PWMD perceptions and preferences. First, we thoroughly investigate mobility accessibility criteria to determine the most important ones. Then, we fuzzify the chosen criteria based on the existing sidewalk standards for PWMD. Moreover, finally, we rate those criteria based on the user preferences. The details of this process are explained as follows:
3.1.1. Identifying Relevant Criteria from the Perceptions of PWMD
To identify the accessibility criteria, we analyzed the most frequently cited factors in the different relevant studies. Studies included in this assessment were: (1) Kirschbaum et al. (2001) [16], (2) Kirby et al. (2002) [17], (3) Sobek and Miller (2006) [18], (4) Beale et al. (2006) [13], (5) Karimanzira et al. (2006) [19], (6) Kasemsuppakorn and Karimi (2009) [10], (7) Rushton et al. (2011) [20], (8) Neis and Zielstra (2014) [21], and (9) Neis (2015) [15]. The required criteria are divided into static and dynamic factors (for details, see [22]). According to investigated studies, slope, width, surface type, surface quality, segment type, segment length, height changes, snow, and crowds of people were selected as the most important accessibility criteria for routing networks. However, we addressed only the static characteristics of the environment since collecting data on dynamic factors such as snow is complicated. Hence, the employed criteria included (1) slope (S), (2) width (W), (3) surface type (SuT), (4) surface quality (SuQ), (5) segment type (SeT), (6) segment length (SeL) and (7) height changes. These criteria were analyzed for three different segment types, that is, sidewalks, curb cuts, and crosswalks. The ranges of the values for these criteria were retrieved from standards for accessible design such as those proposed by the Americans with Disabilities Act (ADA) [23] and the Guide Pratique d’Accessibilité Universelle [24]. These values were then classified into different subsets based on confidence measurements such as those presented by Rushton (2010) [25], which are determined in the expert group sessions with participation of wheelchair users. The range of values and their subsets are summarized in Table 1.
3.1.2. Fuzzifying the Chosen Criteria
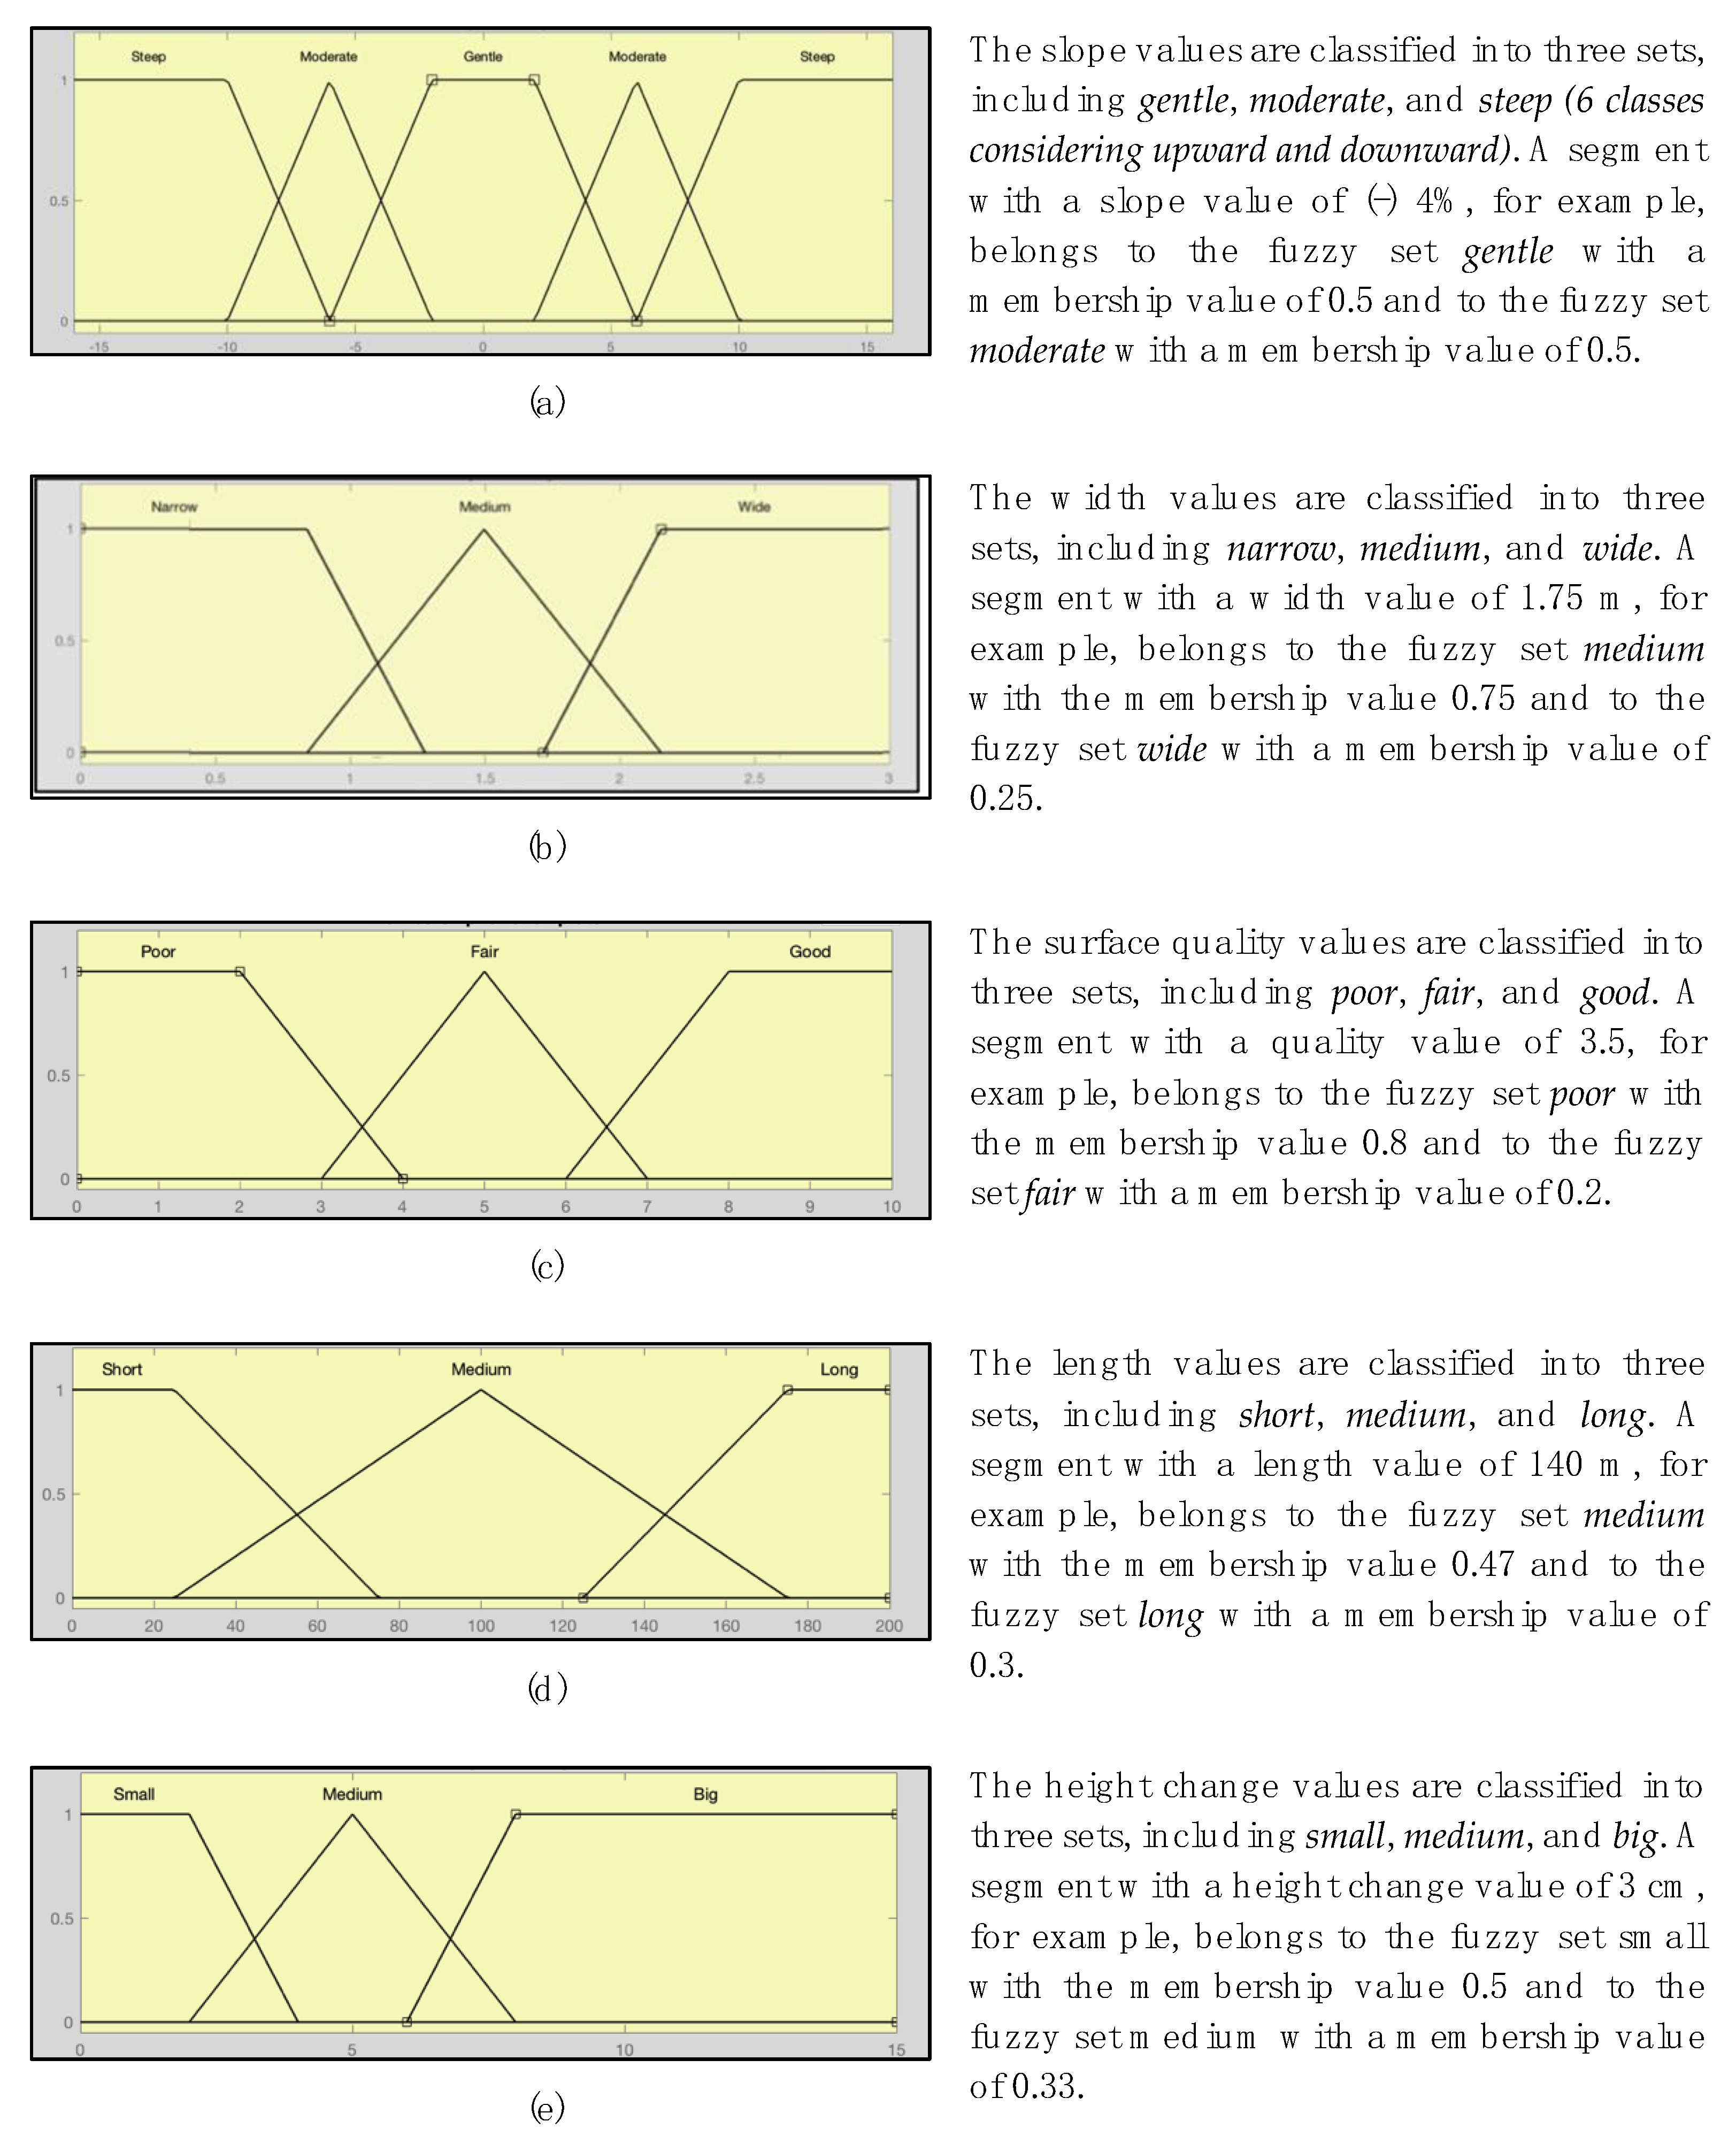
In reality, people use a qualitative way to characterize environmental factors that affect the mobility of PWMD (e.g., narrow sidewalk)—in many cases, precise quantitative values are an inadequate way to describe real-life situations. To address this issue, we converted the crisp values of the different environmental criteria into non-crisp linguistic variables. This process is called “fuzzification” [26] and is performed by defining membership functions. This process was carried out by defining a mathematical function called membership function that serves to map a given value to a set between 0 and 1 [27]. In this paper, membership functions for all the variables were expressed in trapezoidal fuzzy values. Thus, the criteria (S, W, SuT, SuQ, SeT, SeL, HC) are classified into the fuzzy set classes by predefined membership values. For example, the slope (S) can be defined as gentle, moderate, and steep. The slope value, for example, 3%, corresponds to the “gentle and moderate” subsets according to the membership function. In mathematical terms, the fuzzy set of a universe is defined by a membership function such that →〈0, 1〉, where is the membership value of in as defined by Equation (1) below, where is a trapezoidal fuzzy number. Here, represents a criterion that belongs to .
In order to generate the membership functions, the minimum values of different criteria are determined using the ADA [23] and the Guide Pratique d’Accessibilité Universelle [24]. For instance, in all these cases, the minimum value of width for a sidewalk is 91.5 cm and the maximum value of the slope for a sidewalk as 8%. Figure 2 summarizes the membership functions for all the criteria identified in the study.
3.1.3. Rating the Relative Importance of Criteria
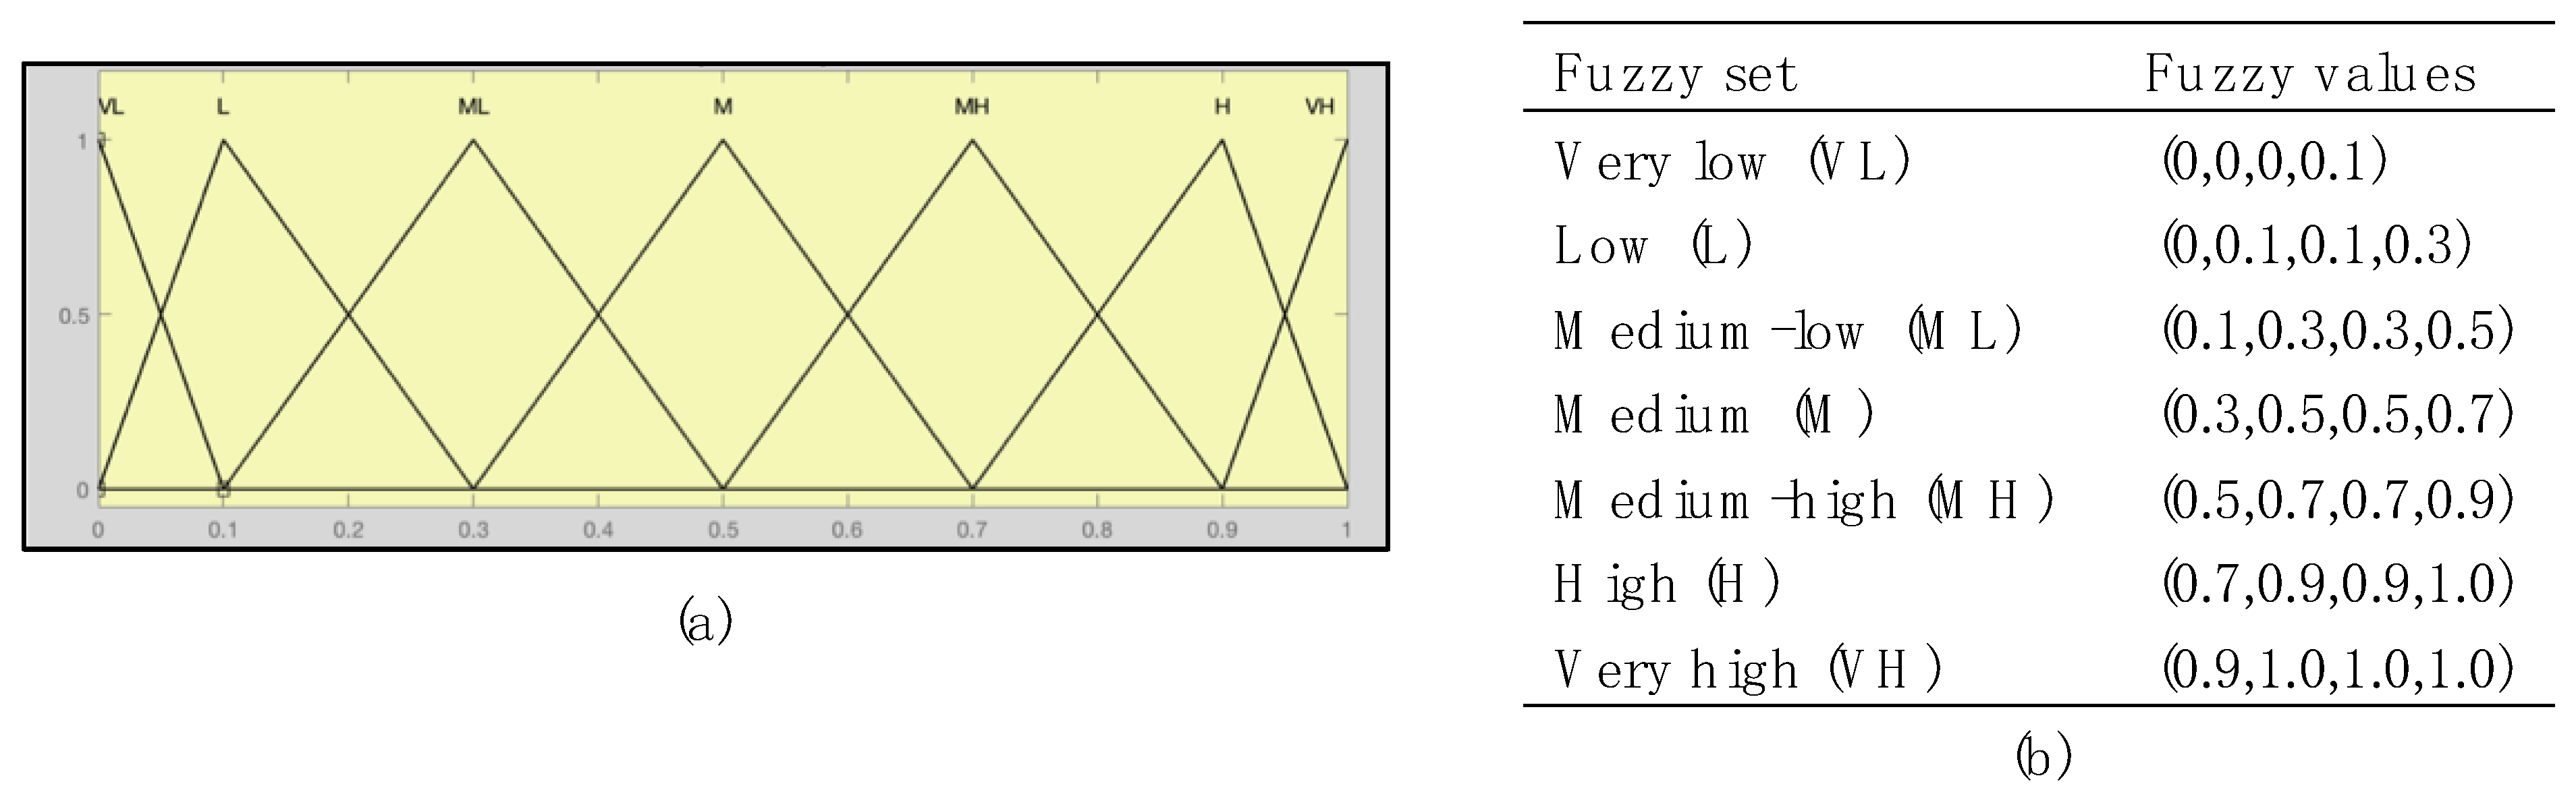
This step’s objective is to rate the relative importance of the different criteria according to individual preferences. The rating can be obtained in two ways: by simply assigning relative importance to each criterion using linguistic variables or by calculating relative importance using a pair-wise comparison of the criteria (AHP, [28]). We chose the former because domain experts from the Center for Interdisciplinary Research in Rehabilitation and Social Integration (CIRRIS) advised us that PWMD may find the latter approach complicated. The relative importance of different variables are expressed using fuzzy sets that are assigned into seven classes, that is, very low (VL), low (L), medium-low (ML), medium (M), medium-high (MH), high (H) and very high (VH) (Figure 3). These values are used in the computation of the user-specific route, which is described in the next sections. In the following section, in addition to the individual’s preferences, we show how the individual’s capabilities can also be reflected in the computation of the accessible routes.
3.2. Step2: Constructing the Normalized Fuzzy Vector Based on the User Confidence Levels
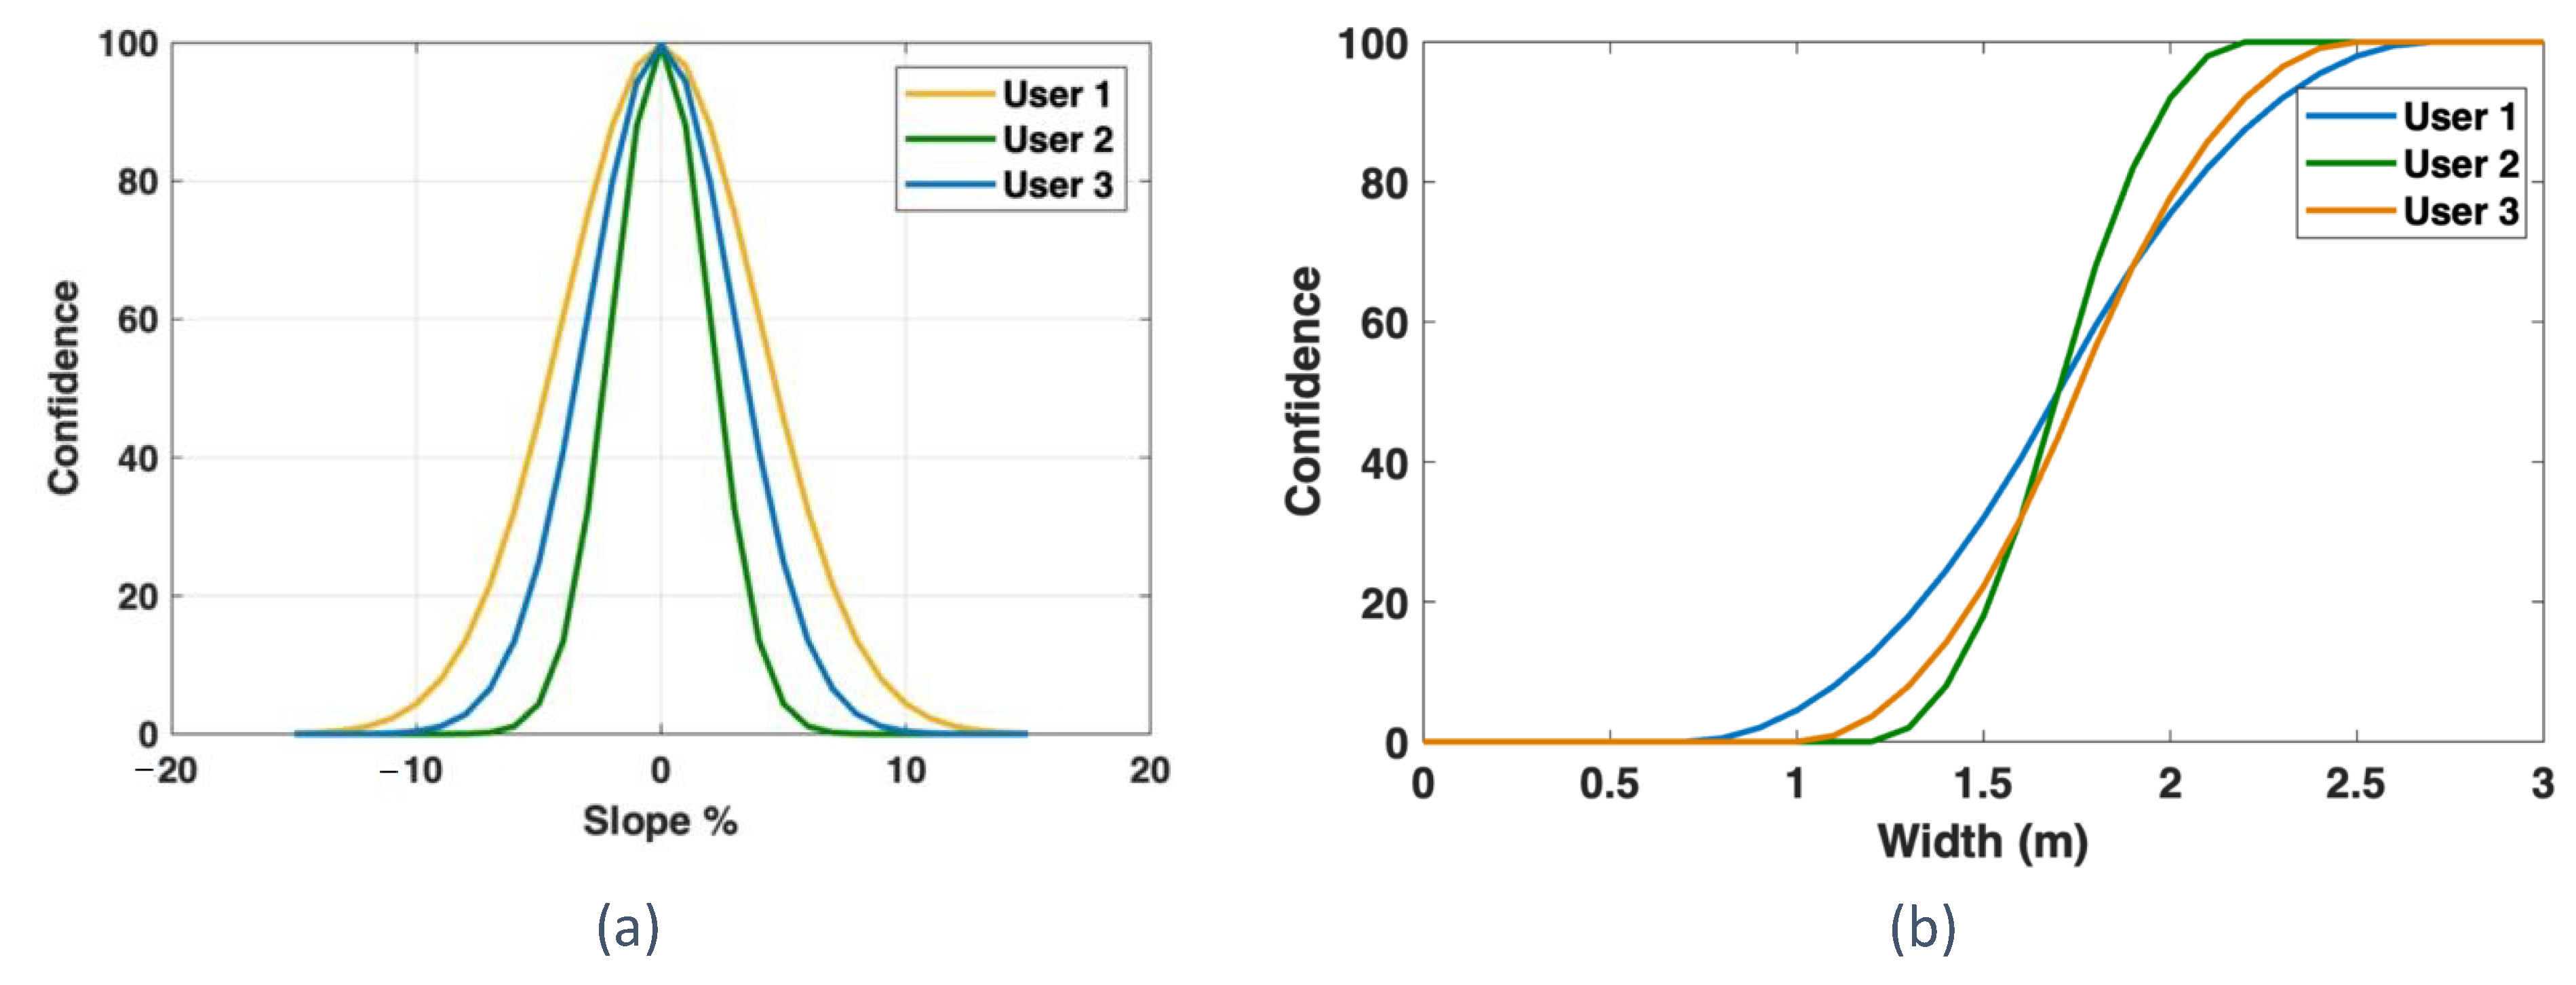
Normalization is a part of the proposed approach, which is usually required in multi-criteria problems as the criteria are often of incongruous dimensions [29,30]. Indeed, by performing this step, the values are transformed into a common scale so that aggregations and comparisons can be carried out. A common way to normalize these values is to transform them to scores ranging from 0 to 1 based on the maximum and minimum values [31]. However, in this study, a different approach is implemented. First, we replaced the values of the criteria (S, W, SuT, SuQ, SeT, SeL, and HC) with their corresponding user confidence values. Then the individual’s confidence level was normalized rather than the value associated with the environmental variable (e.g., very low confidence instead of a steep slope). This process was performed because of the nonlinear relationship between the criteria’s values and its corresponding confidence level. For example, PWMD might have the same feeling for a 2 m and 3 m of width, but these are treated differently by usual normalization methods. This notion is simulated to depict the relationship between the slope and width of a segment and the confidence level of users shown by Figure 4.
We used confidence level as the parameter to measure the PWMDs’ perceived capabilities. Indeed, the confidence level of an individual is a more reliable way to characterize ability than their skill level alone (for more details, refer to [22,32]). This is because, although a person might be able to perform a given task, they may not be confident enough to carry it out. To quantify the confidence levels of individuals, the wheelchair use confidence scale (WheelCon, [25]) was employed. According to WheelCon, the user’s confidence level is expressed using a value between 0 (low confidence) and 100 (high confidence) [25]. These values were then fuzzified into the fuzzy set classes by predefined membership values (very low, low, medium, high, and very high). For example, a segment with a slope value of 8%, which belongs to the fuzzy sets of moderate and steep (see the previous section), might belong to the fuzzy sets of medium confidence and low confidence. Hence, we replaced the values of the variables (, , , ,, , and ) with their corresponding user confidence fuzzy values (, , , ,, , and ). The normalized fuzzy vector is calculated (Equation (2)) and then denoted by .
where represents the individual’s confidence level with respect to the criterion and represents the individual’s maximum confidence level for that criterion. For example, the maximum confidence level of an individual to go up a slope would be the confidence level to go up a gentle slope .
3.3. Step 3: Quantifying Accessibility Indices as a Function of the Cost of Each Segment
Accessibility in the context of mobility is often defined by the ease of reaching a destination with respect to constraints such as distance and time [33]. This definition is used as the basis of several statistical approaches to assess accessibility for pedestrian networks. In each of these studies, accessibility was evaluated by measuring the cost value for each path. In this paper, the cost of each segment and, consequently, the routes were determined by an accessibility index (). The objective of this step was to quantify the accessibility level of each segment of a network for PWMD based on their capabilities. was assigned to a range between [0 1], where 0 implies not accessible and 1 implies a maximum level of accessibility. In some cases, a segment may get two different based on the route direction. The user’s confidence might be different from going up or down a slope, and then the segment will require two different s, one for each direction.
To do so, we were inspired by a fuzzy technique for order of preference by similarity to ideal solution (TOPSIS) approach, which is widely used as a means to compare several solutions for a given problem in multi-criteria decision-making approaches (MCDM), especially where limited subjective input is needed from decision-makers [34]. This approach has the advantage of avoiding the complexities in defining accurate if-then rules, which are commonly used in wayfinding approaches (e.g., fuzzy-logic approach). In order to calculate the cost of segments, first, the weighted normalized fuzzy vector was computed, taking into account the importance of each criterion (), which is defined by Equation (3).
The resulting weighted and normalized fuzzy vectors are then used to calculate the fuzzy positive ideal condition (FPIC; the best condition, ) and the fuzzy negative ideal condition (FNIC; the worst condition, ) (Equation (4)). In this study, the determined the vector distance of a given vector (i.e., assigned to a segment) from the FPIC scaled over the range of [FPIC, FNIC]. Hence, and includes the best and least fuzzy values in each criterion for a given user.
Next, the vector distance of a given fuzzy vector from the ideal and worst case ( and ) was calculated, indicating how near and how far was the segment to the most accessible condition and from the less accessible condition, respectively.
Finally, the was calculated as:
The is closer to the and further from as it approaches 0. This means that a lower value of is preferable, so the index is referred to as a cost value [35]. The accessibility index was used as a cost value in the computation of accessible routes for PWMD, which is explained in the following section.
3.4. Step 4: Optimal Routing Computation
As indicated earlier, the was used to compute an optimal route, taking into account the accessibility for an origin-destination pair where the routes with the minimal sum of the costs for each edge were selected. In other words, the route with the lowest overall would be chosen. There are several well-known algorithms for computing an optimal route in a given network—these include Dijkstra’s algorithm [36], the A* method [37] and the Floyd–Warshall algorithm [38]. In this paper, Dijkstra’s algorithm was used to compute the most accessible route considering the direction and prohibiting routing that includes segments that are not accessible. Using this algorithm, all possible unconstrained nodes in every direction are examined, making it computationally expensive because it follows many unnecessary search directions. However, wheelchair route lengths are usually less than 10 km, which suggests that a directional version of Dijkstra’s algorithm would be appropriate [15]. Furthermore, Dijkstra’s algorithm is more appropriate to solve the single-source shortest-path problem, which guarantees an optimal solution [10]. First, we calculated the accessibility of each segment by considering the direction (up or down a slope). Because an individual’s confidence may be affected by going up or down in a segment that contains either a slope or a height change. Thus, for each segment, two AI, including and were determined. Then, as a function of the direction taken along the route, a unique was assigned to the given segment. Any segment with a cost higher than 0.8 ( was considered to be an inaccessible segment and was assigned a negative value, thereby prohibiting routing at that point in the network. To better understand the whole process, we simulate the proposed methodology in a stepwise approach on a simple graph network. Moreover, then we show how this process is implemented and visualized in a real-world application through a cased study.
4. A Stepwise Numerical Simulation
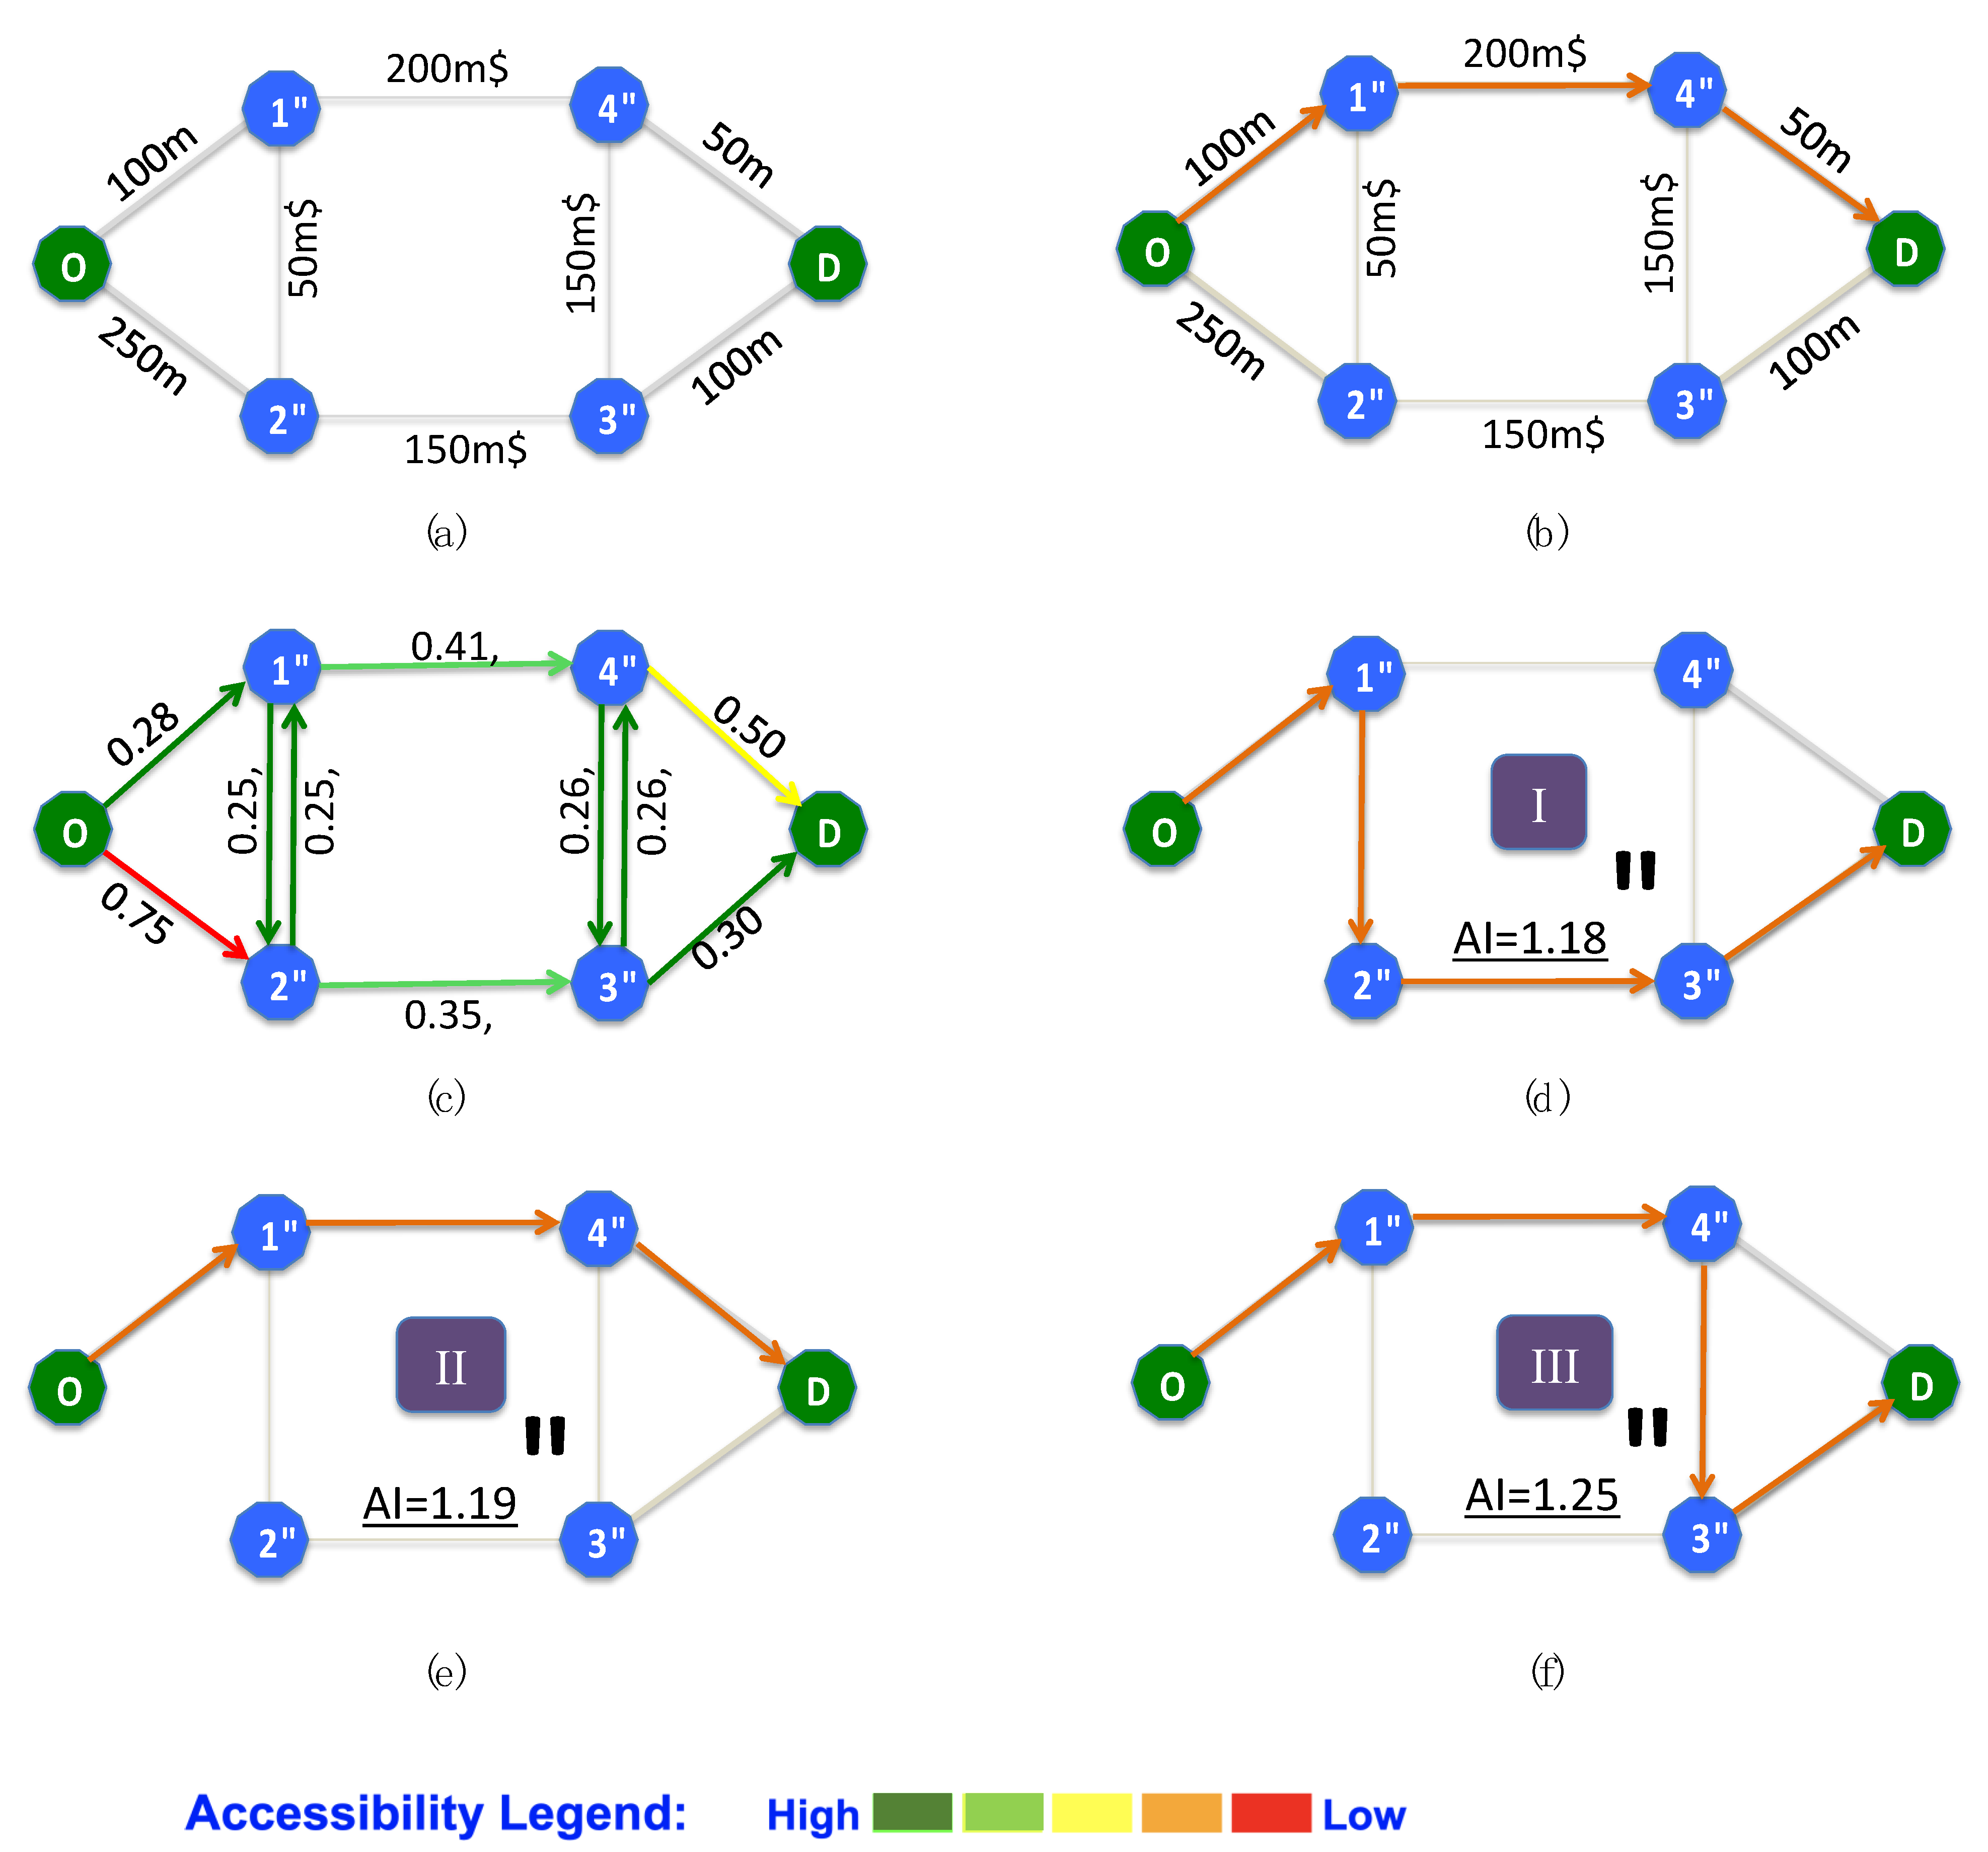
We explored the application of our methodology via a numerical example on a simple graph containing six nodes, which are connected by eight links (shown in Figure 5a). Table 2 demonstrates the attributes of the links of the graph.
We also simulated the confidence levels assigned by a wheelchair user to the different parameters of the segments of the routing network (shown in Table 3). The algorithm was used to calculate the accessibility level of the segments and the user-specific routes between the origin node (O) and the destination node (D). In order to verify the accuracy of the algorithm, we determined the accessibility level for the same links using the Fuzzy Logic approach by defining appropriate rules (for more details, refer to [32]). In order to compare the results derived by both approaches, the relative importance of the different criteria was considered to be equal in both methods.
Computing the AIs According to the Proposed Algorithm
In order to compute the AIs, we transformed the crisp values of the criteria into the fuzzy values by defining the membership functions. The membership functions, including S, W, SuT, SuQ, SeT, SeL, and HC, were expressed as trapezoidal fuzzy values (see Figure 2). Following this step, the membership values of the link attributes need to be determined. For example, a segment with a length value of 140 m belongs to the fuzzy set medium with the membership value 0.47 and to the fuzzy set long with a membership value of 0.3. The individual’s confidence levels were then assigned to the normalized vector according to the derived membership values. To assess the cost value for each segment, the vector distance of the fuzzy vector from the ideal and worst case ( and ) were determined, and consequently, the AI was calculated using Equations (5) and (6). Table 4 shows the results. Figure 5c shows the AIs (i.e., these are called ) and the accessibility level of each segment where “Not Accessible" segments are represented with red, “Low Accessible" segments are yellow, “Accessible" segments are green, and “Very Accessible" segments are dark green. Figure 5b shows the shortest route determined without taking into account the user’s confidence, and Figure 5d–f demonstrate three accessible routes as a function of each user’s confidence levels.
5. Implementation and Case study
For the evaluation and illustration of the method in a real-world routing situation, the proposed method was executed within a web-based GIS tool. An experiment involving the participation of three manual wheelchair users was conducted in the Saint-Roch district, located in the old part of Quebec City, Canada. To carry out the implementation, a graph of the pedestrian network containing nodes and segments from this area was created. The study area includes over 20 streets with more >20 km of sidewalks.
5.1. Collecting the User Confidences and Preferences
The objective of this step was to collect confidence levels as determined by wheelchair users concerning the different parameters needed for the routing network and to rate the criteria in order of importance. To achieve this, a questionnaire was developed asking users to express their confidence with regard to the parameters of each route segment. The output of this questionnaire was used to calculate the cost value for the segments. One of the challenges of this questionnaire was the users’ different understandings of what the criteria meant, which potentially could affect the accessibility assessment results. For example, different individuals might estimate slope subclasses differently. In order to resolve this problem, we proposed a method to extract the users’ perceptions directly from their daily experiences. Rating in order of importance, each parameter in each segment along a trajectory in a real-world experiment was then carried out. These experiments were carried out on the daily routes of wheelchair users. This helped ensure that difficulty levels were treated similarly by different people. The wheelchair users were asked to indicate their confidence level for each segment for three different trajectories. The users chose two familiar trajectories, one they considered easy and the other difficult. The researchers determined the third trajectory. The reason for choosing three trajectories was to include nearly all-possible subclasses of the criteria. For instance, the trajectory considered by the user to be easy might have segments with gentle to moderate slopes, while the difficult trajectory might have moderate to steep slopes. The third trajectory was chosen to cover all remaining subclasses of the parameters and/or to repeat already tested parameters in another context. The three wheelchair users were asked to express their feelings concerning the difficulty level of each parameter for each segment within the trajectory. Following this, the characteristics of each segment were analyzed to determine user confidence for each parameter. For example, user #1 indicated a rate of 30 out of 100 as his confidence level for traversing a segment. The width of this segment was 80 cm, which is categorized as narrow. The procedure was continued for all segments. Finally, the users are asked to express the relative importance of each criterion based on their own preferences. Table 5 presents the results of the confidence and preference values determined for the three wheelchair users.
5.2. Calculating the and Computing the User-specific Route
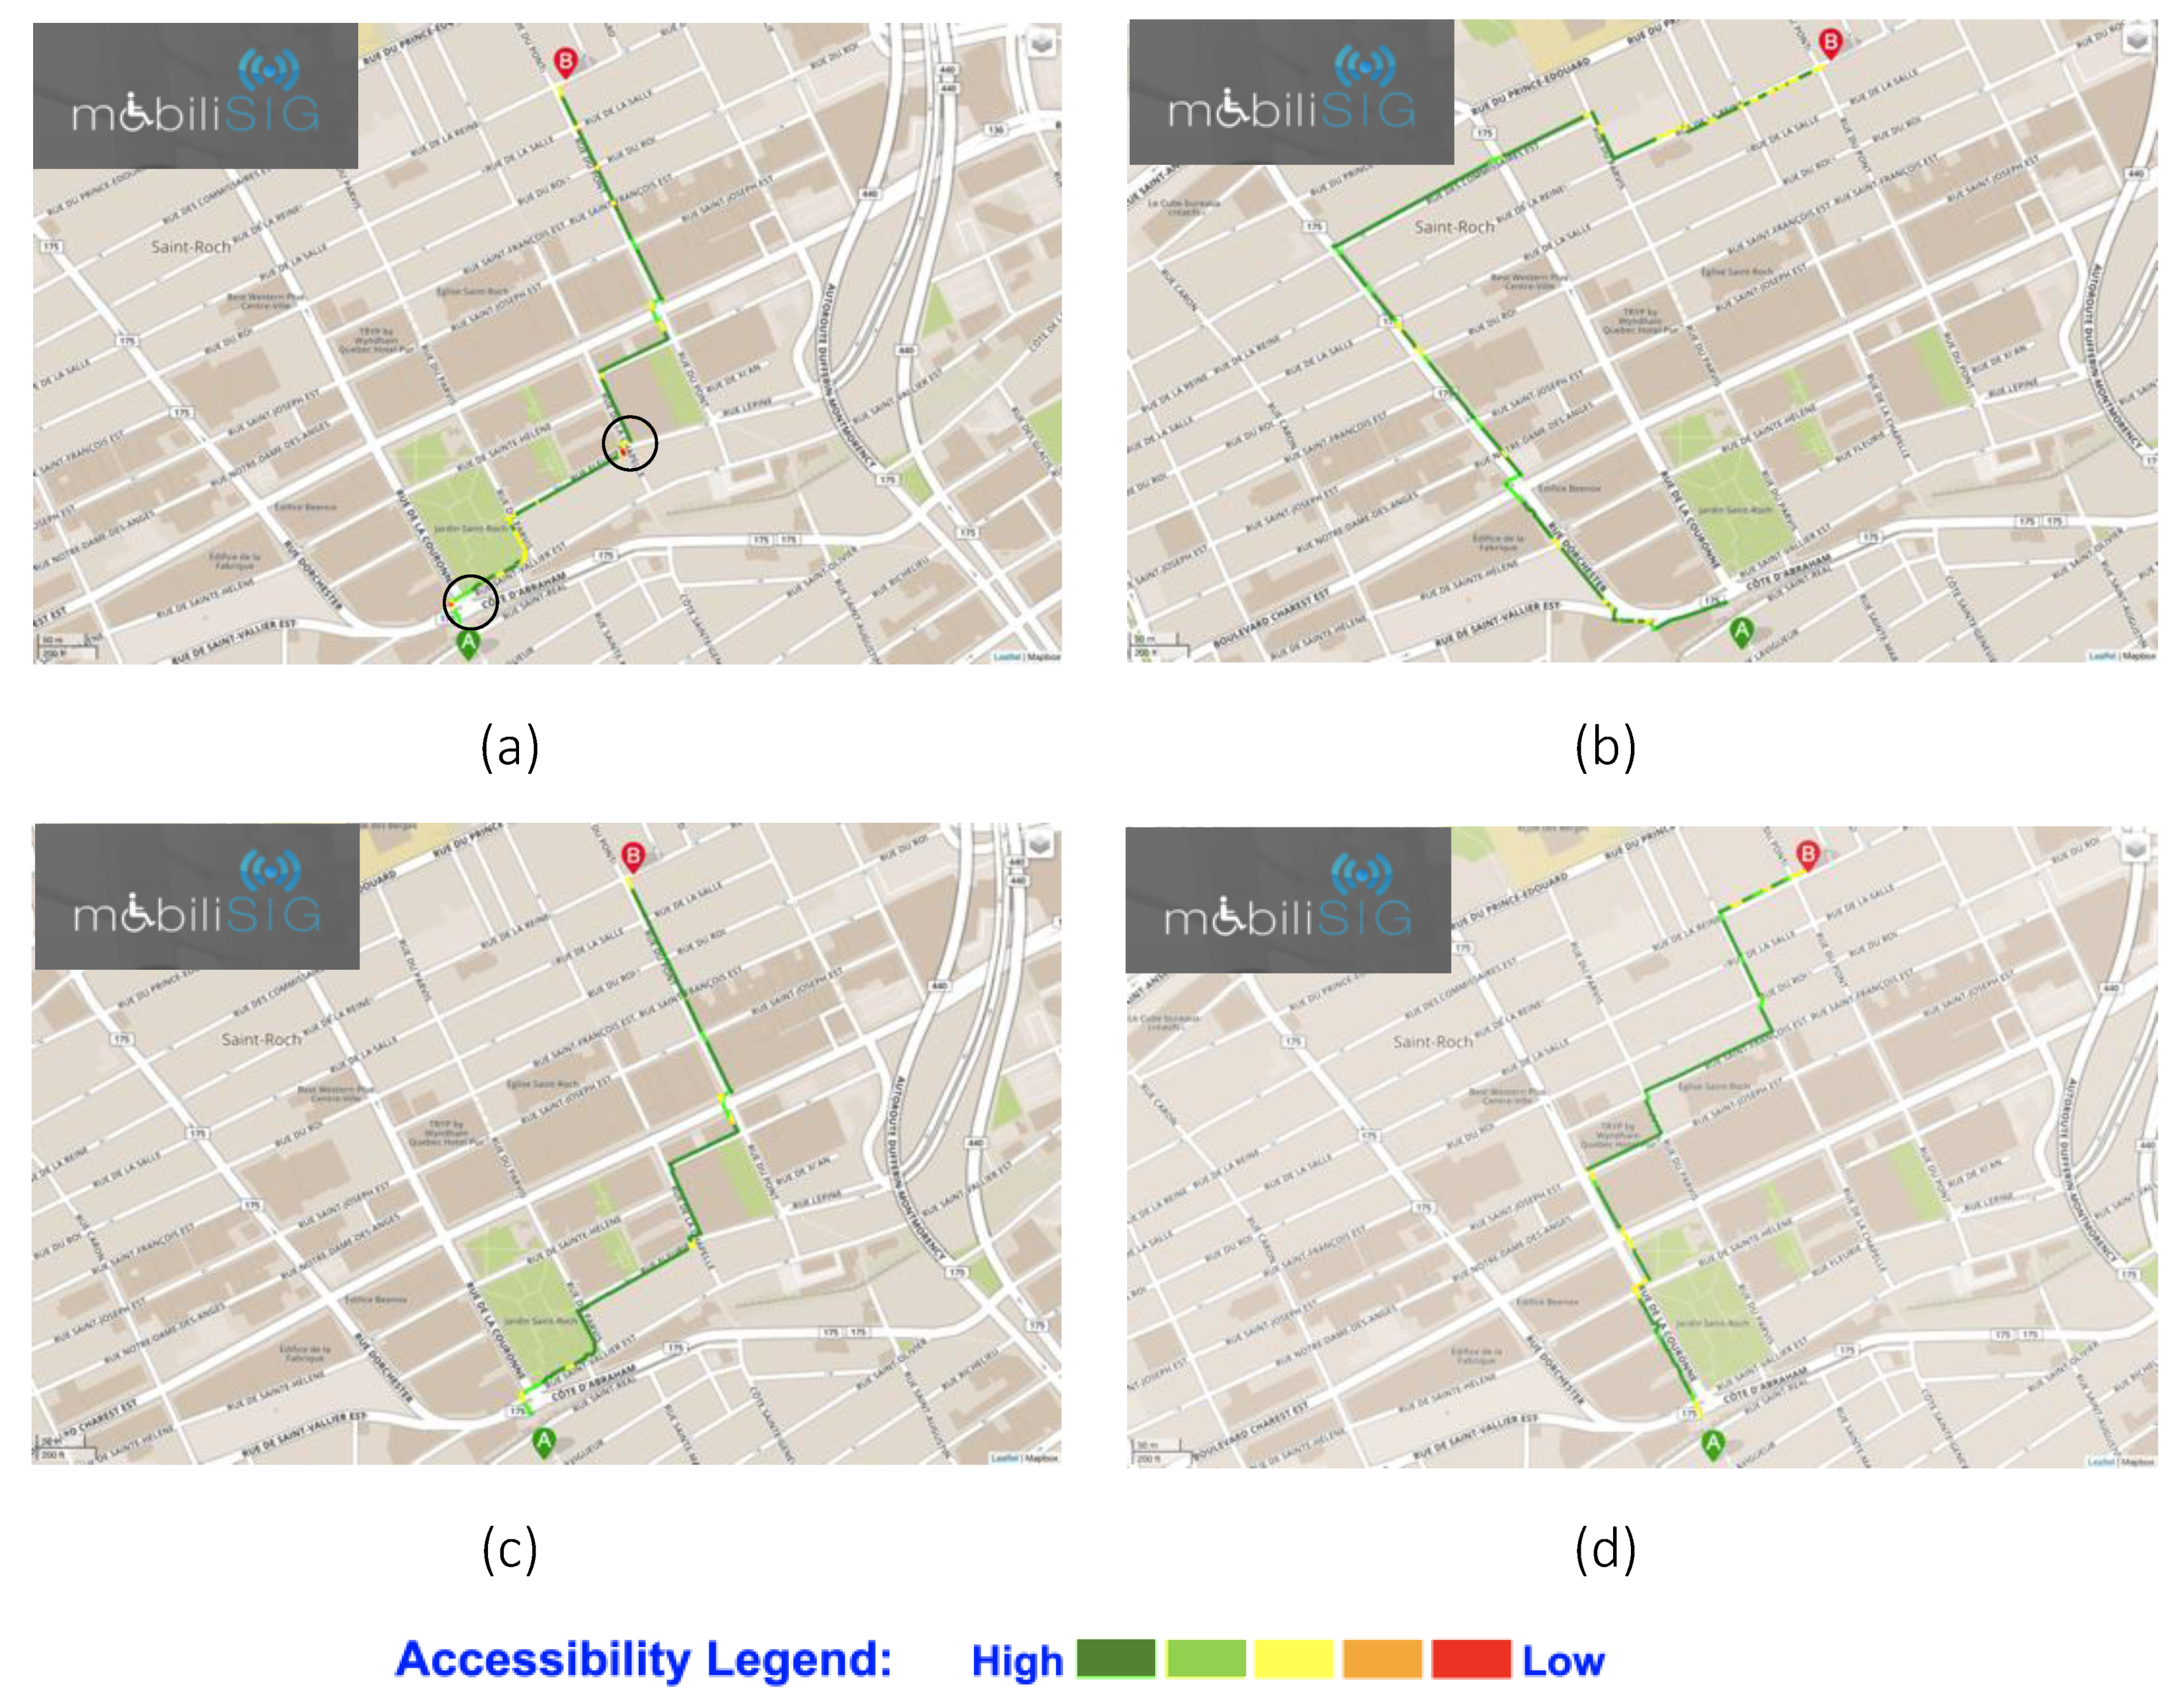
According to the confidence values and the relative importance of each criterion (shown in Table 5), the calculation of the was carried out for each segment in the Saint-Roch neighborhood. These values were determined based on the fuzzy-TOPSIS approach. Computed s were then used as cost values so as to compute the user-specific routes for a given origin-destination pair. The modified Dijkstra algorithm was used to find the optimum route, as explained previously. To illustrate the implementation of our methodology, accessible routes based on the different user profiles were determined for a selected origin and destination in the Saint-Roch area. Figure 6 shows the suggested routes for each participant, as well as the shortest route between a given origin and destination. In this figure, “not accessible" segments are shown in red, “low accessible" segments are represented in yellow, while “accessible" segments are shown in green. As can be seen in Figure 6a, the shortest path includes two segments that are not accessible for the first user. Although the shortest path was the same for all users, the level of accessibility was different among the users. The shortest path is not a priority for users with mobility concerns in their daily life; what matters is a user-specific path, even though this may be longer. Figure 6b–d are user-specific routes obtained by our algorithm for the three different user profiles. These maps illustrate how confidence levels affect the optimal route calculations.
6. Validation and Discussion
In order to validate the proposed method, we recomputed the AIs for the same sidewalk network and the same wheelchair users employing another approach (i.e., Fuzzy Logic () and its associated if-then rules [26]. To employ fuzzy logic, three steps are usually followed: (1) build the ruleset and define the membership functions (fuzzification), (2) develop a fuzzy inference system (FIS) using if-then rules and (3) merge the outputs of the rules and ensure defuzzification of the results using a different set of membership functions to derive output variables [39]. The fuzzification step is done similar to the previously explained process using the same fuzzy sets (e.g., gentle, moderate, and steep for slope) and their corresponding membership functions. We then transformed the membership functions for each segment attribute to determine the user confidence level (e.g., S_Con). The if-then rules were then defined so as to aggregate the individual user confidences and, consequently, calculate the accessibility level of each segment as the output variable. In order to cover all possible combinations of the fuzzy sets associated with the variables, we needed to define rules where is the number of fuzzy set values and is the number of variables. In our case, there were five fuzzy sets, including VL, L, M, H, and VH, and seven variables, including S, W, SuQ, SuT, SeL, SeT, and HC (See Table 1). Therefore, we needed to define (i.e., 78,125) rules. However, defining the accurate rules while developing fuzzy systems is still a challenging task in such applications. For this purpose, we used the rules that have been defined for analyzing the accessibility of sidewalks for PWMD in our previous research (see [22]). Table 6 presents these rules, which are stated as if an aggregation operation would only be applied to two components. In the cases where more than two parameters needed to be aggregated, the result of the first aggregation was aggregated to the next parameter, and the process continued until the final confidence level was obtained.
Once the rules were defined, and the aggregation step was performed, the accessibility index of each segment could be calculated. The output values were used to determine the accessibility levels of the pedestrian network segments within five categories—not accessible (NA), low accessible (LA), medium accessibility (MA), accessible (A), and very accessible (VA). Then, a defuzzification technique was applied to generate exact numerical values from the fuzzy values based on the defined output membership functions. The results (i.e., they are called are shown in Figure 7, which are associated with the AIs driven from the previous approach.
To compare the two calculated vectors, we evaluated the similarity between using the root mean square error (RMSE), which is an indicator that shows the difference between sets of values [40]. The calculated RMSE of the results, , was 0.09 which shows a very subtle disagreement between two vectors. It means that the proposed methodology can be a proper alternative to the commonly used approaches in wayfinding (e.g., fuzzy-logic), which incorporates a complexity in defining accurate if-then rules.
In the light of the research results and the validation presented here, we can highlight several advantages of the proposed methods for helping PWMD in their mobility and social participation. Most of the routing approaches do not consider the personal factors of the users in proposing optimal routes. The proposed method is developed based on users’ perceptions and their personal experiences in interaction with various environmental factors. Then, it provides not only the accessibility information but also the possibility of proposing user-specific routes. This facilitates also attributing weights to different environmental factors and their influence on the global accessibility of each segment of a pedestrian network. In the more conceptual level of accessibility assessment itself, as mentioned above, the proposed method is comparable with the fuzzy logic if-then approaches; however, it bypasses their complexity in defining detailed if-then rules. Finally, the proposed approach also has the flexibility allowing the users to change their levels of confidence based on their current personal factors and capabilities. Hence the accessibility level of a path may not only be modified by the dynamic nature of the environmental factors but also with the evolution of personal factors of the users.
Despite the mentioned advantages, using the linear weighting model in the proposed approach may have some limitations in complex situations. For instance, in a mobility scenario, the user may (a) move down from a standard curb, (b) cross an intersection or (c) pass over a hole in the sidewalk. Even if the confidence level of the user with respect to each of these properties is at medium-level, the aggregated confidence levels may not be medium for a wheelchair user in a real situation. Therefore, validation and verification of a fuzzy-based system still need extensive testing with the participation of more users with different levels of capabilities.
7. Conclusions and Future Work
The purpose of the current study was to determine and compute accessible routes for PWMD based on their personal capabilities. In the proposed approach, user capabilities are expressed through confidence levels (representing users’ confidence in their ability to navigate in the presence of specific features such as the slope) in order to assess the cost values of sidewalk segments. The routing process started with an investigation of the most influential criteria that play significant roles in the daily mobility of PWMD. These criteria were fuzzified and then incorporated with user confidence levels. This process allowed us to aggregate different sidewalk criteria while considering users’ confidence about each criterion and then assign a cost value for each sidewalk segment. The aggregation process was done using a Fuzzy-TOPSIS approach and was validated using Zadeh’s (1965) Fuzzy Logic method. The results of this comparison showed that the proposed methodology could be used as an alternative solution to the commonly used approaches in wayfinding (e.g., fuzzy-logic), which are limited because of the necessity for defining accurate if-then rules. A key strength of the present study is that the route planning for PWMD takes into account their perceptions, preferences, and capabilities with respect to the criteria used for accessibility assessment. We have demonstrated how individual preferences and confidence levels affect the computation of optimal routes.
As future work, we plan to carry out a more comprehensive validation of the proposed method with the participation of more users with different levels of capabilities in different cities. We will also expand the scope of research beyond wheelchair users to include people with other physical and even cognitive disabilities who use different mobility devices such as scooters or walkers. We also expect to expand this study to propose a completely accessible and personalized path in a more comprehensive multimodal mobility context (for example, including public transportation) as well as indoor mobility contexts. Finally, we project to include other indices for routing, namely the safety, comfort, and pleasure indices and would explore how the inclusion of these indices can affect the user-specific route planning for PWMD.
Author Contributions
Amin Gharebaghi designed the research, performed the experiments, and wrote the manuscript; Mir-Abolfazl Mostafavi gave instructions for organizing the sections during the writing and revised the manuscript, and Geoffrey Edwards and Patrick Fougeyrollas helped with the revision of the manuscript. All authors have read and agreed to the published version of the manuscript.
Funding
This research was funded by Canadian Institutes of Health Research (CIHR) and the Natural Sciences and Engineering Research Council of Canada (NSERC), grant number FRN: 127796, and by the Ministry of Economy and Innovation of Quebec (MEI) grant number 2018-085. The APC was funded by Natural Sciences and Engineering Research Council of Canada (NSERC) grant number RGPIN-2015-04788.
Data Availability Statement
The data and codes that support the findings of this study are available at the link [https://drive.google.com/drive/folders/1GH20SbZt30jiLpNMkjYJoaArgKaJsuXK?usp=sharing]. The pedestrian network data were derived from the following link, which is publicly available at: [https://www.donneesquebec.ca/recherche/fr/dataset/infrastructure-pietonne].
Acknowledgments
This work was supported by the Canadian Institutes of Health Research (CIHR) and the Natural Sciences and Engineering Research Council of Canada (NSERC), and the Ministry of Economy and Innovation of Quebec (MEI). The authors would like to thank Patrick Morales-Coayla, who helped prepare figures. We would also like to acknowledge interesting inputs to this work from MobiliSIG team members during our various group discussions.
Conflicts of Interest
The authors declare no conflict of interest. The founding sponsors had no role in the design of the study; in the collection, analyses, or interpretation of data; in the writing of the manuscript, and in the decision to publish the results.
References
- UN General Assembly. Convention on the Rights of Persons with Disabilities. GA Res. 2006, 61, 106. [Google Scholar]
- Noreau, L.; Edwards, G.; Boucher, N.; Routhier, F.; Vincent, C.; Gascon, G.H.; Fougeyrollas, P. Enhancing independent community access and participation: Services, technologies, and policies. Oxford Textb. Neurorehabilit. 2015, 399–417. [Google Scholar] [CrossRef]
- Prémont, M.-É.; Vincent, C.; Mostafavi, M.A.; Routhier, F. Geospatial assistive technologies for wheelchair users: A scoping review of usability measures and criteria for mobile user interfaces and their potential applicability. Disabil. Rehabil. Assist. Technol. 2018, 1–13. [Google Scholar] [CrossRef]
- Routhier, F.; Mortenson, W.B.; Demers, L.; Mahmood, A.; Chaudhury, H.; Ginis, K.A.M.; Miller, W.C. Mobility and Participation of People with Disabilities Using Mobility Assistive Technologies: Protocol for a Mixed-Methods Study. JMIR Res. Protoc. 2019, 8, e12089. [Google Scholar] [CrossRef] [PubMed] [Green Version]
- Alfonzo, M.A. To Walk or Not to Walk? The Hierarchy of Walking Needs. Environ. Behav. 2005, 37, 808–836. [Google Scholar] [CrossRef]
- Mobasheri, A.; Deister, J.; Dieterich, H. Wheelmap: The wheelchair accessibility crowdsourcing platform. Open Geospat. Data Softw. Stand. 2017, 2, 1–7. [Google Scholar] [CrossRef]
- Mobasheri, A.; Sun, Y.; Loos, L.; Ali, A.L. Are crowdsourced datasets suitable for specialized routing services? Case study of OpenStreetMap for routing of people with limited mobility. Sustainability 2017, 9, 997. [Google Scholar] [CrossRef] [Green Version]
- Mobasheri, A.; Huang, H.; Degrossi, L.; Zipf, A. Enrichment of OpenStreetMap Data Completeness with Sidewalk Geometries Using Data Mining Techniques. Sensors 2018, 18, 509. [Google Scholar] [CrossRef] [Green Version]
- Mirri, S.; Prandi, C.; Salomoni, P.; Callegati, F.; Campi, A. On Combining Crowdsourcing, Sensing and Open Data for an Accessible Smart City. In Proceedings of the 2014 8th International Conference on Next Generation Mobile Apps, Services and Technologies (Ngmast), Oxford, UK, 10–12 September 2014; pp. 294–299. [Google Scholar]
- Kasemsuppakorn, P.; Karimi, H.A. Personalised Routing for Wheelchair Navigation. J. Locat. Based Serv. 2009, 3, 24–54. [Google Scholar] [CrossRef]
- Kasemsuppakorn, P.; Karimi, H.A.; Ding, D.; Ojeda, M.A. Understanding route choices for wheelchair navigation. Disabil. Rehabil. Assist. Technol. 2014, 1–13. [Google Scholar] [CrossRef]
- Matthews, H.; Beale, L.; Picton, P.; Briggs, D. Modelling Access with GIS in Urban Systems (MAGUS): Capturing the experiences of wheelchair users. Area 2003, 35, 34–45. [Google Scholar] [CrossRef]
- Beale, L.; Field, K.; Briggs, D.; Picton, P.; Matthews, H. Mapping for wheelchair users: Route navigation in urban spaces. Cartogr. J. 2006, 43, 68–81. [Google Scholar] [CrossRef]
- Hashemi, M.; Karimi, H.A. Collaborative personalized multi-criteria wayfinding for wheelchair users in outdoors. Trans. GIS 2016, 1–14. [Google Scholar] [CrossRef]
- Neis, P. Measuring the Reliability of Wheelchair User Route Planning based on Volunteered Geographic Infor-mation. Trans. GIS 2015, 19, 188–201. [Google Scholar] [CrossRef]
- Kirschbaum, J.B.; Axelson, P.W.; Longmuir, P.E.; Mispagel, K.M.; Stein, J.A.; Yamada, D.A. Designing Sidewalks and Trails for Access, Part 2, Best Practices Design Guide; Federal Highway Administration Publication: Washington, DC, USA, 2001.
- Kirby, R.L.; Swuste, J.; Dupuis, D.J.; MacLeod, D.A.; Monroe, R. The Wheelchair Skills Test: A pilot study of a new outcome measure. Arch. Phys. Med. Rehabil. 2002, 83, 10–18. [Google Scholar] [CrossRef]
- Sobek, A.D.; Miller, H.J. U-Access: A web-based system for routing pedestrians of differing abilities. J. Geogr. Syst. 2006, 8, 269–287. [Google Scholar] [CrossRef]
- Karimanzira, D.; Otto, P.; Wernstedt, J. Application of machine learning methods to route planning and navigation for disabled people. MIC 2006, 6, 366–371. [Google Scholar]
- Rushton, P.W.; Miller, W.C.; Lee Kirby, R.; Eng, J.J.; Yip, J. Development and content validation of the Wheelchair Use Confidence Scale: A mixed-methods study. Disabil. Rehabil. Assist. Technol. 2011, 6, 57–66. [Google Scholar] [CrossRef]
- Neis, P.; Zielstra, D. Generation of a tailored routing network for disabled people based on collaboratively collected geodata. Appl. Geogr. 2014, 47, 70–77. [Google Scholar] [CrossRef]
- Gharebaghi, A.; Mostafavi, M.A.; Edwards, G.; Fougeyrollas, P.; Morales-Coayla, P.; Routhier, F.; Leblond, J.; Noreau, L. A Confidence-Based Approach for the Assessment of Accessibility of Pedestrian Network for Manual Wheelchair Users. In International Cartographic Conference; Springer: Cham, Switzerland, 2017; pp. 463–477. [Google Scholar]
- United States Access Board. Americans with Disabilities Act and Architectural Barriers Act Accessibility Guidelines; University of Michigan Library: Ann Arbor, MI, USA, 2004.
- Savard, M.-J. Guide Pratique D’Accessibilité Universelle: Manuel D’Utilisation; CIRRIS: Quebec, QC, Canada, 2010. [Google Scholar]
- Rushton, P.W. Measuring Confidence with Manual Wheelchair Use: A Four Phase, Mixed-Methods Study. Doctoral Dissertation, University of British Columbia, Vancouver, BC, Canada, 2010. [Google Scholar]
- Zadeh, L.A. Fuzzy sets. Inf. Control 1965, 8, 338–353. [Google Scholar] [CrossRef] [Green Version]
- Beynon, M. The application of fuzzy decision tree analysis in an exposition of the antecedents of audit fees. Omega 2004, 32, 231–244. [Google Scholar] [CrossRef]
- Saaty, T.L. Decision making with the analytic hierarchy process. Int. J. Serv. Sci. 2008, 1, 83–98. [Google Scholar] [CrossRef] [Green Version]
- Yoon, K.P.; Hwang, C.-L. Multiple Attribute Decision Making: An Introduction; Sage Publications: Thousand Oaks, CA, USA, 1995; Volume 104. [Google Scholar]
- Zavadskas, E.; Zakarevicius, A.; Antucheviciene, J. Evaluation of ranking accuracy in multi-criteria decisions. Informatica 2006, 17, 601–618. [Google Scholar] [CrossRef]
- Chen, C. Extensions of the TOPSIS for group decicion-making under fuzzy environment. Fuzzy Sets Syst. 2000, 114, 1–9. [Google Scholar] [CrossRef]
- Gharebaghi, A.; Mostafavi, M.-A.; Chavoshi, S.; Edwards, G.; Fougeyrollas, P. The Role of Social Factors in the Accessibility of Urban Areas for People with Motor Disabilities. ISPRS Int. J. Geo Inf. 2018, 7, 131. [Google Scholar] [CrossRef] [Green Version]
- Morris, J.M.; Dumble, P.L.; Wigan, M.R. Accessibility Indicators for Transport Planning. Transp. Res. Part A Gen. 1978, 13, 91–109. [Google Scholar] [CrossRef]
- Olson, D.L. Comparison of weights in TOPSIS models. Math. Comput. Model. 2004, 40, 721–727. [Google Scholar] [CrossRef]
- Malczewski, J. GIS and Multicriteria Decision Analysis; John Wiley & Sons: Hoboken, NJ, USA, 1999. [Google Scholar]
- Dijkstra, E. A note on two problems in connexion with graphs. Numer. Math. 1959. [Google Scholar] [CrossRef] [Green Version]
- Dechter, R.; Pearl, J. Generalized best-first search strategies and the optimality af A*. J. ACM 1985, 32, 505–536. [Google Scholar] [CrossRef]
- Floyd, R. Algorithm 97: Shortest path. Commun. ACM 1962, 344–348. [Google Scholar] [CrossRef]
- Mamdani, E.; Assilian, S. An experiment in linguistic synthesis with a fuzzy logic controller. Int. J. Man. Mach. Stud. 1975, 1–13. [Google Scholar] [CrossRef]
- Hyndman, R.J.; Koehler, A.B. Another Look at Measures of Forecast Accuracy. Int. J. Forecast. 2005, 22, 679–688. [Google Scholar] [CrossRef] [Green Version]
Figure 1.
The overall view of the proposed approach.

Figure 2.
Membership function plots for the accessibility criteria. (a) Slope; (b) Width; (c) Surface quality; (d) Length; (e) Height change.
Figure 2.
Membership function plots for the accessibility criteria. (a) Slope; (b) Width; (c) Surface quality; (d) Length; (e) Height change.

Figure 3.
Relative importance of criteria. (a) Membership function plot; (b) Fuzzy sets, and fuzzy values.
Figure 3.
Relative importance of criteria. (a) Membership function plot; (b) Fuzzy sets, and fuzzy values.

Figure 4.
Simulation of the criteria in respect to users’ confidence levels. (a) Slope value in relation to confidence level; (b) Width value in relation to confidence level.
Figure 4.
Simulation of the criteria in respect to users’ confidence levels. (a) Slope value in relation to confidence level; (b) Width value in relation to confidence level.

Figure 5.
The computed accessible routes using the proposed algorithm. (a) Simple graph; (b) Shortest route; (c) Accessibility Indices; (d–f) Accessible routes from highest to lower rank.
Figure 5.
The computed accessible routes using the proposed algorithm. (a) Simple graph; (b) Shortest route; (c) Accessibility Indices; (d–f) Accessible routes from highest to lower rank.

Figure 6.
Different computed routes for the three wheelchair users. (a) Shortest path for the user #1 (760 m); (b) Personalized route for the user #1 (1210 m); (c) Personalized route for the user #2 (760 m); (d) Personalized route for the user #3 (775 m).
Figure 6.
Different computed routes for the three wheelchair users. (a) Shortest path for the user #1 (760 m); (b) Personalized route for the user #1 (1210 m); (c) Personalized route for the user #2 (760 m); (d) Personalized route for the user #3 (775 m).

Figure 7.
Comparison of accessibility indexes obtained from two different methods.


Table 1.
Accessibility criteria, value ranges, subsets, and their collection methods.
| Criterion | Value’s Range | Subset |
|---|---|---|
| Slope (S) | (−15 15)% | {gentle, moderate, steep} |
| Width (W) | (0 3) m | {narrow, moderate, wide} |
| Surface type (SuT) | {1,2,3,4,5} | {concrete: 1, asphalt: 2, brick: 3, gravel: 4, cobblestone: 5} |
| Surface quality (SuQ) | (0 10) | {good, fair, poor} |
| Segment type (SeT) | {1,2,3,4} | {sidewalk: 1, curbcut: 2, crosswalk with traffic light: 3, crosswalk without traffic light: 4} |
| Segment length (SeL) | (0 ∞) m | {short, medium, long} |
| Height changes (HC) | (0 15) cm | {small, moderate, big} |
Table 2.
Attribute table of the segments.
| S (%) | W (m) | SuT | SuQ | SeT | SeL (m) | HC (Cm) | |
|---|---|---|---|---|---|---|---|
| O-1 | 3 | 1.5 | Concrete | Good | Sidewalk | 100 | 0 |
| O-2 | 8 | 1 | Gravel | Bad | Crosswalk | 250 | −5 |
| 1-2 | −2 | 2 | Concrete | Good | Sidewalk | 50 | 0 |
| 2-1 | 2 | 2 | Concrete | Good | Sidewalk | 50 | 0 |
| 1-4 | 4 | 1.5 | Concrete | Fair | Sidewalk | 200 | 0 |
| 2-3 | 3 | 1.5 | Concrete | Fair | Sidewalk | 150 | 0 |
| 3-4 | 2 | 1.5 | Concrete | Good | Sidewalk | 150 | 0 |
| 4-3 | −2 | 1.5 | Concrete | Good | Sidewalk | 150 | 0 |
| 4-D | −7 | 1.3 | Gravel | Bad | Crosswalk | 50 | −5 |
| 3-D | −4 | 1.7 | Concrete | Fair | Sidewalk | 100 | 0 |
Table 3.
User confidence values for the different criteria.
| S (Up) | S (Down) | ||||||
|---|---|---|---|---|---|---|---|
| Segment attribute | Gentle | Moderate | Steep | Gentle | Moderate | Steep | |
| User confidence | 90 | 65 | 20 | 100 | 80 | 40 | |
| W | SuQ | ||||||
| Segment attribute | Narrow | Moderate | Wide | Good | Fair | Poor | |
| User confidence | 15 | 70 | 100 | 90 | 60 | 35 | |
| SeT | SeL | SuT | |||||
| Segment attribute | Sidewalk | Crosswalk | Short | Medium | Long | Concrete | Gravel |
| User confidence | 85 | 60 | 90 | 70 | 50 | 85 | 45 |
| HC (Up) | HC (Down) | ||||||
| Segment attribute | Small | Medium | Big | Small | Medium | Big | |
| User confidence | 90 | 50 | 10 | 100 | 60 | 35 | |
Table 4.
Calculated AIs and distances from ideal and worst conditions.
| O-1 | O-2 | 1-2 | 2-1 | 1-4 | 2-3 | 3-4 | 4-3 | 4-D | 3-D | |
|---|---|---|---|---|---|---|---|---|---|---|
| 0.16 | 0.47 | 0.13 | 0.13 | 0.23 | 0.18 | 0.14 | 0.14 | 0.29 | 0.16 | |
| 0.4 | 0.15 | 0.40 | 0.40 | 0.32 | 0.34 | 0.40 | 0.40 | 0.29 | 0.37 | |
| 0.28 | 0.75 | 0.25 | 0.25 | 0.41 | 0.35 | 0.26 | 0.26 | 0.50 | 0.30 |
Table 5.
Users’ confidences and preferences with respect to the criteria.
| Criteria | Average Confidence Level [0, 100] | Relative Importance | ||||
|---|---|---|---|---|---|---|
| User 1 | User 2 | User 3 | User 1 | User 2 | User 3 | |
| S | 77 | 73 | 63 | MH | MH | H |
| W | 63 | 37 | 57 | MH | VH | H |
| SuT | 90 | 90 | 90 | H | MH | MH |
| SuQ | 70 | 57 | 57 | MH | H | H |
| SeT | 70 | 88 | 70 | L | ML | M |
| SeL | 83 | 70 | 50 | ML | ML | MH |
| HC | 60 | 80 | 80 | VH | H | H |
Table 6.
If-Then rules.
| Rule No. | Confidence Level | Accessibility Level | Rule No. | Confidence Level | Accessibility Level | ||
|---|---|---|---|---|---|---|---|
| 1 | VL | VL | NA | 9 | L | VH | LA |
| 2 | VL | L | NA | 10 | M | M | LA |
| 3 | VL | M | NA | 11 | M | H | MA |
| 4 | VL | H | NA | 12 | M | VH | MA |
| 5 | VL | VH | NA | 13 | H | H | MA |
| 6 | L | L | NA | 14 | H | VH | A |
| 7 | L | M | NA | 15 | VH | VH | VA |
| 8 | L | H | LA | ||||
Publisher’s Note: MDPI stays neutral with regard to jurisdictional claims in published maps and institutional affiliations. |
© 2021 by the authors. Licensee MDPI, Basel, Switzerland. This article is an open access article distributed under the terms and conditions of the Creative Commons Attribution (CC BY) license (http://creativecommons.org/licenses/by/4.0/).
Share and Cite
MDPI and ACS Style
Gharebaghi, A.; Mostafavi, M.-A.; Edwards, G.; Fougeyrollas, P. User-Specific Route Planning for People with Motor Disabilities: A Fuzzy Approach. ISPRS Int. J. Geo-Inf. 2021, 10, 65. https://doi.org/10.3390/ijgi10020065
AMA Style
Gharebaghi A, Mostafavi M-A, Edwards G, Fougeyrollas P. User-Specific Route Planning for People with Motor Disabilities: A Fuzzy Approach. ISPRS International Journal of Geo-Information. 2021; 10(2):65. https://doi.org/10.3390/ijgi10020065
Chicago/Turabian StyleGharebaghi, Amin, Mir-Abolfazl Mostafavi, Geoffrey Edwards, and Patrick Fougeyrollas. 2021. "User-Specific Route Planning for People with Motor Disabilities: A Fuzzy Approach" ISPRS International Journal of Geo-Information 10, no. 2: 65. https://doi.org/10.3390/ijgi10020065
Note that from the first issue of 2016, this journal uses article numbers instead of page numbers. See further details here.