sEst: Accurate Sex-Estimation and Abnormality Detection in Methylation Microarray Data

 , and
, and
Abstract
:1. Introduction
2. Results
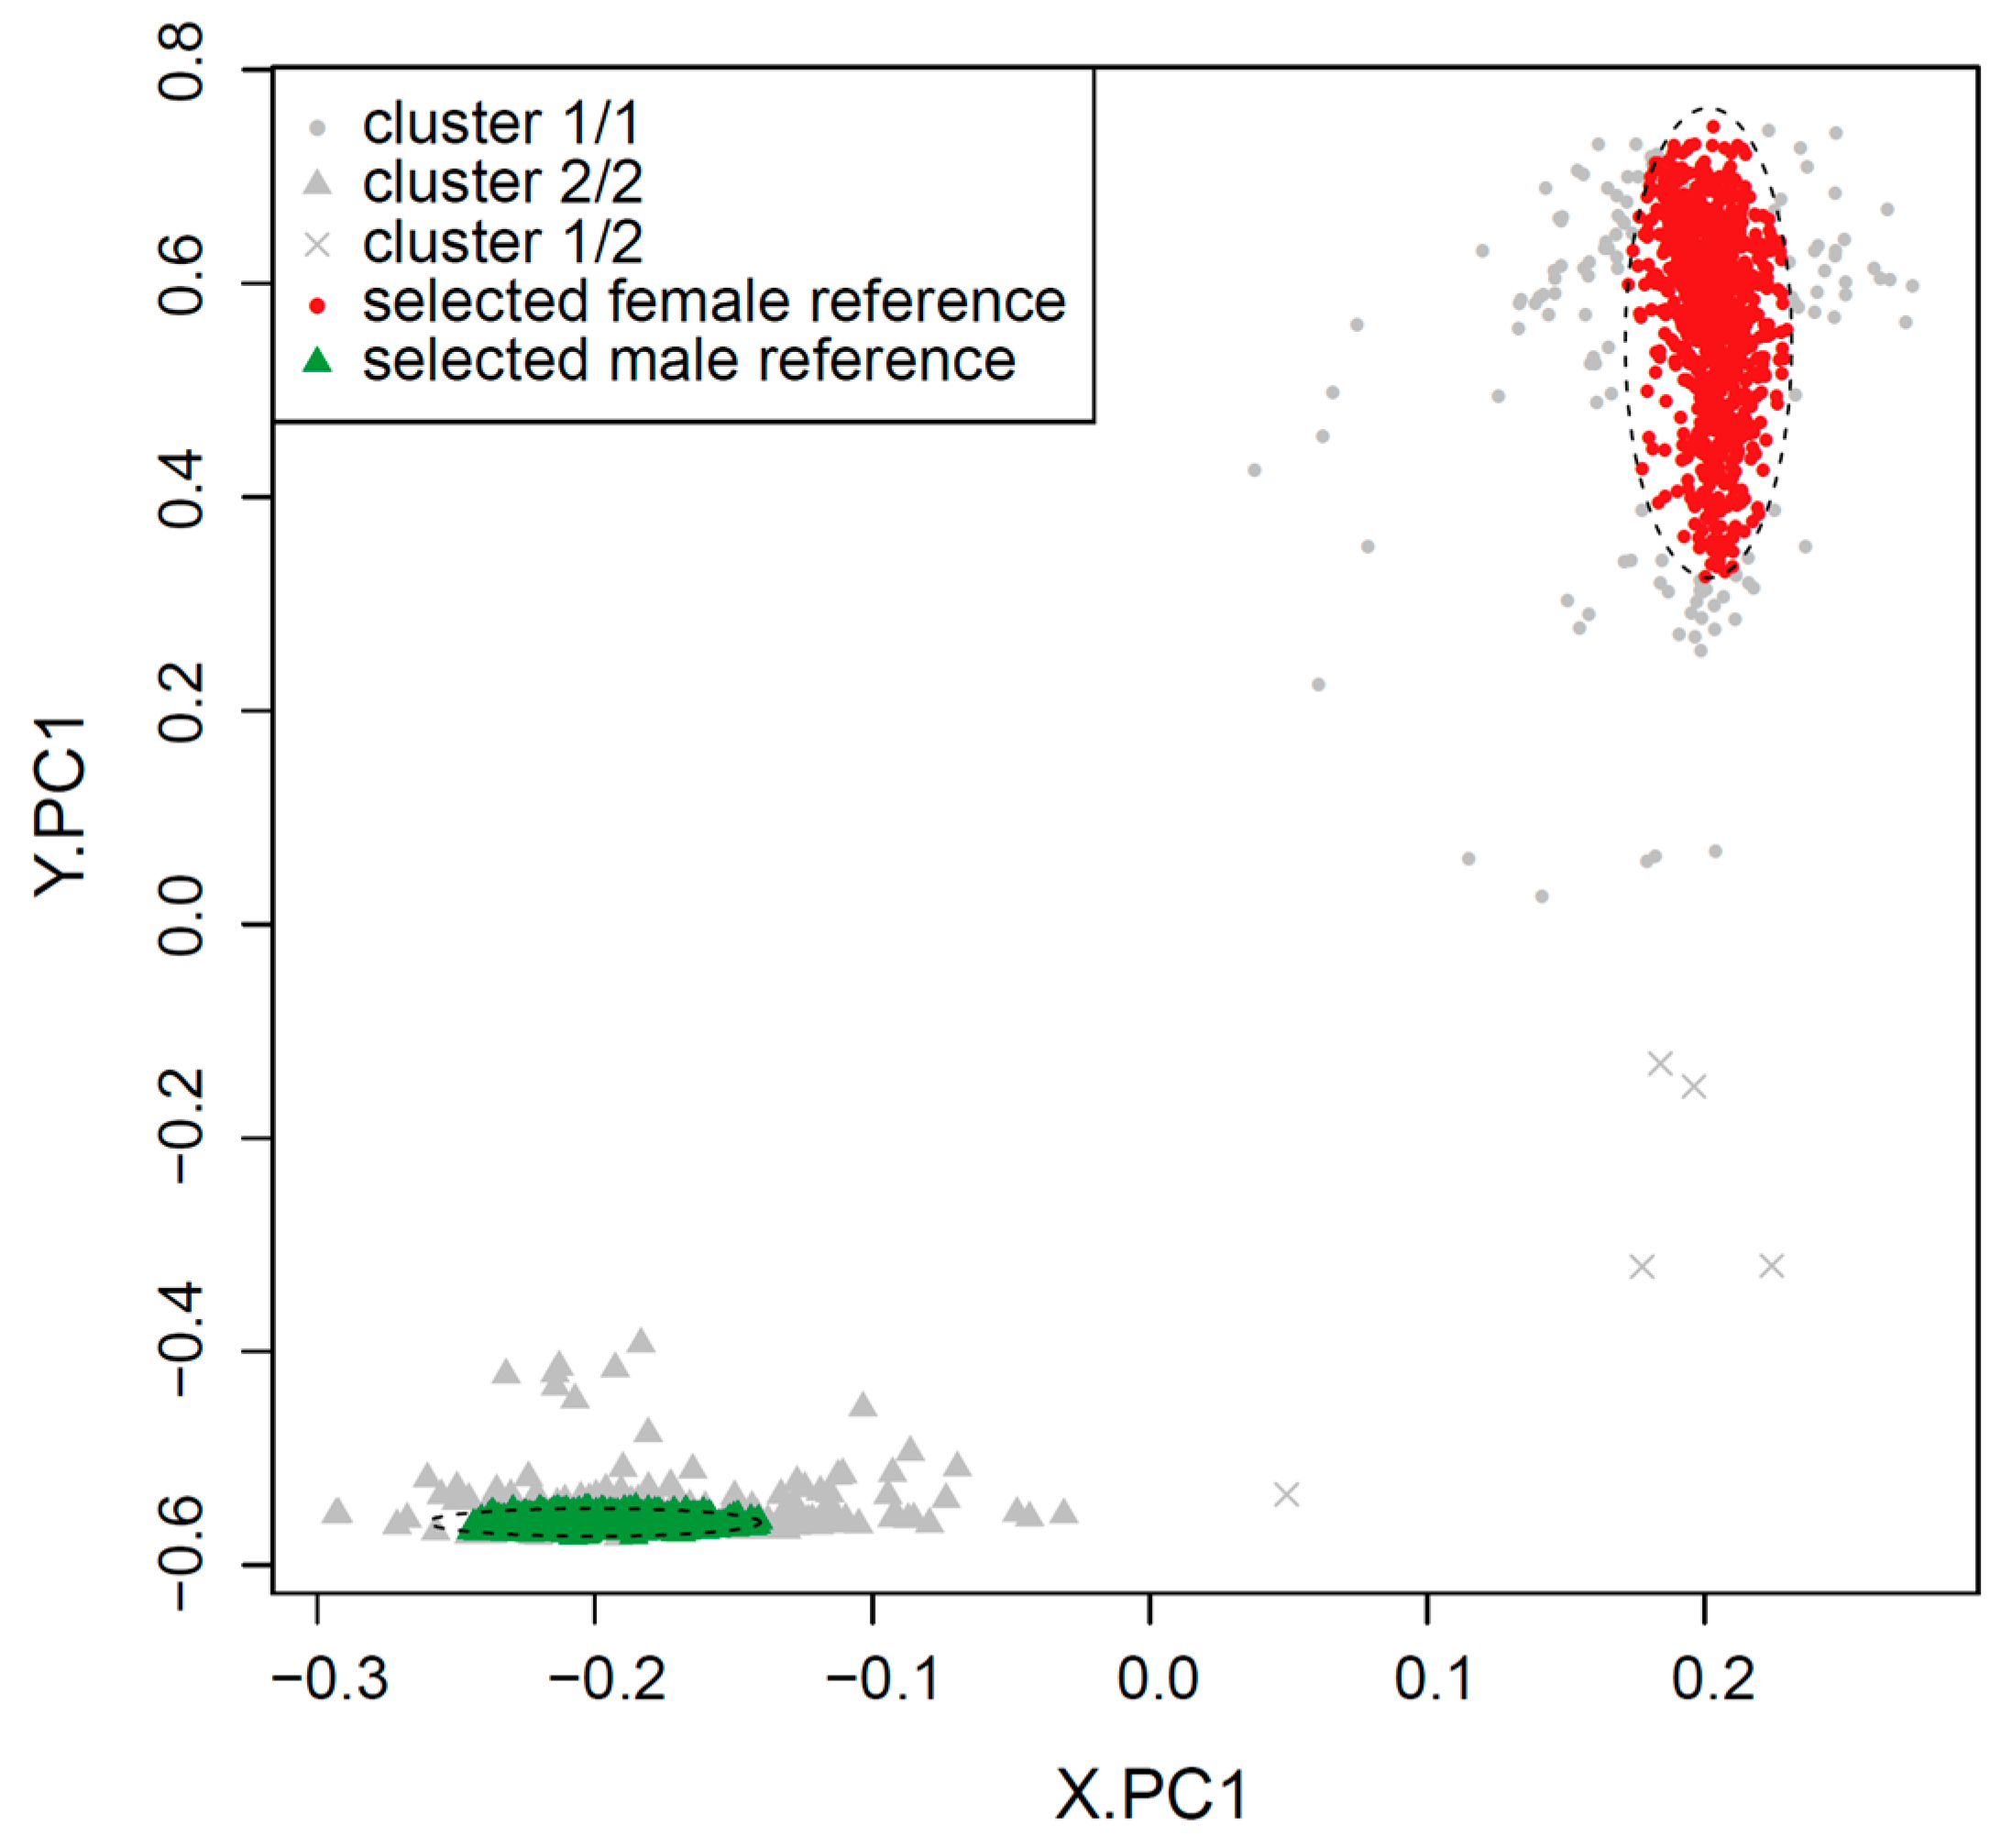
2.1. Clustering of Samples and Selection of Reference Samples
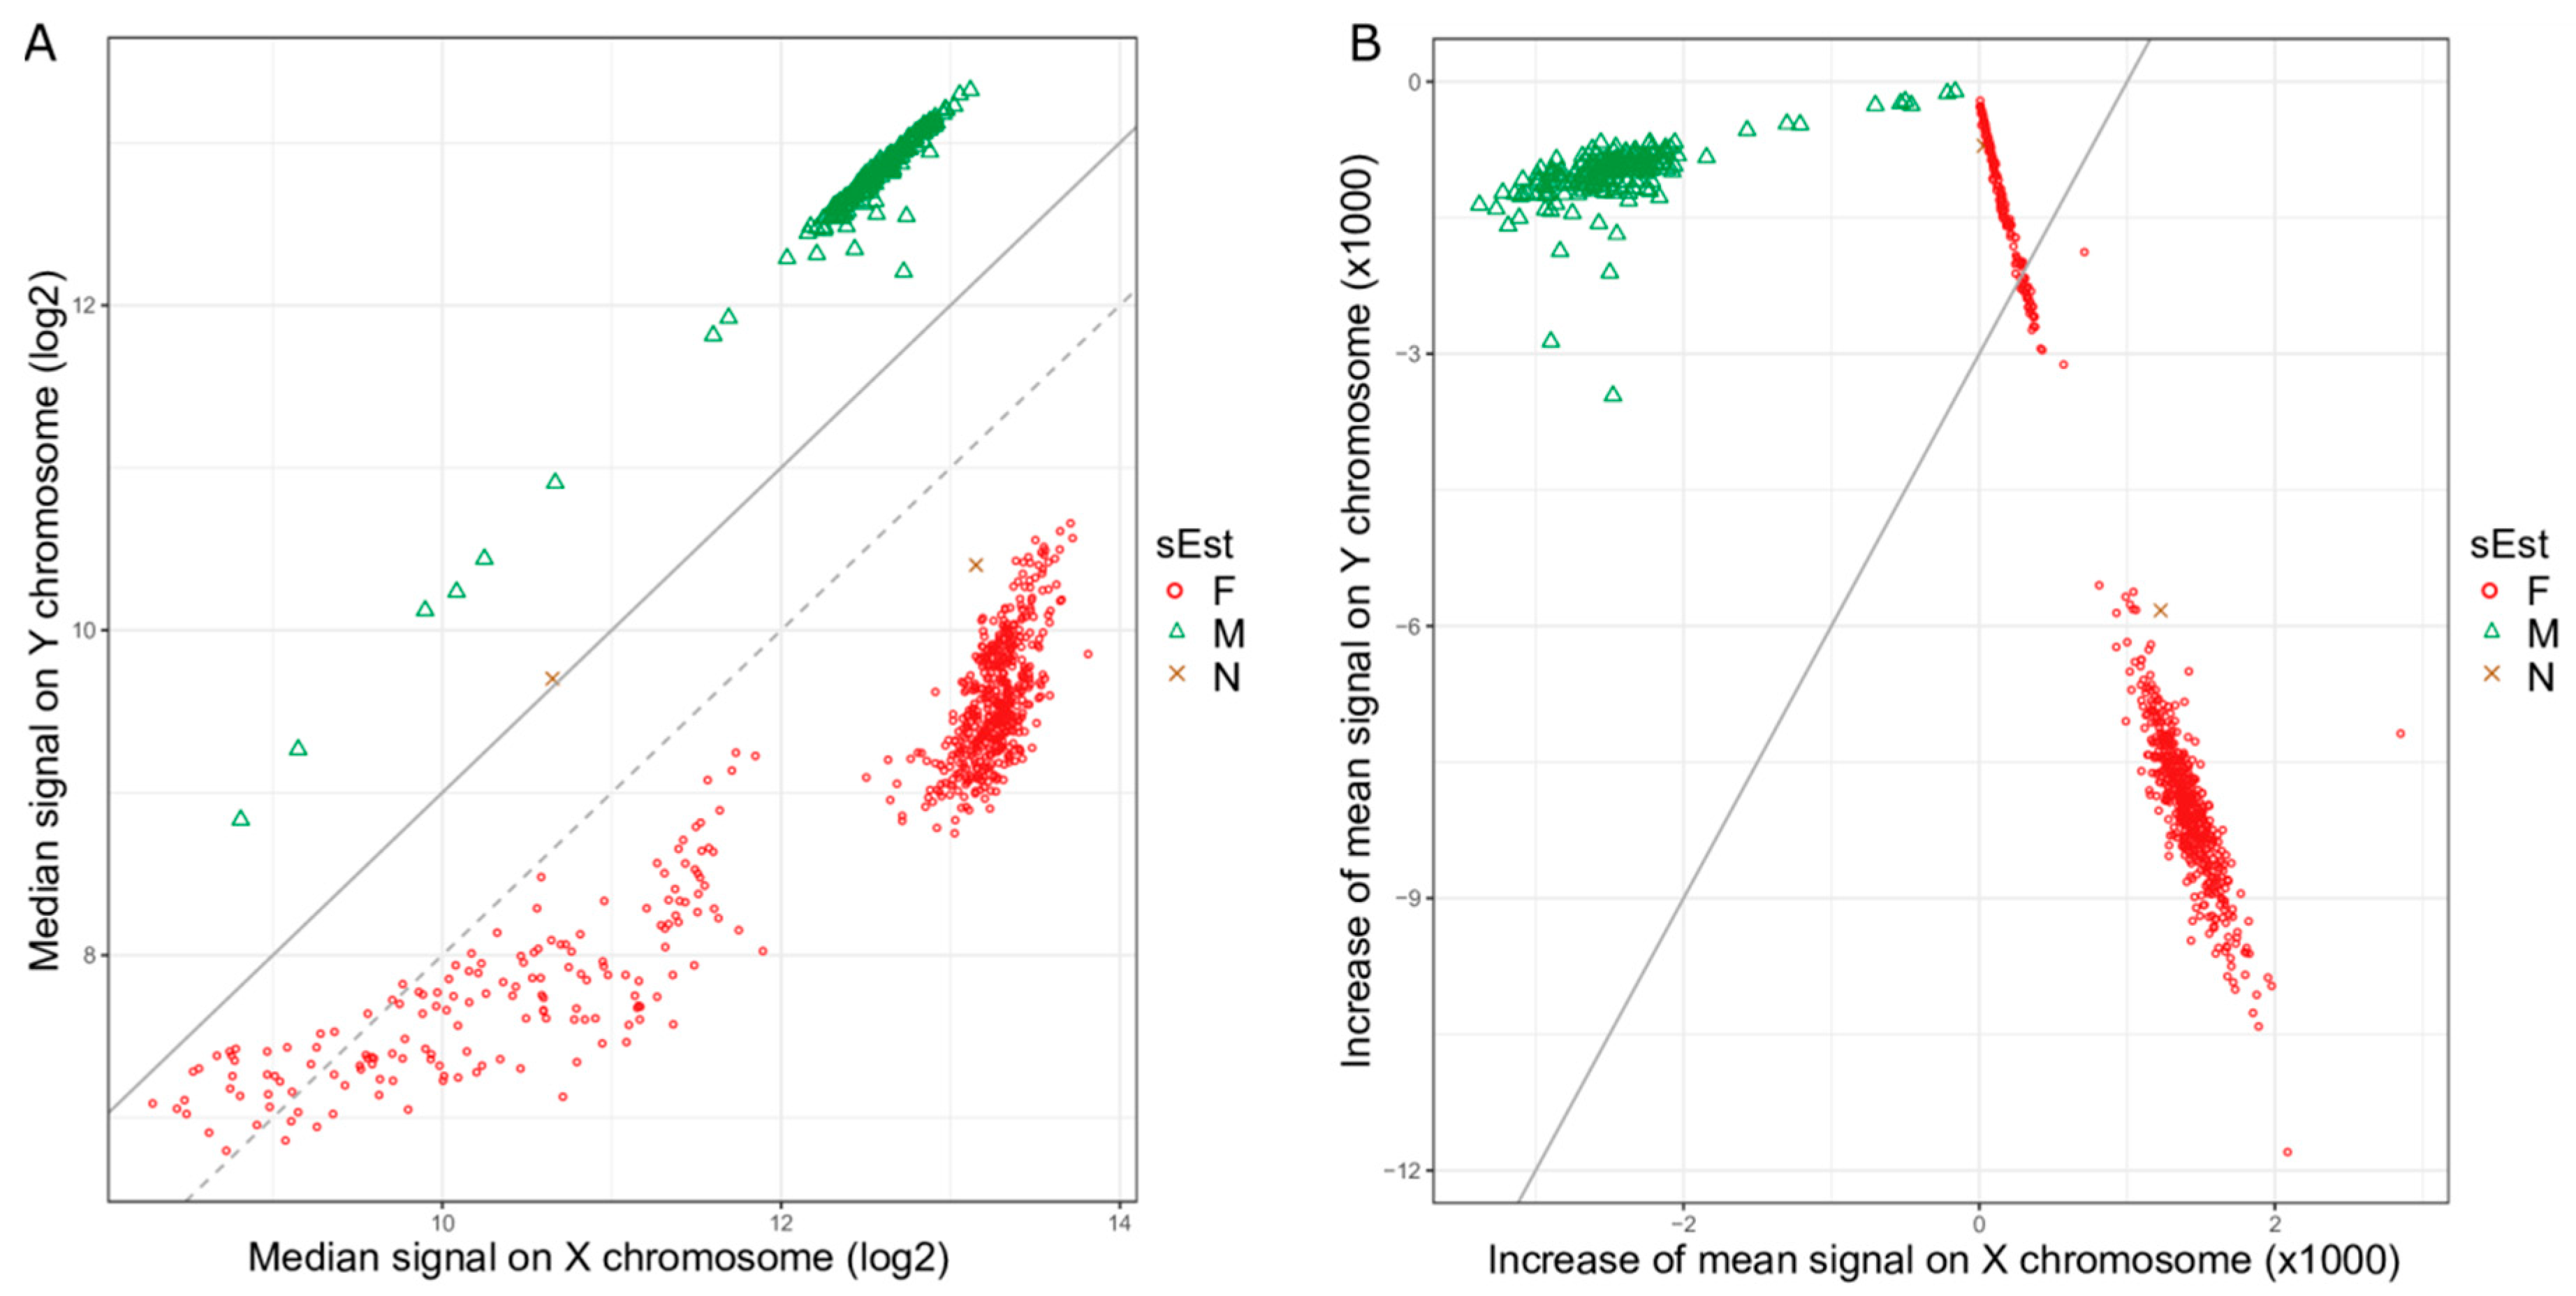
2.2. Sex Estimation Method
| Algorithm 1: sEst |
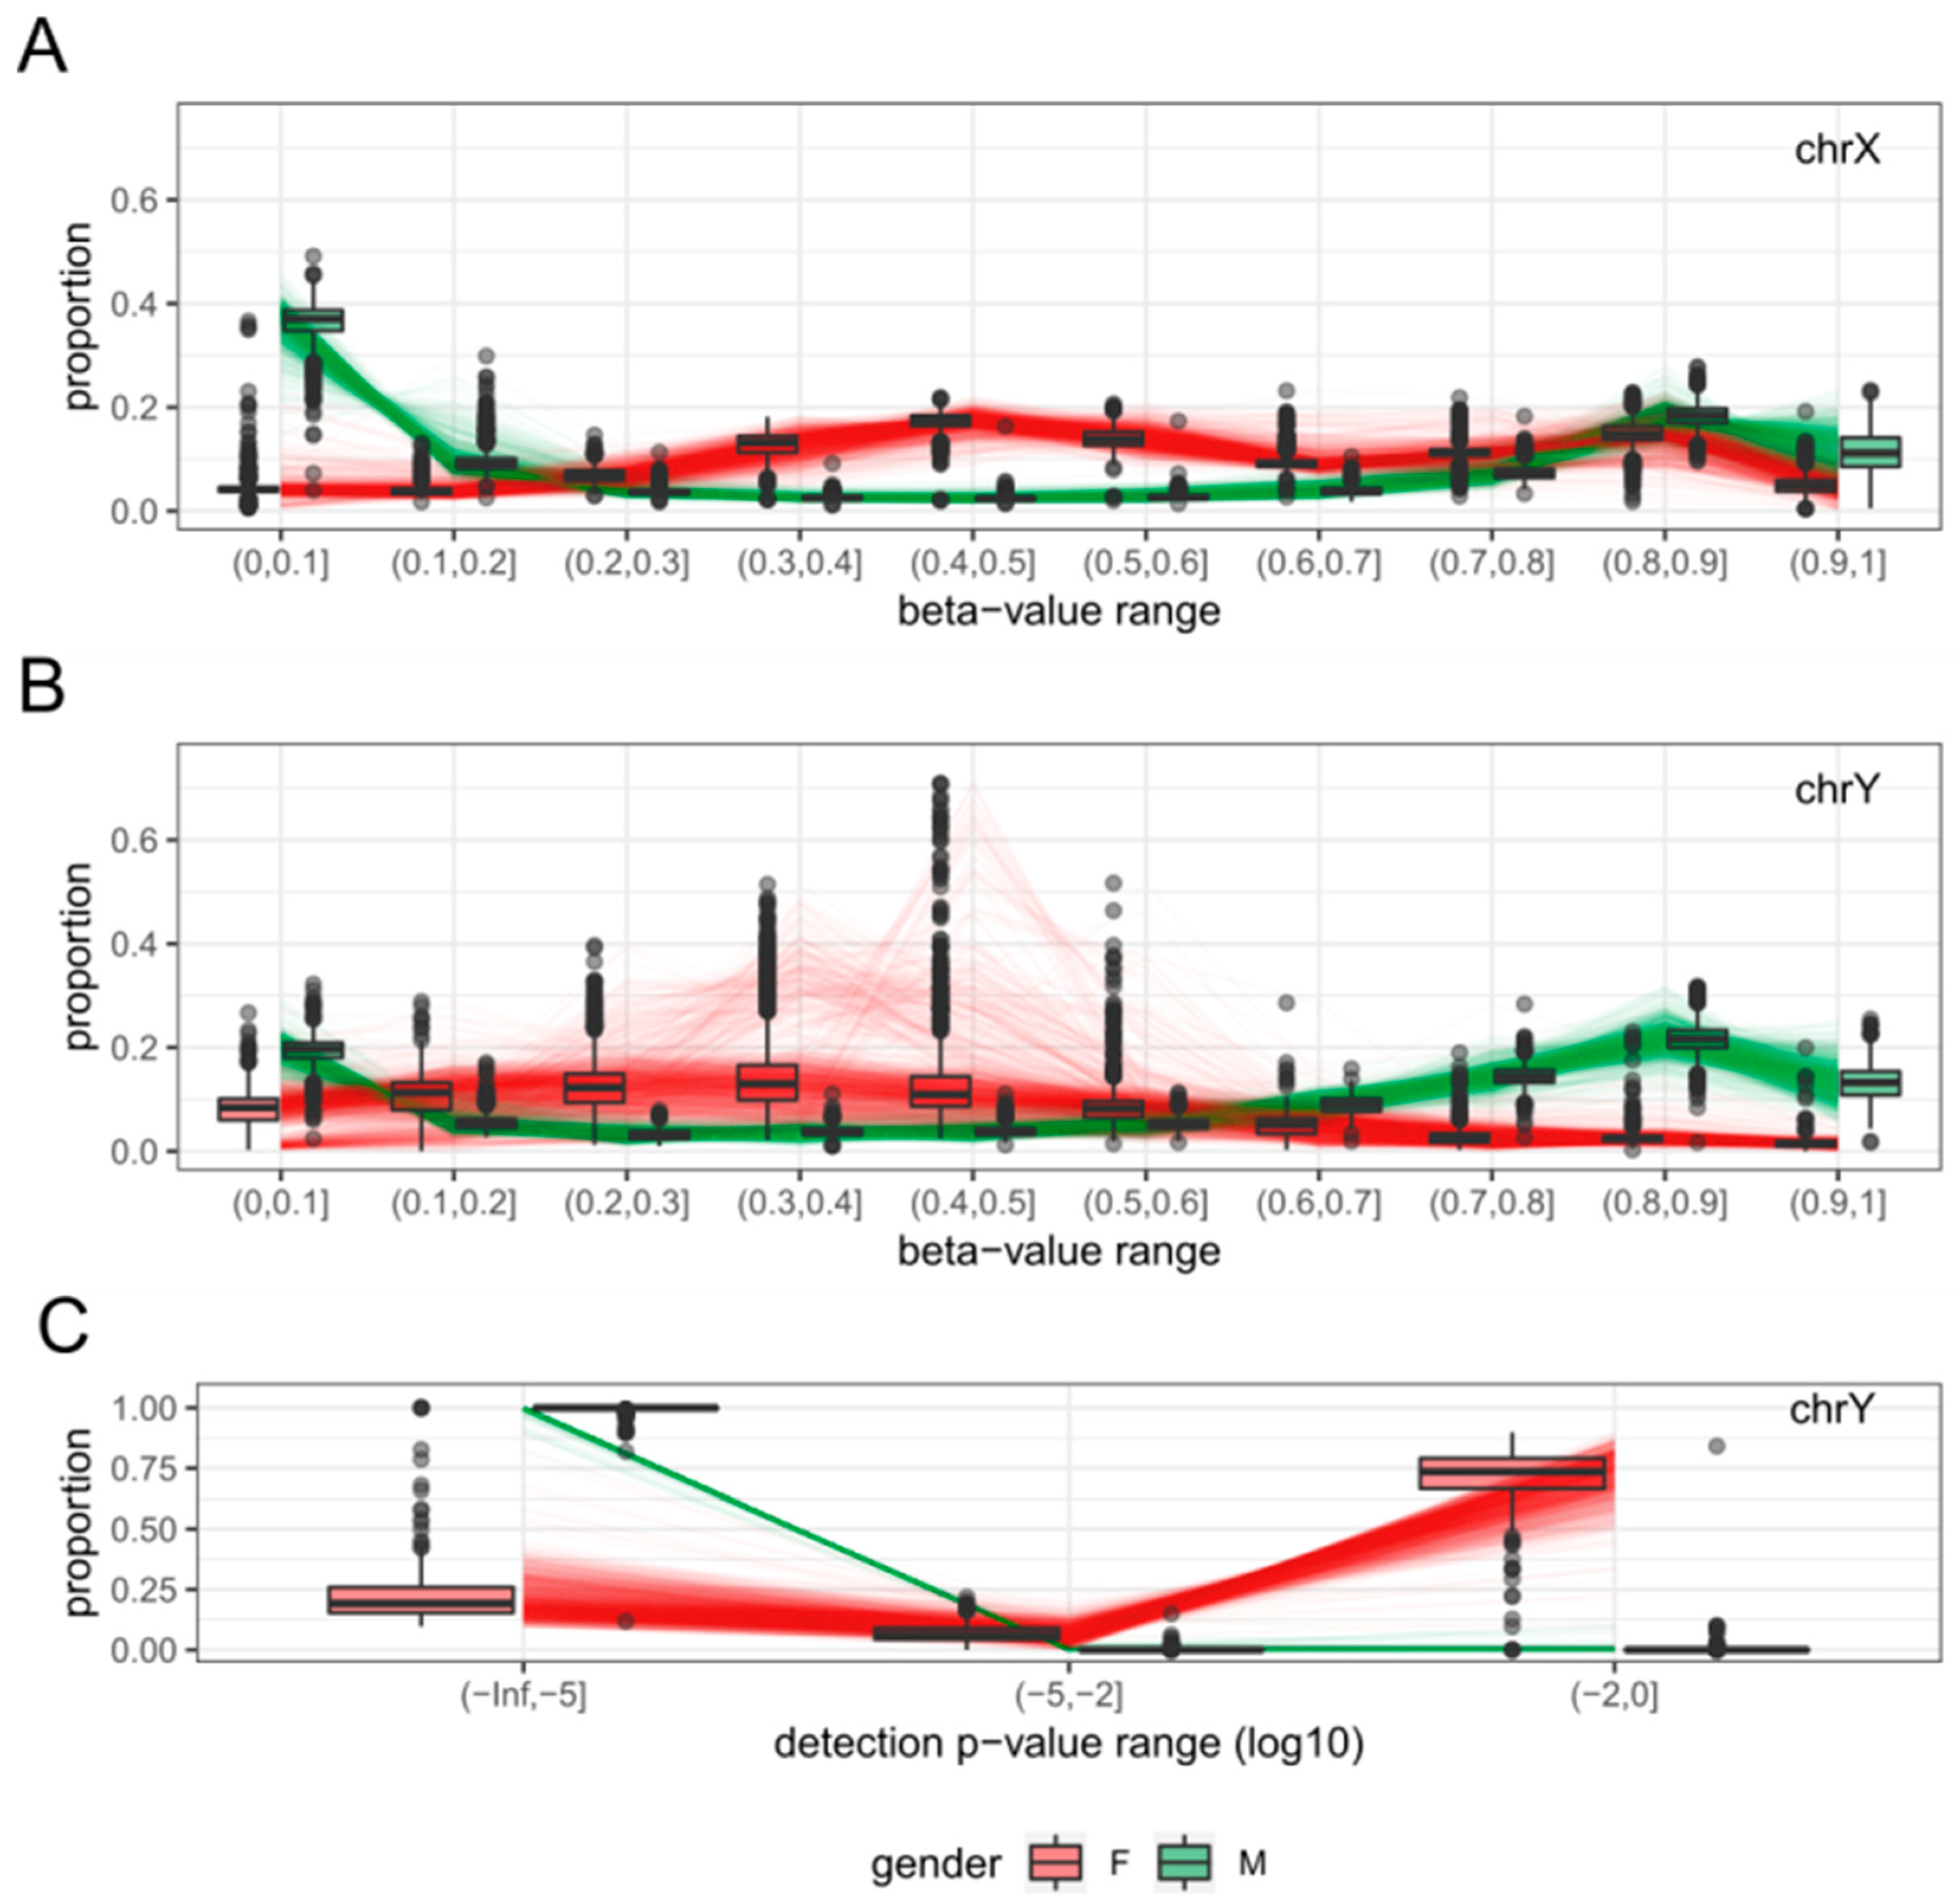
1: Build a table of beta-value/detection p-value distributions for new samples:
|
| 2: Combine the distribution tables for new samples with that representing reference samples. |
| 3: Run principal component analysis (PCA) on beta-value and detection p-value distributions for each sex chromosome (PCA.X: PCA on chrX; PCA.Y: PCA on chrY). |
| 4: Run k-means clustering (k = 2) on PCA.X and assign ‘f’ to the test samples that cluster with female reference samples, and ‘m’ to those that cluster with male reference samples. |
| 5: Run k-means clustering (k = 2) on PCA.Y and assign ‘f’ to the test samples that cluster with female reference samples, and ‘m’ to those that cluster with male reference samples. |
6: Predict sex:
|
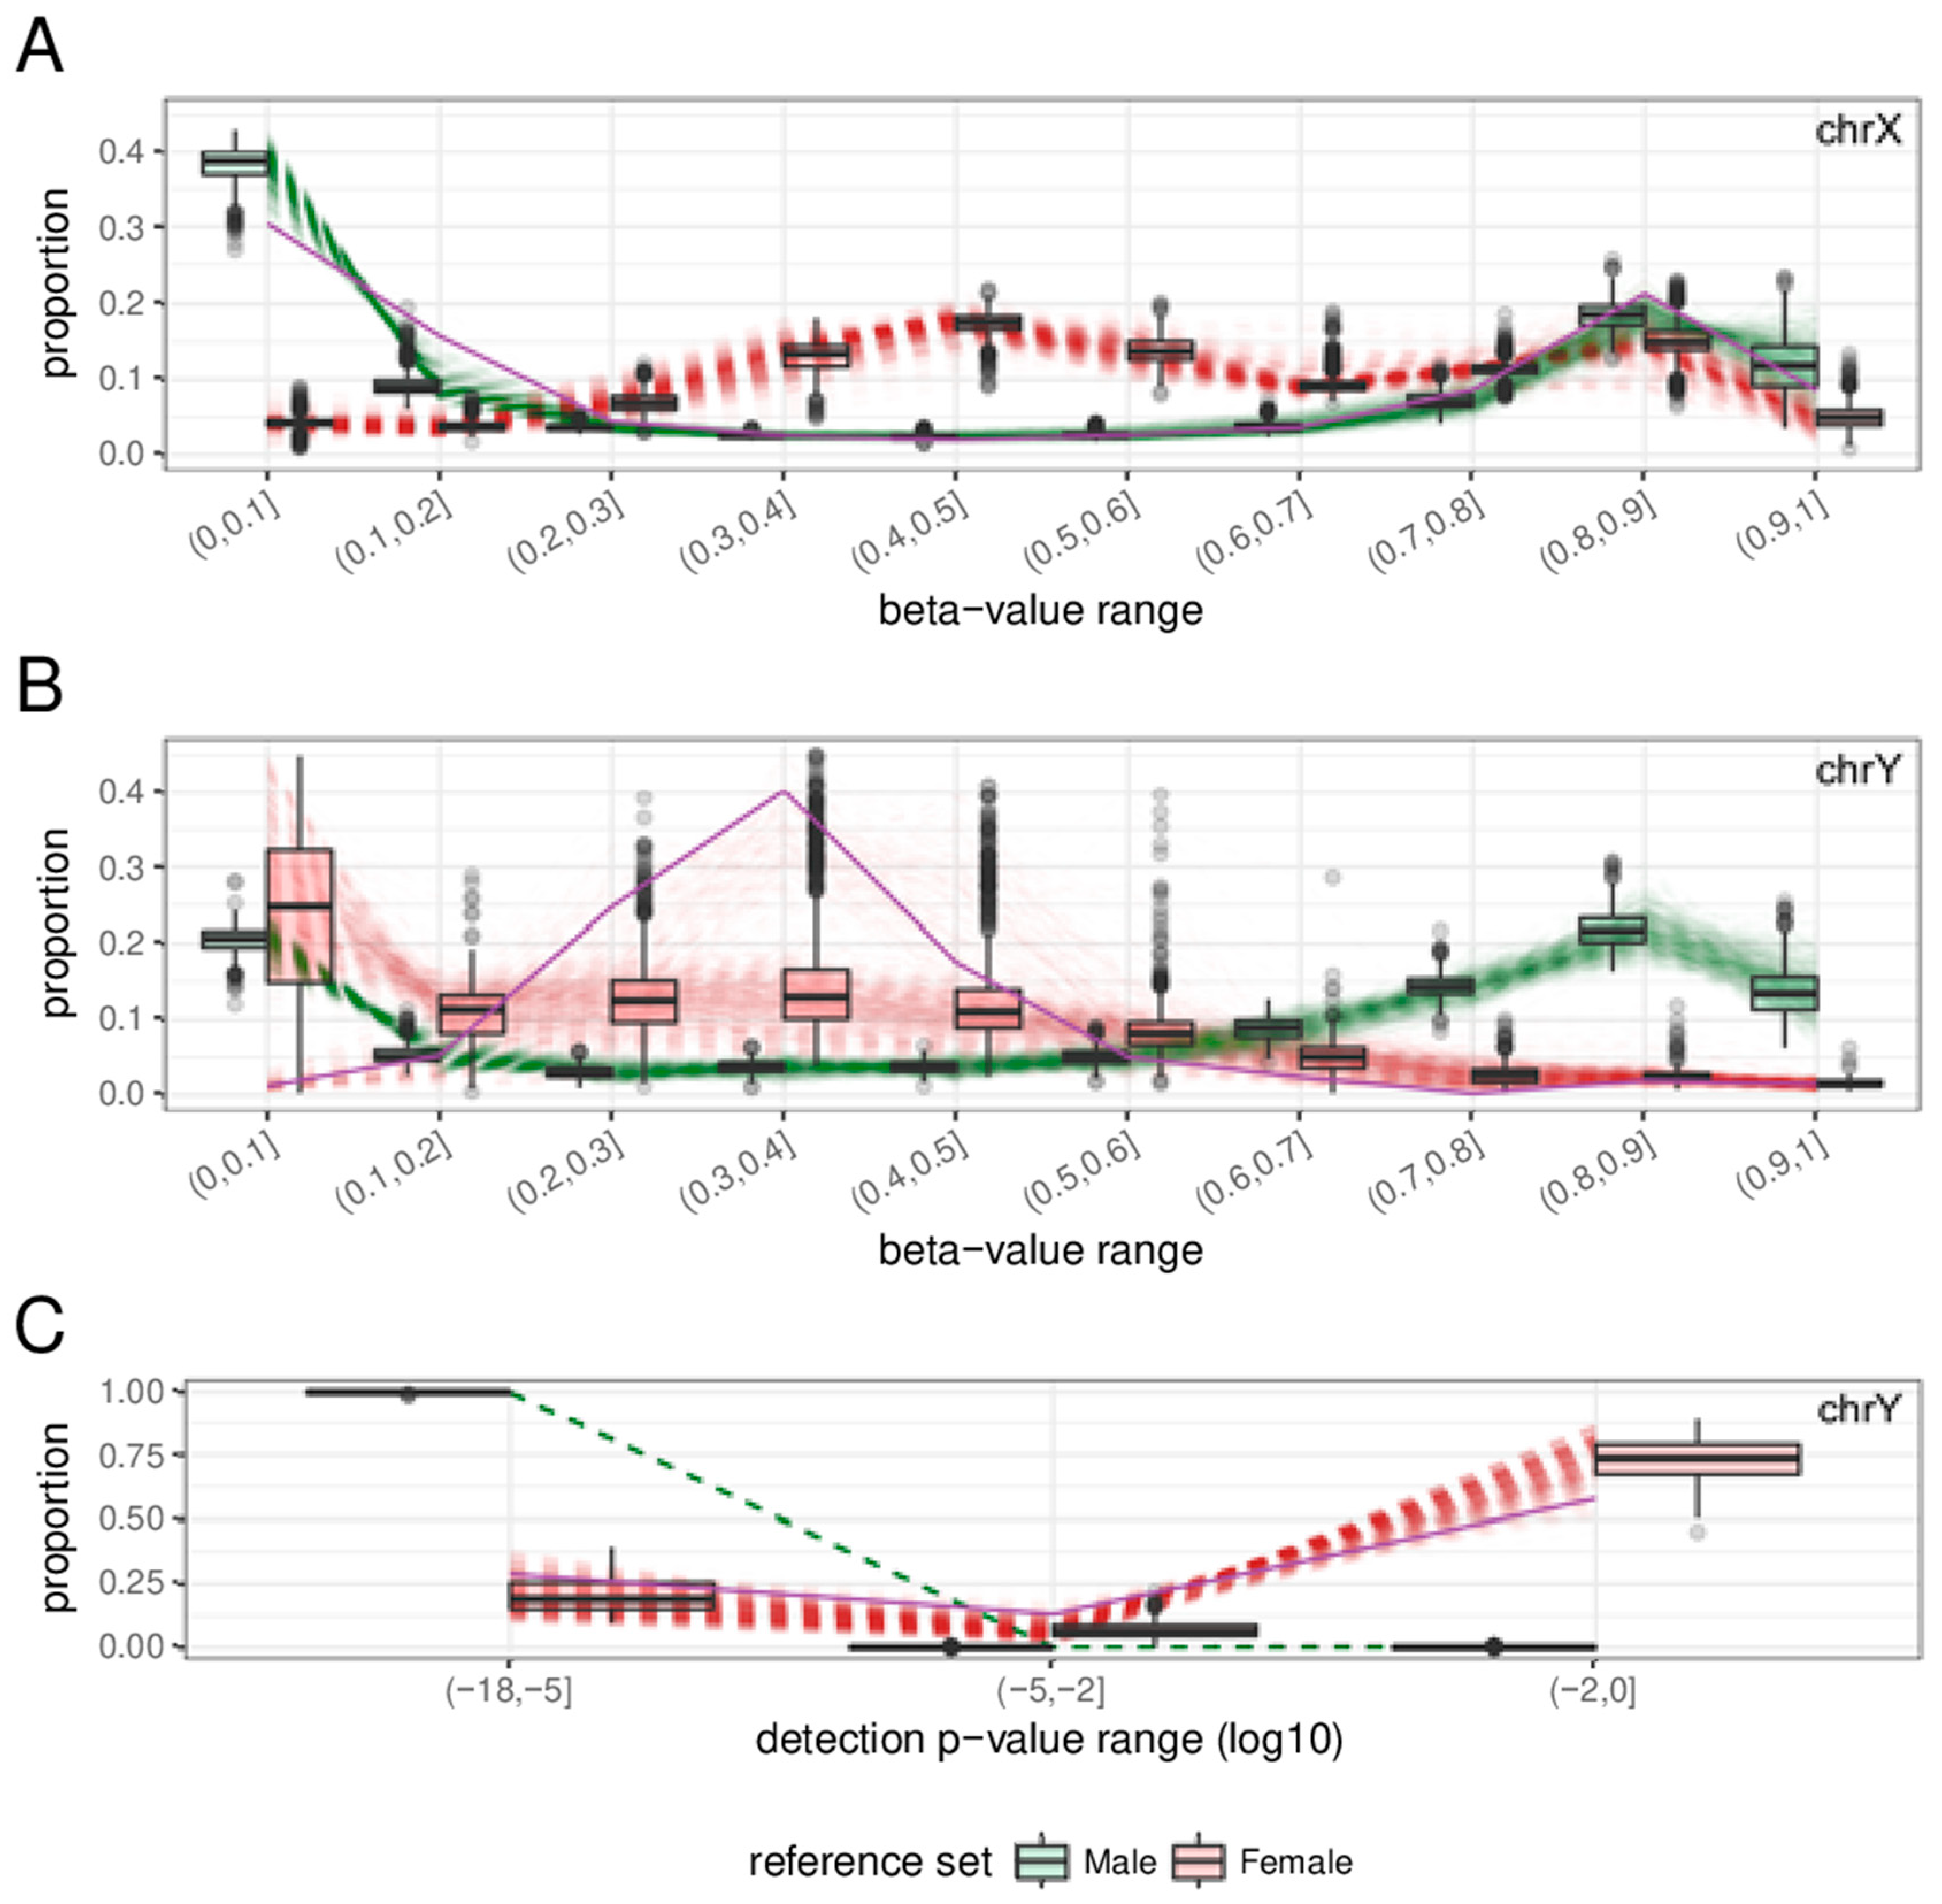
2.3. Features
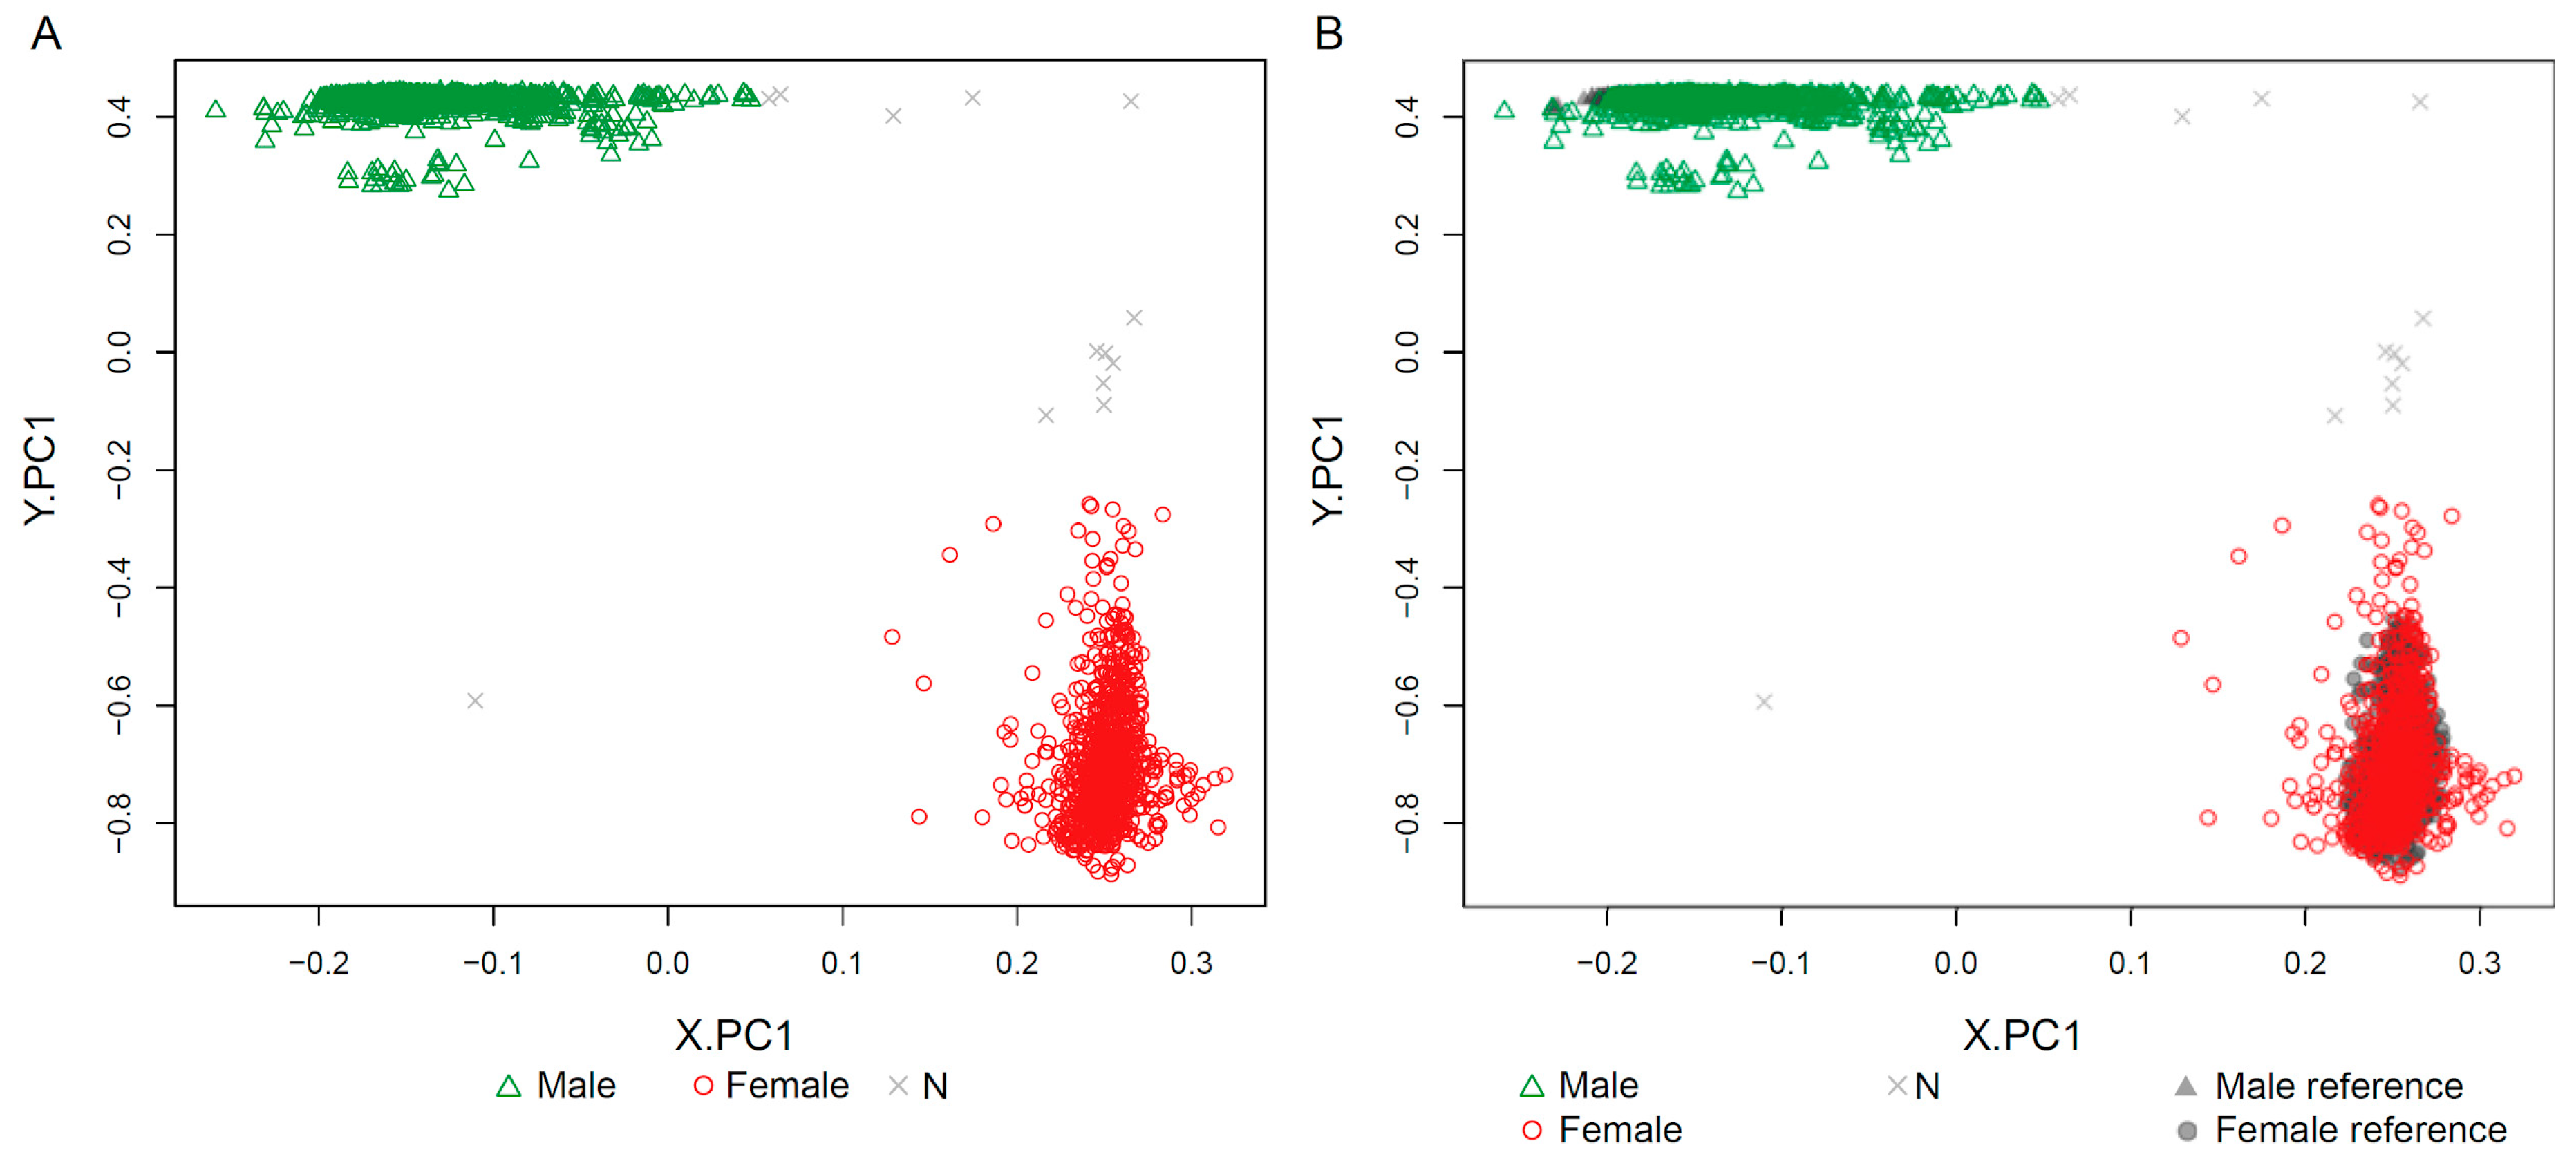
2.4. Sex-Prediction in the Test Samples
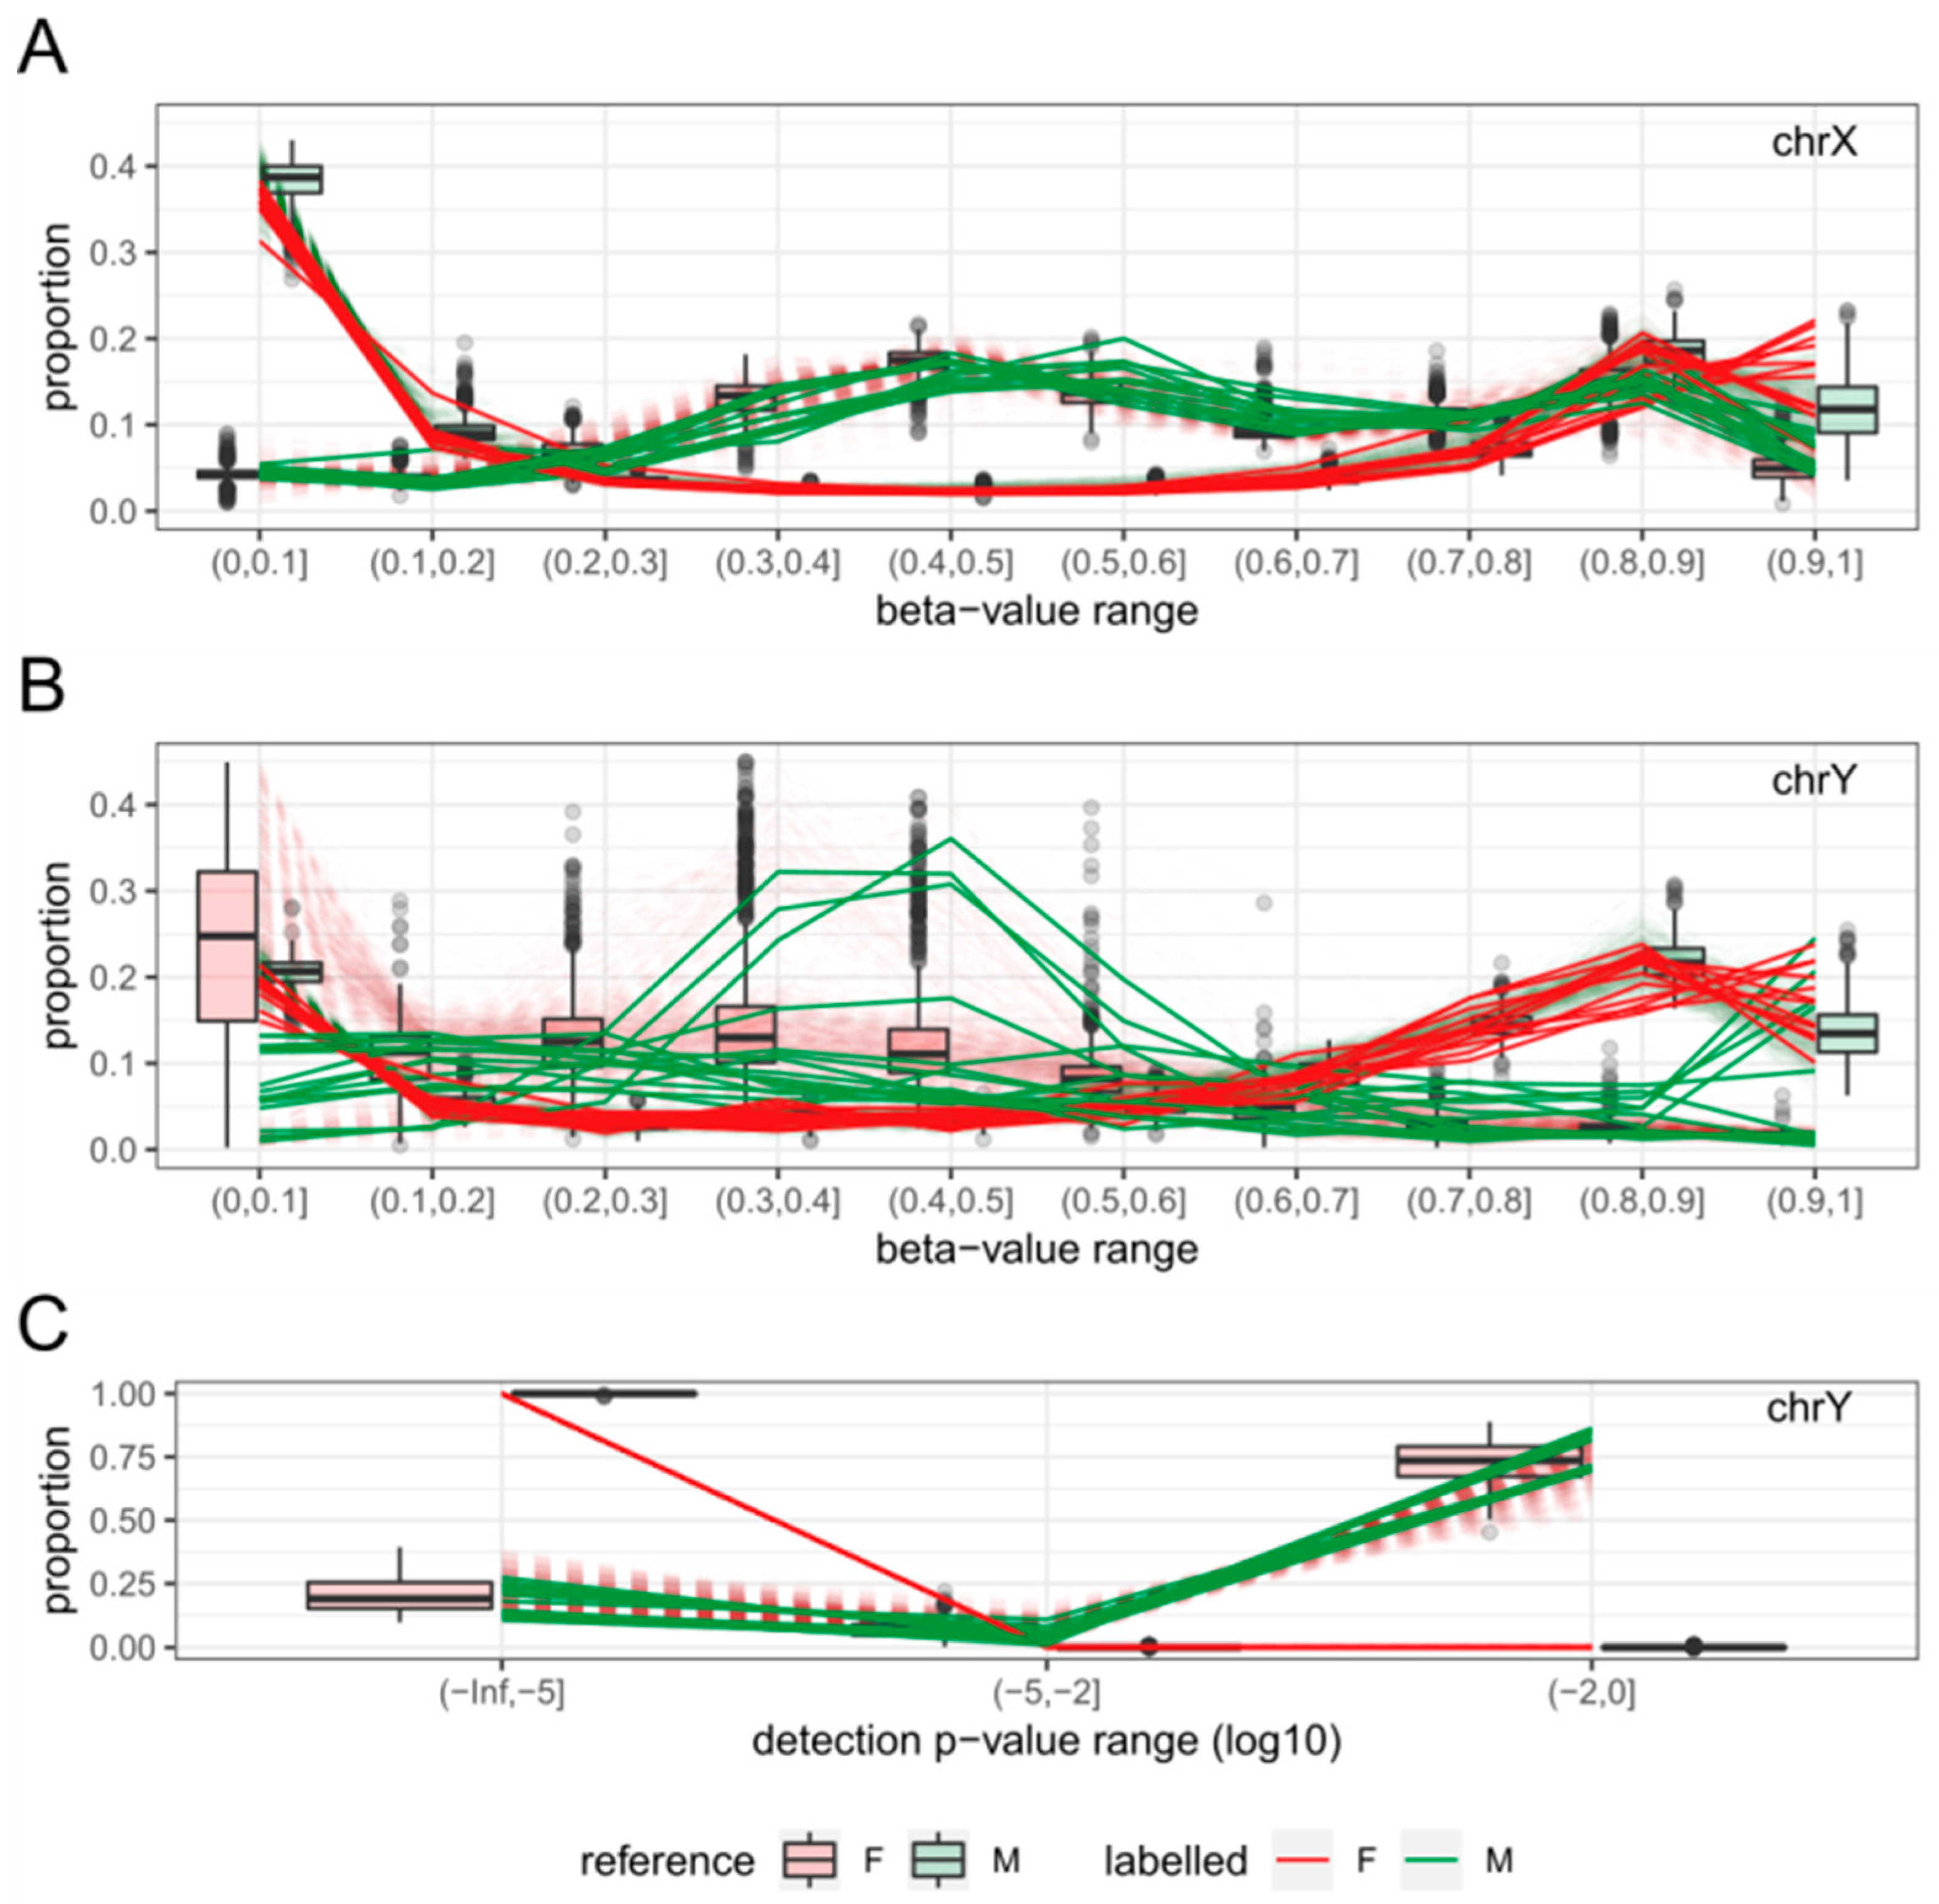
2.5. Comparison with Existing Method
3. Discussion
4. Materials and Methods
Data Collection and Processing
Supplementary Materials
Author Contributions
Funding
Acknowledgments
Conflicts of Interest
References
- Petronis, A. Epigenetics as a unifying principle in the aetiology of complex traits and diseases. Nature 2010, 465, 721–727. [Google Scholar] [CrossRef] [PubMed]
- Kulis, M.; Esteller, M. DNA methylation and cancer. Adv. Genet. 2010, 70, 27–56. [Google Scholar] [PubMed]
- Dorak, M.T.; Karpuzoglu, E. Gender differences in cancer susceptibility: An inadequately addressed issue. Front. Genet. 2012, 3, 268. [Google Scholar] [CrossRef] [PubMed] [Green Version]
- Ober, C.; Loisel, D.A.; Gilad, Y. Sex-specific genetic architecture of human disease. Nat. Rev. Genet. 2008, 9, 911–922. [Google Scholar] [CrossRef] [PubMed] [Green Version]
- Kim, J.H.; Park, J.-L.; Kim, S.-Y. Non-negligible Occurrence of Errors in Gender Description in Public Data Sets. Genomics Inform. 2016, 14, 34–40. [Google Scholar] [CrossRef] [PubMed]
- Qian, D.C.; Busam, J.A.; Xiao, X.; O’Mara, T.A.; Eeles, R.A.; Schumacher, F.R.; Phelan, C.M.; Amos, C.I. seXY: A tool for sex inference from genotype arrays. Bioinformatics 2017, 33, 561–563. [Google Scholar] [CrossRef] [PubMed]
- Aryee, M.J.; Jaffe, A.E.; Corrada-Bravo, H.; Ladd-Acosta, C.; Feinberg, A.P.; Hansen, K.D.; Irizarry, R.A. Minfi: A flexible and comprehensive Bioconductor package for the analysis of Infinium DNA methylation microarrays. Bioinformatics 2014, 30, 1363–1369. [Google Scholar] [CrossRef] [PubMed]
- Assenov, Y.; Müller, F.; Lutsik, P.; Walter, J.; Lengauer, T.; Bock, C. Comprehensive analysis of DNA methylation data with RnBeads. Nat. Methods 2014, 11, 1138–1140. [Google Scholar] [CrossRef] [PubMed] [Green Version]
- Bojesen, A.; Gravholt, C.H. Klinefelter syndrome in clinical practice. Nat. Clin. Pract. Urol. 2007, 4, 192–204. [Google Scholar] [CrossRef] [PubMed]
- Donaldson, M.D.C.; Gault, E.J.; Tan, K.W.; Dunger, D.B. Optimising management in Turner syndrome: From infancy to adult transfer. Arch. Dis. Child. 2006, 91, 513–520. [Google Scholar] [CrossRef] [PubMed]
- Elsheikh, M.; Wass, J.A.H.; Conway, G.S. Autoimmune thyroid syndrome in women with Turner’s syndrome-the association with karyotype. Clin. Endocrinol. 2001, 55, 223–226. [Google Scholar] [CrossRef]
- Gravholt, C.H.; Jensen, A.S.; Høst, C.; Bojesen, A. Body composition, metabolic syndrome and type 2 diabetes in Klinefelter syndrome. Acta Paediatr. 2011, 100, 871–877. [Google Scholar] [CrossRef] [PubMed]
- Calogero, A.E.; Giagulli, V.A.; Mongioì, L.M.; Triggiani, V.; Radicioni, A.F.; Jannini, E.A.; Pasquali, D.; Klinefelter ItaliaN Group (KING). Klinefelter syndrome: Cardiovascular abnormalities and metabolic disorders. J. Endocrinol. Investig. 2017, 40, 705–712. [Google Scholar] [CrossRef] [PubMed]
- Salzano, A.; Arcopinto, M.; Marra, A.M.; Bobbio, E.; Esposito, D.; Accardo, G.; Giallauria, F.; Bossone, E.; Vigorito, C.; Lenzi, A.; et al. Klinefelter syndrome, cardiovascular system, and thromboembolic disease: Review of literature and clinical perspectives. Eur. J. Endocrinol. 2016, 175, R27–R40. [Google Scholar] [CrossRef] [PubMed]
- Joo, J.E.; Novakovic, B.; Cruickshank, M.; Doyle, L.W.; Craig, J.M.; Saffery, R. Human active X-specific DNA methylation events showing stability across time and tissues. Eur. J. Hum. Genet. 2014, 22, 1376–1381. [Google Scholar] [CrossRef] [PubMed]
- sEst. Available online: https://jungch.github.io/sest/ (accessed on 13 October 2018).
- Walker, R.F.; Liu, J.S.; Peters, B.A.; Ritz, B.R.; Wu, T.; Ophoff, R.A.; Horvath, S. Epigenetic age analysis of children who seem to evade aging. Aging 2015, 7, 334–339. [Google Scholar] [CrossRef] [PubMed] [Green Version]
- Edgar, R.; Domrachev, M.; Lash, A.E. Gene Expression Omnibus: NCBI gene expression and hybridization array data repository. Nucleic Acids Res. 2002, 30, 207–210. [Google Scholar] [CrossRef] [PubMed] [Green Version]
- Barrett, T.; Wilhite, S.E.; Ledoux, P.; Evangelista, C.; Kim, I.F.; Tomashevsky, M.; Marshall, K.A.; Phillippy, K.H.; Sherman, P.M.; Holko, M.; et al. NCBI GEO: Archive for functional genomics data sets—Update. Nucleic Acids Res. 2013, 41, D991–D995. [Google Scholar] [CrossRef] [PubMed]
- Du, P.; Zhang, X.; Huang, C.-C.; Jafari, N.; Kibbe, W.A.; Hou, L.; Lin, S.M. Comparison of Beta-value and M-value methods for quantifying methylation levels by microarray analysis. BMC Bioinf. 2010, 11, 587. [Google Scholar] [CrossRef] [PubMed]


| Labelled Sex | Cluster by PCA.X/Cluster by PCA.Y | |||
|---|---|---|---|---|
| 1/1 | 1/2 | 2/1 | 2/2 | |
| Female | 992 | 4 | 0 | 4 |
| Male | 1 | 1 | 0 | 998 |
| Labelled | Predicted | Total | ||
|---|---|---|---|---|
| F (%) | M (%) | N (%) | ||
| F | 787 (98.50) | 4 (0.50) | 8 (1.00) | 799 |
| M | 9 (0.48) | 1879 (99.26) | 5 (0.26) | 1893 |
| (subtotal) | 796 (29.57) | 1883 (69.95) | 13 (0.48) | 2692 |
| UNKNOWN | 47 (48.96) | 49 (51.04) | 0 (0) | 96 |
| Total | 843 (30.24) | 1932 (69.30) | 13 (0.47) | 2788 |
| sEst | Labelled | Minfi (Default) | Minfi (Cut-Off: −1) | RnBeads | ||||
|---|---|---|---|---|---|---|---|---|
| F | M | F | M | F | M | F | M | |
| F | 650 | 5 | 623 | 32 | 655 | 0 | 527 | 128 |
| M | 5 | 182 | 0 | 187 | 0 | 187 | 0 | 187 |
| N | 2 | 0 | 1 | 1 | 1 | 1 | 1 | 1 |
| Total | 657 | 187 | 624 | 220 | 656 | 188 | 528 | 316 |
© 2018 by the authors. Licensee MDPI, Basel, Switzerland. This article is an open access article distributed under the terms and conditions of the Creative Commons Attribution (CC BY) license (http://creativecommons.org/licenses/by/4.0/).
Share and Cite
Jung, C.-H.; Park, D.J.; Georgeson, P.; Mahmood, K.; Milne, R.L.; Southey, M.C.; Pope, B.J. sEst: Accurate Sex-Estimation and Abnormality Detection in Methylation Microarray Data. Int. J. Mol. Sci. 2018, 19, 3172. https://doi.org/10.3390/ijms19103172
Jung C-H, Park DJ, Georgeson P, Mahmood K, Milne RL, Southey MC, Pope BJ. sEst: Accurate Sex-Estimation and Abnormality Detection in Methylation Microarray Data. International Journal of Molecular Sciences. 2018; 19(10):3172. https://doi.org/10.3390/ijms19103172
Chicago/Turabian StyleJung, Chol-Hee, Daniel J. Park, Peter Georgeson, Khalid Mahmood, Roger L. Milne, Melissa C. Southey, and Bernard J. Pope. 2018. "sEst: Accurate Sex-Estimation and Abnormality Detection in Methylation Microarray Data" International Journal of Molecular Sciences 19, no. 10: 3172. https://doi.org/10.3390/ijms19103172