Article

Insight into Nephrocan Function in Mouse Endoderm Patterning

1
Istituto di Ricerche Genetiche “G. Salvatore”, Biogem s.c.ar.l, Ariano Irpino, 83031 Avellino, Italy
2
Dipartimento di Biologia, Università degli Studi di Napoli “Federico II”, 80126 Napoli, Italy
3
Istituto per l’Endocrinologia e l’Oncologia Sperimentale “G. Salvatore”, CNR, 80131 Napoli, Italy
4
CEINGE Biotecnologie Avanzate s.c.a.r.l., 80131 Napoli, Italy
*
Authors to whom correspondence should be addressed.
These authors contributed equally to this work.
Int. J. Mol. Sci. 2020, 21(1), 8; https://doi.org/10.3390/ijms21010008
Submission received: 20 November 2019 / Revised: 9 December 2019 / Accepted: 16 December 2019 / Published: 18 December 2019
(This article belongs to the Section Molecular Pathology, Diagnostics, and Therapeutics)

Abstract

:
Endoderm-derived organs as liver and pancreas are potential targets for regenerative therapies, and thus, there is great interest in understanding the pathways that regulate the induction and specification of this germ layer. Currently, the knowledge of molecular mechanisms that guide the in vivo endoderm specification is restricted by the lack of early endoderm specific markers. Nephrocan (Nepn) is a gene whose expression characterizes the early stages of murine endoderm specification (E7.5–11.5) and encodes a secreted N-glycosylated protein. In the present study, we report the identification of a new transcript variant that is generated through alternative splicing. The new variant was found to have differential and tissue specific expression in the adult mouse. In order to better understand Nepn role during endoderm specification, we generated Nepn knock-out (KO) mice. Nepn−/− mice were born at Mendelian ratios and displayed no evident phenotype compared to WT mice. In addition, we produced nullizygous mouse embryonic stem cell (mESC) line lacking Nepn by applying (CRISPR)/CRISPR-associated systems 9 (Cas9) and employed a differentiation protocol toward endoderm lineage. Our in vitro results revealed that Nepn loss affects the endoderm differentiation impairing the expression of posterior foregut-associated markers.

1. Introduction

The molecular mechanisms controlling the early cell fate decisions in mammals is of major interest to regenerative medicine, since guided differentiation of embryonic stem cells (ESCs) toward a specific lineage is an appealing opportunity to provide bases for exploring new therapies. The definitive endoderm (DE), one of the three primary germ layers formed during gastrulation, gives rise to the gastrointestinal organs, such as stomach, pancreas, liver, and intestine, which are of great importance in their therapeutic aspects [1,2]. In mouse, endoderm, together with mesoderm and ectoderm, is formed from the epiblast through the process of gastrulation beginning at approximately day 6.5 of gestation [3]. As gastrulation initiates, the pluripotent epiblast cells are recruited to a structure known as the primitive streak (PS), where they undergo an epithelial-to-mesenchymal transition (EMT) giving rise to mesoderm and definitive endoderm [4,5]. The endodermal lineage acquires an epithelial fate and intercalates into the overlying visceral endoderm (VE) to form the DE [6,7,8]. The formation of DE involves a migration from mesenchymal PS to an epithelial endoderm layer; therefore, it is commonly regarded as an mesenchymal-to-epithelial transition (MET) process [9]. Once the primary germ layers are established, the endoderm undergoes a complex series of changes to give rise to a primitive gut tube [10]. The derivative organs of the definitive endoderm begin to develop, arising as small buds in the epithelial layer that then further differentiate as embryogenesis proceeds [2]. Many studies have shown that members of the Transforming Growth Factor-β (TGF-β) superfamily, including Nodal, Activins, and Bone Morphogenetic Proteins (BMPs), as well as their inhibitors, such as the Forkhead domain factors and Sox17 HMG domain proteins, are responsible for the induction and specification of DE lineage [11,12,13,14]. Nevertheless, the knowledge of genetic mechanisms that guide the in vivo endoderm specification is restricted by the lack of early endoderm specific markers. In order to further improve the comprehension of pancreatic cellular ontogeny, we performed a global expression profile of dorsal pancreatic bud at E 10.5 and Nepn was identified among the most enriched genes [15]. Nepn encodes a small leucine-rich repeat protein (SLRP) [16] that can act as a secreted inhibitor of TGF-β signaling [17], a key regulator in endoderm development. Nepn is expressed in the definitive endoderm that emerges during gastrulation, as well as its derivative the gut tube epithelium and the early pancreas primordium (E7.5−11.5) [18]. In adult mice, Nepn is expressed mainly in the kidney [17]. In the present study, we report a novel transcript variant of the gene that arises as a result of alternative splicing and is expressed in tissue and developmental stage specific manner. The newly identified variant was altogether absent between the embryonic stages E8.5-E11.5 and was found to be expressed differentially across different adult tissues. Moreover, we describe in vivo and in vitro experiment examining Nepn involvement in posterior foregut development. We generated and analyzed constitutive NepnKOfirst mice (called Nepn−/− or Nepn+/−). Nepn−/− mutants were viable and fertile, exhibited normal body weight and displayed normal glucose tolerance and renal functionality. By using the CRISPR/Cas9 technique [19], we also generated the Nepn deficient mESCs. We programmed differentiation of wild type and mutant mESCs toward the endoderm lineage and demonstrated that the Nepn CRISPR-knockout impairs the expression of posterior foregut specific markers such as Gata4/6 and Sox9. These experiments will improve the knowledge of mechanisms that guide the in vivo endoderm development, which is an important goal to sustain the progression of new therapeutic strategies to be used in the treatment of disease involving endoderm derived organs.

2. Results

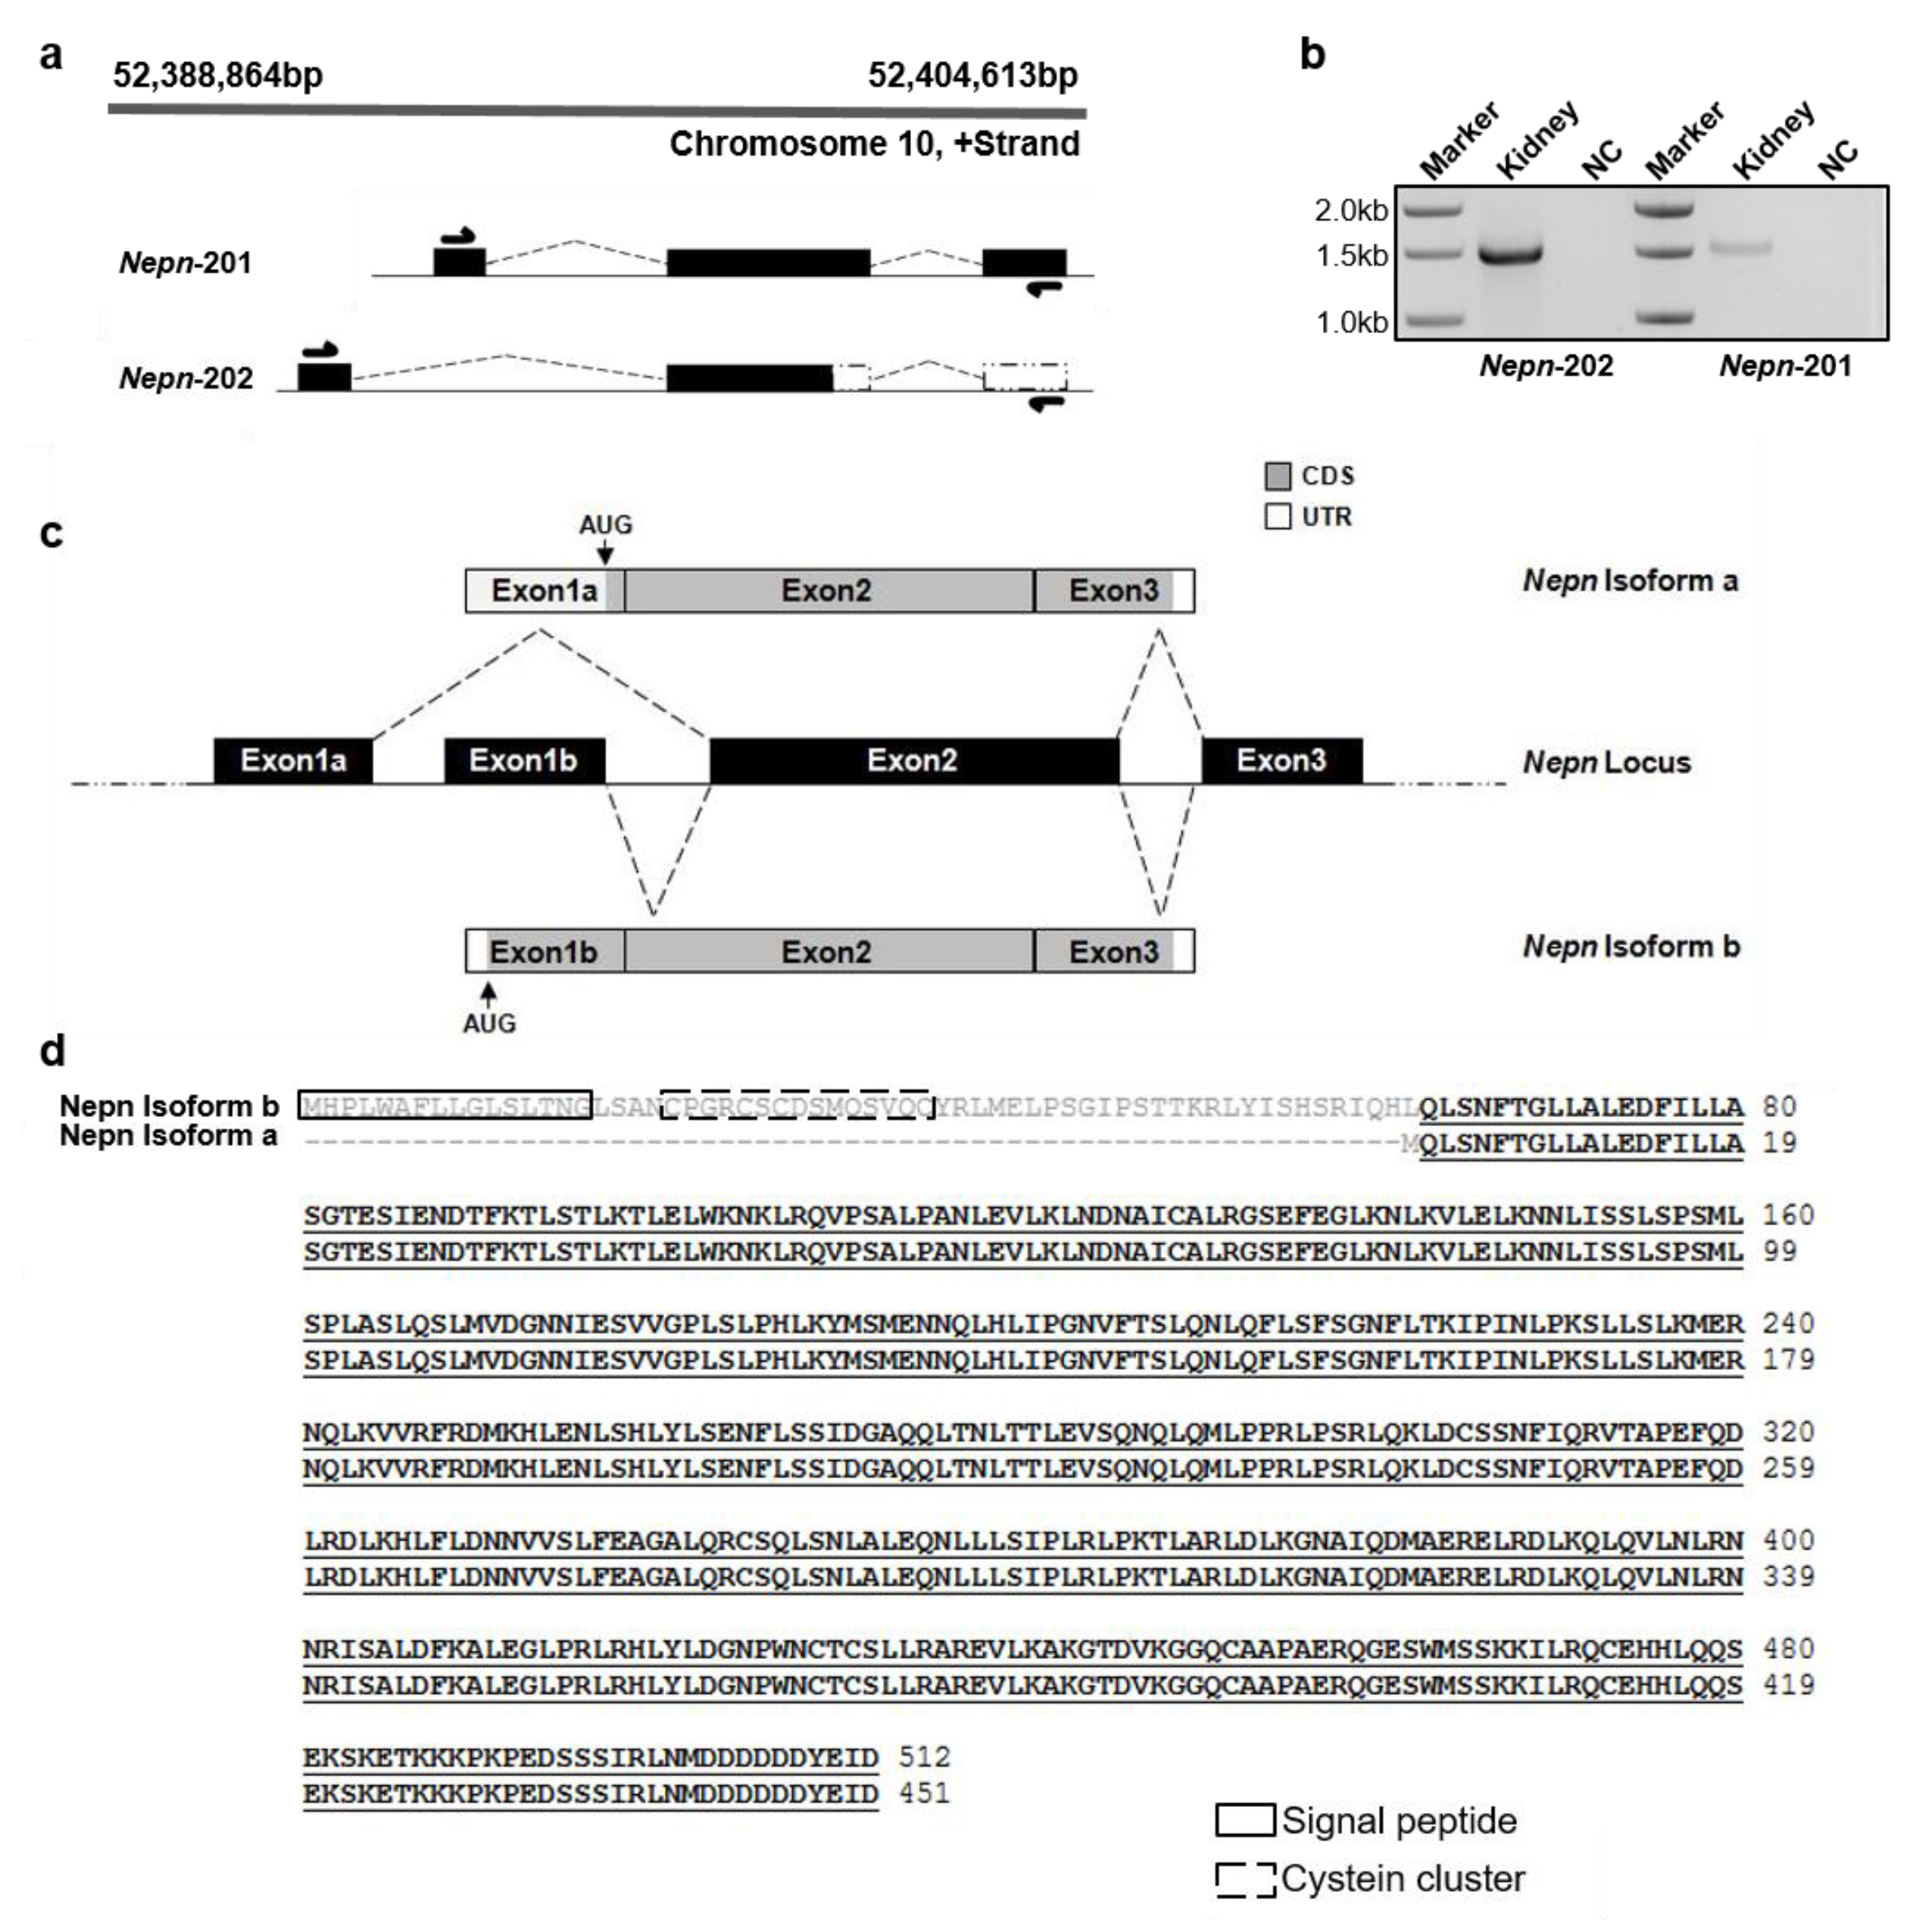
2.1. Evidence for a New Transcript Variant of Nephrocan in mouse

Nepn gene is localized on murine chromosome 10 (10qB3) on positive strand, spanning 12,997 bases from position 52,388,864 bp to 52,404,613 bp (Figure 1a top). To date, only one transcript of 1826 bp (NM_025684.2 indicated as Nepn-201) has been validated, which contains three exons and codes for a protein containing 512 amino acids [17]. Another incomplete transcript is reported on Ensembl database (Transcript ID: ENSMUST00000219730.1 indicated as Nepn-202) consisting of a different exon 1 and a portion of exon 2 with a predicted 201 amino acids polypeptide. Based on this evidence, we hypothesized the presence of a second isoform composed by an alternative exon 1, exon 2 and exon 3. To experimentally validate the existence of this new transcript, we designed two forward primers which recognize specifically the two putative alternative exons 1, and a reverse primer located in exon 3 (Figure 1a bottom). The RT-PCR performed on adult mouse kidney revealed an expected band of 1536 bp for Nepn-201 (hereafter Nepn isoform b), and another smaller transcript of 1496 bp for Nepn-202 (hereafter Nepn isoform a), indicating that both full-length isoforms exist and are detectable (Figure 1b). As shown in the schematic illustration of Nepn genomic locus (Figure 1c), Nepn isoform a (1863 bp) transcript consists of three exons: exon 1a, exon 2 and exon 3. Almost whole exon 1a consists of a 5′ untranslated region (UTR) except for the last two bases, which form the start codon (AUG) with the first base of the exon 2. The open reading frame of Nepn isoform a encodes a polypeptide of 451 amino acids, which differs from Nepn isoform b protein for the absence of 62 amino acids at the N-terminus and the consequent loss of a putative signal peptide that directs the protein secretion and cysteine cluster (Figure 1d).

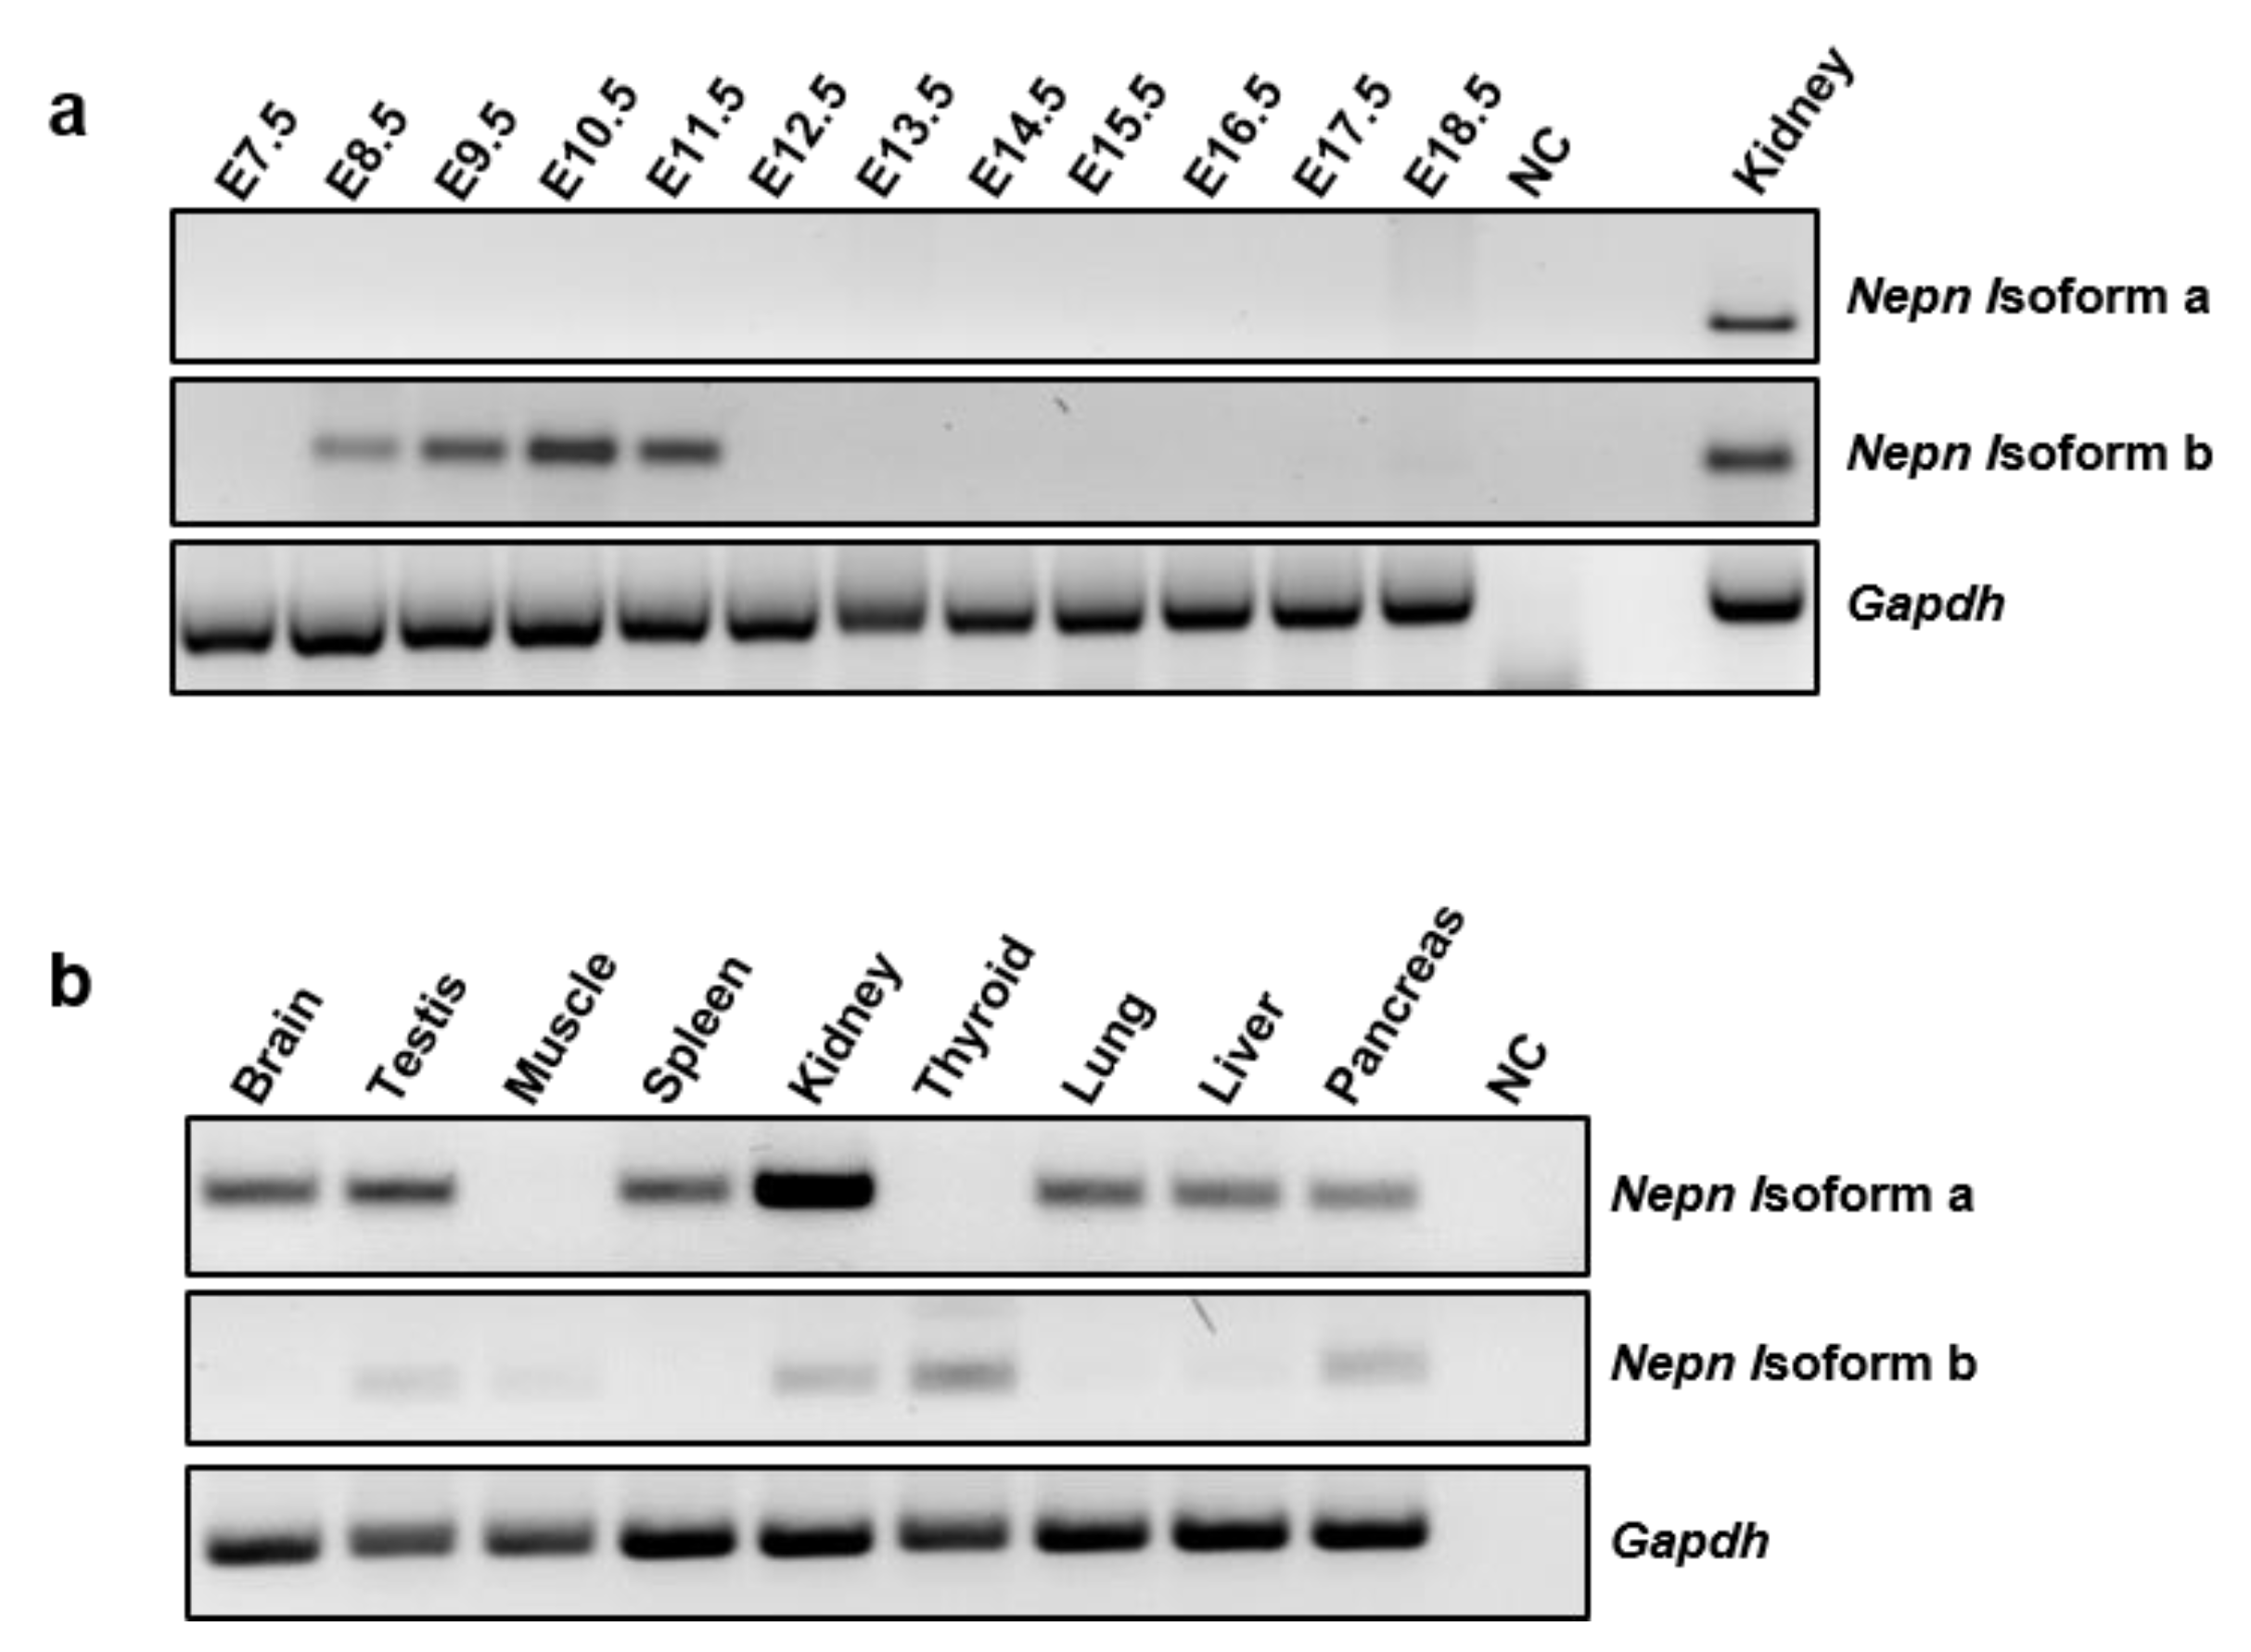
2.2. Nepn Isoforms Expression Pattern in Mouse Development and Tissues

As the existence of a new Nepn transcript has been validated, we analyzed the expression pattern during embryogenesis and the tissue specific distribution of both isoforms. Interestingly, during embryo development, only Nepn isoform b transcript is detectable, and in particular, it shows a well-defined time window expression between the embryonic stages E8.5–E11.5 (Figure 2a). Since the restricted expression to the dorsal pancreatic bud (DPB) at the developmental stage E10.5 has been already reported [17], this strengthens the hypothesis that it could play an important role in pancreatic specification. We also analyzed the expression of both isoforms in several adult mouse tissues, deriving from all three germ layers. As shown in Figure 2b, the expression of Nepn isoform a was detected in most of the tissues analyzed, except for muscle and thyroid, whereas Nepn isoform b was found to be expressed in kidney, thyroid, pancreas and to a much lesser extent, in testis and muscle.

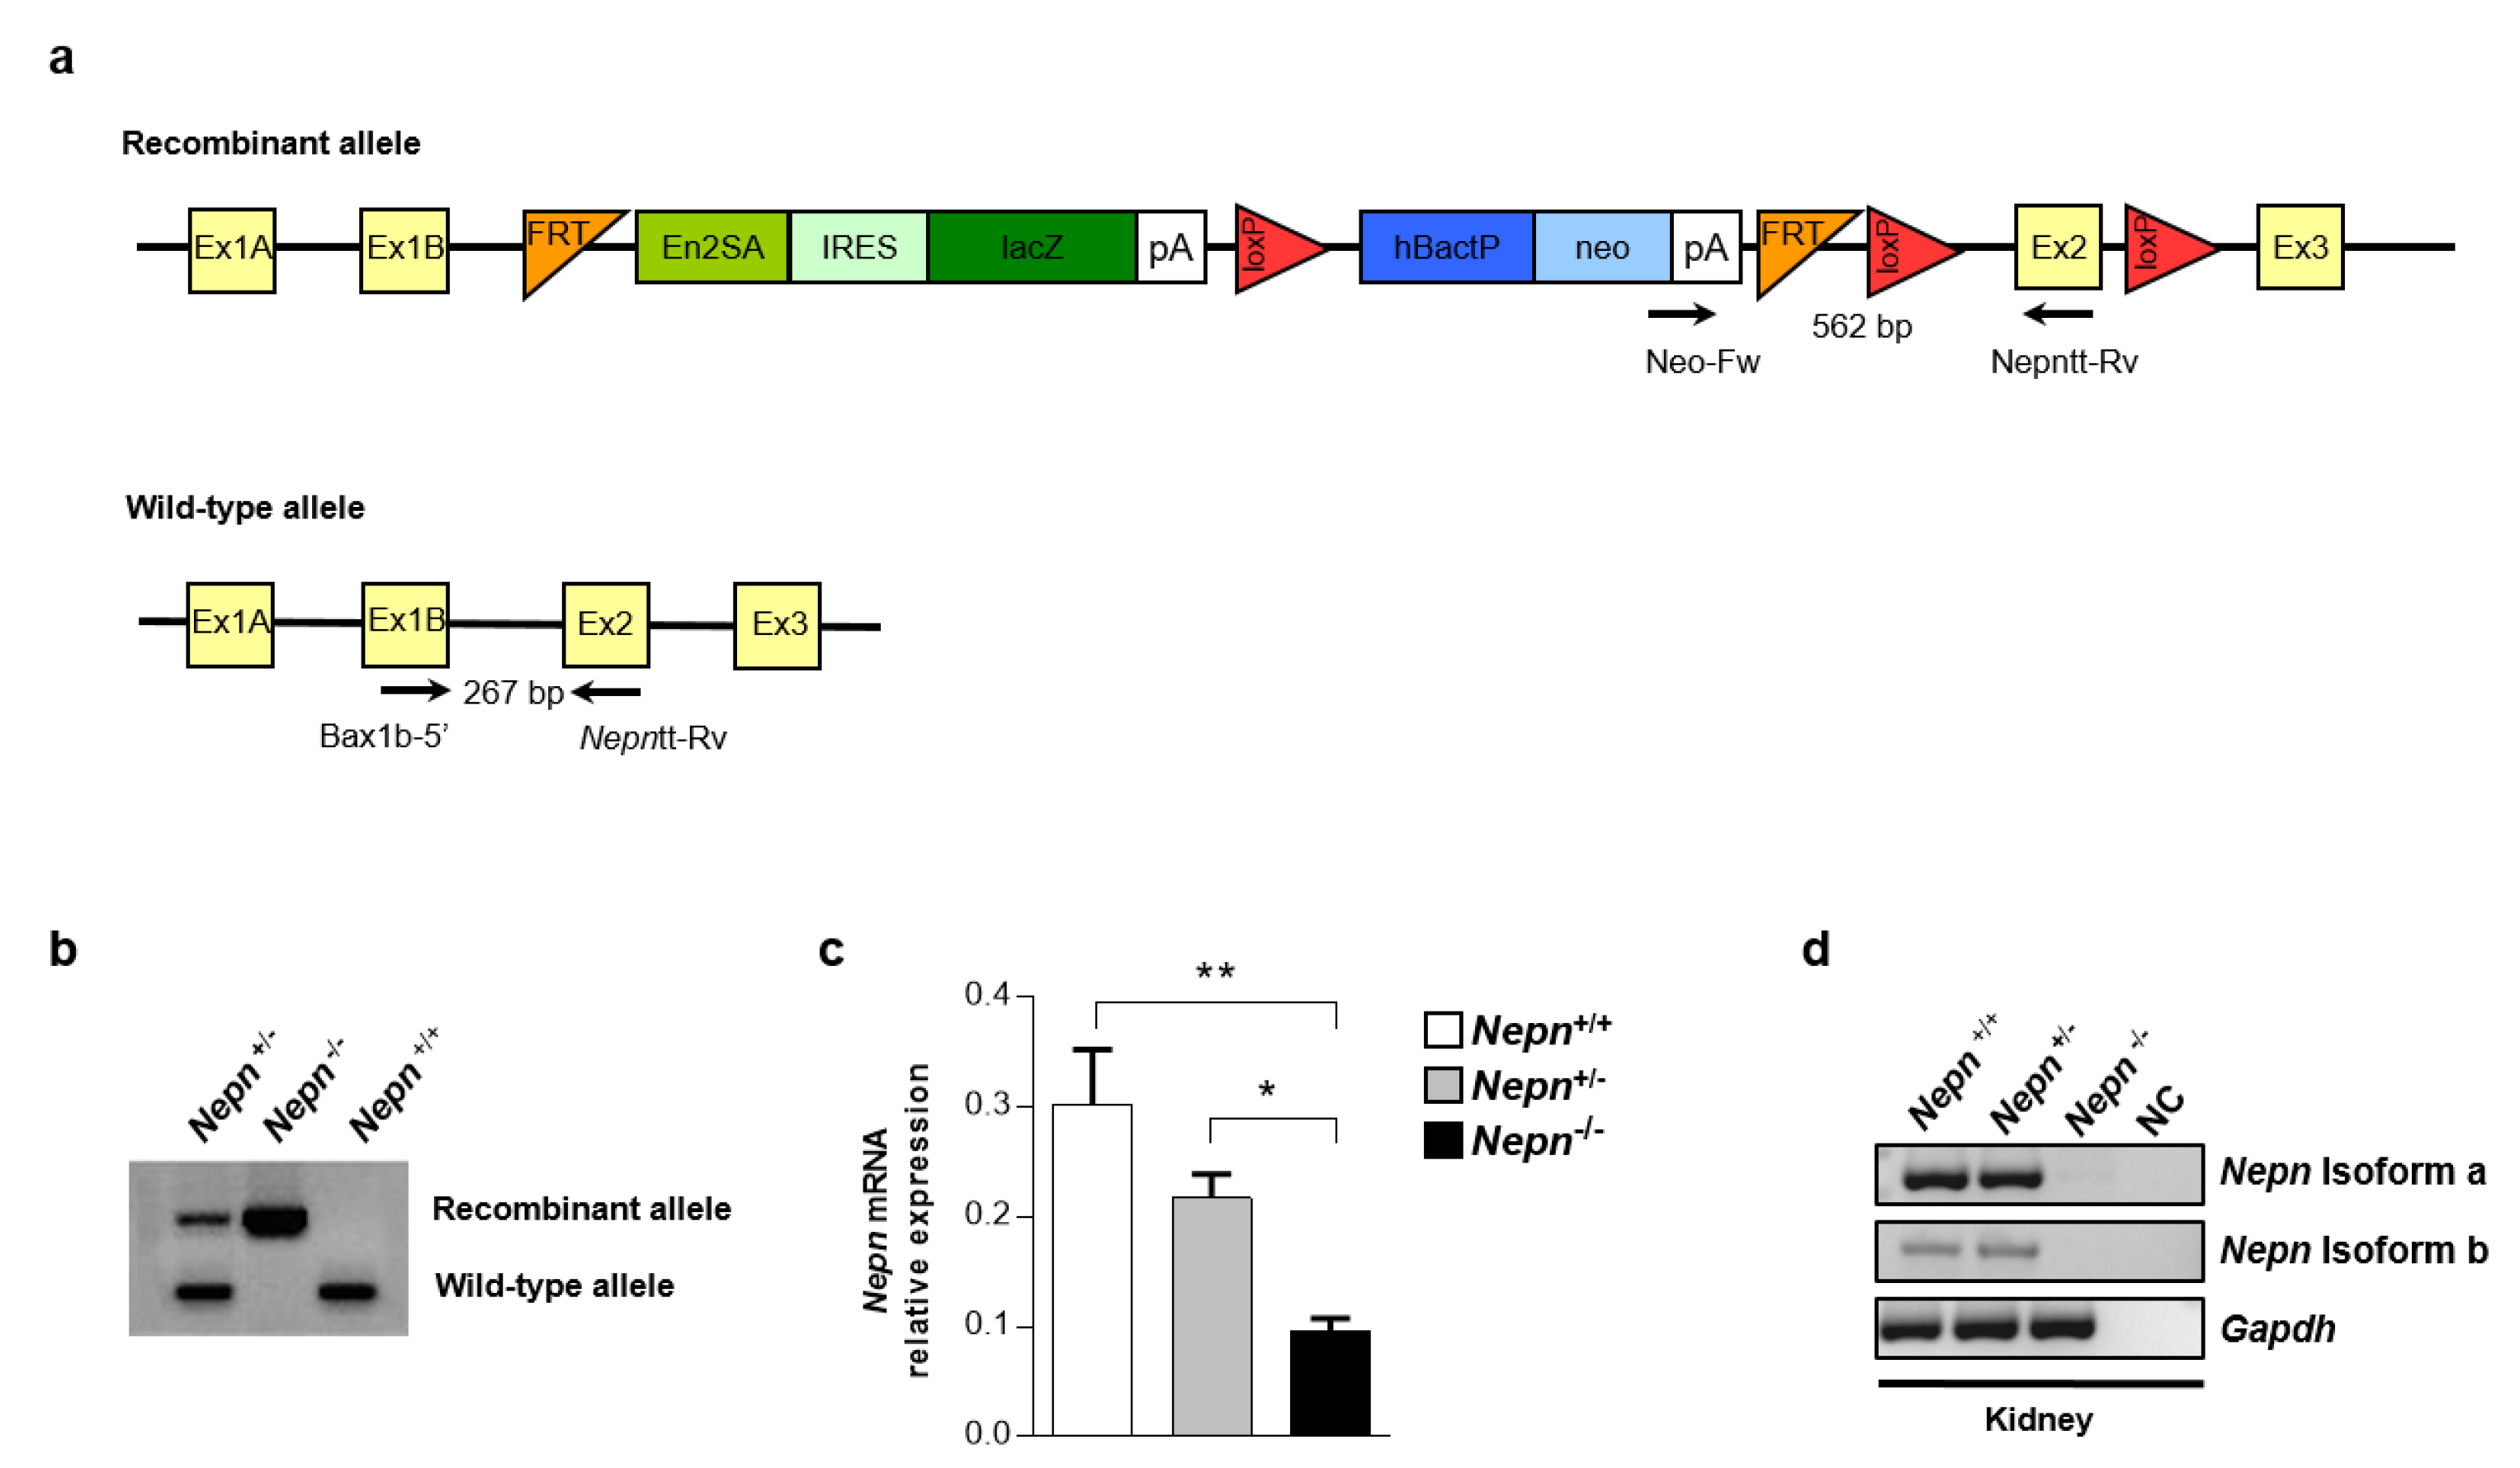
2.3. Nepn Knockout First Mouse (NepnKOfirst) Generation

To shed light on Nepn role in pancreatic development, mESCs from Komp Repository, carrying a genetically modified Nepn allele (Figure 3a), were microinjected into C57BL/6N blastocysts and transferred to a pseudopregnant recipient mice [20]. Chimeric offspring were then mated with wild-type mice which resulted in a certain percent of heterozygous progeny carrying the transgene in F1. Finally, the heterozygous mice were crossed to obtain homozygous mutant mice in F2. To discriminate homozygous from heterozygous mice, a genotyping analysis was performed using two different forward primers, each one specific for the wild-type or recombinant allele, in combination with a common reverse primer (Figure 3a), which resolved in a different amplicons size (Figure 3b). To avoid the problem of neo toxicity in homozygous NepnKOfirst mouse, neo expression cassette was removed by crossing muted mouse with C57BL/6N congenic constitutive Cre deleted mice [21]. All experiments illustated are peformed using a NepnKOfirstΔneo mice (so called Nepn−/− or Nepn+/−). Analyses of Mendelian ratio from breeding of Nepn heterozygous mutant mice (Nepn+/−) show no altered Mendelian ratio suggesting that loss of Nepn does not affect mice survival (Table 1).
Moreover, WT and Nepn KO littermates were similar in size, in the appearance of the fur and gross morphology. In order to further validate the absence of both Nepn isoforms in knockout first mouse, we performed an RT-qPCR on the transcript’s portion shared by both isoforms. Since it was still possible to appreciate a residual expression of the gene in Nepn−/− mouse (Figure 3c), we performed an RT-PCR to discriminate which of the two isoforms was still expressed. As shown in Figure 3d, it was possible to detect a slight expression of Nepn isoform a, whereas Nepn isoform b was completely shut down. We cannot rule out that this tiny expression could overcome KO affects.

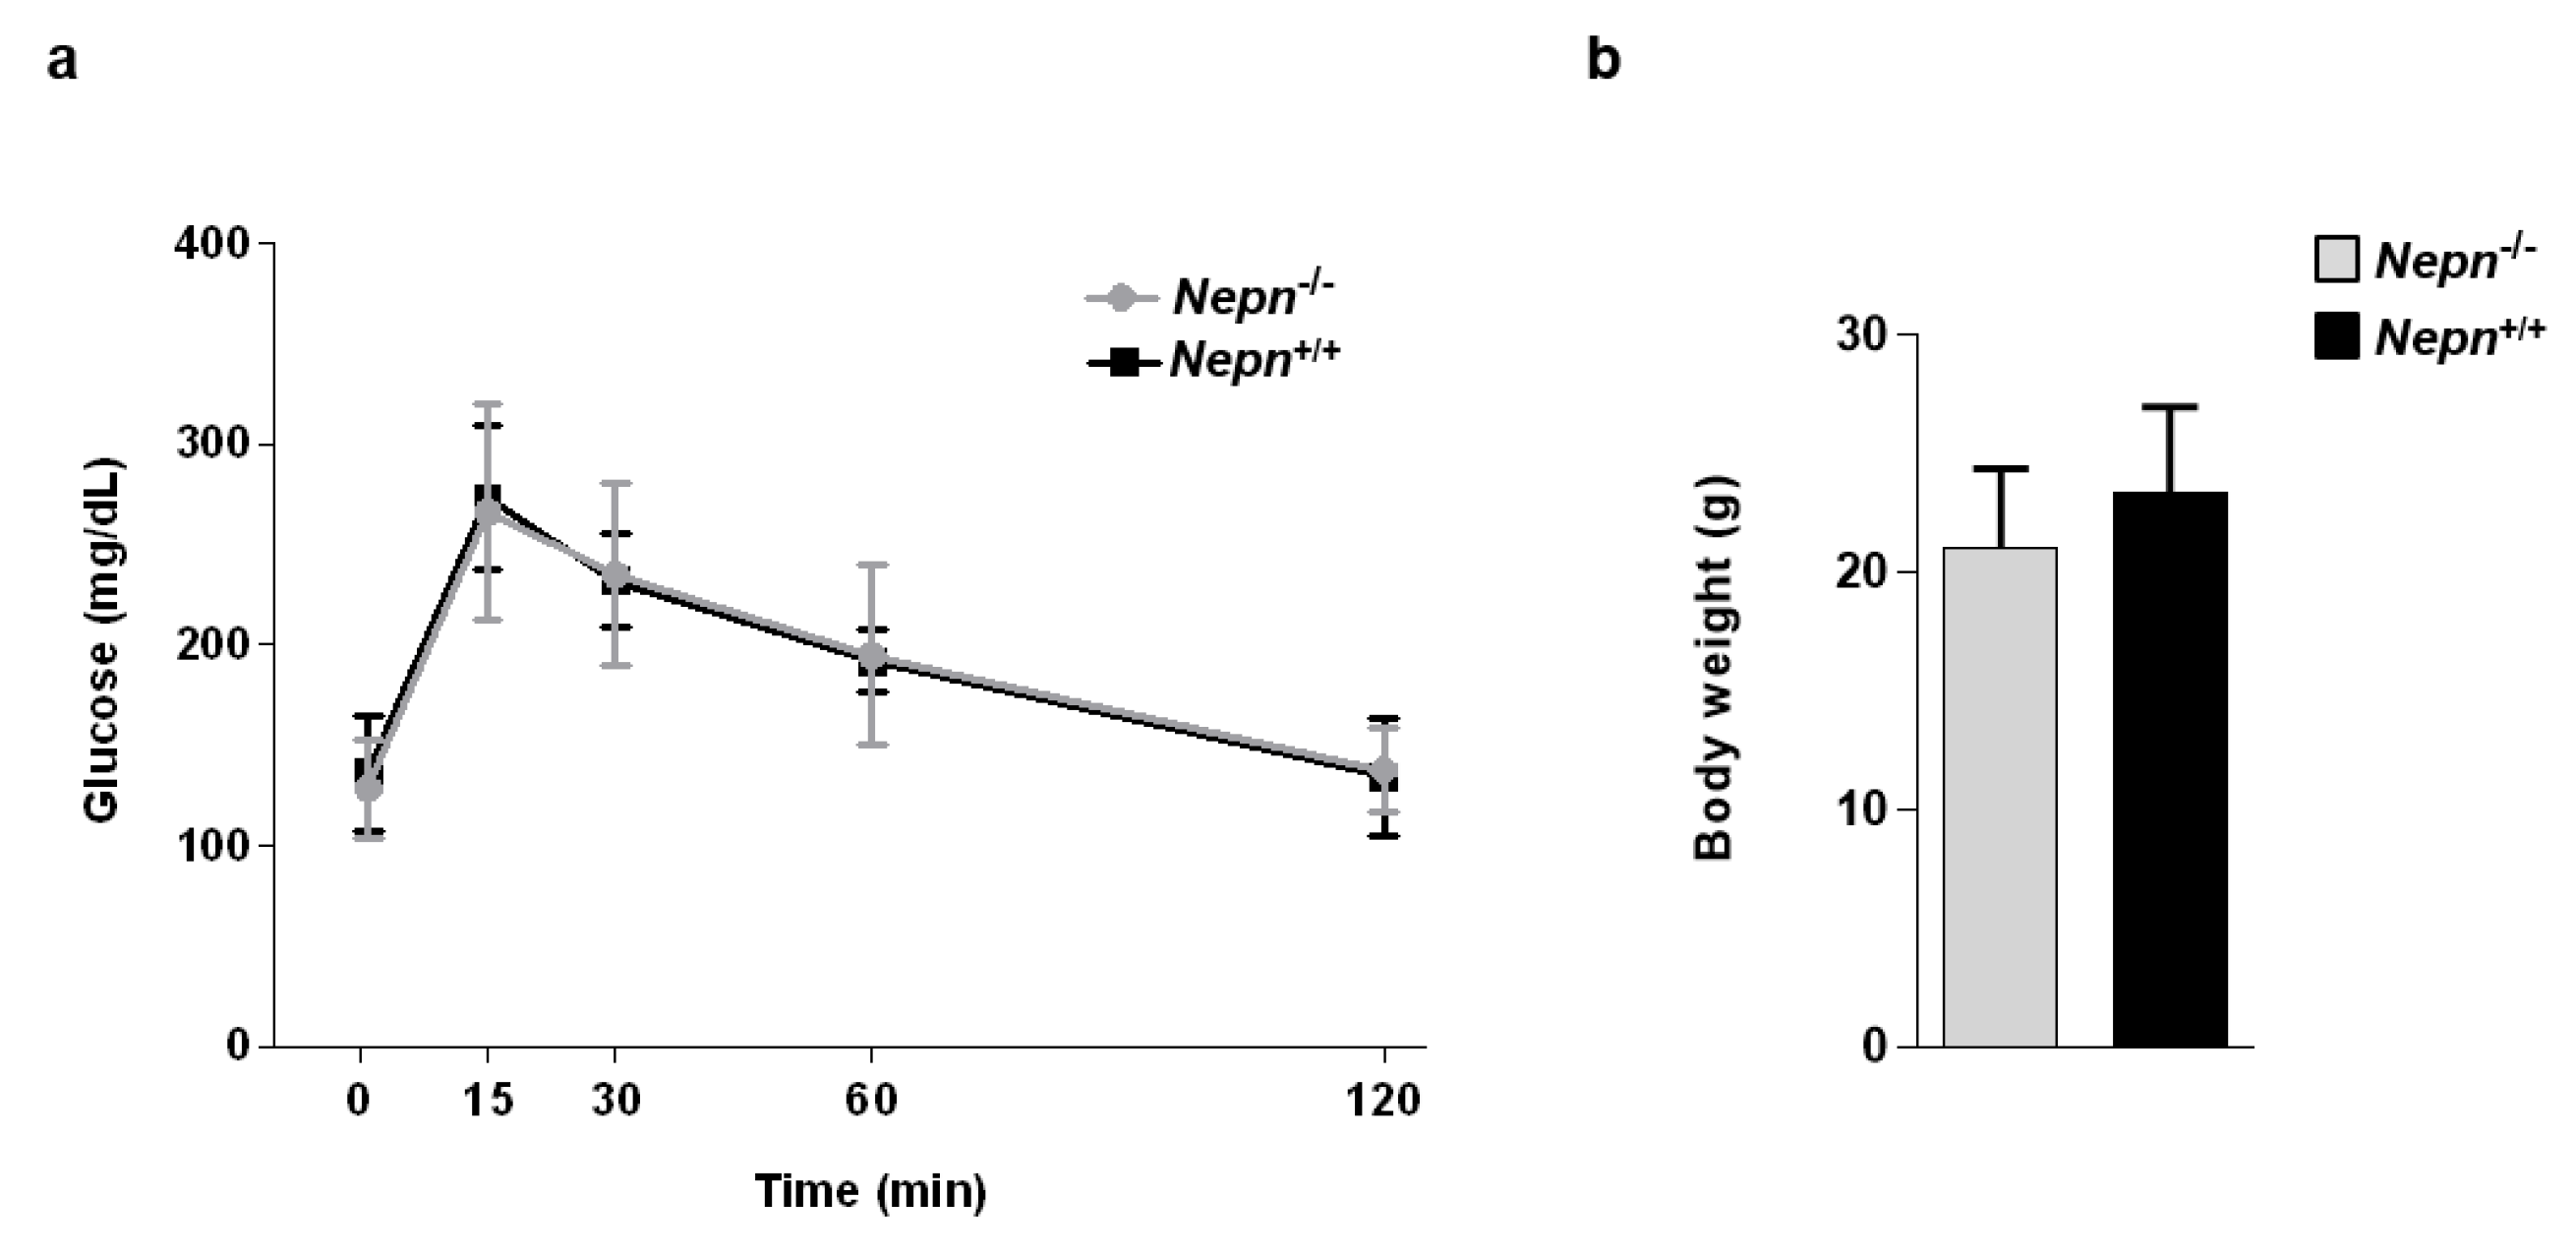
2.4. Characterization of Pancreatic and Renal Functionality

Since our main interest is to characterize the role of Nepn in pancreatic homeostasis, we evaluated the pancreatic functionality of the Nepn knockout mouse model, performing an intraperitoneal glucose tolerance test (IPGTT) [22]. After intraperitoneal injection, we measured the blood glucose levels at different time points during the following 120h, and as shown in Figure 4a, Nepn−/− animals have the same glucose induction and clearance curve compared to Nepn+/+ mice. This shows out that the absence of Nepn does not result in any type of alteration of glucose metabolism in mice 4–6 months old. The same measurements were carried out on mice at different ages (7–12 months), but still, no differences were observed (see Supplementary Figure S1). The intraperitoneal glucose administration can exclude the implication of a response driven by incretin hormones, which are gut peptides that are secreted after nutrient intake and stimulate insulin secretion together with hyperglycemia [23]. We, therefore, examined whether Nepn gene depletion may affect the body weight control at different ages. Nepn−/− mice body weight was measured and compared to Nepn+/+ mice: both mice cohorts gained similar amounts of weight, indicating that the absence of Nepn is not directly correlated to metabolism and nutrient assimilation (Figure 4b and Supplementary Figure S1).
Nepn transcript is predominantly expressed in the kidney in adult mice [17], therefore we investigated the impact of Nepn deficiency on renal functionality. Nepn−/− mice were accommodated in metabolic cages and urine volume, osmolality, electrolytes, and creatinine clearance were evaluated to assess renal homeostasis. Table 2 summarizes urinary parameter values measured in mice of 4–6 months old, showing the absence of significative variations between wild-type and mutant mice in renal functionality. The mice were monitored until 12 months, evaluating the same renal parameters to asses that no metabolism changes could occur in aged mice (Supplementary Table S1). Finally, serum analysis showed no differences in triglycerides, total cholesterol, urea, calcium and phosphorus levels (Supplementary Figure S2).

2.5. Generation of Nepn Deficient mESCs by RNA-Guided CRIPSR/Cas9

Since Nepn−/− mouse has shown no phenotype, we moved to a new cell system to pinpoint Nepn role in endodermal development, generating a homozygous deletion for Nepn in mESCs using CRISPR/Cas9 genome editing technology. First, we designed a gRNA to target Nepn isoform b (Figure 5a), which was found to be the exclusive one expressed in mouse development (Figure 2a). Second, the guide RNA was inserted in a construct encoding Cas9 for homologous recombination in Rosa26 genomic locus and then electroporated into wild-type mESCs. Finally, after selection, resistant clones were picked and expanded. Sanger-sequencing results revealed, among all picked colonies, a specific clone carrying a biallelic 13 bp deletion in Nepn exon1b (Figure 5b). The biallelic deletion causes a frameshift mutation few bases downstream ATG, resulting in a truncated peptide of 90 amino acids (Supplementary Figure S3). To further confirm the biallelic deletion, the selected clone was tested by RT-PCR using two different primer pairs. The first pair flanks the deleted region, which resolves in a band shift due to the different length in the amplicon size (Figure 5c top); the second pair has the forward primer which anneals on the deleted fragment leading to an amplification product only in the wild-type cell line (Figure 5d bottom). Nepn mutant mESCs colonies were indistinguishable in size and shape from unmodified cells (Figure 5d left), and growth rate was found to be comparable (data not shown). Moreover, we observed that the Nepn isoform b−/− mESCs showed no apparent loss of pluripotency since the expression of Oct4 and Nanog was not reduced (Figure 5 right), indicating that neither the genetic modification nor the absence of Nepn affected pluripotency and self-renewal properties.

2.6. Nepn Decifiency Impairs Endoderm Lineage Commitment

In vivo Nepn expression is restricted to a small subpopulation of endodermal cells at E7.25; afterwards (E8.0–8.5), this was found to be expressed in a wider region known as the midgut [18], to then relocate to the limited region of DPB [15]. We, therefore, focused on the possibility that Nepn may play a role in endodermal development and used an in vitro differentiation protocol, previously established in our laboratory, which is intended to recapitulate the endoderm development in vivo. Briefly, definitive endoderm (DE) formation (Metastate 1, M1) is induced during the priming step by Activin A. Sequently, the cells are further directed toward posterior foregut endoderm (PFE) (Metastate 2, M2) by RA and FGF10 (Figure 6a). We also confirmed that, as in vivo also in vitro, Nepn isoform b is the exclusive isoform expressed through developmental stages (Figure 6b). Finally, we induced mutant and wild-type cells to differentiate, and evaluated the expression of lineage specific markers. RT-qPCR analyses showed that the expression of DE marker FoxA2 remained mainly unchanged in Nepn isoform b−/− compared to Nepn isoform b +/+ suggesting that definitive endoderm induction was not affected by biallelic mutation of Nepn (Figure 6c top). Interestingly, although there was no visible morphology difference between wild type and mutant cell line (Figure 6c bottom), the absence of Nepn isoform b appeared to affect formation of PFE, since its specific markers, Sox9, Gata-4 and Gata-6, turned out to be expressed to a lesser extent in mutant cell line compared to wild-type (Figure 6c top).

3. Discussion

The embryonic definitive endoderm (DE) gives rise to organs of the respiratory and gastrointestinal tract including the pancreas, liver and epithelia of the colon and lung. Due to poor knowledge of molecular mechanisms that guide the in vivo endoderm specification, interest in the identification of novel endoderm genes is growing. On the other hand, elucidation of cellular components and genes governing tissues development is critical to understand the cause of organ disorders and cancers and will lead to novel therapies for tissue and organ regeneration. Nepn is a member of small leucine-repeat (SLRP) family of proteins. It is a secreted, N-glycosylated inhibitor of TGF-β and is expressed in the early stages of murine endoderm specification (E7.5–11.5) [15,17,18]. Here, a novel transcript of mouse Nepn gene was identified through bioinformatics tools and molecular biology techniques. This novel transcript, named Nepn isoform a, was found to be expressed in different tissues, but not during embryo development. The alignment of isoforms protein sequences highlighted the absence of the secretion signal peptide at the N-terminus. Since cellular localization of a protein plays an important role in defining its function, we speculate that the absence of important domains in the smaller variant might directly affect the secretion capability and activity of this protein. To further characterize Nepn isoform b role in endoderm patterning, we generated a mouse model with genetic depletion of Nepn isoform b, but found no obvious phenotype alterations, not even pancreas and renal functionality. One possible explanation for this apparent lack of an effect could be the presence of residual expression of Nepn isoform a, which could overcome KO effects. Moreover, it is possible that Nepn isoform b function may instead rely on other SLRP family members, since, e.g., Decorin (DCN) has been shown to bind TGF-β as a regulator of growth factors functions [24,25,26]. At present, 15 SLRP members have been cloned and partially characterized, and most are located in clusters on mouse and human chromosome [27]. Here, we have also generated a nullizygous Nepn isoform b knock-out mESC line using CRISPR/Cas9 system. This technology, due to its advantages in the high efficiency and specificity of gene targeting, is largely used in gene-editing [19]. Combining embryonic stem cell technology with CRISPR/Cas9 gene-editing provides an important strategy to clarify the biological role of markers, the understanding of normal embryonic development as well as the pathogenesis of diseases. We applied an in vitro differentiation protocol, previously established in our laboratory [15], which allows for robust and efficient generation of endodermal cells within eight days under chemically defined conditions. Interestingly, it is notable that posterior foregut markers, such as Sox9, Gata-4 and Gata-6, turned out to be expressed to a lesser extent in mutant cell line compared to wild-type. It has been reported that the homozygous deletion of both Gata4 and Gata6 is necessary to disrupt pancreas development in mice [28,29,30]. Moreover, Xuan et al. recently demonstrated the importance of GATA4/6-mediated inhibition of hedgehog signaling as a major mechanism regulating pancreatic endoderm specification during patterning of the gut tube [31]. Our findings suggest that Nepn isoform b KO, interfering with Gata4 and Gata6 expression, may have an effect on the posterior foregut development and on the cell ability to reach posterior foregut metastate. Thus, it will be interesting to characterize the molecular interaction between Nepn isoform b-Gatas signaling during mouse endoderm development. Moreover, Nepn isoform b is expressed in adult mouse tissues, derived from the other two germ layers. We, therefore, speculate that it could also play a role in the specification of mesoderm and ectoderm derived tissues. Hence, it will be fascinating to explore Nepn isoform b function in differentiation assays towards the other two germ layers.

4. Materials and Methods

4.1. Ethics Statements and Animal Experiments

All animal studies were conducted at Biogem S.c.a.r.l. Ariano Irpino, AV (Italy), Preclinical Research and Development Service. Animals have been housed and used following the rules of the Italian laws (DL.vo N° 116—27/01/1992 and related) and of the EU directive (2010/63/UE—22/09/2010) on the protection of animals used for experimental purposes. All the in vivo procedures were in compliance with the Guide for the Care and Use of Laboratory Animals (United States National Research Council, 1996). All the in vivo experimental activities were evaluated and approved by the Committee for the Ethics of the Experimentations on Animals (CESA) and by Organismo Benessere Animale (OBA) of Biogem with ID: 7717 (Protocol Number: 7F782_20; 8 May 2017) and were authorized by the Italian Minister of Health (Authorization Number 384/2017-PR) according to the decree nr 100/2006 and later decree 26/2014. Wild type C57BL/6J (herein referred to as B6) mice were purchased from Charles River Laboratories (Wilmington, MA, USA). Animals were housed in an animal house under controlled conditions of temperature (22 ± 1 °C), humidity (55 ± 10%) and lighting on a 12-h light/12-h dark cycle and were supplied with standard rodent food and water ad libitum. Mice for testing were produced by crossing heterozygous females with heterozygous males. Littermate controls were used for all experiments. For tissue collection, all surgery was performed under anesthesia. All efforts were made to minimize suffering.

4.2. Generation of a Constitutive Nepn Knockout Mouse Line

For the generation of the Nepn KO first mouse line, one positive ES cell JM8.N4 clones (EPD0686_5_C01), containing a Nepn modified locus (Nepn knockout first allele), were purchased from Knockout Mouse Project (KOMP) Repository. Briefly, this knockout first allele contained a 2080 bp 5′ homology arm, an FRT-flanked cassette containing a lacZ reporter gene driven by Nepn promoter, a PGK neomycin resistance gene for positive selection (both separated by a loxP sequence) and two loxP sites flanking exons 2 and 3 of Nepn gene as well as a 6930 bp 3′ homology arm. To confirm the presence of the second loxP site flanking the exons 2 and 3 in these ES clones, long-range PCR was used to amplify the 3′ modified homology arm using KOMP primers. The presence of the loxP site generates a new restriction site for the restriction endonuclease SacI. Thus, digestion with this enzyme and sequence analysis allowed us to confirm the presence of this modification, and therefore, the presence of the Nepn modified locus. The positive JM8.N4 modified clone containing Nepn knockout first alleles was subsequently injected into C57Bl/6N blastocysts. Only male mice positive for germ-line transmission were used as the founder of the Nepn knockout first mouse line. By breeding Nepn heterozygous mutant mice, we obtained the constitutive Nepn knockout mice. Mouse genotyping was performed with genomic DNA samples isolated from ear. Standard PCR protocols were used to amplify the wild-type and knockout first alleles of the Nepn gene. Mice genotyping was verified by PCR using the following primers: Cds-Neo, Bax1b-5′ and Cds-Nepn-tt (Supplementary Table S2). To remove neo expression cassette, Nepn KO first mice were intercrossed with C57BL/6N congenic constitutive Cre deleted mice (Tang SH, Silva FJ, Tsark WM, Mann JR, 2002) and additional rounds of breeding were then performed in order to produce animals that were negative for the Cre transgene. Mouse genotyping was performed with genomic DNA samples isolated from ear biopsies that were taken from each animal at weaning. Standard PCR protocols were used to amplify the wildtype and knockout alleles of the Nepn gene. PCR was performed using the following primers: lacZ-(Cre)-Fw, Int1-Fw and Int1-Rv.

4.3. Cell Culture and Differentiation Protocol

Undifferentiated wild-type and the CRISPR/Cas9 knockout mESCs were cultured on gelatin-coated feeder-free plates in Dulbecco’s Modified Eagle Medium (DMEM, Sigma Aldrich, St. Louis, MO, USA) supplemented with 15% FBS (HyClone, Logan, UT, USA), 1000 units/mL ESGRO® leukaemia inhibitory factor (LIF) (Merck Millipore, Burlington, MA, USA), 1.0 mM sodium pyruvate (Invitrogen, Waltham, MA, USA), 0.1 mM non-essential amino acids (Invitrogen), 2.0 mM L-glutamine (Invitrogen), 0.1 mM β-mercaptoethanol (Sigma Aldrich) and 500 U mL−1 penicillin/streptomycin (Invitrogen). ESCs were incubated at 37 °C in 5% CO2; medium was changed daily and cells were split every 2 to 3 days routinely. For the endoderm differentiation, 5 × 10⁴/plate cells were seeded in 35 mm dishes, as a feeder free monolayer. The differentiation medium consists of DMEM Low Glucose (Lonza, Valais, Switzerland), supplemented with 5% FBS (HyClone), 2 mM L-Glutamine (Gibco), 1 mM non-essential amino acids (Gibco, Dublin, Ireland), 100 U-μg/mL Penicillin/Streptomycin (Gibco), 0.1 mM β-Mercaptoethanol (Sigma Aldrich,, depleted of LIF, with 200 μg/mL Matrigel (BD Biosciences, Qume Drive, San Jose, CA, USA) and treated sequentially with several molecules at different time point for 8 days. These factors included activin A (20 ng/mL, R&D Systems, Minneapolis, MN, USA), all trans retinoic acid (RA, 5 μM, Sigma Aldrich), fibroblast growth factor 10 (Fgf10, 10 ng/mL, R&D Systems), cyclopamine (CYC, 10 μM, Sigma Aldrich) and N-N-(3,5-difluorophenacetyl)-Lalanylsphenylglycinet- butylesterm (DAPT, 5 μM, Sigma Aldrich). Medium was changed every 2 days.

4.4. Vector Construction

SpCas9 was used for editing the first exon of the Nepn gene. The mammalian codon-optimized Streptococcus pyogenes Cas9 gene was obtained from VP12 plasmid (Addgene plasmid ID 72247). It was digested with the two restriction enzymes NotI and PmeI and cloned into pENTR1A no ccDB (w48-1) plasmid (Addgene plasmid ID:17398). The gRNA expression cassette was amplified from the BPK1520 plasmid (Addgene plasmid ID: 65777), the amplicon was digested with SpeI and cloned into the pENTR1A no ccDB/Cas9 vector. gRNA4 was designed using crispr.mit.edu web tool. Paired oligos corresponding to Nepn gRNA4 (5′-AGGCTCATGGAACTCCCATC-3′) were cloned into the vector. In vitro recombination between pENTR1A no ccDB/BPK1520/Cas9 and pBS-Rosa26/ccDB vectors was obtained using the Gateway LR Clonase II enzyme mix according to the manufacturer’s directions (Invitrogen).

4.5. CRISPR/Cas9 Genome Editing

pENTR1A no ccDB/BPK1520/Cas9-pBS-Rosa26/ccDB construct was electroporated into mESCs. One to two weeks later, colonies were growing in the culture plate. Using 100 μL pipette tips, the colonies were picked up and placed individually in the 96 well culture plate filled with trypsin. After dissociation into single cells, the colonies were transferred onto gelatin-coated 24-well plates and then expanded in 10 cm plates separately. Furthermore, the genotyping by PCR/TA-cloning and chromatogram sequencing were used to analyze the mutations and select the positive clones for analysis and differentiation experiments. The primers (5′–3′) used for genotyping are Nepn Crispr F3-R2 (see Table S2).

4.6. RNA Extraction, RT-PCR Analysis and Quantitative Real Time RT–qPCR

Total RNA was extracted using TRIzol reagent (Invitrogen) and cDNA was synthesized using iScript cDNA Synthesis kit according to the manufacturer’s instructions (Bio-Rad, Hercules, CA, USA). 1 μg of total RNA was used for each cDNA synthesis. Primer 3 software (http://primer3.ut.ee/) was used to design the oligo primers setting the annealing temperature to 59–61 °C for all primer pairs. Oligo sequences are reported in Table S2. Each PCR reaction was performed with 25 ng of single stranded cDNA as template and the appropriate set of forward and reverse primers. PCR amplification conditions are reported in Table S3 for Nepn-201, and Nepn-202 was performed under the following: initial denaturation for 3 min at 95 °C; repeated 35 cycles of denaturation for 30 s at 93 °C; annealing for 20 s at 58 °C; extension for 40 s at 72 °C. This was followed by final extension at 72 °C for 8 min.
For gene expression analyses, the same amount of cDNA (25 ng) was used for each PCR reaction with each primer pair (forward/reverse primers mix: 0.2 μM, in a final volume of 25 μL). Real time-qPCR analysis was performed using the iTaq™ Universal SYBR® Green Supermix (Bio-Rad, Hercules, CA, USA) in a 7500 Real-Time PCR System (Applied Biosystems, Foster City, CA, USA) under the following conditions: 2 min at 50 °C, 10 min at 95 °C, followed by 40 cycles of 15 s at 95 °C and 1 min at 60 °C. The Gapdh probe served as a control to normalize the data. The gene expression experiments were performed in triplicate on three independent experiments and a melting analysis was performed at the end of the PCR run. To calculate the relative expression levels we used the 2−DDCT method [32,33].

4.7. Experimental Study for Renal Functionality

All experiments were conducted on age and gender-matched animals. Mice were housed individually in metabolic cages for 5 days at 23 °C with a 12 h dark/light cycle. Food and water were offered ad libitum. After 4 days of adjustment, physiological parameters were evaluated on day 5. 24 h urine output was collected under mineral oil to prevent evaporation. Urinary osmolality was measured by Osmometer 3320 (Advanced Instrument, Inc, Norwood, MA, USA)

4.8. Intraperitoneal Glucose Tollerance Test (IPGTT)

All experiments were conducted on age and gender-matched animals. Mice were housed individually in cages at 23 °C with a 12 h dark/light cycle and were fasted for 18 h. After fasting, mice were weighed and received an intraperitoneal injection of glucose (2 mg/g of body weight). Blood glucose levels were measured before glucose injection and after 15, 30, 60 and 120 min after glucose injection by using the OGCare glucometer (Biochemical Systems International S.r.l., Arezzo (AR), Italy).

4.9. Serum Analyses

Blood samples from mice at different ages (4–6 months, 7–12 months) were collected and centrifuged for 5 min at 5000 rpm. Serum supernatants were recovered and analyzed by SCIL VITROVET; in particular, triglycerides (mg/dl), total cholesterol (mg/dl), urea (mg/dl), calcium (mg/dl) and phosphorus (mg/dl) were measured.

4.10. Statistics

Graphpad Prism 5 software was used to perform statistical analysis. Values are presented as mean ± SD. p-values were determined using a two-tail unpaired t-test. p < 0.05 was used as a threshold for statistical discernibility.
Data Availability. The datasets generated during the current study are available from the corresponding author upon reasonable request.

Supplementary Materials

The following are available online at https://www.mdpi.com/1422-0067/21/1/8/s1. Supplementary Figure S1: Pancreatic functionality. (a) Intraperitoneal Glucose Tolerance Test (IPGTT). Evaluation of blood glucose of Nepn−/− mice compared to Nepn+/+ in a group of 7–12 months old mice. In the figure, blood glucose levels are represented at 0, 15, 30, 60 and 120 min from the glucose administration (Nepn+/+: 7 mice; Nepn+/+: 7 mice). (b) Evaluation of mouse body weight of Nepn−/− compared to Nepn+/+ mice during time life in a group of 7–12 months old mice. Supplementary Figure S2: Serum levels parameters in a group of 4–6 months old mice. Triglycerides, total cholesterol, urea, calcium and phosphorus were measured—no significant differences between Nepn+/+ and Nepn−/− mice can be observed. Supplementary Figure S3: In Nepn−/− mESCs a frameshift mutation generates several stop codons (indicates as *), thus, inhibiting protein synthesis. Supplementary Table S1: Experimental study of renal functionality. Evaluation of urinary parameters in 24 h urine output of Nepn−/− mice compared to Nepn+/+ in a group of 7–12 months old mice. Supplementary Table S2: RT-PCR and RT-qPCR primers (5′–3′). Supplementary Table S3: PCR amplification conditions.

Author Contributions

G.F. and V.L. designed the study, supervised the experimental work. M.A., S.B., F.V., A.M., F.R., P.M., N.A.R. and F.A. performed in vitro experiments and analyzed data. I.G., E.A., M.T.D.A., A.I. and L.R. performed in vivo experiments and analyzed data. M.D.F. contributed to the interpretation of the results, provided critical comments to the manuscript and revised the text. M.A., V.L. and G.F. wrote the paper. All authors have read and agreed to the published version of the manuscript.

Funding

The research was supported by STAR Linea 1, 2014 (University of Naples Federico II) to G.F. and the Ministero dell’Istruzione, dell’Università e della Ricerca [PRIN 2017 XJ38A4 to G.F.].

Acknowledgments

We would like to thank Francesco Trepiccione for helpful discussion.

Conflicts of Interest

The authors have declared that no competing interests exist.

Abbreviations

B6C57BL/6J
CESAComitato Etico per la Sperimentazione Animale
DEDefinitive endoderm
E7.5Embryonic day 7.5
ESCsEmbryonic stem cells
mESCsMouse embryonic stem cells
PSPrimitive streak
EMTEpithelial-to-mesenchymal transition
METMesenchymal-to-epithelial transition
VEVisceral endoderm
PFEPosterior foregut endoderm
DPBDorsal pancreatic bud
SLRPSmall leucine-rich repeat protein
IPGTTIntraperitoneal glucose tolerance test
KOKnock-out
NepnNephrocan
WTWild-type
CRISPR/Cas9(CRISPR)/CRISPR-associated systems 9
UTRUntranslated region
RT-PCRReverse transcriptase-polymerase chain reaction
RT-qPCRReal Time-quantitative polymerase chain reaction
SDStandard Deviation
FRTFlip-recombinase targets
PGKPhosphoglycerate kinase 1
PAMProtospacer adjacent motif

References

  1. Wells, J.M.; Melton, D.A. Vertebrate endoderm development. Annu. Rev. Cell Dev. Biol. 1999, 15, 393–410. [Google Scholar] [CrossRef] [PubMed]
  2. Zorn, A.M.; Wells, J.M. Vertebrate endoderm development and organ formation. Annu. Rev. Cell Dev. Biol. 2009, 25, 221–251. [Google Scholar] [CrossRef] [PubMed] [Green Version]
  3. Tam, P.P.; Behringer, R.R. Mouse gastrulation: The formation of a mammalian body plan. Mech. Dev. 1997, 68, 3–25. [Google Scholar] [CrossRef]
  4. Kubo, A.; Shinozaki, K.; Shannon, J.M.; Kouskoff, V.; Kennedy, M.; Woo, S.; Fehling, H.J.; Keller, G. Development of definitive endoderm from embryonic stem cells in culture. Development 2004, 131, 1651–1662. [Google Scholar] [CrossRef] [PubMed] [Green Version]
  5. Nowotschin, S.; Hadjantonakis, A.K. Cellular dynamics in the early mouse embryo: From axis formation to gastrulation. Curr. Opin. Genet. Dev. 2010, 20, 420–427. [Google Scholar] [CrossRef] [Green Version]
  6. Acloque, H.; Adams, M.S.; Fishwick, K.; Bronner-Fraser, M.; Nieto, M.A. Epithelial-mesenchymal transitions: The importance of changing cell state in development and disease. J. Clin. Investig. 2009, 119, 1438–1449. [Google Scholar] [CrossRef] [Green Version]
  7. Burtscher, I.; Lickert, H. Foxa2 regulates polarity and epithelialization in the endoderm germ layer of the mouse embryo. Development 2009, 136, 1029–1038. [Google Scholar] [CrossRef] [Green Version]
  8. Kwon, G.S.; Viotti, M.; Hadjantonakis, A.K. The endoderm of the mouse embryo arises by dynamic widespread intercalation of embryonic and extraembryonic lineages. Dev. Cell 2008, 15, 509–520. [Google Scholar] [CrossRef] [Green Version]
  9. Nakaya, Y.; Sheng, G. Epithelial to mesenchymal transition during gastrulation: An embryological view. Dev. Growth Differ. 2008, 50, 755–766. [Google Scholar] [CrossRef]
  10. Lewis, S.L.; Tam, P.P. Definitive endoderm of the mouse embryo: Formation, cell fates, and morphogenetic function. Dev. Dyn. 2006, 235, 2315–2329. [Google Scholar] [CrossRef]
  11. Liu, P.; Wakamiya, M.; Shea, M.J.; Albrecht, U.; Behringer, R.R.; Bradley, A. Requirement for Wnt3 in vertebrate axis formation. Nat. Genet. 1999, 22, 361–365. [Google Scholar] [CrossRef]
  12. Schier, A.F. Nodal signaling in vertebrate development. Annu. Rev. Cell Dev. Biol. 2003, 19, 589–621. [Google Scholar] [CrossRef]
  13. Vincent, S.D.; Dunn, N.R.; Hayashi, S.; Norris, D.P.; Robertson, E.J. Cell fate decisions within the mouse organizer are governed by graded Nodal signals. Genes Dev. 2003, 17, 1646–1662. [Google Scholar] [CrossRef] [PubMed] [Green Version]
  14. Winnier, G.; Blessing, M.; Labosky, P.A.; Hogan, B.L. Bone morphogenetic protein-4 is required for mesoderm formation and patterning in the mouse. Genes Dev. 1995, 9, 2105–2116. [Google Scholar] [CrossRef] [PubMed] [Green Version]
  15. De Angelis, M.T.; Russo, F.; D’Angelo, F.; Federico, A.; Gemei, M.; Del Vecchio, L.; Ceccarelli, M.; De Felice, M.; Falco, G. Novel pancreas organogenesis markers refine the pancreatic differentiation roadmap of embryonic stem cells. Stem. Cell Rev. 2014, 10, 269–279. [Google Scholar] [CrossRef] [Green Version]
  16. Iozzo, R.V. Matrix proteoglycans: From molecular design to cellular function. Annu. Rev. Biochem. 1998, 67, 609–652. [Google Scholar] [CrossRef] [Green Version]
  17. Mochida, Y.; Parisuthiman, D.; Kaku, M.; Hanai, J.; Sukhatme, V.P.; Yamauchi, M. Nephrocan, a novel member of the small leucine-rich repeat protein family, is an inhibitor of transforming growth factor-beta signaling. J. Biol. Chem. 2006, 281, 36044–36051. [Google Scholar] [CrossRef] [PubMed] [Green Version]
  18. Hou, J.; Wei, W.; Saund, R.S.; Xiang, P.; Cunningham, T.J.; Yi, Y.; Alder, O.; Lu, D.Y.; Savory, J.G.; Krentz, N.A.; et al. A regulatory network controls nephrocan expression and midgut patterning. Development 2014, 141, 3772–3781. [Google Scholar] [CrossRef] [PubMed] [Green Version]
  19. Sander, J.D.; Joung, J.K. CRISPR-Cas systems for editing, regulating and targeting genomes. Nat. Biotechnol. 2014, 32, 347–355. [Google Scholar] [CrossRef]
  20. Kumar, T.R.; Larson, M.; Wang, H.; McDermott, J.; Bronshteyn, I. Transgenic mouse technology: Principles and methods. Methods Mol. Biol. 2009, 590, 335–362. [Google Scholar] [CrossRef] [Green Version]
  21. Tang, S.H.; Silva, F.J.; Tsark, W.M.; Mann, J.R. A Cre/loxP-deleter transgenic line in mouse strain 129S1/SvImJ. Genesis 2002, 32, 199–202. [Google Scholar] [CrossRef]
  22. Ayala, J.E.; Samuel, V.T.; Morton, G.J.; Obici, S.; Croniger, C.M.; Shulman, G.I.; Wasserman, D.H.; McGuinness, O.P.; Consortium, N.M.M.P.C. Standard operating procedures for describing and performing metabolic tests of glucose homeostasis in mice. Dis. Model. Mech. 2010, 3, 525–534. [Google Scholar] [CrossRef] [PubMed] [Green Version]
  23. Nauck, M.A.; Meier, J.J. Incretin hormones: Their role in health and disease. Diabetes Obes. Metab. 2018, 20, 5–21. [Google Scholar] [CrossRef] [PubMed]
  24. Hildebrand, A.; Romarís, M.; Rasmussen, L.M.; Heinegård, D.; Twardzik, D.R.; Border, W.A.; Ruoslahti, E. Interaction of the small interstitial proteoglycans biglycan, decorin and fibromodulin with transforming growth factor beta. Biochem. J. 1994, 302, 527–534. [Google Scholar] [CrossRef] [PubMed]
  25. Takeuchi, Y.; Kodama, Y.; Matsumoto, T. Bone matrix decorin binds transforming growth factor-beta and enhances its bioactivity. J. Biol. Chem. 1994, 269, 32634–32638. [Google Scholar]
  26. Qin, P.; Haberbusch, J.M.; Zhang, Z.; Soprano, K.J.; Soprano, D.R. Pre-B cell leukemia transcription factor (PBX) proteins are important mediators for retinoic acid-dependent endodermal and neuronal differentiation of mouse embryonal carcinoma P19 cells. J. Biol. Chem. 2004, 279, 16263–16271. [Google Scholar] [CrossRef] [Green Version]
  27. Tasheva, E.S.; Klocke, B.; Conrad, G.W. Analysis of transcriptional regulation of the small leucine rich proteoglycans. Mol. Vis. 2004, 10, 758–772. [Google Scholar]
  28. Chia, C.Y.; Madrigal, P.; Denil, S.L.I.J.; Martinez, I.; Garcia-Bernardo, J.; El-Khairi, R.; Chhatriwala, M.; Shepherd, M.H.; Hattersley, A.T.; Dunn, N.R.; et al. GATA6 Cooperates with EOMES/SMAD2/3 to Deploy the Gene Regulatory Network Governing Human Definitive Endoderm and Pancreas Formation. Stem. Cell Rep. 2019, 12, 57–70. [Google Scholar] [CrossRef] [Green Version]
  29. Zhou, P.; He, A.; Pu, W.T. Regulation of GATA4 transcriptional activity in cardiovascular development and disease. Curr. Top Dev. Biol. 2012, 100, 143–169. [Google Scholar] [CrossRef]
  30. Morrisey, E.E.; Tang, Z.; Sigrist, K.; Lu, M.M.; Jiang, F.; Ip, H.S.; Parmacek, M.S. GATA6 regulates HNF4 and is required for differentiation of visceral endoderm in the mouse embryo. Genes Dev. 1998, 12, 3579–3590. [Google Scholar] [CrossRef] [Green Version]
  31. Xuan, S.; Sussel, L. GATA4 and GATA6 regulate pancreatic endoderm identity through inhibition of hedgehog signaling. Development 2016, 143, 780–786. [Google Scholar] [CrossRef] [PubMed] [Green Version]
  32. Livak, K.J.; Schmittgen, T.D. Analysis of relative gene expression data using real-time quantitative PCR and the 2(-Delta Delta C (T)) Method. Methods 2001, 25, 402–408. [Google Scholar] [CrossRef] [PubMed]
  33. Lucci, V.; Di Palma, T.; Zannini, M. Neuropilin-2 Is a Newly Identified Target of PAX8 in Thyroid Cells. PLoS ONE 2015, 10, e0128315. [Google Scholar] [CrossRef] [PubMed] [Green Version]
Figure 1. Evidence for a new exon of Nephrocan in mouse. (a) The sequence of Nepn gene in GenBank runs from 52,388,864 bp to 52,404,613 bp on chromosome 10 (top). Schematic of transcripts reported on Ensemble database and primer designing for RT-PCR (bottom). (b) Mouse kidney tissue was used to study the expression of the novel transcript by RT-PCR. NC, negative control with no DNA template. (c) Schematic representation of the genomic organization of mouse Nepn leading to alternative splicing. Rectangular boxes refer to exons (size of boxes are indicative of the relative size of exons) and interconnecting lines as introns. The dashed puckered lines show the splicing pattern of the exons. The novel transcript, named Nepn isoform a, is formed by splicing of Exon1a with Exon2 skipping Exon1b. The translation initiation site “AUG” is indicated with a downward arrow in the new transcript. (d) Alignment of Nepn isoform b (upper sequence) and isoform a (lower sequence) obtained using the Sequence Manipulation Suite programs. Full blot is showed in Supplementary Information.
Ijms 21 00008 g001
Figure 2. Expression pattern of Nepn isoforms. Nepn isoforms a and b were amplified by RT-PCR on total RNA from adult mouse organs and embryos homogenate. Two different PCR reactions were performed on the same template cDNA using specific oligos. (a) Nepn isoforms a and b expression in mouse embryo development; (b) Nepn isoforms a and b expression in adult mouse tissues. Gapdh amplification was performed as a control. Full blot is showed in Supplementary Information.
Ijms 21 00008 g002
Figure 3. Generation of a mouse model for Nepn gene depletion. (a) Graphical representation of Nepn mutated locus in mESCs used to generate Nepn KO first mouse Primer designing for RT-PCR are indicated as arrows in the picture. (b) PCR analysis of genomic DNA isolated from mouse ear. The upper band in the panel displays the Nepn recombinant allele, while the lower band displays Nepn wild-type allele. Thus, the appearance of the upper band alone displays mutated homozygous allele; the lower band alone represents wild-type Nepn allele; while both bands together mean that the mouse is Nepn heterozygous. (c) RT-qPCR was performed to quantify the minimal expression of Nepn in Nepn−/− mouse and relative controls. The data reported are normalized on Gapdh expression. Three replicates for each experimental point were performed. Error bars represent the standard deviation of normalized values (* p < 0.05, ** p < 0.001). (d) Nepn isoforms a and b expression in Nepn−/− mouse kidney and relative controls. Full blot is showed in Supplementary Information.
Ijms 21 00008 g003
Figure 4. Nepn null mice have normal glucose regulatory function and body weight. (a) Intraperitoneal Glucose Tolerance Test (IPGTT). Evaluation of blood glucose of Nepn−/− mice compared to Nepn+/+ in a group of 4–6 months old mice. Blood glucose was measured at the indicated time points after intraperitoneal glucose injections (Nepn+/+: seven mice; Nepn−/−: seven mice). The plasma glucose concentration peaked at 15 min after the glucose challenge and then gradually returned to normal level throughout the experiment—no significant differences between wild-type and Nepn null mice can be observed (p = 0.9, n = 7 for each group). Data are expressed as the mean ± SD. (b) The bodyweight of 4 and 6 months old mice were from wild-type and Nepn null groups. Results are means ± SD. T-test revealed no discernible differences between the genotypes (p = 0.26, n = 6 for each group).
Ijms 21 00008 g004
Figure 5. Generation of Nepn knockout mESCs. (a) Schematic diagram of the location and sequence of gRNA designed to target Exon1b of Nepn gene. (b) Chromatogram of the representative wild-type and CRISPR/Cas9 Nepn mutant clone. The interpretation shows mutated allele aligned against the wild type sequence. The bold letters represents the PAM sequence, while the dotted lines indicate deletions. Red and blue half arrows indicate the primer pairs used for the validation of CRISPR/Cas9 deletion. (c) Identification of a deletion in Nepn Isoform b gene sequence. Two PCR were performed once using primers flanking the gRNA target region, which leads to a smaller amplicon in the mutated allele. The second PCR is performed using a forward primer that anneals on the deleted region, resulting in no amplification on the mutated allele. (d) (Left) Representative brightfield images of undifferentiated (M0) wild type mESCs, and Nepn Isoform b knockout mESCs colonies. The colonies look alike and cells do not present any differences in generating colonies. Scale bars: 100 μm. (Right) RT-qPCR results show the expression level of stem cell markers (Oct4, Nanog)—no significant differences between wild type mESCs and Nepn Isoform b knockout mESCs can be observed. Full blot is showed in Supplementary Information.
Ijms 21 00008 g005
Figure 6. Evaluation on Nepn decifiency during endoderm differentiation (a) Schematic protocol of directed differentiation from mESCs into posterior foregut endoderm (PFE). ESCs were plated at 50,000 cells/cm2 at day0 (M0) in a pro differentiative medium supplemented with Matrigel (200 μg/mL) and Activin A (20 ng/mL) to induce the DE formation (M1). The cells were then treated with Retinoic Acid (5 μM) and FGF10 (10 ng/mL) until the end of protocol to promote the PFE formation (M2). (b) Nepn isoforms expression through the in vitro differentiation was evaluated by RT-PCR. Kidney cDNA was used as a positive control (Ctrl). (c) (Top) RT-qPCR analysis of the DE marker (FoxA2) and PFE markers (Gata4, Gata6 and Sox9). The mRNA levels were normalized to Gapdh expression and reported as fold change with respect to the value in M1. Values shown are mean ± SD, based on triplicate assays. Statistical analyses were performed using Student’s t-test, where p < 0.05 was considered significant. (* p < 0.05, ** p < 0.01). (Bottom) Cells morphology during in vitro endoderm differentiation. Representative brightfield images of wild type and Nepn Isoform b knockout differentiated cells at M1 and M2. Images were taken with a Leica DMi8 at 10× magnification. Scale bar: 100 µm. Full blot is showed in Supplementary Information.
Ijms 21 00008 g006
Table 1. Genotypes of the progeny from Nepn heterozygous mutant mice (Nepn+/−).
n = 86Nepn+/+Nepn+/−Nepn−/−p-value
Observed frequency29.1%53.5%17.4%0.2
Expected frequency25%50%25%
Table 2. Experimental study of renal functionality. Evaluation of urinary parameters in 24 h urine output of Nepn−/− mice compared to Nepn+/+ in a group of 4–6 months old mice.
Urinary ParametersNepn+/+Nepn−/−
Urinary Volume (mL)1.86 ± 0.371.63 ± 0.25
Creatinine excretion (µmol/g body weight)0.24 ± 0.030.23 ± 0.01
Na+/creatinine22.75 ± 4.1627.92 ± 4.41
K+/creatinine20.36 ± 3.9518.14 ± 2.23
Cl/creatinine62.91 ± 6.4372.34 ± 3.43
Creatinine clearence113.16 ± 14.9197.56 ± 11.33

