Article

Establishment and Characterisation by Expression Microarray of Patient-Derived Xenograft Panel of Human Pancreatic Adenocarcinoma Patients

1
National Institute for Cellular Biotechnology, Dublin City University, Dublin 9, Ireland
2
St. Vincent’s University Hospital, Dublin 4, Ireland
3
Trinity College Dublin, College Green, Dublin 2, Ireland
4
Department of Molecular Medicine, Beaumont Hospital, Royal College of Surgeons in Ireland, Dublin 9, Ireland
5
Department of Pharmaceutical Sciences, University at Buffalo, State University of New York, Buffalo, NY 14214, USA
6
St Luke’s Radiation Oncology Network, Dublin 6, Ireland
*
Author to whom correspondence should be addressed.
These authors contributed equally.
Int. J. Mol. Sci. 2020, 21(3), 962; https://doi.org/10.3390/ijms21030962
Submission received: 13 December 2019 / Revised: 28 January 2020 / Accepted: 29 January 2020 / Published: 31 January 2020

Abstract

:
Pancreatic cancer remains among the most lethal cancers worldwide, with poor early detection rates and poor survival rates. Patient-derived xenograft (PDX) models have increasingly been used in preclinical and clinical research of solid cancers to fulfil unmet need. Fresh tumour samples from human pancreatic adenocarcinoma patients were implanted in severe combined immunodeficiency (SCID) mice. Samples from 78% of treatment-naïve pancreatic ductal adenocarcinoma patients grew as PDX tumours and were confirmed by histopathology. Frozen samples from F1 PDX tumours could be later successfully passaged in SCID mice to F2 PDX tumours. The human origin of the PDX was confirmed using human-specific antibodies; however, the stromal component was replaced by murine cells. Cell lines were successfully developed from three PDX tumours. RNA was extracted from eight PDX tumours and where possible, corresponding primary tumour (T) and adjacent normal tissues (N). mRNA profiles of tumour vs. F1 PDX and normal vs. tumour were compared by Affymetrix microarray analysis. Differential gene expression showed over 5000 genes changed across the N vs. T and T vs. PDX samples. Gene ontology analysis of a subset of genes demonstrated genes upregulated in normal vs. tumour vs. PDX were linked with cell cycle, cycles cell process and mitotic cell cycle. Amongst the mRNA candidates elevated in the PDX and tumour vs. normal were SERPINB5, FERMT1, AGR2, SLC6A14 and TOP2A. These genes have been associated with growth, proliferation, invasion and metastasis in pancreatic cancer previously. Cumulatively, this demonstrates the applicability of PDX models and transcriptomic array to identify genes associated with growth and proliferation of pancreatic cancer.

1. Introduction

Pancreatic cancer remains a cancer of unmet need, with a 5 year survival rate of approximately 7−9% [1]. The survival rate has shown little to no improvement over a 30 year period. Pancreatic ductal adenocarcinoma (PDAC) has no viable screening method, and an absence of early clinical symptoms, leaving it detected usually later in the disease stage. The only curative option is surgery, and this is only viable in early stage (R0/R1) cases where the cancer has not metastasised. Even with radical surgical resection, the 5 year survival rates are not comparable with other solid cancers.
One of the most common research tools for oncology research is the cell-line model. Cell lines and cell-line panels have formed the basis of much preclinical research previously. The limitations of conventional cell lines for pancreatic cancer research has been previously discussed, showing to be a poor predictor of clinical trial outcome [2]. In pancreatic cancer, in vitro models are often poor in predicting clinical therapeutic response [3].
Patient-derived xenograft (PDX) models have emerged as a tool for investigation of pancreatic cancer and become more utilised as they have been shown to more closely represent patient tumours [4]. Due to its more aggressive nature, pancreatic cancer PDX models are established with a high take rate when compared to other cancers, such as breast cancer [5,6]. While ovarian cancer PDX models are established with similar engraftment rates as pancreatic cancer [7].
Pancreatic cancer cell lines, while not mimicking the tumour–stromal interaction or pancreatic cancer’s dense desmoplasia offer a model to examine direct drug effects on the tumour cells. PDX models also offer the opportunity for the development of novel cell-line models. The establishment of pancreatic cancer cell lines using finely minced tissue fragments and specialised media components has been previously reported [8,9]. These additional cell-line models provide valuable resources to map the genomic alterations involved in human pancreatic cancer.
This study shows the comprehensive development of patient-derived xenograft models, including detailing the tumours that failed to proliferate as PDX models. From these novel models, primary cell lines were developed and characterised as human tumour cell lines. Using microarray screening this study sought to compare the mRNA profile of adjacent normal tissue, patient tumour tissues and PDX F1 tissue. This revealed the innate heterogeneity of the adjacent normal tissue and patient pancreatic tumour but showed patient-derived xenograft models more closely clustered together. More than 1400 genes were differential expressed between the tumour and adjacent normal tissue, with more than 3800 genes differentially expressed in the tumour–PDX comparison. In this study, we focused on genes that were differentially expressed in both comparisons and associated with disease initiation and disease progression characteristics.

2. Results

2.1. Patient Characteristics

In total, 48 patient samples were collected from patients who ranged in age from 40 years to 80 years, with a total 29 males and 19 females. The baseline characteristics of the patients are given in Table 1. Of the 35 pancreatic ductal adenocarcinoma (PDAC) samples obtained, 14 (40%) were female and 21 (60%) were male. The average age for surgery for PDAC patients was 65 years for female patients and 67 years for male patients. Of the surgical specimens obtained, six samples from PDAC patients had received neo-adjuvant treatment. Node status was available for 24 of the 33 PDAC patients, with 17 of those patients having a pT3 node status. pT3 node status indicates extension beyond the pancreas into the peripancreatic soft tissue or the surrounding structures [10].
Due the centralised nature of pancreatic cancer surgical resection procedures in Ireland, follow-up data was not available for all patients in the study, many of whom were treated in facilities other than the surgical hospital for their post-surgical care. Available follow up information regarding treatment and survival is given in Table 2. Patients predominately received gemcitabine, gemcitabine + Abraxane or FOLFIRINOX as an adjuvant treatment, with some individuals receiving Carboplatin/Etoposide combination or Capecitabine. Patient survival ranged from less than 4 months to over 3 years.
Only 11 of 48 patient samples had recorded information regarding the patient presentation. Of those 11, nine patients presented with jaundice, obstructive jaundice or painless obstructive jaundice, 1 presented with abdominal pain and another patient was an incidental identification on a PET scan.

2.2. Pancreatic PDX Biobank

Tumour material obtained was confirmed macroscopically by consultant histopathologist. The quantity of tumour available for research (biobanking and implantation) was variable and determined by the pathologist. The number of mice per patient implanted varied from 3 to 5 depending on the tumour type and quantity. In total, 48 patient samples were acquired over a 5 year period. Of these, 35 samples were PDAC, with three cholangiocarcinoma, three IPMN and six NET samples acquired; a full breakdown of samples acquired and engraftment status is given in Table 3. All samples were confirmed as by the consultant histopathologist to have maintained architecture and morphology as the original patient tumour, representation images Supplementary Materials Figure S1. Of the 35 PDAC samples acquired, seven had received neo-adjuvant treatment prior to surgery, PIN 139, PIN 145, PIN 165, PIN 191, PIN 194, PIN 199 and PIN 210. Neo-adjuvant treatments included FOLFIRINOX with radiation, gemcitabine/oxaliplatin with radiation and gemcitabine/Abraxane with radiation. Of these six samples, only one sample grew as a PDX tumour. Samples were received without the complete pathological diagnostics and samples were implanted as and when they arrived. PIN 194 was a neo-adjuvant treated with gemcitabine/Abraxane and long-course radiation. On histopathological confirmation, the sample showed no trace of residual tumour cells. This suggests lower engraftment rates (14%) in pre-treated samples are possibly due to the reduced number of viable tumour cells in the sample due to the treatment effect, however a larger sample size would be required to confirm this.
The average number of days following implantation of patient tumour to palpate tumour is 78 days, ranging from 20 days to 306 days. The tumour growth rates in the first generation in mouse (F1 generation) varied both within tumours and between tumours with timelines for harvesting tumours ranging from 72 days post implant to 512 days post implant. Tumour growth rates in Figure 1 show that while tumour initiation takes time, tumour growth rate increases once established. Given that similar sized tumour pieces are implanted in each animal the intra-tumour and inter-tumour variation in growth and take rate maybe representative of innate tumour heterogeneity. In treatment-naïve PDAC samples 78% grew in vivo, in neo-adjuvant treated samples only 14% (1/7) samples produced a tumour. For neuroendocrine tumours, 20% (1/5) of samples grew in vivo.
In total, 10 F1 generation PDX fresh frozen tumour samples were investigated for mutational status by Sequenom MassArray MALDI-TOF system, Supplementary Data Table S1 and Figure S2. Of the 10 samples analysed, mutations were detected in all samples except one (PIN 116). KRAS mutation were detected in 8/10 samples and PIK3R1 mutations were detected in 5/10 samples. Other detected mutations included IDH1 (1/10); MET (1/10); PHLPP2 (3/10) and PIK3CA (1/10).
Given the small sample numbers, PDX growth and take rate cannot be attributed to a single factor but key operational factors including the immediate cooling of the sample following surgery, rapid implantation and sample selection and identification by histopathologist

2.3. Derivation of Cancer-Associated Fibroblasts and Tumour Cell Lines

From 11 F1 PDX tumour pieces, three tumour cell lines were isolated: PIN 080, PIN 099 and PIN 127. Two further tumour cell lines failed to proliferate after initial sub-culturing: PIN 089 and PIN 091. The three tumour cell lines established were confirmed as human by IHC, as detailed in Figure 2. Immunohistochemical analysis using the human-specific antibody Anti-Mitochondria antibody 113–1 (dilution 1/1000) confirmed that the tumour cells isolated were human in origin.
From seven patient tumours, two patient-derived stromal cell lines were isolated. The two stromal cell lines, Fibro-102 and Fibro 120, have been successfully cultured, cryo-preserved and restored. These cell lines grow with a fibroblast morphology. Preliminary data (unpublished) indicated phenotypic changes in pancreatic cancer cells (Mia-PaCa-2, Panc-1) in response to co-culture with patient-derived stromal cells in comparison to cancer cell alone.

2.4. Immunohistochemical Characterisation of PDX tumours

PDX tumours are known to recapitulate the patient morphology. Additionally, as the tumours grow, within the first passage in the stroma is replaced with mouse tissue [2,11,12]. Shown in Figure 3 are representative examples of 10 PDX tumour samples stained for human specificity using Anti-Mitochondria antibody 113-1 (1/1000 dilution). The images show the tumour cells staining positive for human with the stromal material not staining. This demonstrates the maintenance of the human tumour phenotype through the passaging, with murine cells overtaking the stroma.

2.5. Microarray Gene Expression Analysis

Microarray gene expression profiling was performed on GeneChip Human Gene 2.0 ST array on five triple-matched samples and three double-matched samples, detailed in Table 4. mRNA profile showed that after passaging in the mouse, the PDX tumours cluster closely together. The primary patient tumours predominantly cluster together by PCA analysis, with two samples PIN 080 and PIN 089 distant from the cluster, Figure 4. The adjacent normal tissue displayed the least amount of clustering. This is representative of the heterogeneity of the patients with the minor selection pressure of the PDX formation and the murine stromal replacement through engraftment resulting in a less heterogeneous sample population in the PDX tumours.
In total, more than 5000 genes were differentially expressed in the comparisons on adjacent normal vs. tumour and tumour vs. PDX, taking a 1.5-fold cut off. The breakdown of the numbers of genes changed is given in Table 5, while the top 20 genes differential expressed with a LOG fold change of 2 or greater in the adjacent normal vs. tumour and tumour vs. PDX F1 is shown in Table 6; Table 7, respectively.
In order to determine which biological process the differentially expressed genes were involved in, gene ontology analysis was completed on a short list of 89 genes [13,14]. Gene ontology (GO) analysis showed that the shortlist of 89 genes upregulated by two-fold or more in both the N vs. T comparison and T vs. F1 comparison were predominantly related to biological processes such as cell cycle and mitosis (Table 8). This suggests that this shortlist of genes (Supplementary Table S2) are selected for growth and demonstrate the genes associated with tumour initiation and tumour progression. Further validation was performed using AMIGO database against Homo Sapiens database of all genes. [15]. The shortlisted 89 genes of interest were classified by biological process using a Fisher Test and applying a Bonferroni correction (Table 9). The complete dataset in this publication have been deposited in NCBI’s Gene Expression Omnibus, GEO Series accession number GSE141873 [13,14,16].
Figure 5A–E show five genes of interest that were upregulated in N vs. T vs. F1 giving the individual expression in each sample. In our global analysis of six adjacent normal compared to seven tumour samples, SERPINB5, also known as P15 and Maspin [17], was shown to be increased in the tumour samples compared to the adjacent normal samples (6.8-fold increase), with a further increase in the F1 generation PDX tumours (eight samples) compared to the patient tumour samples (6.6-fold increase). Both of these global comparisons were statistically significant (p = 8.84 × 10⁻⁵ and 8.96 × 10⁻⁶ respectively). Figure 5A shows the individual levels of SERPINB5 in the adjacent normal, tumour and F1 PDX tumour samples. In the comparison of FERMT1 (Figure 5B) compared to patient tumour a 6.4-fold increase (p = 3.00 × 10⁻⁴) was detected with a further 2.5-fold increase (p = 5.40 × 10⁻³) in the F1 PDX tumour material when compared to the F1 cohort. AGR-2 (Figure 5C) was increased 4.98-fold (p = 1.50× 10⁻³) in the patient tumour compared to the adjacent normal tissue and a further 5.09-fold (p = 3.00 × 10⁻⁴) increased in PDX F1 tissue compared to tumour material Solute Carrier SLC6A14 (Figure 5D) showed a 22.8-fold increase (p = 4.00 × 10⁻⁴) in a comparison between tumour tissue and adjacent normal material and a further 3.2-fold increase (p = 1.07 × 10⁻²) in the F1 PDX cohort compared to the tumour tissue. TOP2A (Figure 5E) showed a 6.4-fold increase (p = 2.00 × 10⁻⁴) in the tumour compared to adjacent normal tissue (p = 2.00 × 10⁻⁴) and a further 3.8-fold increase in the PDX F1 tissue compared to the patient tumour. MUC1 has been shown to be overexpressed in pancreatic cancer [18], and has been associated with multidrug resistance and gemcitabine resistance [19]. In our list of differentially expressed genes MUC1 was 1.7-fold increased in tumour vs. normal but not statistically significantly changed in the tumour compared to F1 comparison (see Supplementary Table S2). MUC13 was significantly increased in both the N vs. T comparison (9.4-fold) and the T vs. F1 comparison (3.0-fold). MUC13 has been shown to be increased in PDAC tissue compared to normal adjacent tissue [20].

3. Materials and Methods

3.1. Sample Acquisition and Ethical Approval

Pancreatic cancer tissue and adjacent normal tissue (N) were obtained from patients undergoing surgical resection at St Vincent’s University Hospital. After initial macroscopic pathological confirmation, material remaining after diagnostic sampling was cold transferred in RPMI 1640 medium containing 1% Penicillin-Streptomycin, 1% fungazone to DCU. Transfer time between hospital and implantation was on average 2 h or less.
Collection of patient material was approved by St Vincent’s University Hospital Research Ethics Committee. All animal work received ethical approval from the DCU Research Ethics Committee (DCUREC/2012/202) and was licensed by Department of Health (B100-4501).

3.2. PDX Tumour Development

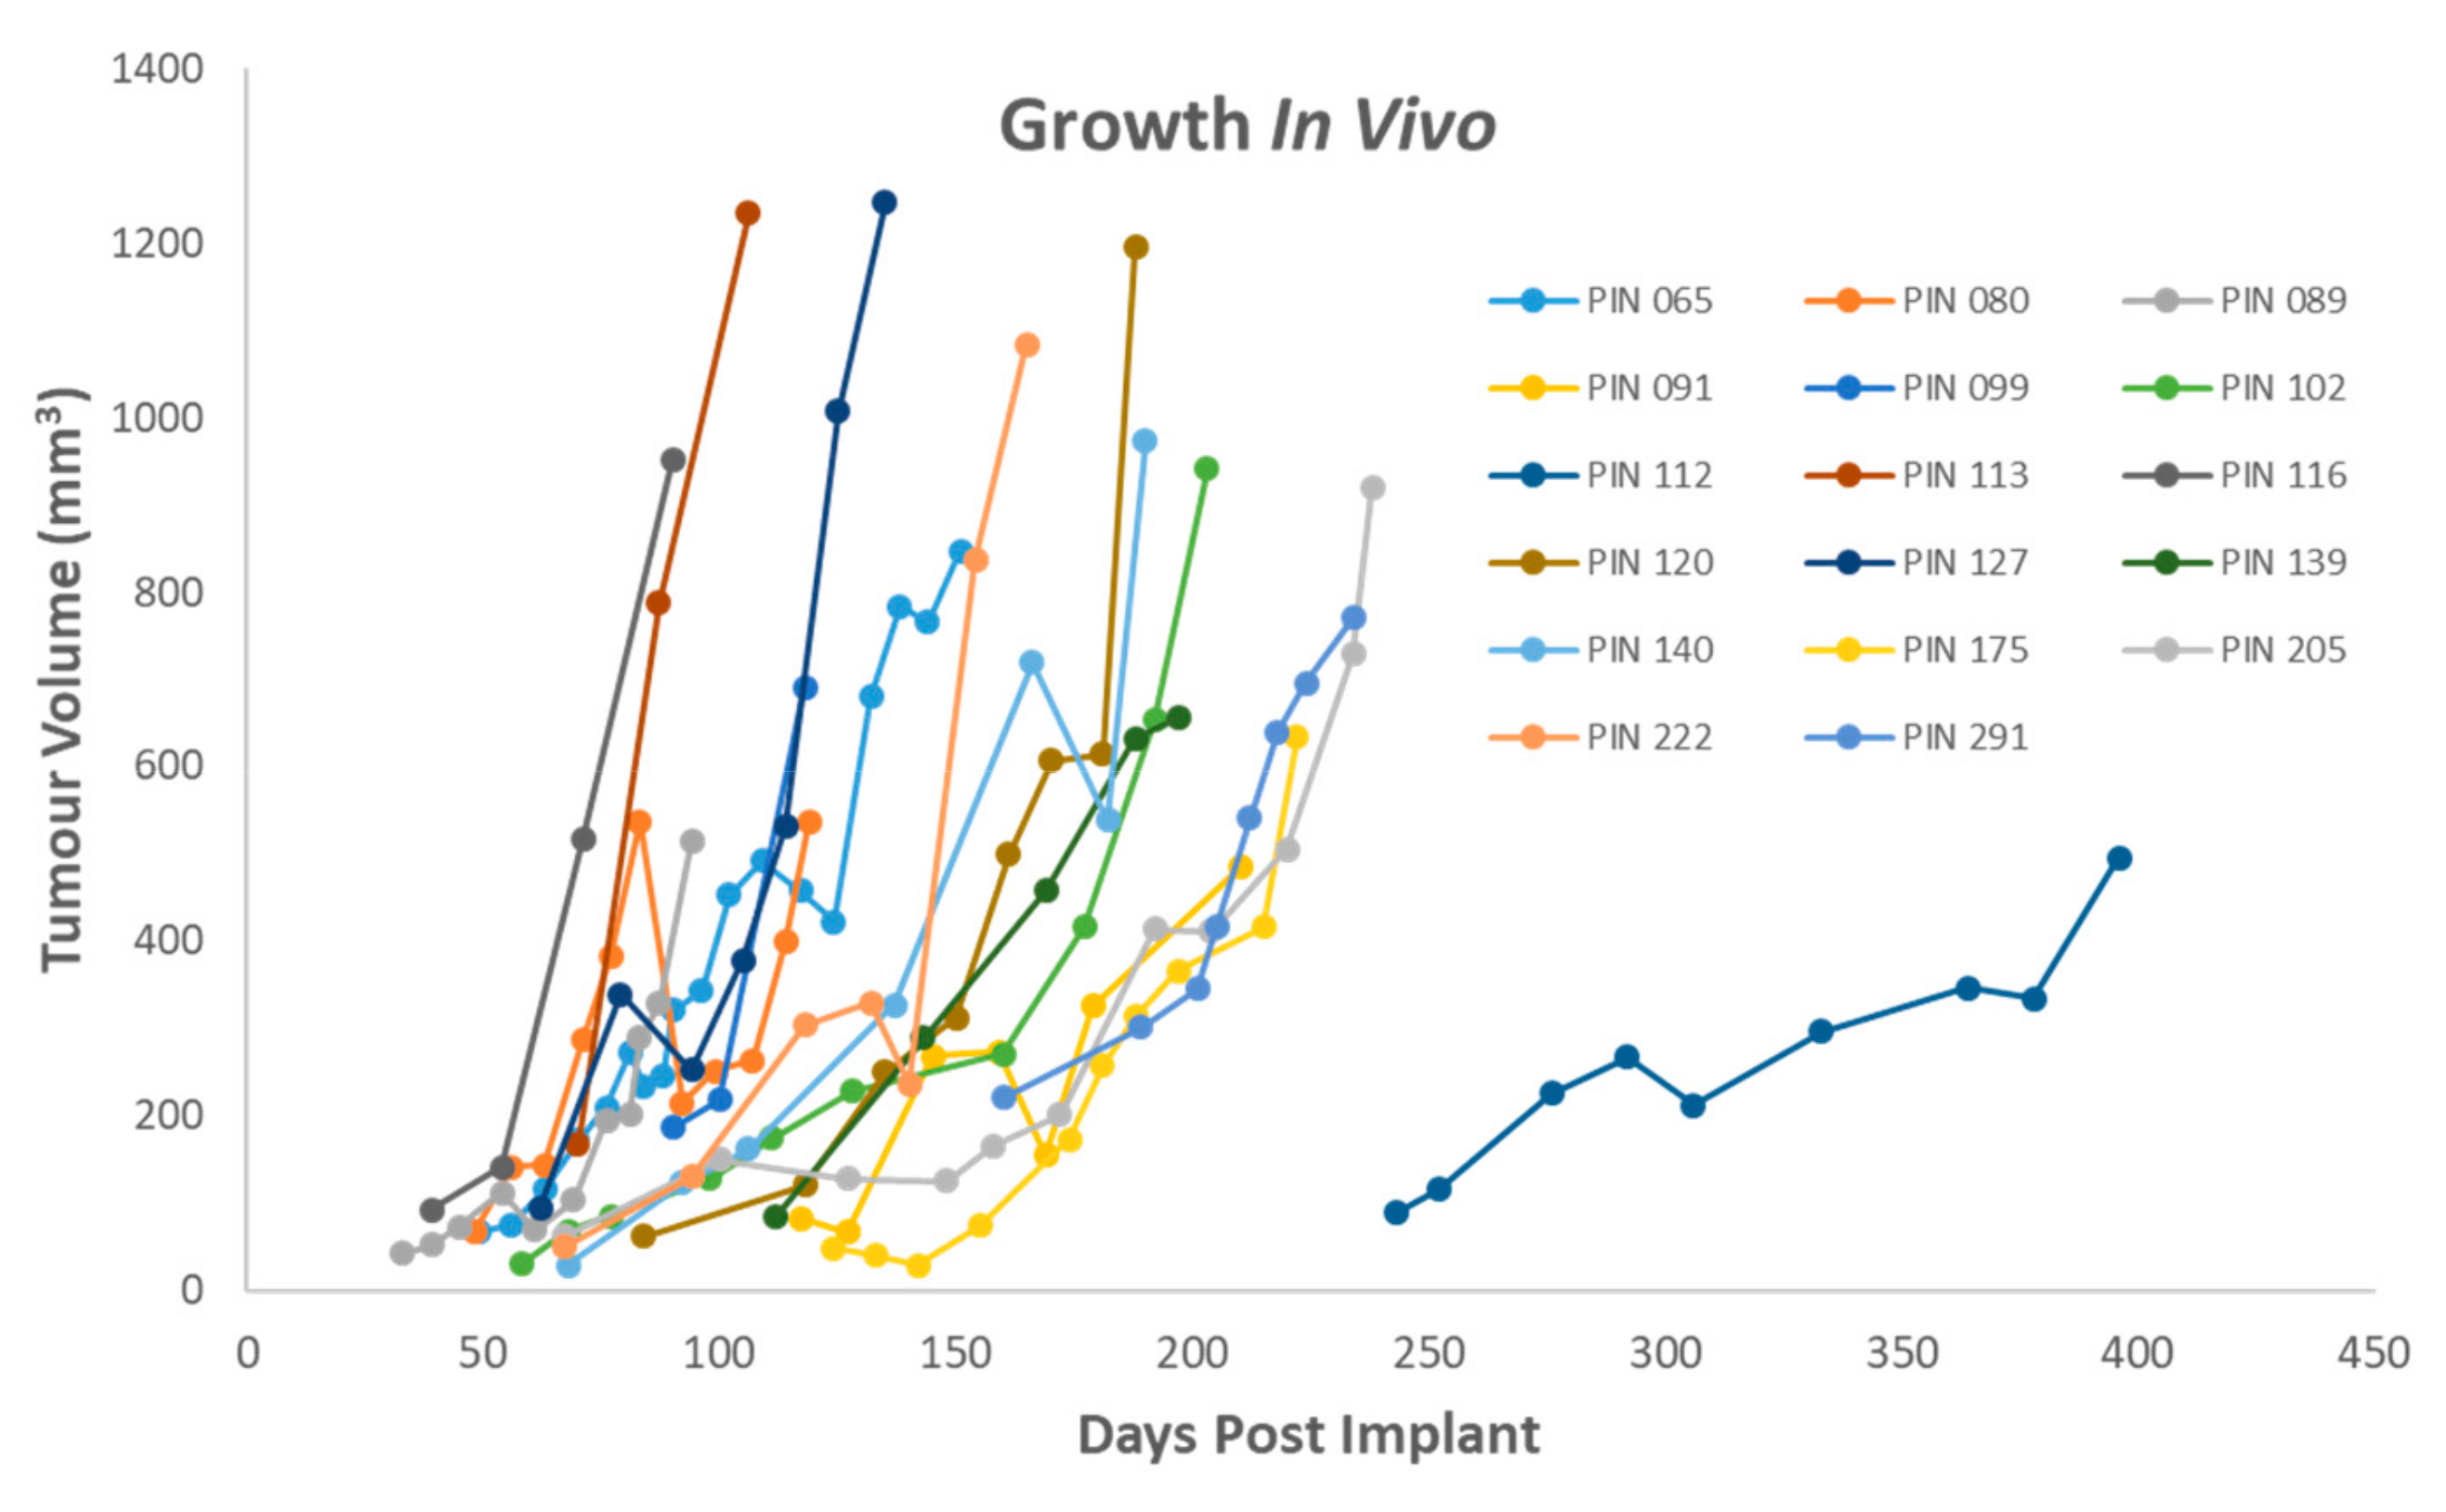
The tumour was cut into implant-sized pieces (<2 mm3) and rinsed with fresh serum-free RPMI media following transport. Severe combined immunodeficiency (SCID), CB17/lcr-Prkdcscid/lcrCrl mice (Charles River, UK) were implanted subcutaneously with fresh patient tumour material. Depending upon the size and type of tumour material, 3–5 mice were implanted per patient sample. Under anaesthesia (isoflourane, O2 carrier gas) a small incision was made in the skin of the left flank of the animal. The tumour piece was placed in the pocket under the skin and the wound sealed with a single staple. The animals were monitored post-surgery, and staple removal was within 10 days. Animals were monitored weekly for body weight and tumour development. Mice were monitored for tumours development for up to 1 year post implantation. Animal welfare monitoring criteria included tumour volume, tumour axis, body weight and condition. There tumour volume and tumour axis limits were set as <2000 mm3, and <20 mm respectively. A decrease in body weight of >10% resulted in increased monitoring with body weight decrease of 20% resulting in humane euthanasia.

3.3. Preservation of PDX tumours

Following humane euthanasia of the mouse, the tumour was divided for cryopreservation, formalin-fixed paraffin embedding (FFPE) and snap frozen. For cryopreservation, implant-sized tumour pieces were stored in freezing media (RMPI/FCS/DMSO—50/40/10% v/v) in a cryovial and placed in a Mr FrostyTM freezing container (ThermoFischer, Dublin Ireland) for 24 h and then transferred to the liquid nitrogen (LN2) for long-term storage. For snap freezing, a piece of tumour was minced with a scalpel, placed in a cryovial and placed directly into LN2, then stored at −80 °C. For FFPE, a central slice was preserved in 10% neutral buffered formalin overnight and processed subsequently in 70%, 90%, 100% ethanol followed 100% xylene (1 h each). Following processing the tumours were embedded in paraffin. FFPE samples of PDX tumours were reviewed by consultant histopathologist to validate maintenance of tumour phenotype in comparison with original patient tumour.

3.4. Cell Isolation from Tumour Material

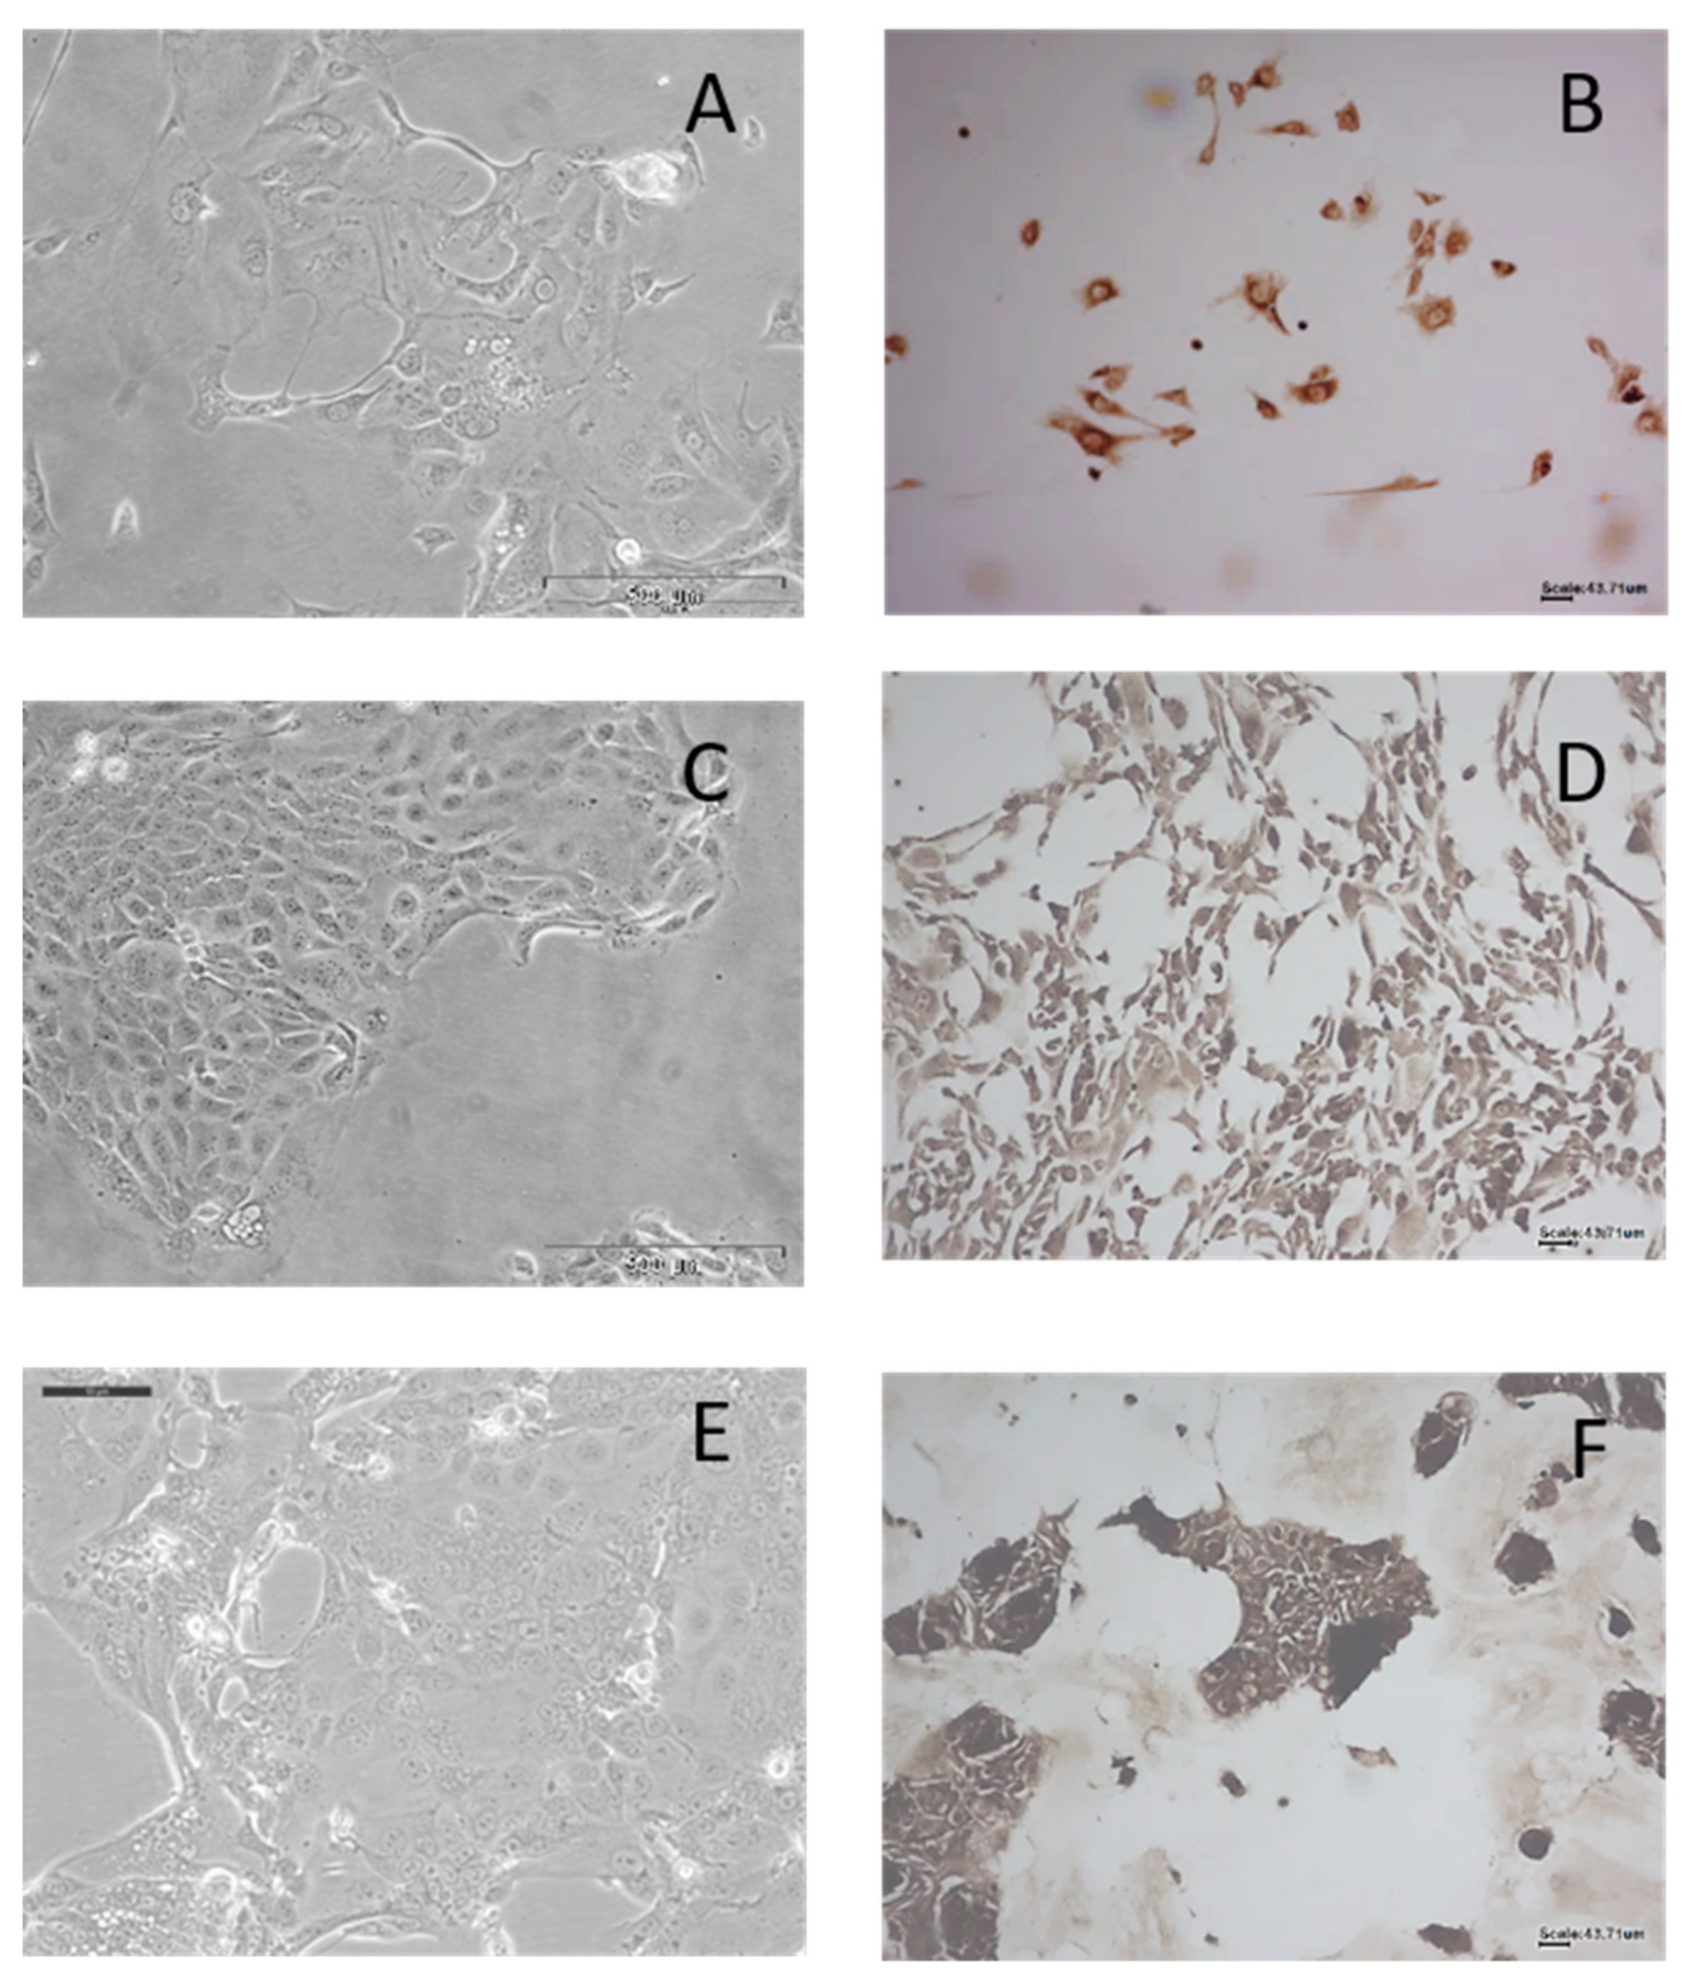
A small piece of tumour (<2 mm3) was minced and placed in Collagenase/Hyaluronidase (StemCell Technologies Cambridge, UK) at 4 °C for 1 h and then transferred to 37 °C for 30 min. Following digestion, the sample was centrifuged 200 g for 5 min and the supernatant removed. The digested material was suspended with complete media (DMEM/F-12 Hams supplemented with 10% FCS 1% PenStrep). Samples were monitored for growth and fed as required. Tumour cells were isolated from first generation PDX tumours while fibroblasts were isolated directly from patient tumours. Tumour cell lines were confirmed as human by IHC.

3.5. Immunohistochemical Analysis of PDX tumours to determine Human-Mouse Tissue

3.5.1. Immunohistochemistry

All immune-histochemical (IHC) staining was performed using the DAKO Autostainer. Deparaffinisation and antigen retrieval were performed using Epitope Retrieval 3-in-1 solution (pH 6) (DAKO, Cruinn, Dublin Ireland) was used. For epitope retrieval slides were heated to 97 °C for 20 min and then cooled to 65 °C.

3.5.2. Real Envision Detection System Peroxidase/DAB+

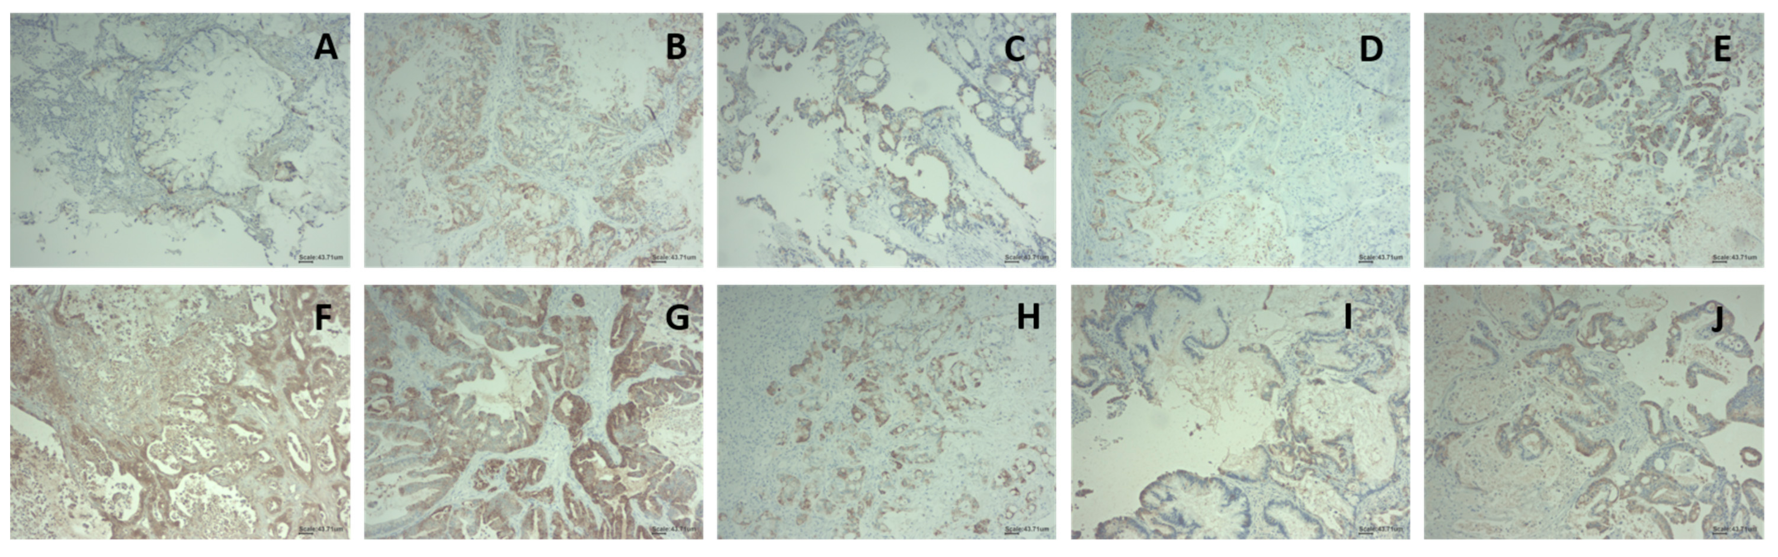
Following either deparaffinisation or epitope retrieval as outlined above slides were immersed in 1× wash buffer. On the autostainer (DAKO), slides were blocked for 10 min with 200 µL HRP Block (DAKO). Slides were washed with 1× wash buffer and 200 µL of the primary antibody were added to the slides for 30 min. The primary antibody used was Abcam Anti-Mitochondria antibody 113–1 (ab92824), a human-specific antibody [21]. The antibody was used at a dilution of 1 in 1000. Slides were once again washed with 1× wash buffer and then incubated with 200 µL Real EnVision (DAKO) for 30 min. Slides were washed again with wash buffer and then stained with 200 µL DAB+ substrate for 5 min and this procedure was repeated twice. All slides were then counterstained with haematoxylin (DAKO) for 5 min and were rinsed with deionised water and then with wash buffer. A negative control sample was also tested for each sample using antibody diluent without any antibody present. This was used to evaluate any non-specific staining. Following the counterstaining with haematoxylin, the slides were then dehydrated. This was achieved by immersing the slide in 70%, 90% and 100% ethanol, twice in each ethanol solutions for 3 min. The slides were then immersed into xylene, twice, for 5 min each. Once the slides were cleared, they were mounted using DPX (BDH).

3.5.3. Immunohistochemical Analysis of Cell Lines

Cells were seeded directly on Superfrost® microscope slides and allowed to attach overnight at 37 °C, 5% CO2. Slides were washed 3 times in PBS and cells were then fixed in cold 4% paraformaldehyde for 15 min and washed with PBS. Immunostaining was carried out using the Dako Autostainer as per Section 3.5.2, without the initial antigen retrieval.

3.6. Mutational Analysis

Mass spectrometry-based single-nucleotide polymorphism genotyping technology (Agena Biosciences, Hamburg, Germany) was used for identification of hotspot, potentially clinically relevant nonsynonymous somatic mutations as previously described [22]. The genes were further subdivided by pathway, and include MAPK, PI3K and related pathway genes (Supplementary Table S3). Assays were designed using strict assay design parameters optimized for sensitive mutation detection. The panel consisted of 31 multiplex assays capable of detecting 378 somatic hotspot mutations in 49 genes. DNA was extracted from fresh frozen tumour material using QIAmp DNA mini kit (Qiagen, Hilden, Germany) and quantified by Qubit dsDNA. 10 ng of DNA was added to each PCR reaction and DNA was amplified using custom designed PCR primer pools. Unincorporated nucleotides were inactivated using shrimp alkaline phosphatase (SAP), and a single base extension reaction was performed using extension primers that hybridise immediately adjacent to the mutations of interest. Salts were removed by adding a cation-exchange resin, before the multiplexed reactions were spotted onto SpectroCHIP II arrays. Matrix chips were analysed on an Agena MassArray Matrix-assisted laser desorption/ionisation Time of Flight (MALDI-TOF) system.

3.7. Sample Preparation for Microarray

Snap-frozen sections of PDX tumours, original patient material and adjacent normal tissue were prepared for RNA extraction by grinding samples under LN2 using a mortar and pestle. Briefly, tissue sample was placed in a metal mortar with a small volume of LN2 and ground quickly. When powdered the powder was transferred to a clean Eppendorf tube. This was done before the LN2 completely evaporated and while the powder was still frozen.
Once homogenised, RNA samples were prepared using Trizol, according to manufacturer’s guidelines. Briefly, powdered tissue was lysed in 1 mL of Trizol reagent. Sample was allowed to homogenise at room temperature for 15 min. Per 1 mL of Trizol reagent used, 200 µL of chloroform was added to the Eppendorf (Hamburg, Germany), sample was mixed and allowed to sit for 5 min. At 4 °C samples were spun at 12,000× g for 15 min. The aqueous phase was then separated using a micropipette and places in a new Eppendorf. 500 µL of isopropanol was added to the aqueous phase, allowed to sit at room temperature for 10 min, after which it was spun at 12,000× g at 4 °C for 10 min. The RNA pellet was then washed using 75% ethanol and spun at 4 °C at 7500× g for 5 min. Ethanol was removed from pellet, which were allowed to air dry, and were then reconstituted in nuclease free water.
Samples were quantified using a Nanodrop (Thermo Scientific, Dublin Ireland) and quality determined using Agilent Bioanalyser. Samples with a RNA Integrity Number (RIN) number greater than 8 were most suitable for microarray analysis.

3.8. Microarray GeneChip Human Gene 2.0 ST array Processing and Hybridization

Preparation of cRNA, hybridization, and scanning of microarrays was performed according to the manufacturer’s protocol (Affymetrix, Thermo-Fischer, Santa Clara, Ca, USA). In brief, 300 ng of total RNA extracted from homogenised patient samples isolated using Trizol was converted into double-stranded cDNA by reverse transcription. Biotin-labelled cRNA was generated by converting the cDNA sample using the Genechip WT plus reagent kit (Affymetrix, Thermo-Fischer, Santa Clara, Ca, USA). Labelled cRNA was hybridized to the Affymetrix GeneChip® Human Gene 2.0 ST Array while rotating at 60 rpm for 16 h at 45 °C. After hybridization, the microarray was washed using the Affymetrix Fluidics Station according to the manufacturer’s protocol. The chips were scanned in an Affymetrix 3000 7G scanner.
Differential gene analysis expression was carried out using Applied Biosystems Transcriptome Analysis Console (TAC) software 4.0.2. Resulting gene lists were filtered for +/- 2-fold changes, a p-value < 0.05 and an overall FDR F-Test: <0.005.

4. Discussion

Patients ages and diagnosis characteristics are broadly representative of the earlier-stage pancreatic cancer patient population at large. In Ireland, the median age of diagnosis is 70–74 years for the entire pancreatic patient population [23]. In this study, the average age of 65 years for women and 67 years for men shows that patients who are eligible for surgery are somewhat younger than the pancreatic patient population as a whole. Only 10–20% of patients diagnosed with pancreatic cancer are eligible for surgery, and the biobank developed here is representative of that patient population [24,25]. The ability of a patient tumour to grow a tumour in vivo was not correlated with any single characteristic, though PDAC samples, which formed the bulk of the samples received, formed tumours at a greater rate than neuroendocrine tumours (78% compared to 20%).
PDAC samples which were treatment naïve formed tumours in vivo 78% of the time. This is somewhat higher that previously reported rates of 61% (sub-cutaneous) and 62% (orthotopic) for primary pancreatic cancer samples, though these models were established in nude mice rather than SCID mice [26,27]. The 78% reported here is also higher than 43% detailed by Pergolini et al., though Pergolini et al. reported cryopreserving tumours first rather than direct implantation which potential reflects the differences seen here [28]. This suggests that for initial passaging, direct implantation gives a better take rate with cryopreservation being suitable for later passages. This is potentially due to the selection pressures the tumour undergoes in vivo and the biological processes involved in engraftment.
From seven tumours collected where the patient had received neo-adjuvant treatment, one formed a sub-cutaneous tumour in vivo. Dorado et al. examined three experimental techniques for the establishment of pancreatic PDX models, subcutaneous, orthotopic and intraperitoneal. Of the bank of 11 samples collected in that study, one had received neo-adjuvant therapy and formed a sub-cutaneous tumour, but did not form a tumour intraperitoneal nor at the orthotopic site [29].
Previously, our group examined 10 primary patient tumour samples and nine matched normal adjacent specimens and 10 matched F1 and F2 generation PDX tumours using high-resolution mass spectrometry. MS identification allowed for the isolation of the human only protein, representing the tumour cells, and these were tracked from patient tumour, to F1 and F2 generation PDX tumours. Between patient primary and F1 tumour 32 proteins were upregulated and 113 downregulated. In comparison, between F1 and F2 generation of PDX tumour, only eight human-specific proteins were differentially expressed when analysed by quantitative label-free differential analysis. This demonstrates the fidelity of tumour phenotype once engrafted [30]. This is in line with previously published data the shows, once established, xenografts tend to be robust with stable gene expression profile between early and late passage PDX tumours [31]. This bank of pancreatic PDX tumours models the subset of pancreatic cancer patients who are eligible for surgical resection. Mutational analyses by Sequenom MassArray MALDI-TOF showed 80% of samples examined possessed a KRAS mutation. This is in line with previously reported clinical KRAS mutation rates [32]. These PDX samples are a truer representation of human pancreatic cancer than pancreatic cancer cell lines or cell-line derived xenograft models, which often fail to recapitulate the stroma and desmoplasia of pancreatic cancer. In recent years, given the unmet need of pancreatic cancer patients, banks of patient-derived xenograft tumours have been established. The bank established in this study displays a higher engraftment rate for PDAC tumours than many others previously reported. Two recent reports showed similar engraftment rates (72% and 71%), although this was observed in more immune compromised NSG and NSG nude mice [33,34].
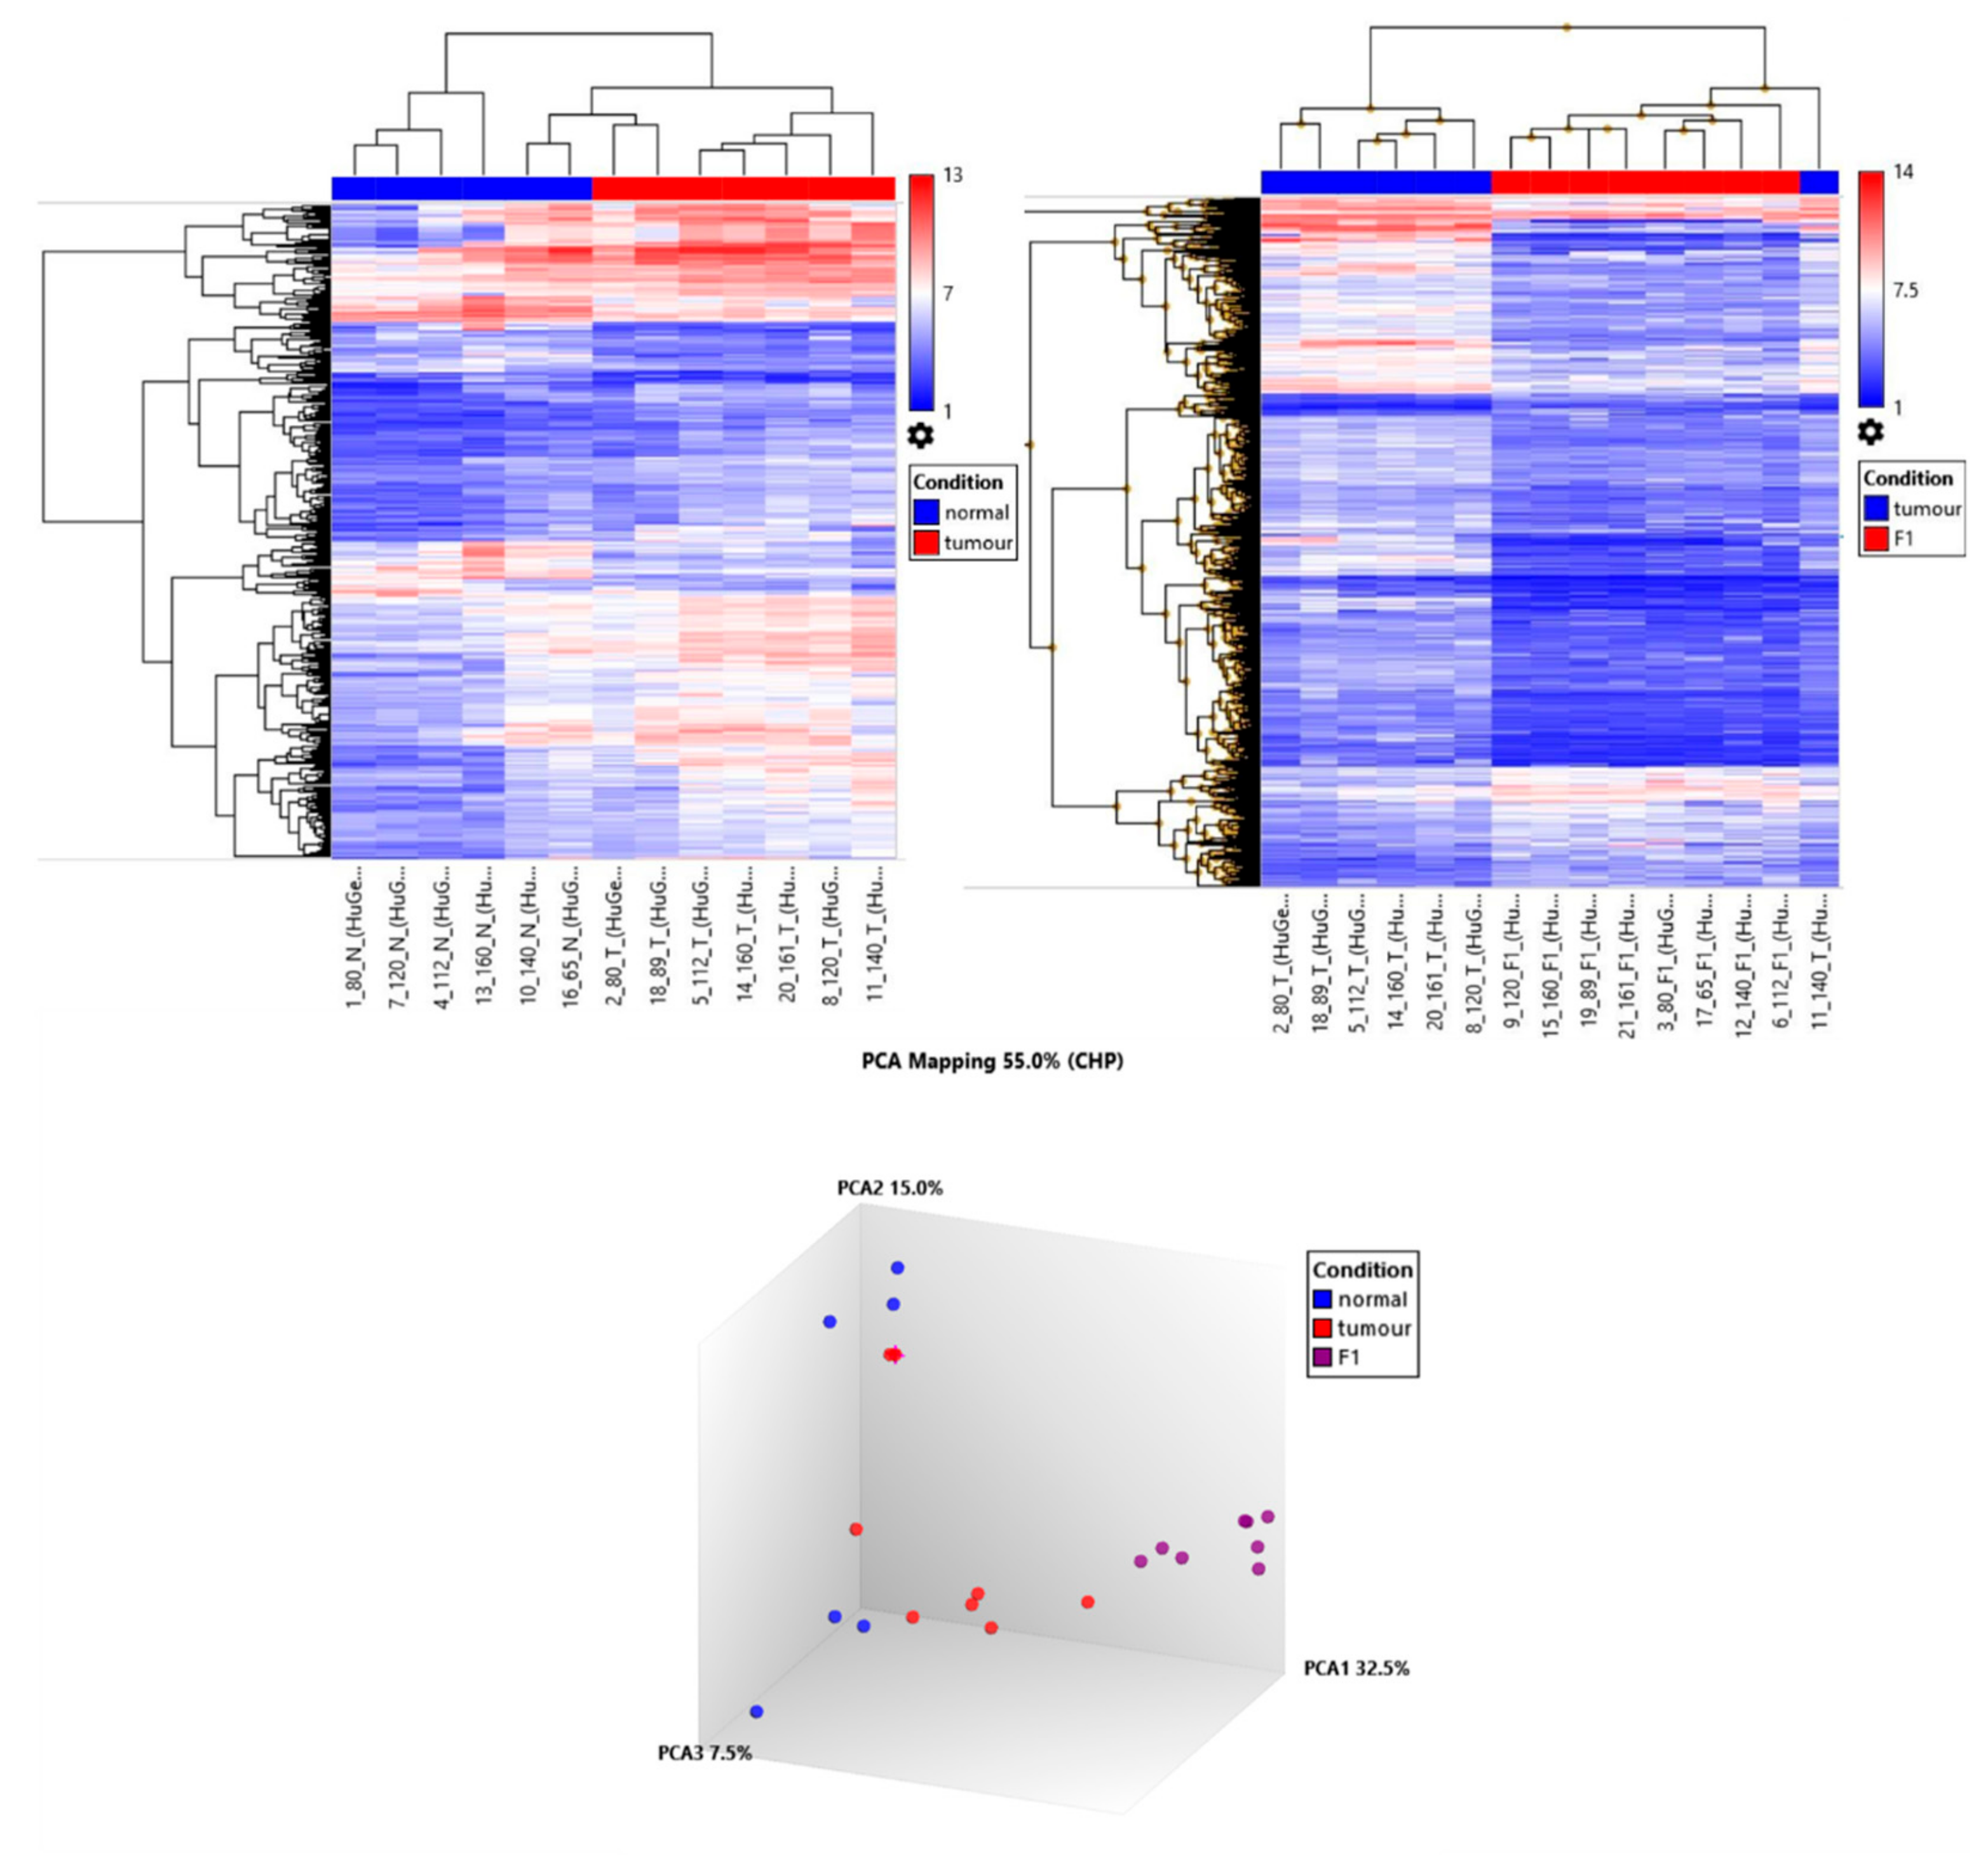
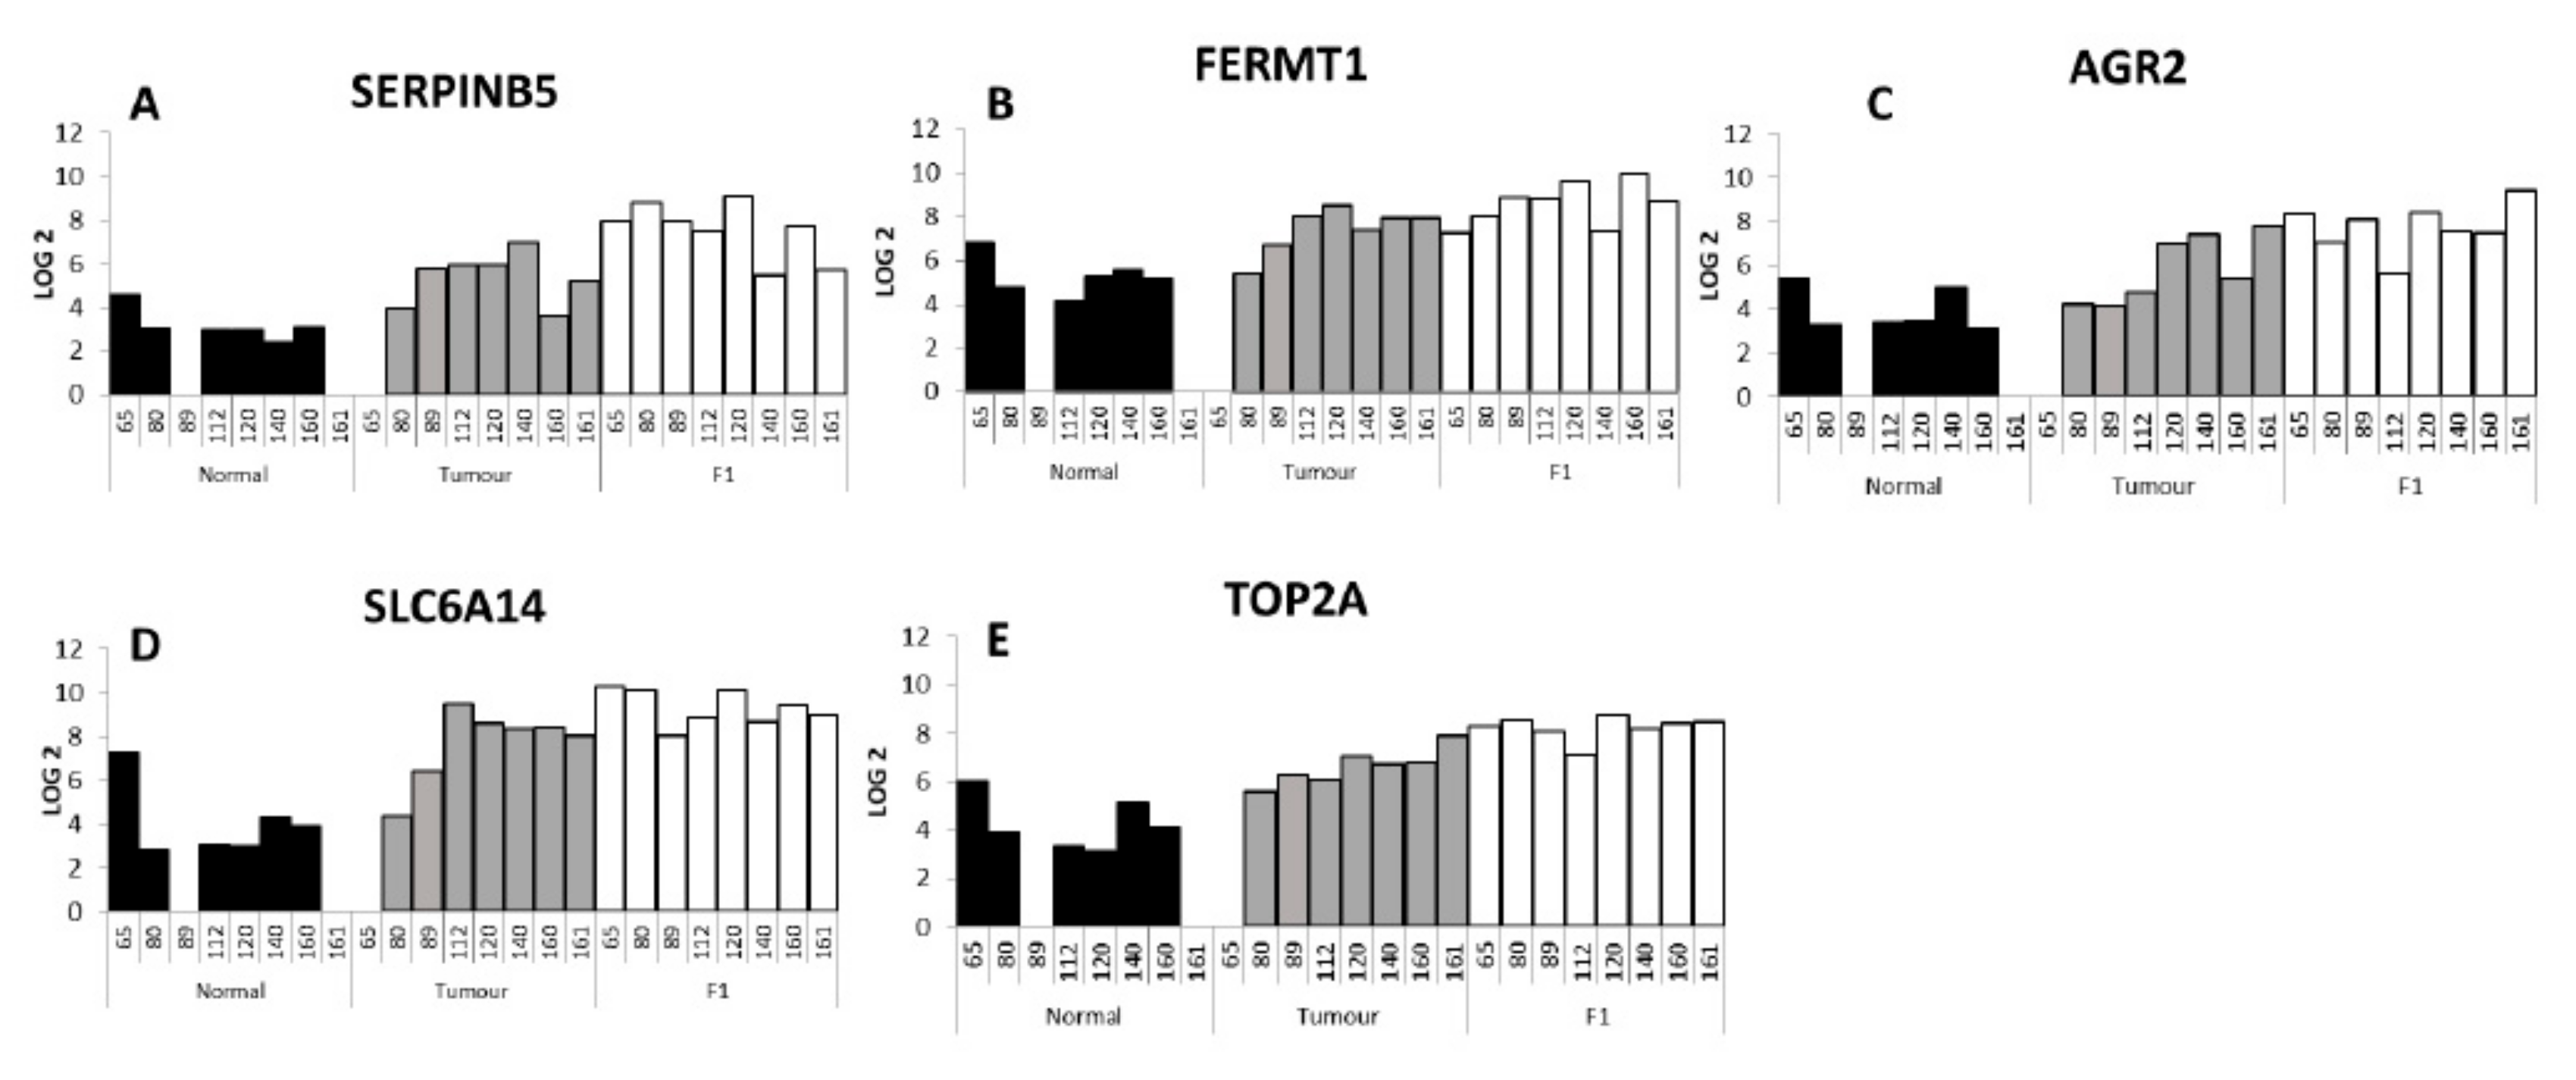
Eight PDX tumour samples were interrogated by Affymetrix Microarray technology in matched comparison to patient tumour and adjacent normal tissue. Primary patient tumour cluster together with PDX tumours clustering together but separate from the primary tumour. RNASeq data in ovarian PDX models demonstrate this differential clustering is predominantly due to the loss of human stroma and the growth of murine stroma [35]. By comparing the adjacent normal to the tumour and the tumour to the F1 PDX tumour we aimed to map the genes associated with tumour growth, proliferation and tumour in engraftment. Gene ontology analysis of the 89 gene increased in tumour (vs. adjacent normal) and further increased in PDX tumour (vs. patient tumour) showed the biological processed enriched for genes associated with cell cycle, cell cycle process as well as mitotic cell cycle processes (Table 8 and Table 9). A selection of the genes shortlisted and described here, have previously been associated with pancreatic cancer and validated as having an effect on proliferation, invasion and migration.
Serpin family B member 5, SERPINB5, had the largest fold change in the T vs. F1 analysis and in the top ten differentially expressed genes in the T vs. N analysis. The SERPIN superfamily of proteins is known to consist of 37 members in humans, with 13 members of the SERPINA family and 13 members of the SERPINB family [36]. SERPINA3 has been associated with endometrial cancers [37] and undifferentiated carcinoma with osteoclast-like giant cells, a rare pancreatic cancer [38]. In our differential gene expression list 3 of the 39 SERPIN family members were statistically significantly changed, SERPINA1, SERPINB5 and SERPINE1. SERPINA1 was increased in T vs. N (3.6-fold), but decreased in T vs. F1 (5.0-fold). SERPINE1 was decreased in T vs. N analysis (3.6-fold) and further decreased in T vs. F1 comparison (4.9-fold). SERPINB5 has been previously associated with pancreatic cancer. In a meta-analysis of publicly available datasets of transcriptome data for human pancreas specimens and a GEM mouse models Bhasin et al. included SERPINB5 as one the of the genes in a five gene panel for discriminating PDAC and early precursor lesions. Other genes included in this panel were TMPRSS4, AHNAK2, POSTN, ECT2 [39]. The other four genes in the panel were also detected as being significantly changed in our analysis. TMPRSS4 showed fold changes of 9.5 and 2.1 in the N vs. T and T vs. F1 respectively. Similarly, AHNAK2 fold changes were 2.6 (N vs. T) and 2 (T vs. F1), POSTN 15.5 (N vs. T) and -69.9 (T vs. F1), ECT2 2.6 (N vs. T) and 2.7 (T vs. F1). RNA-Seq analysis by Mao et al. of 10 PDAC tumour samples and adjacent benign tissue also detected SERPINB5. Their analysis showed SERPINB5 to be overexpressed in PDAC tumour in comparison to adjacent normal tissue [40]. Also in 2010, Mardin et al. identified through the analysis of the invasive and metastatic potential of 16 PDAC cell lines that SERPINB5 expression may correspond with invasive tumours [41]. Previous proteomic analysis of the same sample cohort also found SERPINB5 to be increased at the protein level when human-specific proteins were identified with significantly increased expression in PDX F1 tumours compared to PDAC tumour tissues, as determined by quantitative label-free mass spectrometric analysis [30].
Fermitin family member 1, FERMT1, encoded protein is involved in integrin signalling and linkage of the actin cytoskeleton to the extracellular matrix and has been shown to be significantly over-expressed in colon cancer [42]. FERMT1 has been shown to interact directly with β-catenin and activated the Wnt/β-catenin signalling pathway by decreasing the phosphorylation level of β-catenin in colon cancer. This activation was seen to promote EMT and led to a more aggressive and invasive phenotype in colon cancer [43]. In oesophageal cancer, overexpression of FERMT1 by lenti-viral vector increased proliferation and radiation resistance in vitro [44]. A study by Fukuhisa et al. examined the role of EPS8 in PDAC, and showed that EPS8 was overexpressed in PDAC clinical specimens, and linked with proliferation and invasion in vitro. FERMT1 is a putative downstream gene target of EPS8 [45]. While changes in EPS8 were not seen in our data set, FERMT1 changes were seen. To date, FERMT1 changes have not previously been directly shown in pancreatic cancer.
Ramachandran et al. showed that Anterior Gradient 2, AGR2, gene was expressed in pancreatic cancer tissues and cell lines, though this is not expressed in chronic pancreatitis samples. In vitro, AGR2 silencing by siRNA knockdown showed a decrease in cancer cell proliferation and invasion and increased gemcitabine sensitivity of resistant cells [46]. In breast cancer patients, AGR2 was associated with poorer survival and increased metastasis [47]. In pancreatic cancer, the invasive potential of pancreatic cancer cells in vitro was proportional to the AGR2 expression level [48].
Solute carrier family 6 member, SLC6A14 encoded protein is a sodium- and chloride-dependent neutral and basic amino acid transporter [49]. In breast cancer mouse models, SLC6A14 knock out mice showed a marked delay in tumour formation and tumour size, and analysis of the tumour material revealed evidence of amino acid starvation in the slc6a14-/- mice suggesting a key role from SLC6A14 in both tumour development and growth [50]. In 2019, Cheng et al. used three publicly available datasets to identified differentially regulated genes and validated these genes in a retrospective clinical study. This highlighted SLC6A14 as a potential prognostic biomarker of pancreatic cancer. Interestingly CENPF and SERBINB5 were also included in this panel of prognostic genes. Both of these genes were also identified in our panel [51]. SLC6A14 has been investigated as a potential novel therapeutic target for pancreatic cancer using α-methyltryptophan as a pharmacological inhibitor of SLC6A14 and showed reduced proliferation and clonogenic survival [52].
Topoisomerase IIα (TOP2A) gene encodes for a nuclear enzyme that regulates the topological structure of DNA and is involved in chromosome condensation, chromatid separation and torsional stress relief during DNA transcription and replication. TOP2A has been associated with many solid cancers such as breast and prostate cancers [53,54,55]. However, in a study of 24,262 patients with diverse tumour types, only 4% of tumours had TOP2A amplification [56]. Pancreatic patients with higher TOP2A levels were thought to have poor prognosis. TOP2A has been shown in pancreatic cancer cell lines to be associated with proliferation and migration through activation of the β-catenin signalling pathway [57].

5. Conclusions

This study details the establishment of a PDX biobank containing pancreatic ductal adenocarcinoma, intraductal papillary mucinous neoplasm, cholangiocarcinomas and neuroendocrine tumour including one PDX of a neo-adjuvant treated PDAC model. From this biobank, a further of three primary tumour cell lines and two primary patient-derived stromal cell lines were established.
This panel of PDX tumours with matched patient tumour and adjacent normal tissue was investigated by Microarray. A subset panel of 89 genes were identified and shortlisted as differentially upregulated in tumour compared to normal and further upregulated in PDX F1 tumours. Potentially this panel indicates genes highly associated with tumour growth and development. These genes were predominantly associated with proliferation, cell cycles and mitotic processes, suggesting a significant role in tumour proliferation, progression and tumour engraftment in vivo.

Supplementary Materials

Supplementary Materials can be found at https://www.mdpi.com/1422-0067/21/3/962/s1; Figure S1: Representative H&E images of patient tumours in comparison to corresponding PDX F1 tumours of PIN 065 (A & B), PIN 080 (C & D), PIN 089 (E & F) PIN 091 (G & H), PIN 099 (I & J); Figure S2: Mutations detected by Sequenom MassArray Analysis in 10 PDX F1 tumour samples; Table S1: Gene and mutations detected in 10 F1 PDX samples by Sequenom MassArray Analysis; Table S2: Shortlist of selected 89 genes increased in T compared to N and also in F1 compared to T; Table S3: List of mutations analysed using the Agena MassArray technology.

Author Contributions

Conceptualization: S.R., F.O., R.O., M.C.; Formal Analysis: S.R., F.O., S.T., Project Administration: S.R., N.S.; Resources, Investigation and Methodology: J.M. (Jean Murphy), N.S., J.M.( Justine Meiller), N.T.C., J.G., K.C., R.R., R.M., N.L.S.; Supervision: R.M.S., R.O., G.M., M.M., M.C; Writing—original draft preparation: S.R.; Writing—review and editing: S.R., F.O., R.M.S, M.C. All authors have read and agreed to the published version of the manuscript.

Funding

This publication has emanated from research supported in part by a research grant from Science Foundation (SFI) under the US-Ireland R&D Partnership Programme Grant Number SFI/14/US/B2997. Also, with funding support from The Collaborative research programme on Radiation Biology and Proteomics of pancreatic cancer funded from St Luke’s Institute for Cancer Research, Dublin.

Conflicts of Interest

The authors declare no conflicts of interest.

References

  1. Survival statistics. National Cancer Registry Ireland. Available online: https://www.ncri.ie/data/survival-statistics (accessed on 13 January 2020).
  2. Hidalgo, M.; Amant, F.; Biankin, A.V.; Budinská, E.; Byrne, A.T.; Caldas, C.; Clarke, R.B.; de Jong, S.; Jonkers, J.; Mælandsmo, G.M.; et al. Patient-derived Xenograft models: An emerging platform for translational cancer research. Cancer Discov. 2014, 4, 998–1013. [Google Scholar] [CrossRef] [PubMed] [Green Version]
  3. Feldmann, G.; Rauenzahn, S.; Maitra, A. In vitro models of pancreatic cancer for translational oncology research. Expert Opin. Drug Discov. 2009, 4, 429–443. [Google Scholar] [CrossRef] [PubMed] [Green Version]
  4. Witkiewicz, A.K.K.; Balaji, U.; Eslinger, C.; McMillan, E.; Conway, W.; Posner, B.; Mills, G.B.B.; O’Reilly, E.M.; Knudsen, E.S.S.; O’Reilly, E.M.; et al. Integrated Patient-Derived Models Delineate Individualized Therapeutic Vulnerabilities of Pancreatic Cancer. Cell Rep. 2016, 16, 2017–2031. [Google Scholar] [CrossRef] [PubMed] [Green Version]
  5. Marangoni, E.; Vincent-Salomon, A.; Auger, N.; Degeorges, A.; Assayag, F.; De Cremoux, P.; De Plater, L.; Guyader, C.; De Pinieux, G.; Judde, J.G.; et al. A new model of patient tumor-derived breast cancer xenografts for preclinical assays. Clin. Cancer Res. 2007, 13, 3989–3998. [Google Scholar] [CrossRef] [Green Version]
  6. Rios Perez, M.V.; Fleming, J.B. Patient-derived xenograft model of pancreatic cancer. In Patient Derived Tumor Xenograft Models: Promise, Potential and Practice; Elsevier Inc.: Amsterdam, The Netherlands, 2017; pp. 229–241. [Google Scholar]
  7. Weroha, S.J.; Becker, M.A.; Enderica-Gonzalez, S.; Harrington, S.C.; Oberg, A.L.; Maurer, M.J.; Perkins, S.E.; AlHilli, M.; Butler, K.A.; McKinstry, S.; et al. Tumorgrafts as in vivo surrogates for women with ovarian cancer. Clin. Cancer Res. 2014, 20, 1288–1297. [Google Scholar] [CrossRef] [Green Version]
  8. Kim, S.C.; Shin, Y.K.; Kim, S.W.; Seo, H.Y.; Kwon, W.; Kim, H.; Han, Y.; Lee, J.O.; Jang, J.Y.; Ku, J.L. Establishment and Characterization of 10 Human Pancreatic Cancer Cell Lines Including a HER2 Overexpressed Cell Line. Pancreas 2019, 48, 1285–1293. [Google Scholar] [CrossRef]
  9. Rückert, F.; Aust, D.; Böhme, I.; Werner, K.; Brandt, A.; Diamandis, E.P.; Krautz, C.; Hering, S.; Saeger, H.D.; Grützmann, R.; et al. Five primary human pancreatic adenocarcinoma cell lines established by the outgrowth method. J. Surg. Res. 2012, 172, 29–39. [Google Scholar] [CrossRef]
  10. Edge, S.B.; Byrd, D.R.; Fritz, A.G.; Fritz, A.; Greene, F.L.; Trotti, A.; Lee, H. AJCC Cancer Staging Manual; Springer: Berlin, Germany; ISBN 978-0-387-88440-0.
  11. Derose, Y.S.; Wang, G.; Lin, Y.C.; Bernard, P.S.; Buys, S.S.; Ebbert, M.T.W.; Factor, R.; Matsen, C.; Milash, B.A.; Nelson, E.; et al. Tumor grafts derived from women with breast cancer authentically reflect tumor pathology, growth, metastasis and disease outcomes. Nat. Med. 2011, 17, 1514–1520. [Google Scholar] [CrossRef]
  12. Delitto, D.; Pham, K.; Vlada, A.C.; Sarosi, G.A.; Thomas, R.M.; Behrns, K.E.; Liu, C.; Hughes, S.J.; Wallet, S.M.; Trevino, J.G. Patient-Derived Xenograft Models for Pancreatic Adenocarcinoma Demonstrate Retention of Tumor Morphology through Incorporation of Murine Stromal Elements. Am. J. Pathol. 2015, 185, 1297–1303. [Google Scholar] [CrossRef] [Green Version]
  13. Ashburner, M.; Ball, C.A.; Blake, J.A.; Botstein, D.; Butler, H.; Cherry, J.M.; Davis, A.P.; Dolinski, K.; Dwight, S.S.; Eppig, J.T.; et al. Gene ontology: Tool for the unification of biology. Nat. Genet. 2000, 25, 25–29. [Google Scholar] [CrossRef] [Green Version]
  14. Carbon, S.; Douglass, E.; Dunn, N.; Good, B.; Harris, N.L.; Lewis, S.E.; Mungall, C.J.; Basu, S.; Chisholm, R.L.; Dodson, R.J.; et al. The Gene Ontology Resource: 20 years and still GOing strong. Nucleic Acids Res. 2019, 47, D330–D338. [Google Scholar]
  15. Carbon, S.; Ireland, A.; Mungall, C.J.; Shu, S.; Marshall, B.; Lewis, S.; Hub, A.; Presence, W.; Group, W. AmiGO: Online access to ontology and annotation data. Bioinforma. Appl. NOTE 2009, 25, 288–289. [Google Scholar] [CrossRef]
  16. Gene Ontology Resource. Available online: http://geneontology.org/ (accessed on 12 December 2019).
  17. Zou, Z.; Anisowicz, A.; Hendrix, M.J.C.; Thor, A.; Neveu, M.; Sheng, S.; Rafidi, K.; Seftor, E.; Sager, R. Maspin, a serpin with tumor-suppressing activity in human mammary epithelial cells. Science 1994, 263, 526–529. [Google Scholar] [CrossRef] [PubMed]
  18. Nath, S.; Daneshvar, K.; Roy, L.D.; Grover, P.; Kidiyoor, A.; Mosley, L.; Sahraei, M.; Mukherjee, P. MUC1 induces drug resistance in pancreatic cancer cells via upregulation of multidrug resistance genes. Oncogenesis 2013, 2, e51. [Google Scholar] [CrossRef] [Green Version]
  19. Shukla, S.K.; Purohit, V.; Mehla, K.; Gunda, V.; Chaika, N.V.; Vernucci, E.; King, R.J.; Abrego, J.; Goode, G.D.; Dasgupta, A.; et al. MUC1 and HIF-1alpha Signaling Crosstalk Induces Anabolic Glucose Metabolism to Impart Gemcitabine Resistance to Pancreatic Cancer. Cancer Cell 2017, 32, 71–87. [Google Scholar] [CrossRef] [Green Version]
  20. Khan, S.S.S.; Zafar, N.; Khan, S.S.S.; Setua, S.; Behrman, S.W.; Stiles, Z.E.; Yallapu, M.M.; Sahay, P.; Ghimire, H.; Ise, T.; et al. Clinical significance of MUC13 in pancreatic ductal adenocarcinoma. Hpb 2018, 563–572. [Google Scholar]
  21. Tang, S.; Yang, R.; Zhou, X.; Pan, H.; Liu, J. Expression of GOLPH3 in patients with non-small cell lung cancer and xenografts models. Oncol. Lett. 2018, 15, 7555–7562. [Google Scholar] [CrossRef]
  22. Abdul-Jalil, K.I.; Sheehan, K.M.; Toomey, S.; Schmid, J.; Prehn, J.; O’Grady, A.; Cummins, R.; O’Neill, B.; McNamara, D.A.; Deasy, J.; et al. The frequencies and clinical implications of mutations in 33 kinase-related genes in locally advanced rectal cancer: A pilot study. Ann. Surg. Oncol. 2014, 21, 2642–2649. [Google Scholar] [CrossRef]
  23. Cancer Factsheet Pancreas. National Cancer Registry Ireland. Available online: https://www.ncri.ie/sites/ncri/files/factsheets/Factsheet%20pancreas.pdf (accessed on 13 January 2020).
  24. Balaban, E.P.; Mangu, P.B.; Yee, N.S. Locally Advanced Unresectable Pancreatic Cancer: American Society of Clinical Oncology Clinical Practice Guideline Summary. J. Oncol. Pract. 2017, 13, 265–269. [Google Scholar] [CrossRef]
  25. Pancreatic Cancer Facts—Hirshberg Foundation for Pancreatic Cancer Research. Available online: http://pancreatic.org/pancreatic-cancer/pancreatic-cancer-facts/ (accessed on 12 December 2019).
  26. Garrido-Laguna, I.; Uson, M.; Rajeshkumar, N.V.; Choon Tan, A.; De Oliveira, E.; Karikari, C.; Villaroel, M.C.; Salomon, A.; Taylor, G.; Sharma, R.; et al. Tumor engraftment in nude mice and enrichment in stroma-related gene pathways predicts poor survival and resistance to gemcitabine in patients with pancreatic cancer. Clin. Cancer Res. 2011, 17, 5793–5800. [Google Scholar] [CrossRef] [Green Version]
  27. Reyes, G.; Villanueva, A.; García, C.; Sancho, F.J.; Piulats, J.; Lluís, F.; Capellá, G. Orthotopic xenografts of human pancreatic carcinomas acquire genetic aberrations during dissemination in nude mice. Cancer Res. 1996, 56, 5713–5719. [Google Scholar]
  28. Pergolini, I.; Morales-Oyarvide, V.; Mino-Kenudson, M.; Honselmann, K.C.; Rosenbaum, M.W.; Nahar, S.; Kem, M.; Ferrone, C.R.; Lillemoe, K.D.; Bardeesy, N.; et al. Tumor engraftment in patient-derived xenografts of pancreatic ductal adenocarcinoma is associated with adverse clinicopathological features and poor survival. PLoS ONE 2017, 12, e0182855. [Google Scholar] [CrossRef] [PubMed]
  29. Rubio-Manzanares Dorado, M.; Marín Gómez, L.M.; Aparicio Sánchez, D.; Pereira Arenas, S.; Praena-Fernández, J.M.; Borrero Martín, J.J.; Farfán López, F.; Gómez Bravo, M.Á.; Muntané Relat, J.; Ruiz, J.P.; et al. Translational pancreatic cancer research: A comparative study on patient-derived xenograft models. World J. Gastroenterol. 2018, 24, 794–809. [Google Scholar] [CrossRef] [PubMed]
  30. Coleman, O.; Henry, M.; O’Neill, F.; Roche, S.; Swan, N.; Boyle, L.; Murphy, J.; Meiller, J.; Conlon, N.T.; Geoghegan, J.; et al. A comparative quantitative LC-MS/MS profiling analysis of human pancreatic adenocarcinoma, adjacent-normal tissue, and patient-derived tumour xenografts. Proteomes 2018, 6, 45. [Google Scholar] [CrossRef] [PubMed] [Green Version]
  31. Mattie, M.; Christensen, A.; Chang, M.S.; Yeh, W.; Said, S.; Shostak, Y.; Capo, L.; Verlinsky, A.; An, Z.; Joseph, I.; et al. Molecular characterization of patient-derived human pancreatic tumor xenograft models for preclinical and translational development of cancer therapeutics. Neoplasia 2013, 15, 1138–1150. [Google Scholar] [CrossRef]
  32. 32 Kim, S.T.; Lim, D.H.; Jang, K.T.; Lim, T.; Lee, J.; Choi, Y.L.; Jang, H.L.; Yi, J.H.; Baek, K.K.; Park, S.H.; et al. Impact of KRAS mutations on clinical outcomes in pancreatic cancer patients treated with first-line gemcitabine-based chemotherapy. Mol. Cancer Ther. 2011, 10, 1993–1999. [Google Scholar] [CrossRef] [Green Version]
  33. Jun, E.; Hong, S.-M.; Yoo, H.J.; Kim, M.-B.; Won, J.S.; An, S.; Shim, I.K.; Chang, S.; Hoffman, R.M.; Kim, S.C. Genetic and metabolic comparison of orthotopic and heterotopic patient-derived pancreatic-cancer xenografts to the original patient tumors. Oncotarget 2017, 9, 7867–7881. [Google Scholar] [CrossRef]
  34. Guo, S.; Gao, S.; Liu, R.; Shen, J.; Shi, X.; Bai, S.; Wang, H.; Zheng, K.; Shao, Z.; Liang, C.; et al. Oncological and genetic factors impacting PDX model construction with NSG mice in pancreatic cancer. FASEB J. 2019, 33, 873–884. [Google Scholar] [CrossRef]
  35. Liu, Y.; Chanana, P.; Davila, J.I.; Hou, X.; Zanfagnin, V.; Mcgehee, C.D.; Goode, E.L.; Polley, E.C.; Haluska, P.; Weroha, S.J.; et al. Gene expression differences between matched pairs of ovarian cancer patient tumors and patient-derived xenografts. Sci. Rep. 2019, 9, 6314. [Google Scholar] [CrossRef] [Green Version]
  36. Law, R.H.P.; Zhang, Q.; McGowan, S.; Buckle, A.M.; Silverman, G.A.; Wong, W.; Rosado, C.J.; Langendorf, C.G.; Pike, R.N.; Bird, P.I.; et al. An overview of the serpin superfamily. Genome Biol. 2006, 7, 216. [Google Scholar] [CrossRef] [Green Version]
  37. Yang, G.-D.D.; Yang, X.-M.M.; Lu, H.; Ren, Y.; Ma, M.-Z.Z.; Zhu, L.-Y.Y.; Wang, J.-H.H.; Song, W.-W.W.; Zhang, W.-M.M.; Zhang, R.; et al. SERPINA3 promotes endometrial cancer cells growth by regulating G2/M cell cycle checkpoint and apoptosis. Int. J. Clin. Exp. Pathol. 2014, 7, 1348–1358. [Google Scholar]
  38. Luchini, C.; Pea, A.; Lionheart, G.; Mafficini, A.; Nottegar, A.; Veronese, N.; Chianchiano, P.; Brosens, L.A.A.; Noë, M.; Offerhaus, G.J.A.; et al. Pancreatic undifferentiated carcinoma with osteoclast-like giant cells is genetically similar to, but clinically distinct from, conventional ductal adenocarcinoma. J. Pathol. 2017, 243, 148–154. [Google Scholar] [CrossRef] [PubMed] [Green Version]
  39. Bhasin, M.K.; Ndebele, K.; Bucur, O.; Yee, E.U.; Otu, H.H.; Plati, J.; Bullock, A.; Gu, X.; Castan, E.; Zhang, P.; et al. Meta-analysis of transcriptome data identifies a novel 5-gene pancreatic adenocarcinoma classifier. Oncotarget 2016, 7, 23263–23281. [Google Scholar] [CrossRef] [PubMed] [Green Version]
  40. Mao, Y.; Shen, J.; Lu, Y.; Lin, K.; Wang, H.; Li, Y.; Chang, P.; Walker, M.G.; Li, D. RNA sequencing analyses reveal novel differentially expressed genes and pathways in pancreatic cancer. Oncotarget 2017, 8, 42537–42547. [Google Scholar] [CrossRef] [PubMed] [Green Version]
  41. Mardin, W.A.; Petrov, K.O.; Enns, A.; Senninger, N.; Haier, J.; Mees, S.T. SERPINB5 and AKAP12—Expression and promoter methylation of metastasis suppressor genes in pancreatic ductal adenocarcinoma. BMC Cancer 2010, 10, 549. [Google Scholar] [CrossRef] [Green Version]
  42. Fan, J.; Yan, D.; Teng, M.; Tang, H.; Zhou, C.; Wang, X.; Li, D.; Qiu, G.; Peng, Z. Digital transcript profile analysis with aRNA-LongSAGE validates FERMT1 as a potential novel prognostic marker for colon cancer. Clin. Cancer Res. 2011, 17, 2908–2918. [Google Scholar] [CrossRef] [Green Version]
  43. Liu, C.C.; Cai, D.L.; Sun, F.; Wu, Z.H.; Yue, B.; Zhao, S.L.; Wu, X.S.; Zhang, M.; Zhu, X.W.; Peng, Z.H.; et al. FERMT1 mediates epithelial-mesenchymal transition to promote colon cancer metastasis via modulation of β-catenin transcriptional activity. Oncogene 2017, 36, 1779–1792. [Google Scholar] [CrossRef]
  44. Yan, Q.; Chen, T.; Yang, H.; Yu, H.; Zheng, Y.; He, T.; Wang, J. The Effect of FERMT1 Regulated by miR-24 on the Growth and Radiation Resistance of Esophageal Cancer. J. Biomed. Nanotechnol. 2019, 15, 621–631. [Google Scholar] [CrossRef]
  45. Fukuhisa, H.; Seki, N.; Idichi, T.; Kurahara, H.; Yamada, Y.; Toda, H.; Kita, Y.; Kawasaki, Y.; Tanoue, K.; Mataki, Y.; et al. Gene regulation by antitumor miR-130b-5p in pancreatic ductal adenocarcinoma: the clinical significance of oncogenic EPS8. J. Hum. Genet. 2019, 64, 521–534. [Google Scholar] [CrossRef]
  46. Ramachandran, V.; Arumugam, T.; Wang, H.; Logsdon, C.D. Anterior gradient 2 is expressed and secreted during the development of pancreatic cancer and promotes cancer cell survival. Cancer Res. 2008, 68, 7811–7818. [Google Scholar] [CrossRef] [Green Version]
  47. Barraclough, D.L.; Platt-Higgins, A.; de Silva Rudland, S.; Barraclough, R.; Winstanley, J.; West, C.R.; Rudland, P.S. The Metastasis-Associated Anterior Gradient 2 Protein Is Correlated with Poor Survival of Breast Cancer Patients. Am. J. Pathol. 2009, 175, 1848–1857. [Google Scholar] [CrossRef] [Green Version]
  48. Dumartin, L.; Whiteman, H.J.; Weeks, M.E.; Hariharan, D.; Dmitrovic, B.; Iacobuzio-Donahue, C.A.; Brentnall, T.A.; Bronner, M.P.; Feakins, R.M.; Timms, J.F.; et al. AGR2 is a novel surface antigen that promotes the dissemination of pancreatic cancer cells through regulation of cathepsins B and D. Cancer Res. 2011, 71, 7091–7102. [Google Scholar] [CrossRef] [PubMed] [Green Version]
  49. Sloan, J.L.; Mager, S. Cloning and functional expression of a human Na+ and Cl--dependent neutral and cationic amino acid transporter B0+. J. Biol. Chem. 1999, 274, 23740–23745. [Google Scholar] [CrossRef] [PubMed] [Green Version]
  50. Babu, E.; Bhutia, Y.D.; Ramachandran, S.; Gnanaprakasam, J.P.; Prasad, P.D.; Thangaraju, M.; Ganapathy, V. Deletion of the amino acid transporter SLC6A14 suppresses tumour growth in spontaneous mouse models of breast cancer. Biochem. J. 2015, 469, 17–23. [Google Scholar] [CrossRef] [PubMed]
  51. Cheng, Y.; Wang, K.; Geng, L.; Sun, J.; Xu, W.; Liu, D.; Gong, S.; Zhu, Y. Identification of candidate diagnostic and prognostic biomarkers for pancreatic carcinoma. EBioMedicine 2019, 40, 382–393. [Google Scholar] [CrossRef] [Green Version]
  52. Coothankandaswamy, V.; Cao, S.; Xu, Y.; Prasad, P.D.; Singh, P.K.; Reynolds, C.P.; Yang, S.; Ogura, J.; Ganapathy, V.; Bhutia, Y.D. Amino acid transporter SLC6A14 is a novel and effective drug target for pancreatic cancer. Br. J. Pharmacol. 2016, 173, 3292–3306. [Google Scholar] [CrossRef] [Green Version]
  53. Klintman, M.; Buus, R.; Cheang, M.C.U.; Sheri, A.; Smith, I.E.; Dowsett, M. Changes in expression of genes representing key biologic processes after neoadjuvant chemotherapy in breast cancer, and prognostic implications in residual disease. Clin. Cancer Res. 2016, 22, 2405–2416. [Google Scholar] [CrossRef] [Green Version]
  54. Kirk, J.S.; Schaarschuch, K.; Dalimov, Z.; Lasorsa, E.; Ku, S.Y.; Ramakrishnan, S.; Hu, Q.; Azabdaftari, G.; Wang, J.; Pili, R.; et al. Top2a identifies and provides epigenetic rationale for novel combination therapeutic strategies for aggressive prostate cancer. Oncotarget 2015, 6, 3136–3146. [Google Scholar] [CrossRef] [Green Version]
  55. Labbé, D.P.; Sweeney, C.J.; Brown, M.; Galbo, P.; Rosario, S.; Wadosky, K.M.; Ku, S.Y.; Sjöström, M.; Alshalalfa, M.; Erho, N.; et al. TOP2A and EZH2 provide early detection of an aggressive prostate cancer subgroup. Clin. Cancer Res. 2017, 23, 7072–7083. [Google Scholar] [CrossRef] [Green Version]
  56. Heestand, G.M.; Schwaederle, M.; Gatalica, Z.; Arguello, D.; Kurzrock, R. Topoisomerase expression and amplification in solid tumours: Analysis of 24,262 patients HHS Public Access. Eur. J. Cancer 2017, 83, 80–87. [Google Scholar] [CrossRef] [Green Version]
  57. Pei, Y.F.; Yin, X.M.; Liu, X.Q. TOP2A induces malignant character of pancreatic cancer through activating β-catenin signaling pathway. Biochim. Biophys. Acta Mol. Basis Dis. 2018, 1864, 197–207. [Google Scholar] [CrossRef]
Figure 1. Tumour growth in vivo of patient derived xenograft (PDX) samples. PIN 099, 112, 139, 175, 190, 222, 291 represent single animals while the remainder represent an average growth rate.
Ijms 21 00962 g001
Figure 2. Brightfield images of cell morphology and immunohistochemical staining of PDX-derived tumour cells using primary antibody Anti-Mitochondria antibody 113–1 (1:1000 dilution) of PIN 080 (A,B) PIN 099(C,D) and PIN 127 (E,F). A, C and E were imaged at 20×, and B, D and F were imaged at 10×.
Ijms 21 00962 g002
Figure 3. Immunohistochemical staining of PDX tumour sections using primary antibody Anti-Mitochondria antibody 113-1, where panel A shows PIN 065; B PIN 080; C PIN 089; D PIN091; E PIN 099; F PIN 120; G PIN 140; H PIN 141; I PIN 160; J PIN 161. Magnification for all images is 10× (scale 43.71 µm) and an antibody dilution of 1/1000.
Ijms 21 00962 g003
Figure 4. Hierarchical clustering and principle component analysis of adjacent normal tissue, patient tumour and PDX tumour.
Ijms 21 00962 g004
Figure 5. Individual expression of five selected genes, SERPINB5 (A) FERMT1 (B) AGR2 (C) SLC6A14 (D) TOP2A (E), across the adjacent normal, patient tumour and PDX F1 samples. PIN 089 and PIN 161 adjacent normal samples were not included in the microarray analysis, and PIN 065 patient tumour sample.
Ijms 21 00962 g005
Table 1. Patient diagnostic information.
Patient IDDiagnosisAge at Surgery (Years)SexSurgical ProcedureGradeResection StatusLocationSize (mm)Background Pathology
PIN 062 Islet cell carcinoma (ICC) 66.1MWhipple’sModerately differentiated--15-
PIN 065 Invasive ductal adenocarcinoma (PDAC)77.4FWhipple’sModerately differentiated--50-
PIN 080 Invasive adenocarcinoma70.6MWhipple’sModerately differentiated--8-
PIN 082 Intraductal papillary mucinous neoplasm (IPMN)63.8MTotal Pancreatectomy Incl SpleenLow- and high-grade dysplasia--60-
PIN 089 Invasive ductal adenocarcinoma45.9FDistal PancreasModerately differentiated--35-
PIN 091Invasive ductal adenocarcinoma64.5MMedian Pancreatectomy Moderately invasive--21PanIN 2 and focal chronic pancreatitis
PIN 099Invasive ductal adenocarcinoma63.0FWhipple’sPoorly differentiatedR0Pancreatic Head17Pancreatic intraepithelial neoplasia, low-grade (PanIN1) and marked chronic pancreatitis
PIN 102Cholangiocarcinoma61.8MWhipple’sPoorly differentiated--23-
PIN 112 Invasive ductal adenocarcinoma79.7MDistal PancreasModerate differentiation--20Chronic pancreatitis
PIN 113 Poorly differentiated adenocarcinoma with anaplastic and signet ring74.7MDistal PancreasPoorly differentiated --145-
PIN 115 Invasive ductal adenocarcinoma, moderately differentiated72.8FDistal Pancreatectomy Moderately differentiated--35Chronic pancreatitis and PanIN of the main pancreatic duct
PIN 116Invasive ductal carcinoma62.4MDistal Pancreas Poorly differentiated- Pancreatic Tail 60Prominent associated chronic pancreatitis
PIN 120 Invasive ductal adenocarcinoma65.1MWhipple’sModerately differentiated-Head of Pancreas14The pancreatic parenchyma shows PanIN3 and focal chronic pancreatitis
PIN 127 Invasive moderately differentiated adenocarcinoma72.7MWhipple’sModerately differentiated --48PanIN Ib is noted in the pancreas
PIN 132 Metastatic renal cell carcinoma (RCC)71.2MWhipple’s---25-
PIN 135 Neuroendocrine tumour (NET)70.9M----13-
PIN 137Invasive ductal adenocarcinoma68.9MWhipple’sModerately differentiated Uncinate Process30Chronic pancreatitis
PIN 138Invasive adenocarcinoma, intestinal type60.1MWhipple’sModerately differentiatedR0-19Stomach with chronic gastritis, mild activity and focal chronic pancreatitis
PIN 139Invasive ductal adenocarcinoma with squamous differentiation70.8MPancreaticoduodenectomy (Whipple’s resection)Poorly differentiated-Uncinate Process30-
PIN 140Invasive ductal carcinoma63.5MPancreaticoduodenectomy, Whipple’s procedureModerateR0Pancreatic Head32Invasive tumour arises in association with an IPMN which displays intestinal differentiation and contains moderate dysplasia. The invasive tumour present is pancreatico-biliary type (non-mucinous). Focal chronic pancreatitis and chronic inactive gastritis also noted
PIN 141Invasive ductal adenocarcinoma82.7MWhipple’sPoorly differentiated-Pancreatic Head35Chronic pancreatitis
PIN 145Post chemoradiotherapy - tumour presumed necrotic 71.2MWhipple’s---32 (50 mm on pre-neoadj CT)-
PIN 148invasive ductal adenocarcinoma62.9FDistal Pancreatectomy Poorly differentiated--15-
PIN 160Invasive ductal adenocarcinoma, moderately differentiated77.4FWhipple’sModerately differentiated--25Extensive associated chronic pancreatitis
PIN 161Invasive ductal adenocarcinoma 61.3MWhipple’sModerately differentiated-Uncinate Process/Pancreatic Head High-grade PanIN
PIN 165Invasive ductal carcinoma57.4FWhipple’sPoorly differentiated- Pancreatic Head and Uncinate Process 35-
PIN 175IPMN/NET63.1MWhipple’s---27-
PIN 190Invasive ductal adenocarcinoma71.8MWhipple’sPoorly differentiated-Pancreatic Head25-
PIN 191Ductal adenocarcinoma post neo-adjuvant chemotherapy70.3FCentral and Distal PancreasModerately differentiated, entrapped within a densely fibrotic stroma showing chronic inflammation and evidence of treatment effect----
PIN 194No evidence of residual tumour—complete pathology response71.6FWhipple’s---0-
PIN 199Invasive ductal adenocarcinoma neo-adjuvant chemotherapy and radiotherapy62.2MDistal Pancreatectomy with SplenectomyModerately differentiated--15PanIN grade 3
PIN 205Invasive ductal carcinoma63.6FPancreatic Duodenectomy (Whipple’s Resection)Moderately differentiatedR1Pancreatic Head20PanIN, chronic pancreatitis
PIN 210Well-differentiated neuroendocrine tumour (NET)65.4MWhipple’s Resection) PancreaticoduodenectomyG1 (1 mitoses/10 hpf, Ki67 index = 5%)----
PIN 211Invasive ductal adenocarcinoma80.0MWhipple’s/Pancreatico-duodenectomy:Well differentiated R1Pancreatic Head25Chronic pancreatitis Pancreatic divisum
PIN 212Mucinous cystic neoplasm63.4FDistal Pancreas and Spleen---100-
PIN 213Invasive adenocarcinoma/cholangiocarcinoma70.6FPancreatico-duodenectomy: Whipple’sModerately differentiated R0Distal Common Bile Duct (Intra-Pancreatic)20PanIN 1b: Chronic pancreatitis and chronic cholecystitis,
PIN 214Well-differentiated neuroendocrine tumour79.2FDistal Pancreatectomy with SpleenG2 (3 mitoses/10 hpf, Ki-67 > 5–20%) R0-60-
PIN 218Well-differentiated neuroendocrine tumour (NET)47.7FPancreaticoduodenectomy (Whipple’s Resection)G1 (<2 mitoses/10 hpf). R1Head and Neck of Pancreas--
PIN 222Invasive ductal carcinoma64.5MPancreaticoduodenectomy (Whipple’s Resection)Moderately differentiatedR0Pancreatic Head Chronic pancreatitis, chronic cholecystitis and cholelithiasis
PIN 226Invasive ductal adenocarcinoma71.6FPancreaticoduodenectomy (Whipple’s Resection)Moderately differentiatedR0-40-
PIN 228Invasive ductal adenocarcinoma77.1MPancreaticoduodenectomy (Whipple’s Resection)Moderately differentiatedR0---
PIN 233Invasive ductal adenocarcinoma73.0FPancreaticoduodenectomy (Whipple’s Resection)Moderately differentiatedR0Pancreatic Head--
PIN 238Neuroendocrine tumour40.7MWhipple’s-----
PIN 239GIST*57.6F------
PIN 266Cholangiocarcinoma57.0FWhipple’s-----
PIN 268Invasive ductal adenocarcinoma57.3MWhipple’sPoorly differentiatedR1--Chronic Pancreatitis
PIN 277Adenocarcinoma69.2MPancreaticoduodenectomy (Whipple’s Resection)-R0--PanIN Grade 1
PIN 291Adenocarcinoma, pancreaticobiliary type56.5FPancreaticoduodenectomy (Whipple’s Resection)-R1---
* GIST = Gastro-intestinal stromal tumour; “-“ = information not available
Table 2. Patient survival and treatment information.
Patient IDDiagnosisTime to Last F/U (Years)Status at Last F/UNeo Adjuvant TreatmentAdjuvant Treatment
PIN 062 ICC3.7AliveNoneGem
PIN 065 PDAC1.0DeceasedNoneAdj radiation, no adj chemo
PIN 080 PDAC0.8AliveNoneGem
PIN 082 IPMN3.6AliveNoneNo adj chemo
PIN 089 PDAC1.6AliveNoneNo information
PIN 091PDAC3.1DeceasedNoneGem/Oxaliplatin + radiation
PIN 099PDAC1.6DeceasedNoneGem
PIN 102Cholangio1.7DeceasedNoneAdjuvant treatment—regime unknown
PIN 112 PDAC2.6AliveNoneGem
PIN 113 PDAC0.4DeceasedNoneGem
PIN 115 PDAC0.0AliveNone-
PIN 116PDAC1.1DeceasedNoneGem/Abraxane
PIN 120 PDAC1.1AliveNoneGem
PIN 127 PDAC2.1DeceasedNoneCapecitabine
PIN 132 RCC2.4AliveNone-
PIN 135 NET1.6AliveNone-
PIN 137PDAC2.4AliveNoneGem/Abraxane*
PIN 138PDAC1.7AliveNoneAdjuvant treatment + radiation
PIN 139PDAC1.4DeceasedFOLFIRINOX + RadiationAdjuvant treatment—regime unknown
PIN 140PDAC0.4DeceasedNoneAdjuvant treatment—regime unknown
PIN 141PDAC1.1DeceasedNoneNo information
PIN 145PDAC1.6AliveFOLFIRINOX + Radiation Adjuvant chemo +radiotherapy
PIN 148PDAC1.8AliveNoneNo information
PIN 160PDAC1.4DeceasedNoneGem
PIN 161PDAC- -
PIN 165PDAC-DeceasedFOLFIRINOX +Short Course RadiationNo adj chemo
PIN 175IPMN-AliveNoneCarbo/Etoposide
PIN 190PDAC-DeceasedNoneGem/Abraxane *
PIN 191PDAC-AliveGem/Oxaliplatin + Long Course RadiationNo information
PIN 194PDAC-DeceasedGem/Abraxane + Long Course RadiationNo information
PIN 199PDAC-AliveNeo-adjuvant—regime unknown
PIN 205PDAC---
PIN 210NET---
PIN 211PDAC---
PIN 212MCN---
PIN 213PDAC---
PIN 214NET---
PIN 218NET---
PIN 222PDAC---
PIN 226PDAC---
PIN 228PDAC---
PIN 233PDAC---
PIN 238NET---
PIN 239GIST---
PIN 266Cholangio---
PIN 268PDAC---
PIN 277PDAC---
PIN 291PDAC---
F/U = Follow-Up; Gem = Gemcitabine; * = (APACT study); “-“ information not available
Table 3. Tumour diagnosis, take rate and growth in first generation in mouse.
Sample IdentifierDiagnosisTime to First Notice (days)F1 Tumour Engraftment (%)Tissue Used in Microarray Analysis
PIN 062ICCNT0.0-
PIN 065PDAC27.0100.0
PIN 080PDAC35.066.7
PIN 082IPMNNT0.0-
PIN 089PDAC33.0100.0
PIN 091PDAC34.075.0-
PIN 099PDAC29.025.0-
PIN 102Cholangio *34.0100.0-
PIN 112PDAC196.033.3
PIN 113PDAC34.0100.0-
PIN 115PDACNT 0.0-
PIN 116PDAC26.0100.0-
PIN 120PDAC56.0100.0
PIN 127PDAC62.0100.0-
PIN 132RCCNT 0.0-
PIN 135NETNT 0.0-
PIN 137PDACNT 0.0-
PIN 138PDACNT 0.0-
PIN 139PDAC98.033.3-
PIN 140PDAC23.066.7
PIN 141PDAC27.0100.0-
PIN 145PDACNT 0.0-
PIN 148PDACNT 0.0-
PIN 160PDAC27.0100.0
PIN 161PDAC42.066.7
PIN 165PDACNT 0.0-
PIN 175IPMN/NET112.033.3-
PIN 190PDAC306.033.3-
PIN 191PDACNT 0.0-
PIN 194PDACNT 0.0-
PIN 199PDACNT 0.0-
PIN 205PDAC56.0100.0-
PIN 210NETNT 0.0-
PIN 211PDACNT 0.0-
PIN 212Mucinous Cystic NeoplasmNT 0.0-
PIN 213PDAC/Cholangio105.033.3-
PIN 214NETNT 0.0-
PIN 218NET20.066.7-
PIN 222PDAC46.050.0-
PIN 226PDACNT 0.0-
PIN 228PDACNT 0.0-
PIN 233PDAC78.033.3-
PIN 238NETNT 0.0-
PIN 239GISTNT 0.0-
PIN 266Cholangio120.066.7-
PIN 268PDAC118.033.3-
PIN 277PDACNT --
PIN 291PDAC71.033.3-
* Cholangio = Cholangiocarcinoma; “NT”= No tumour developed; “✓” = sample used in microarray study; “-“ = sample not used in microarray study.
Table 4. Breakdown of samples included in microarray profiling and matched comparisons.
Sample Identifier PIN 065PIN 080PIN 089PIN 112PIN 120PIN 140PIN 160PIN 161
Normal
Tumour
F1
” = sample used in microarray study “ “ = sample not used in microarray study
Table 5. The number of gene changes detected across the sample types, normal vs. tumour, tumour vs. F1 and triple comparison of normal vs. tumour vs. F1. All gene changes reported were statistically significant (p ≤ 0.05). Genes that were 2-fold or greater increased were investigated further.
Comparison Criteria p ≤ 0.05Number of Genes Changed
Normal vs. tumour1.5-fold increase1019
2-fold increase413
1.5-fold decrease394
2-fold decrease116
Tumour vs. F11.5-fold increase1670
2-fold increase491
1.5-fold decrease2145
2-fold decrease1312
Normal vs. tumour vs. F11.5-fold increase274
2-fold increase89
1.5-fold decrease94
2-fold decrease33
Normal vs. tumour vs. F11.5-fold increase in T (vs. N) and 1.5-fold decrease in F1 (vs. T)147
1.5-fold decrease in T (vs. N) and 1.5-fold increase in F1 (vs. T)9
Table 6. Top 20 differentially expressed genes upregulated in a comparison of tumour vs. normal samples, ordered by fold change.
Gene SymbolTumour Avg (log2)Normal Avg (log2)Tumour SDNormal SDFold Changep-value
SLC6A147.63.11.91.922.84.00 × 10−4
TSPAN17.84.51.01.49.52.97 × 10−5
TMPRSS47.23.91.21.39.52.00 × 10−4
MUC138.95.61.61.79.47.00 × 10−4
SLPI8.96.10.91.86.96.00 × 10−4
SERPINB55.32.50.91.06.88.84 × 10−5
NQO17.95.31.01.66.48.45 × 10–5
HIST1H2BM6.23.51.31.76.46.10 × 10–3
TOP2A6.43.70.71.46.42.00 × 10–4
FERMT17.64.91.10.96.43.00 × 10–4
GALNT56.54.01.71.25.83.89 × 10–2
PLS18.46.10.90.95.37.00 × 10–4
TSPAN88.05.60.61.25.23.00 × 10–4
TMEM45B6.94.50.81.05.04.00 × 10–4
AGR25.73.41.41.35.01.50 × 10–3
LIPH8.15.91.11.34.93.00 × 10–4
KRT237.55.30.61.34.58.80 × 10–5
FAM83B6.84.71.21.34.55.00 × 10–4
TPX25.13.00.91.14.43.40 × 10–3
C19orf338.26.10.61.44.31.65 × 10–2
Table 7. Top 20 differentially expressed genes upregulated in a comparison of tumour vs. F1 samples, ordered by fold change.
Gene SymbolPDX F1 Avg (log2)Tumour Avg (log2)F1 SDTumour SDFold Changep-value
SERPINB58.05.31.00.96.68.96 × 10–6
ABCA126.33.71.11.05.72.34 × 10–5
GALNT59.06.52.11.75.64.14 × 10–2
ASPM6.54.10.50.85.12.92 × 10–7
AGR28.15.70.61.45.13.00 × 10–4
ANLN7.95.70.50.94.62.66 × 10–5
AFAP1-AS17.35.11.51.54.51.59 × 10–2
TMEM45B8.96.91.00.84.11.10 × 10–3
TPX27.15.10.50.93.96.64 × 10–5
CCNA27.65.70.70.83.94.81 × 10–5
TOP2A8.46.40.50.73.82.00 × 10–4
FAM111B6.64.71.01.43.82.00 × 10–4
S100A148.76.80.80.93.85.70 × 10–5
CDK16.04.00.80.73.85.00 × 10–4
FANCI6.74.80.60.93.72.36 × 10–5
FUT27.05.11.00.73.66.00 × 10–4
HIST1H2BM8.16.20.71.33.62.50 × 10–2
CENPF6.84.90.30.63.63.70 × 10–7
KIF116.85.00.60.83.52.87 × 10–5
MKI677.75.910.490.793.51.00 × 10–4
Table 8. Gene ontology analysis of shortlisted genes by biological process.
GO Biological Process CompleteHomo Sapiens—REF LIST (20,996)Query List (89)
cell cycle (GO:0007049)132821
cell cycle process (GO:0022402)98618
regulation of cell cycle (GO:0051726)120617
mitotic cell cycle process (GO:1903047)61016
mitotic cell cycle (GO:0000278)69616
cell division (GO:0051301)49415
regulation of cell cycle process (GO:0010564)76313
regulation of mitotic cell cycle (GO:0007346)63812
positive regulation of cellular protein localization (GO:1903829)3329
regulation of mitotic nuclear division (GO:0007088)1718
regulation of nuclear division (GO:0051783)1968
nuclear division (GO:0000280)2798
DNA packaging (GO:0006323)1777
chromosome condensation (GO:0030261)435
Table 9. Amigo database analysis of shortlisted genes by biological process.
GO Biological Process CompleteHomo Sapiens—REF LIST (20,996)Upload List (89)Upload (Fold Enrichment)Upload (p-Value)
cell cycle (GO:0007049)1335213.711.39 × 10–3
cell cycle process (GO:0022402)998184.251.80 × 10–3
mitotic cell cycle process (GO:1903047)616166.137.34 × 10–5
mitotic cell cycle (GO:0000278)699165.44.10 × 10–4
cell division (GO:0051301)496157.133.15 × 10–5
regulation of mitotic nuclear division (GO:0007088)173810.918.88 × 10–3
regulation of nuclear division (GO:0051783)19789.582.26 × 10–2
chromosome condensation (GO:0030261)43527.431.60 × 10–2
Unclassified (UNCLASSIFIED)311140.3

