Elevated Plasma Levels of Circulating Extracellular miR-320a-3p in Patients with Paroxysmal Atrial Fibrillation

 , , and
Abstract
: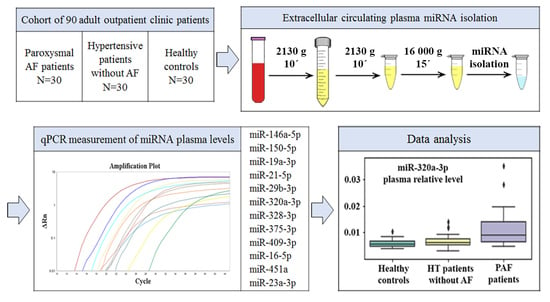
1. Introduction
2. Results
2.1. Study Sample Characteristics
- PAF: 30 PAF patients;
- HT: 30 hypertensive patients without AF;
- CONTR: 30 healthy controls.
2.2. Spectrophotometric and miRNA-qPCR-Based Hemolysis Evaluation
2.3. Plasma miRNA Levels
3. Discussion
4. Materials and Methods
4.1. Ethics Statement
4.2. Study Population
4.3. Plasma Collection and Storage
4.4. Hemolysis Assessment of Plasma Samples
4.5. Plasma miRNA Isolation
4.6. cDNA Synthesis and qPCR for miRNA Detection
4.7. Data Analysis
Supplementary Materials
Author Contributions
Funding
Acknowledgments
Conflicts of Interest
Abbreviations
| ACEI | Angiotensin-converting enzyme inhibitors |
| ACM | Arrhythmogenic cardiomyopathy |
| AF | Atrial fibrillation |
| CAD | Coronary artery disease |
| cDNA | Complementary DNA |
| CV | Coefficient of variation |
| CVD | Cardiovascular diseases |
| DM | Diabetes mellitus |
| HDL | High-density lipoproteins |
| HT | Hypertension |
| IQR | Interquartile range |
| LDL | Low-density lipoproteins |
| miRNA | MicroRNA |
| MLR | Multiple linear regression |
| Nf-kB | Nuclear factor-kappa B |
| NTC | No-template control |
| PAF | Paroxysmal atrial fibrillation |
| PFP | Platelet-free plasma |
| PMP | Platelet microparticle |
| PPP | Platelet-poor plasma |
| qPCR | Quantitative PCR |
| RBC | Red blood cell |
| SD | Standard deviation |
References
- Hijazi, Z.; Oldgren, J.; Siegbahn, A.; Granger, C.B.; Wallentin, L. Biomarkers in atrial fibrillation: A clinical review. Eur. Heart J. 2013, 34, 1475–1480. [Google Scholar] [CrossRef]
- Romaine, S.P.R.; Tomaszewski, M.; Condorelli, G.; Samani, N.J. MicroRNAs in cardiovascular disease: An introduction for clinicians. Heart 2015, 101, 921–928. [Google Scholar] [CrossRef]
- Navickas, R.; Gal, D.; Laucevičius, A.; Taparauskaitė, A.; Zdanytė, M.; Holvoet, P. Identifying circulating microRNAs as biomarkers of cardiovascular disease: A systematic review. Cardiovasc. Res. 2016, 111, 322–337. [Google Scholar] [CrossRef]
- Xu, J.; Zhao, J.; Evan, G.; Xiao, C.; Cheng, Y.; Xiao, J. Circulating microRNAs: Novel biomarkers for cardiovascular diseases. J. Mol. Med. 2012, 90, 865–875. [Google Scholar] [CrossRef]
- Zhou, S.-S.; Jin, J.-P.; Wang, J.-Q.; Zhang, Z.-G.; Freedman, J.H.; Zheng, Y.; Cai, L. miRNAS in cardiovascular diseases: Potential biomarkers, therapeutic targets and challenges. Acta Pharmacol. Sin. 2018, 39, 1073–1084. [Google Scholar] [CrossRef] [Green Version]
- Da Silva, A.M.G.; De Araújo, J.N.G.; De Freitas, R.C.C.; Silbiger, V.N. Circulating MicroRNAs as Potential Biomarkers of Atrial Fibrillation. Biomed Res. Int. 2017, 2017, 7804763. [Google Scholar] [CrossRef]
- Andrade, J.; Khairy, P.; Dobrev, D.; Nattel, S. The clinical profile and pathophysiology of atrial fibrillation: Relationships among clinical features, epidemiology, and mechanisms. Circ. Res. 2014, 114, 1453–1468. [Google Scholar] [CrossRef]
- Weil, B.R.; Ozcan, C. Cardiomyocyte Remodeling in Atrial Fibrillation and Hibernating Myocardium: Shared Pathophysiologic Traits Identify Novel Treatment Strategies? Biomed Res. Int. 2015, 2015, 587361. [Google Scholar] [CrossRef]
- Li, Y.; Tan, W.; Ye, F.; Xue, F.; Gao, S.; Huang, W.; Wang, Z. Identification of microRNAs and genes as biomarkers of atrial fibrillation using a bioinformatics approach. J. Int. Med. Res. 2019, 47, 3580–3589. [Google Scholar] [CrossRef] [Green Version]
- Yu, H.; Wang, Z. Cardiomyocyte-Derived Exosomes: Biological Functions and Potential Therapeutic Implications. Front. Physiol. 2019, 10, 1049. [Google Scholar] [CrossRef]
- Wang, S.; Min, J.; Yu, Y.; Yin, L.; Wang, Q.; Shen, H.; Yang, J.; Zhang, P.; Xiao, J.; Wang, Z. Differentially expressed miRNAs in circulating exosomes between atrial fibrillation and sinus rhythm. J. Thorac. Dis. 2019, 11, 4337–4348. [Google Scholar] [CrossRef]
- Juzenas, S.; Venkatesh, G.; Hübenthal, M.; Hoeppner, M.P.; Du, Z.G.; Paulsen, M.; Rosenstiel, P.; Senger, P.; Hofmann-Apitius, M.; Keller, A.; et al. A comprehensive, cell specific microRNA catalogue of human peripheral blood. Nucleic Acids Res. 2017, 45, 9290–9301. [Google Scholar] [CrossRef] [Green Version]
- Xia, L.; Zeng, Z.; Tang, W.H. The Role of Platelet Microparticle Associated microRNAs in Cellular Crosstalk. Front. Cardiovasc. Med. 2018, 5, 29. [Google Scholar] [CrossRef] [Green Version]
- Lindsay, C.R.; Edelstein, L.C. MicroRNAs in Platelet Physiology and Function. Semin. Thromb. Hemost. 2016, 42, 215–222. [Google Scholar] [CrossRef]
- Creemers, E.E.; Tijsen, A.J.; Pinto, Y.M. Circulating microRNAs: Novel biomarkers and extracellular communicators in cardiovascular disease? Circ. Res. 2012, 110, 483–495. [Google Scholar] [CrossRef]
- Mitchell, A.J.; Gray, W.D.; Hayek, S.S.; Ko, Y.-A.; Thomas, S.; Rooney, K.; Awad, M.; Roback, J.D.; Quyyumi, A.; Searles, C.D. Platelets confound the measurement of extracellular miRNA in archived plasma. Sci. Rep. 2016, 6, 32651. [Google Scholar] [CrossRef] [Green Version]
- Duttagupta, R.; Jiang, R.; Gollub, J.; Getts, R.C.; Jones, K.W. Impact of Cellular miRNAs on Circulating miRNA Biomarker Signatures. PLoS ONE 2011, 6, e20769. [Google Scholar] [CrossRef]
- Willeit, P.; Zampetaki, A.; Dudek, K.; Kaudewitz, D.; King, A.; Kirkby, N.S.; Crosby-Nwaobi, R.; Prokopi, M.; Drozdov, I.; Langley, S.R.; et al. Circulating microRNAs as novel biomarkers for platelet activation. Circ. Res. 2013, 112, 595–600. [Google Scholar] [CrossRef] [Green Version]
- Blondal, T.; Jensby Nielsen, S.; Baker, A.; Andreasen, D.; Mouritzen, P.; Wrang Teilum, M.; Dahlsveen, I.K. Assessing sample and miRNA profile quality in serum and plasma or other biofluids. Methods 2013, 59, S1–S6. [Google Scholar] [CrossRef]
- Goren, Y.; Meiri, E.; Hogan, C.; Mitchell, H.; Lebanony, D.; Salman, N.; Schliamser, J.E.; Amir, O. Relation of reduced expression of MiR-150 in platelets to atrial fibrillation in patients with chronic systolic heart failure. Am. J. Cardiol. 2014, 113, 976–981. [Google Scholar] [CrossRef]
- De Boer, H.C.; Van Solingen, C.; Prins, J.; Duijs, J.M.G.J.; Huisman, M.V.; Rabelink, T.J.; Van Zonneveld, A.J. Aspirin treatment hampers the use of plasma microRNA-126 as a biomarker for the progression of vascular disease. Eur. Heart J. 2013, 34, 3451–3457. [Google Scholar] [CrossRef]
- Sommariva, E.; D’Alessandra, Y.; Farina, F.M.; Casella, M.; Cattaneo, F.; Catto, V.; Chiesa, M.; Stadiotti, I.; Brambilla, S.; Dello Russo, A.; et al. MiR-320a as a Potential Novel Circulating Biomarker of Arrhythmogenic CardioMyopathy. Sci. Rep. 2017, 7, 4802. [Google Scholar] [CrossRef]
- Liu, Z.; Zhou, C.; Liu, Y.; Wang, S.; Ye, P.; Miao, X.; Xia, J. The expression levels of plasma micoRNAs in atrial fibrillation patients. PLoS ONE 2012, 7, e44906. [Google Scholar] [CrossRef]
- McManus, D.D.; Tanriverdi, K.; Lin, H.; Esa, N.; Kinno, M.; Mandapati, D.; Tam, S.; Okike, O.N.; Ellinor, P.T.; Keaney, J.F.; et al. Plasma microRNAs are associated with atrial fibrillation and change after catheter ablation (the miRhythm study). Heart Rhythm. 2015, 12, 3–10. [Google Scholar] [CrossRef] [Green Version]
- Zhou, Q.; Maleck, C.; Von Ungern-Sternberg, S.N.I.; Neupane, B.; Heinzmann, D.; Marquardt, J.; Duckheim, M.; Scheckenbach, C.; Stimpfle, F.; Gawaz, M.; et al. Circulating MicroRNA-21 Correlates With Left Atrial Low-Voltage Areas and Is Associated With Procedure Outcome in Patients Undergoing Atrial Fibrillation Ablation. Circ. Arrhythm. Electrophysiol. 2018, 11, e006242. [Google Scholar] [CrossRef]
- Shah, J.S.; Soon, P.S.; Marsh, D.J. Comparison of Methodologies to Detect Low Levels of Hemolysis in Serum for Accurate Assessment of Serum microRNAs. PLoS ONE 2016, 11, e0153200. [Google Scholar] [CrossRef]
- Pritchard, C.C.; Kroh, E.; Wood, B.; Arroyo, J.D.; Dougherty, K.J.; Miyaji, M.M.; Tait, J.F.; Tewari, M. Blood cell origin of circulating microRNAs: A cautionary note for cancer biomarker studies. Cancer Prev. Res. 2012, 5, 492–497. [Google Scholar] [CrossRef] [Green Version]
- Kirschner, M.B.; Edelman, J.B.; Kao, S.C.-H.; Vallely, M.P.; Van Zandwijk, N.; Reid, G. The Impact of Hemolysis on Cell-Free microRNA Biomarkers. Front. Genet. 2013, 4, 94. [Google Scholar] [CrossRef] [Green Version]
- McDonald, J.S.; Milosevic, D.; Reddi, H.V.; Grebe, S.K.; Algeciras-Schimnich, A. Analysis of circulating microRNA: Preanalytical and analytical challenges. Clin. Chem. 2011, 57, 833–840. [Google Scholar] [CrossRef] [Green Version]
- Cheng, H.H.; Yi, H.S.; Kim, Y.; Kroh, E.M.; Chien, J.W.; Eaton, K.D.; Goodman, M.T.; Tait, J.F.; Tewari, M.; Pritchard, C.C. Plasma processing conditions substantially influence circulating microRNA biomarker levels. PLoS ONE 2013, 8, e64795. [Google Scholar] [CrossRef] [Green Version]
- Binderup, H.G.; Madsen, J.S.; Heegaard, N.H.H.; Houlind, K.; Andersen, R.F.; Brasen, C.L. Quantification of microRNA levels in plasma—Impact of preanalytical and analytical conditions. PLoS ONE 2018, 13, e0201069. [Google Scholar] [CrossRef]
- Glinge, C.; Clauss, S.; Boddum, K.; Jabbari, R.; Jabbari, J.; Risgaard, B.; Tomsits, P.; Hildebrand, B.; Kääb, S.; Wakili, R.; et al. Stability of Circulating Blood-Based MicroRNAs—Pre-Analytic Methodological Considerations. PLoS ONE 2017, 12, e0167969. [Google Scholar] [CrossRef]
- Felekkis, K.; Papaneophytou, C. Challenges in Using Circulating Micro-RNAs as Biomarkers for Cardiovascular Diseases. Int. J. Mol. Sci. 2020, 21, 561. [Google Scholar] [CrossRef] [Green Version]
- Boriani, G.; Diemberger, I.; Martignani, C.; Biffi, M.; Branzi, A. The epidemiological burden of atrial fibrillation: A challenge for clinicians and health care systems. Eur. Heart J. 2006, 27, 893–894. [Google Scholar] [CrossRef]
- Appierto, V.; Callari, M.; Cavadini, E.; Morelli, D.; Daidone, M.G.; Tiberio, P. A lipemia-independent NanoDrop(®)-based score to identify hemolysis in plasma and serum samples. Bioanalysis 2014, 6, 1215–1226. [Google Scholar] [CrossRef]
- Max, K.E.A.; Bertram, K.; Akat, K.M.; Bogardus, K.A.; Li, J.; Morozov, P.; Ben-Dov, I.Z.; Li, X.; Weiss, Z.R.; Azizian, A.; et al. Human plasma and serum extracellular small RNA reference profiles and their clinical utility. Proc. Natl. Acad. Sci. USA 2018, 115, E5334–E5343. [Google Scholar] [CrossRef] [Green Version]
- Godoy, P.M.; Bhakta, N.R.; Barczak, A.J.; Cakmak, H.; Fisher, S.; MacKenzie, T.C.; Patel, T.; Price, R.W.; Smith, J.F.; Woodruff, P.G.; et al. Large Differences in Small RNA Composition Between Human Biofluids. Cell Rep. 2018, 25, 1346–1358. [Google Scholar] [CrossRef] [Green Version]
- Coenen-Stass, A.M.L.; Magen, I.; Brooks, T.; Ben-Dov, I.Z.; Greensmith, L.; Hornstein, E.; Fratta, P. Evaluation of methodologies for microRNA biomarker detection by next generation sequencing. RNA Biol. 2018, 15, 1133–1145. [Google Scholar] [PubMed]
- Howlett, P.J.; Hatch, F.S.; Alexeenko, V.; Jabr, R.I.; Leatham, E.W.; Fry, C.H. Diagnosing Paroxysmal Atrial Fibrillation: Are Biomarkers the Solution to This Elusive Arrhythmia? Biomed Res. Int. 2015, 2015, 910267. [Google Scholar] [CrossRef] [Green Version]
- Sunderland, N.; Skroblin, P.; Barwari, T.; Huntley, R.P.; Lu, R.; Joshi, A.; Lovering, R.C.; Mayr, M. MicroRNA Biomarkers and Platelet Reactivity: The Clot Thickens. Circ. Res. 2017, 120, 418–435. [Google Scholar] [CrossRef] [Green Version]
- Huang, X.; Yuan, T.; Tschannen, M.; Sun, Z.; Jacob, H.; Du, M.; Liang, M.; Dittmar, R.L.; Liu, Y.; Liang, M.; et al. Characterization of human plasma-derived exosomal RNAs by deep sequencing. BMC Genom. 2013, 14, 319. [Google Scholar] [CrossRef] [Green Version]
- Xiang, M.; Zeng, Y.; Yang, R.; Xu, H.; Chen, Z.; Zhong, J.; Xie, H.; Xu, Y.; Zeng, X. U6 is not a suitable endogenous control for the quantification of circulating microRNAs. Biochem. Biophys. Res. Commun. 2014, 454, 210–214. [Google Scholar] [CrossRef]
- Bauriedel, G.; Skowasch, D.; Schneider, M.; Andrié, R.; Jabs, A.; Lüderitz, B. Antiplatelet effects of angiotensin-converting enzyme inhibitors compared with aspirin and clopidogrel: A pilot study with whole-blood aggregometry. Am. Heart J. 2003, 145, 343–348. [Google Scholar] [CrossRef] [PubMed]
- Giacomazzi, A.; Degan, M.; Calabria, S.; Meneguzzi, A.; Minuz, P. Antiplatelet Agents Inhibit the Generation of Platelet-Derived Microparticles. Front. Pharmacol. 2016, 7, 314. [Google Scholar] [CrossRef] [PubMed] [Green Version]
- Taus, F.; Meneguzzi, A.; Castelli, M.; Minuz, P. Platelet-Derived Extracellular Vesicles as Target of Antiplatelet Agents. What Is the Evidence? Front. Pharmacol. 2019, 10, 1256. [Google Scholar] [CrossRef] [PubMed] [Green Version]
- Sun, X.; Belkin, N.; Feinberg, M.W. Endothelial microRNAs and atherosclerosis. Curr. Atheroscler. Rep. 2013, 15, 372. [Google Scholar] [CrossRef] [PubMed]
- Beg, F.; Wang, R.; Saeed, Z.; Devaraj, S.; Masoor, K.; Nakshatri, H. Inflammation-associated microRNA changes in circulating exosomes of heart failure patients. BMC Res. Notes 2017, 10, 751. [Google Scholar] [CrossRef]
- Quan, X.; Ji, Y.; Zhang, C.; Guo, X.; Zhang, Y.; Jia, S.; Ma, W.; Fan, Y.; Wang, C. Circulating MiR-146a May be a Potential Biomarker of Coronary Heart Disease in Patients with Subclinical Hypothyroidism. Cell. Physiol. Biochem. 2018, 45, 226–236. [Google Scholar] [CrossRef]
- Jin, H.; Li, D.Y.; Chernogubova, E.; Sun, C.; Busch, A.; Eken, S.M.; Saliba-Gustafsson, P.; Winter, H.; Winski, G.; Raaz, U.; et al. Local Delivery of miR-21 Stabilizes Fibrous Caps in Vulnerable Atherosclerotic Lesions. Mol. Ther. 2018, 26, 1040–1055. [Google Scholar] [CrossRef] [Green Version]
- Zhang, J.; Xing, Q.; Zhou, X.; Li, J.; Li, Y.; Zhang, L.; Zhou, Q.; Tang, B. Circulating miRNA-21 is a promising biomarker for heart failure. Mol. Med. Rep. 2017, 16, 7766–7774. [Google Scholar] [CrossRef] [Green Version]
- Kumar, D.; Narang, R.; Sreenivas, V.; Rastogi, V.; Bhatia, J.; Saluja, D.; Srivastava, K. Circulatory miR-133b and miR-21 as Novel Biomarkers in Early Prediction and Diagnosis of Coronary Artery Disease. Genes 2020, 11, 164. [Google Scholar] [CrossRef] [Green Version]
- Chen, C.; Wang, Y.; Yang, S.; Li, H.; Zhao, G.; Wang, F.; Yang, L.; Wang, D.W. MiR-320a contributes to atherogenesis by augmenting multiple risk factors and down-regulating SRF. J. Cell Mol. Med. 2015, 19, 970–985. [Google Scholar] [CrossRef] [PubMed]
- Villard, A.; Marchand, L.; Thivolet, C.; Rome, S. Diagnostic Value of Cell-free Circulating MicroRNAs for Obesity and Type 2 Diabetes: A Meta-analysis. J. Mol. Biomark. Diagn. 2015, 6, 1–9. [Google Scholar] [CrossRef] [PubMed] [Green Version]


| Group ID | CONTR | HT | PAF | Total |
|---|---|---|---|---|
| Number of patients | 30 | 30 | 30 | 90 |
| Mean age (SD), years | 47.3 (5.6) | 57.7 (9.5) | 67.6 (10.0) | 57.5 (11.9) |
| Gender (male/female) | 15/15 | 17/13 | 15/15 | 47/43 |
| Type 2 DM presence | 0 | 0 | 5 | 5 |
| Stable CAD presence | 0 | 0 | 7 | 7 |
| HT presence | 0 | 30 | 30 | 60 |
| Left atrial volume, mL, mean (SD) | 49.9 (6.2) | 54 (8.5) | 79.7 (26.2) | 61.2 (20.9) |
| CHA2DS2-Vasc, mean (SD) | 0.00 (0.00) | 1.77 (0.94) | 2.87 (1.31) | 1.54 (1.50) |
| Blood Lipid Profile | ||||
| Total cholesterol, mmol/L, mean (SD) | 4.55 (0.90) | 5.19 (0.98) | 4.85 (1.40) | 4.86 (1.13) |
| Triglycerides, mmol/L, mean (SD) | 1.13 (0.31) | 1.46 (0.50) | 1.52 (0.88) | 1.37 (0.63) |
| LDL cholesterol, mmol/L, mean (SD) | 2.14 (0.56) | 2.69 (0.67) | 2.48 (1.15) | 2.44 (0.85) |
| HDL cholesterol, mmol/L, mean (SD) | 1.86 (0.51) | 1.84 (0.50) | 1.65 (0.52) | 1.78 (0.51) |
| Medication Therapies | ||||
| Beta-blockers | 2 | 15 | 15 | 32 |
| Calcium channel blockers | 0 | 4 | 14 | 18 |
| ACEI | 0 | 12 | 21 | 33 |
| Diuretics | 0 | 4 | 13 | 17 |
| Antiplatelet drugs | 0 | 9 | 3 | 12 |
| Anticoagulants | 0 | 3 | 22 | 25 |
| Statins | 1 | 11 | 13 | 25 |
| Group ID | CONTR | HT | PAF | Total |
|---|---|---|---|---|
| A414 | 0.225 (0.066) | 0.288 (0.076) | 0.259 (0.077) | 0.257 (0.077) |
| ∆(A414-A385) | 0.102 (0.042) | 0.117 (0.053) | 0.111 (0.041) | 0.110 (0.046) |
| HS | 0.122 (0.045) | 0.144 (0.053) | 0.134 (0.044) | 0.134 (0.048) |
| A414/A385 Ratio | 1.86 (0.30) | 1.76 (0.37) | 1.78 (0.24) | 1.80 (0.31) |
| dCq (miR-23a-3p–miR-451a) | 11.10 (0.98) | 11.56 (1.07) | 11.38 (1.01) | 11.34 (1.03) |
| Group Comparison | miRNA | ||||||||
|---|---|---|---|---|---|---|---|---|---|
| miR-146a-5p | miR-150-5p | miR-19a-3p | miR-21-5p | miR-29b-3p | miR-320a-3p | miR-328-3p | miR-375-3p | miR-409-3p | |
| PAF vs. CONTR | 0.012 * up 0.533 | 0.285 | 0.026 * down −0.294 | 0.248 | 0.068 | 0.000 * up 1.195 | 0.248 | 0.454 | 0.248 |
| PAF vs. HT | 0.667 | 0.667 | 0.667 | 0.912 | 0.732 | 0.020 * up 0.977 | 0.667 | 0.667 | 0.986 |
| CONTR vs. HT | 0.075 | 0.636 | 0.376 | 0.376 | 0.608 | 0.382 | 0.690 | 0.608 | 0.388 |
| Type of Analysis | Spearman’s Correlation Analysis | MLR Analysis: CHA2DS2-Vasc ≥ 2 vs. CHA2DS2-Vasc < 2 | ||
|---|---|---|---|---|
| miRNA | Rho Correlation Coefficient | p-Value | log2(Fold Change) | p-Value |
| miR-146a-5p | 0.551 | 1.64 × 10⁻¹¹ | 1.574 | 2.57 × 10⁻⁴ |
| miR-150-5p | 0.238 | 0.007 | 1.395 | 0.972 |
| miR-19a-3p | −0.093 | 0.297 | −0.208 | 0.647 |
| miR-21-5p | 0.521 | 2.88 × 10⁻¹⁰ | 1.585 | 1.56 × 10⁻⁴ |
| miR-29b-3p | 0.243 | 0.006 | 0.716 | 0.846 |
| miR-320a-3p | 0.575 | 1.25 × 10⁻¹² | 1.680 | 1.03 × 10⁻⁵ |
| miR-328-3p | 0.221 | 0.012 | 0.810 | 0.670 |
| miR-375-3p | 0.172 | 0.052 | 1.344 | 0.670 |
| miR-409-3p | 0.138 | 0.121 | 1.131 | 0.972 |
| Assay Name | Assay ID | Mature miRNA Sequence | Type of miRNA |
|---|---|---|---|
| hsa-miR-16-5p | 477860_mir | UAGCAGCACGUAAAUAUUGGCG | Normalization control |
| hsa-miR-23a-3p | 478532_mir | AUCACAUUGCCAGGGAUUUCC | Hemolysis assessment |
| hsa-miR-451a | 478107_mir | AAACCGUUACCAUUACUGAGUU | Hemolysis assessment |
| hsa-miR-146a-5p | 478399_mir | UGAGAACUGAAUUCCAUGGGUU | Candidate for AF |
| hsa-miR-150-5p | 477918_mir | UCUCCCAACCCUUGUACCAGUG | Candidate for AF |
| hsa-miR-19a-3p | 479228_mir | UGUGCAAAUCUAUGCAAAACUGA | Candidate for AF |
| hsa-miR-21-5p | 477975_mir | UAGCUUAUCAGACUGAUGUUGA | Candidate for AF |
| hsa-miR-29b-3p | 478369_mir | UAGCACCAUUUGAAAUCAGUGUU | Candidate for AF |
| hsa-miR-320a-3p | 478594_mir | AAAAGCUGGGUUGAGAGGGCGA | Candidate for AF |
| hsa-miR-328-3p | 478026_mir | CUGGCCCUCUCUGCCCUUCCGU | Candidate for AF |
| hsa-miR-375-3p | 478074_mir | UUUGUUCGUUCGGCUCGCGUGA | Candidate for AF |
| hsa-miR-409-3p | 478084_mir | GAAUGUUGCUCGGUGAACCCCU | Candidate for AF |
| hsa-miR-432-5p | 478101_mir | UCUUGGAGUAGGUCAUUGGGUGG | Candidate for AF |
© 2020 by the authors. Licensee MDPI, Basel, Switzerland. This article is an open access article distributed under the terms and conditions of the Creative Commons Attribution (CC BY) license (http://creativecommons.org/licenses/by/4.0/).
Share and Cite
Zhelankin, A.V.; Vasiliev, S.V.; Stonogina, D.A.; Babalyan, K.A.; Sharova, E.I.; Doludin, Y.V.; Shchekochikhin, D.Y.; Generozov, E.V.; Akselrod, A.S. Elevated Plasma Levels of Circulating Extracellular miR-320a-3p in Patients with Paroxysmal Atrial Fibrillation. Int. J. Mol. Sci. 2020, 21, 3485. https://doi.org/10.3390/ijms21103485
Zhelankin AV, Vasiliev SV, Stonogina DA, Babalyan KA, Sharova EI, Doludin YV, Shchekochikhin DY, Generozov EV, Akselrod AS. Elevated Plasma Levels of Circulating Extracellular miR-320a-3p in Patients with Paroxysmal Atrial Fibrillation. International Journal of Molecular Sciences. 2020; 21(10):3485. https://doi.org/10.3390/ijms21103485
Chicago/Turabian StyleZhelankin, Andrey V., Sergey V. Vasiliev, Daria A. Stonogina, Konstantin A. Babalyan, Elena I. Sharova, Yurii V. Doludin, Dmitry Y. Shchekochikhin, Eduard V. Generozov, and Anna S. Akselrod. 2020. "Elevated Plasma Levels of Circulating Extracellular miR-320a-3p in Patients with Paroxysmal Atrial Fibrillation" International Journal of Molecular Sciences 21, no. 10: 3485. https://doi.org/10.3390/ijms21103485