Novel Missense CACNA1G Mutations Associated with Infantile-Onset Developmental and Epileptic Encephalopathy

 ,
,  and
and
Abstract
:
1. Introduction
2. Results
2.1. Patients with CACNA1G Mutations
2.2. Biophysical Characterization of Cav3.1 Channel Variants
3. Discussion
4. Materials and Methods
4.1. Patients
4.2. Cav3.1 Channel Clones, Mutagenesis, and Tools for Bioinformatics
- L208P-forward (f), CTGCTGGATACGCCGCCCATGCTGGGC;
- L208P-revers (r), GCCCAGCATGGGCGGCGTATCCAGCAG;
- L909F-f, GGAAGAATTTTGACTCCTTCCTCTGGGCCATCG;
- L909F-r, CGATGGCCCAGAGGAAGGAGTCAAAATTCTTCC;
- M1508V-f, CCTTCTTTGTCCTGAACGTGTTTGTGGGTGTGGTG;
- and M1508V-r, CACCACACCCACAAACACGTTCAGGACAAAGAAGG.
4.3. Heterologous Expression of Cav3.1 Channel Variants and Electrophysiology
4.4. Curve Fitting and Statistical Analysis
Supplementary Materials
Author Contributions
Funding
Acknowledgments
Conflicts of Interest
References
- Singh, B.; Monteil, A.; Bidaud, I.; Sugimoto, Y.; Suzuki, T.; Hamano, S.; Oguni, H.; Osawa, M.; Alonso, M.E.; Delgado-Escueta, A.V.; et al. Mutational analysis of cacna1g in idiopathic generalized epilepsy. Mutation in brief #962. Online. Hum. Mutat 2007, 28, 524–525. [Google Scholar] [PubMed]
- Morino, H.; Matsuda, Y.; Muguruma, K.; Miyamoto, R.; Ohsawa, R.; Ohtake, T.; Otobe, R.; Watanabe, M.; Maruyama, H.; Hashimoto, K.; et al. A mutation in the low voltage-gated calcium channel cacna1g alters the physiological properties of the channel, causing spinocerebellar ataxia. Mol. Brain 2015, 8, 89. [Google Scholar] [CrossRef] [Green Version]
- Coutelier, M.; Blesneac, I.; Monteil, A.; Monin, M.L.; Ando, K.; Mundwiller, E.; Brusco, A.; Le Ber, I.; Anheim, M.; Castrioto, A.; et al. A recurrent mutation in cacna1g alters cav3.1 t-type calcium-channel conduction and causes autosomal-dominant cerebellar ataxia. Am. J. Hum. Genet. 2015, 97, 726–737. [Google Scholar] [CrossRef] [Green Version]
- Li, X.; Zhou, C.; Cui, L.; Zhu, L.; Du, H.; Liu, J.; Wang, C.; Fang, S. A case of a novel cacna1g mutation from a chinese family with sca42: A case report and literature review. Medicine (Baltimore) 2018, 97, e12148. [Google Scholar] [CrossRef]
- Klockgether, T. Update on degenerative ataxias. Curr. Opin. Neurol. 2011, 24, 339–345. [Google Scholar] [CrossRef]
- Chemin, J.; Siquier-Pernet, K.; Nicouleau, M.; Barcia, G.; Ahmad, A.; Medina-Cano, D.; Hanein, S.; Altin, N.; Hubert, L.; Bole-Feysot, C.; et al. De novo mutation screening in childhood-onset cerebellar atrophy identifies gain-of-function mutations in the cacna1g calcium channel gene. Brain 2018, 141, 1998–2013. [Google Scholar] [CrossRef] [PubMed] [Green Version]
- Talley, E.M.; Cribbs, L.L.; Lee, J.H.; Daud, A.; Perez-Reyes, E.; Bayliss, D.A. Differential distribution of three members of a gene family encoding low voltage-activated (t-type) calcium channels. J. Neurosci. 1999, 19, 1895–1911. [Google Scholar] [CrossRef]
- Coulter, D.A.; Huguenard, J.R.; Prince, D.A. Calcium currents in rat thalamocortical relay neurones: Kinetic properties of the transient, low-threshold current. J. Physiol. 1989, 414, 587–604. [Google Scholar] [CrossRef]
- Engbers, J.D.; Anderson, D.; Zamponi, G.W.; Turner, R.W. Signal processing by t-type calcium channel interactions in the cerebellum. Front. Cell Neurosci. 2013, 7, 230. [Google Scholar] [CrossRef] [Green Version]
- Perez-Reyes, E. Molecular physiology of low-voltage-activated t-type calcium channels. Physiol. Rev. 2003, 83, 117–161. [Google Scholar] [CrossRef] [Green Version]
- Huguenard, J.R. Low-threshold calcium currents in central nervous system neurons. Annu. Rev. Physiol. 1996, 58, 329–348. [Google Scholar] [CrossRef] [PubMed]
- Leresche, N.; Lambert, R.C. T-type calcium channels in synaptic plasticity. Channels (Austin) 2017, 11, 121–139. [Google Scholar] [CrossRef] [PubMed] [Green Version]
- Molineux, M.L.; McRory, J.E.; McKay, B.E.; Hamid, J.; Mehaffey, W.H.; Rehak, R.; Snutch, T.P.; Zamponi, G.W.; Turner, R.W. Specific t-type calcium channel isoforms are associated with distinct burst phenotypes in deep cerebellar nuclear neurons. Proc. Natl. Acad. Sci. USA 2006, 103, 5555–5560. [Google Scholar] [CrossRef] [PubMed] [Green Version]
- Zamponi, G.W. Targeting voltage-gated calcium channels in neurological and psychiatric diseases. Nat. Rev. Drug Discov. 2016, 15, 19–34. [Google Scholar] [CrossRef]
- Ware, T.L.; Huskins, S.R.; Grinton, B.E.; Liu, Y.C.; Bennett, M.F.; Harvey, M.; McMahon, J.; Andreopoulos-Malikotsinas, D.; Bahlo, M.; Howell, K.B.; et al. Epidemiology and etiology of infantile developmental and epileptic encephalopathies in tasmania. Epilepsia Open 2019, 4, 504–510. [Google Scholar] [CrossRef]
- Wu, J.; Yan, Z.; Li, Z.; Yan, C.; Lu, S.; Dong, M.; Yan, N. Structure of the voltage-gated calcium channel cav1.1 complex. Science 2015, 350, aad2395. [Google Scholar] [CrossRef]
- Stephens, R.F.; Guan, W.; Zhorov, B.S.; Spafford, J.D. Selectivity filters and cysteine-rich extracellular loops in voltage-gated sodium, calcium, and nalcn channels. Front. Physiol. 2015, 6, 153. [Google Scholar] [CrossRef] [Green Version]
- Sailer, A.; Houlden, H. Recent advances in the genetics of cerebellar ataxias. Curr. Neurol. Neurosci. Rep. 2012, 12, 227–236. [Google Scholar] [CrossRef]
- Weiss, N.; Zamponi, G.W. Genetic t-type calcium channelopathies. J. Med Genet. 2020, 57, 1–10. [Google Scholar] [CrossRef] [Green Version]
- Epi, K.C.; Epilepsy Phenome/Genome, P.; Allen, A.S.; Berkovic, S.F.; Cossette, P.; Delanty, N.; Dlugos, D.; Eichler, E.E.; Epstein, M.P.; Glauser, T.; et al. De novo mutations in epileptic encephalopathies. Nature 2013, 501, 217–221. [Google Scholar]
- Stessman, H.A.; Xiong, B.; Coe, B.P.; Wang, T.; Hoekzema, K.; Fenckova, M.; Kvarnung, M.; Gerdts, J.; Trinh, S.; Cosemans, N.; et al. Targeted sequencing identifies 91 neurodevelopmental-disorder risk genes with autism and developmental-disability biases. Nat. Genet. 2017, 49, 515–526. [Google Scholar] [CrossRef] [PubMed]
- Carvill, G.L.; Heavin, S.B.; Yendle, S.C.; McMahon, J.M.; O’Roak, B.J.; Cook, J.; Khan, A.; Dorschner, M.O.; Weaver, M.; Calvert, S.; et al. Targeted resequencing in epileptic encephalopathies identifies de novo mutations in chd2 and syngap1. Nat. Genet. 2013, 45, 825–830. [Google Scholar] [CrossRef] [PubMed] [Green Version]
- Moller, R.S.; Larsen, L.H.; Johannesen, K.M.; Talvik, I.; Talvik, T.; Vaher, U.; Miranda, M.J.; Farooq, M.; Nielsen, J.E.; Svendsen, L.L.; et al. Gene panel testing in epileptic encephalopathies and familial epilepsies. Mol. Syndr. 2016, 7, 210–219. [Google Scholar] [CrossRef] [PubMed] [Green Version]
- Bushart, D.D.; Shakkottai, V.G. Ion channel dysfunction in cerebellar ataxia. Neurosci. Lett. 2019, 688, 41–48. [Google Scholar] [CrossRef] [PubMed]
- Sudhakar, S.K.; Torben-Nielsen, B.; De Schutter, E. Cerebellar nuclear neurons use time and rate coding to transmit purkinje neuron pauses. PLoS Comput. Biol. 2015, 11, e1004641. [Google Scholar] [CrossRef]
- Berecki, G.; Howell, K.B.; Deerasooriya, Y.H.; Cilio, M.R.; Oliva, M.K.; Kaplan, D.; Scheffer, I.E.; Berkovic, S.F.; Petrou, S. Dynamic action potential clamp predicts functional separation in mild familial and severe de novo forms of scn2a epilepsy. Proc. Natl. Acad. Sci. USA 2018, 115, E5516–E5525. [Google Scholar] [CrossRef] [Green Version]
- Yunker, A.M.; Sharp, A.H.; Sundarraj, S.; Ranganathan, V.; Copeland, T.D.; McEnery, M.W. Immunological characterization of t-type voltage-dependent calcium channel cav3.1 (alpha 1g) and cav3.3 (alpha 1i) isoforms reveal differences in their localization, expression, and neural development. Neuroscience 2003, 117, 321–335. [Google Scholar] [CrossRef]
- Aguado, C.; Garcia-Madrona, S.; Gil-Minguez, M.; Lujan, R. Ontogenic changes and differential localization of t-type ca(2+) channel subunits cav3.1 and cav3.2 in mouse hippocampus and cerebellum. Front. Neuroanat. 2016, 10, 83. [Google Scholar] [CrossRef] [Green Version]
- Chemin, J.; Monteil, A.; Bourinet, E.; Nargeot, J.; Lory, P. Alternatively spliced alpha(1g) (ca(v)3.1) intracellular loops promote specific t-type ca(2+) channel gating properties. Biophys J. 2001, 80, 1238–1250. [Google Scholar] [CrossRef] [Green Version]
- Latour, I.; Louw, D.F.; Beedle, A.M.; Hamid, J.; Sutherland, G.R.; Zamponi, G.W. Expression of t-type calcium channel splice variants in human glioma. Glia 2004, 48, 112–119. [Google Scholar] [CrossRef]
- Shcheglovitov, A.; Vitko, I.; Bidaud, I.; Baumgart, J.P.; Navarro-Gonzalez, M.F.; Grayson, T.H.; Lory, P.; Hill, C.E.; Perez-Reyes, E. Alternative splicing within the i-ii loop controls surface expression of t-type ca(v)3.1 calcium channels. FEBS Lett. 2008, 582, 3765–3770. [Google Scholar] [CrossRef] [PubMed] [Green Version]
- Hildebrand, M.E.; Isope, P.; Miyazaki, T.; Nakaya, T.; Garcia, E.; Feltz, A.; Schneider, T.; Hescheler, J.; Kano, M.; Sakimura, K.; et al. Functional coupling between mglur1 and cav3.1 t-type calcium channels contributes to parallel fiber-induced fast calcium signaling within purkinje cell dendritic spines. J. Neurosci. 2009, 29, 9668–9682. [Google Scholar] [CrossRef] [PubMed] [Green Version]
- Kim, D.; Song, I.; Keum, S.; Lee, T.; Jeong, M.J.; Kim, S.S.; McEnery, M.W.; Shin, H.S. Lack of the burst firing of thalamocortical relay neurons and resistance to absence seizures in mice lacking alpha(1g) t-type ca(2+) channels. Neuron 2001, 31, 35–45. [Google Scholar] [CrossRef] [Green Version]
- Song, I.; Kim, D.; Choi, S.; Sun, M.; Kim, Y.; Shin, H.S. Role of the alpha1g t-type calcium channel in spontaneous absence seizures in mutant mice. J. Neurosci. 2004, 24, 5249–5257. [Google Scholar] [CrossRef] [PubMed]
- Chang, K.Y.; Park, Y.G.; Park, H.Y.; Homanics, G.E.; Kim, J.; Kim, D. Lack of cav3.1 channels causes severe motor coordination defects and an age-dependent cerebellar atrophy in a genetic model of essential tremor. Biochem. Biophys. Res. Commun. 2011, 410, 19–23. [Google Scholar] [CrossRef]
- Calhoun, J.D.; Hawkins, N.A.; Zachwieja, N.J.; Kearney, J.A. Cacna1g is a genetic modifier of epilepsy caused by mutation of voltage-gated sodium channel scn2a. Epilepsia 2016, 57, e103–e107. [Google Scholar] [CrossRef] [Green Version]
- Calhoun, J.D.; Hawkins, N.A.; Zachwieja, N.J.; Kearney, J.A. Cacna1g is a genetic modifier of epilepsy in a mouse model of dravet syndrome. Epilepsia 2017, 58, e111–e115. [Google Scholar] [CrossRef] [Green Version]
- Mesirca, P.; Torrente, A.G.; Mangoni, M.E. Functional role of voltage gated ca(2+) channels in heart automaticity. Front. Physiol. 2015, 6, 19. [Google Scholar] [CrossRef] [Green Version]
- Mangoni, M.E.; Traboulsie, A.; Leoni, A.L.; Couette, B.; Marger, L.; Le Quang, K.; Kupfer, E.; Cohen-Solal, A.; Vilar, J.; Shin, H.S.; et al. Bradycardia and slowing of the atrioventricular conduction in mice lacking cav3.1/alpha1g t-type calcium channels. Circ. Res. 2006, 98, 1422–1430. [Google Scholar] [CrossRef] [Green Version]
- Chandler, N.J.; Greener, I.D.; Tellez, J.O.; Inada, S.; Musa, H.; Molenaar, P.; Difrancesco, D.; Baruscotti, M.; Longhi, R.; Anderson, R.H.; et al. Molecular architecture of the human sinus node: Insights into the function of the cardiac pacemaker. Circulation 2009, 119, 1562–1575. [Google Scholar] [CrossRef] [Green Version]
- Ono, K.; Iijima, T. Cardiac t-type ca(2+) channels in the heart. J. Mol. Cell Cardiol. 2010, 48, 65–70. [Google Scholar] [CrossRef] [PubMed]
- Sobreira, N.; Schiettecatte, F.; Valle, D.; Hamosh, A. Genematcher: A matching tool for connecting investigators with an interest in the same gene. Hum. Mutat. 2015, 36, 928–930. [Google Scholar] [CrossRef] [PubMed] [Green Version]
- Retterer, K.; Juusola, J.; Cho, M.T.; Vitazka, P.; Millan, F.; Gibellini, F.; Vertino-Bell, A.; Smaoui, N.; Neidich, J.; Monaghan, K.G.; et al. Clinical application of whole-exome sequencing across clinical indications. Genet. Med. 2016, 18, 696–704. [Google Scholar] [CrossRef] [PubMed] [Green Version]
- Monteil, A.; Chemin, J.; Bourinet, E.; Mennessier, G.; Lory, P.; Nargeot, J. Molecular and functional properties of the human alpha(1g) subunit that forms t-type calcium channels. J. Biol. Chem. 2000, 275, 6090–6100. [Google Scholar] [CrossRef] [PubMed] [Green Version]
- Berecki, G.; McArthur, J.R.; Cuny, H.; Clark, R.J.; Adams, D.J. Differential cav2.1 and cav2.3 channel inhibition by baclofen and alpha-conotoxin vc1.1 via gabab receptor activation. J. Gen. Physiol. 2014, 143, 465–479. [Google Scholar] [CrossRef] [Green Version]
- Berecki, G.; Motin, L.; Adams, D.J. Mechanism of direct cav2.2 channel block by the kappa-opioid receptor agonist u50488h. Neuropharmacology 2016, 109, 49–58. [Google Scholar] [CrossRef]


| Variant \\ Biophysical Property | Wild-Type | L208P | L909F | M1508V |
|---|---|---|---|---|
| Current density (pA/pF) n | 206.9 ± 36.2 (15) 15 | 180.5 ± 37.4 (13) 13 | 275.2 ± 40.8 (15) 15 | 261.5 ± 46.9 (9) 9 |
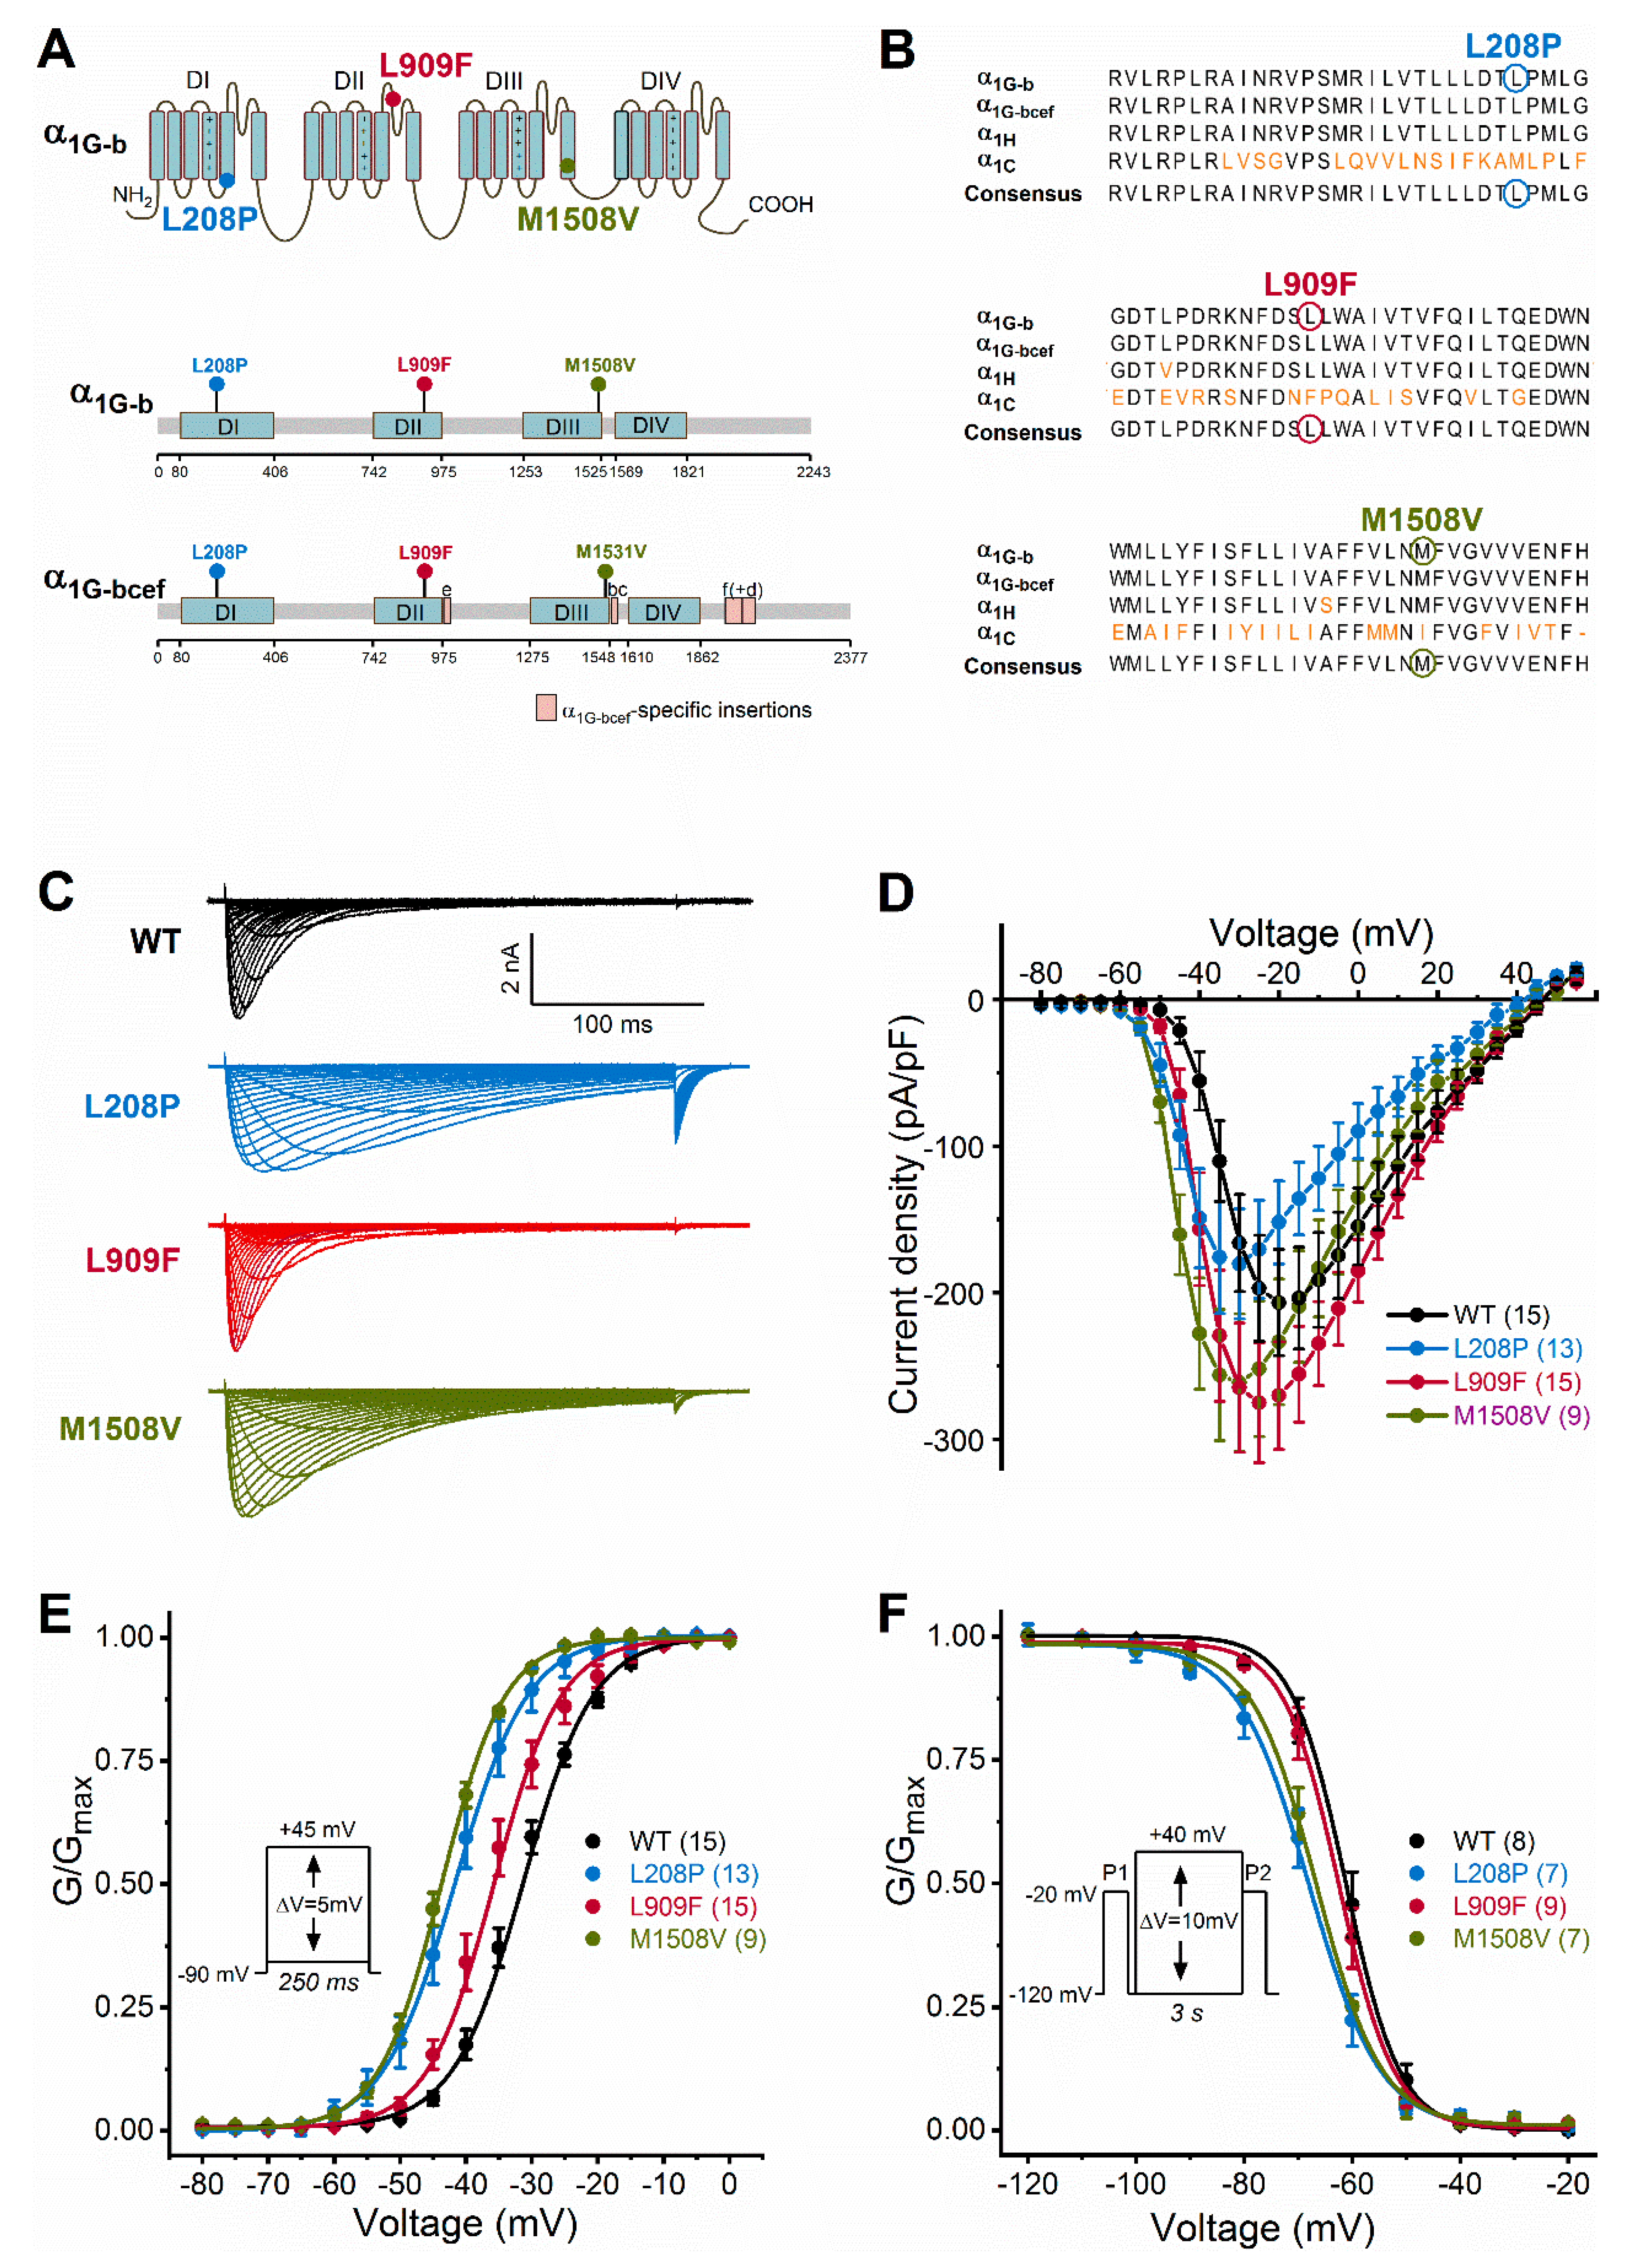
| Activation V0.5,act (mV) kact (mV) n | −31.27 ± 0.44 5.33 ± 0.21 15 | −41.66 ± 0.50 **** 5.56 ± 0.31 13 | −35.72 ± 0.60 ****5.04 ± 0.2515 | −43.68 ± 0.12 **** 4.81 ± 0.11 9 |
| Inactivation V0.5,inact (mV) kinact (mV) n | −61.18 ± 1.01 5.84 ± 0.42 8 | −67.93 ± 0.47 **** 6.50 ± 0.41 7 | −62.43 ± 0.24 6.01 ± 0.31 9 | −66.63 ± 0.33 **** 6.27 ± 0.29 7 |
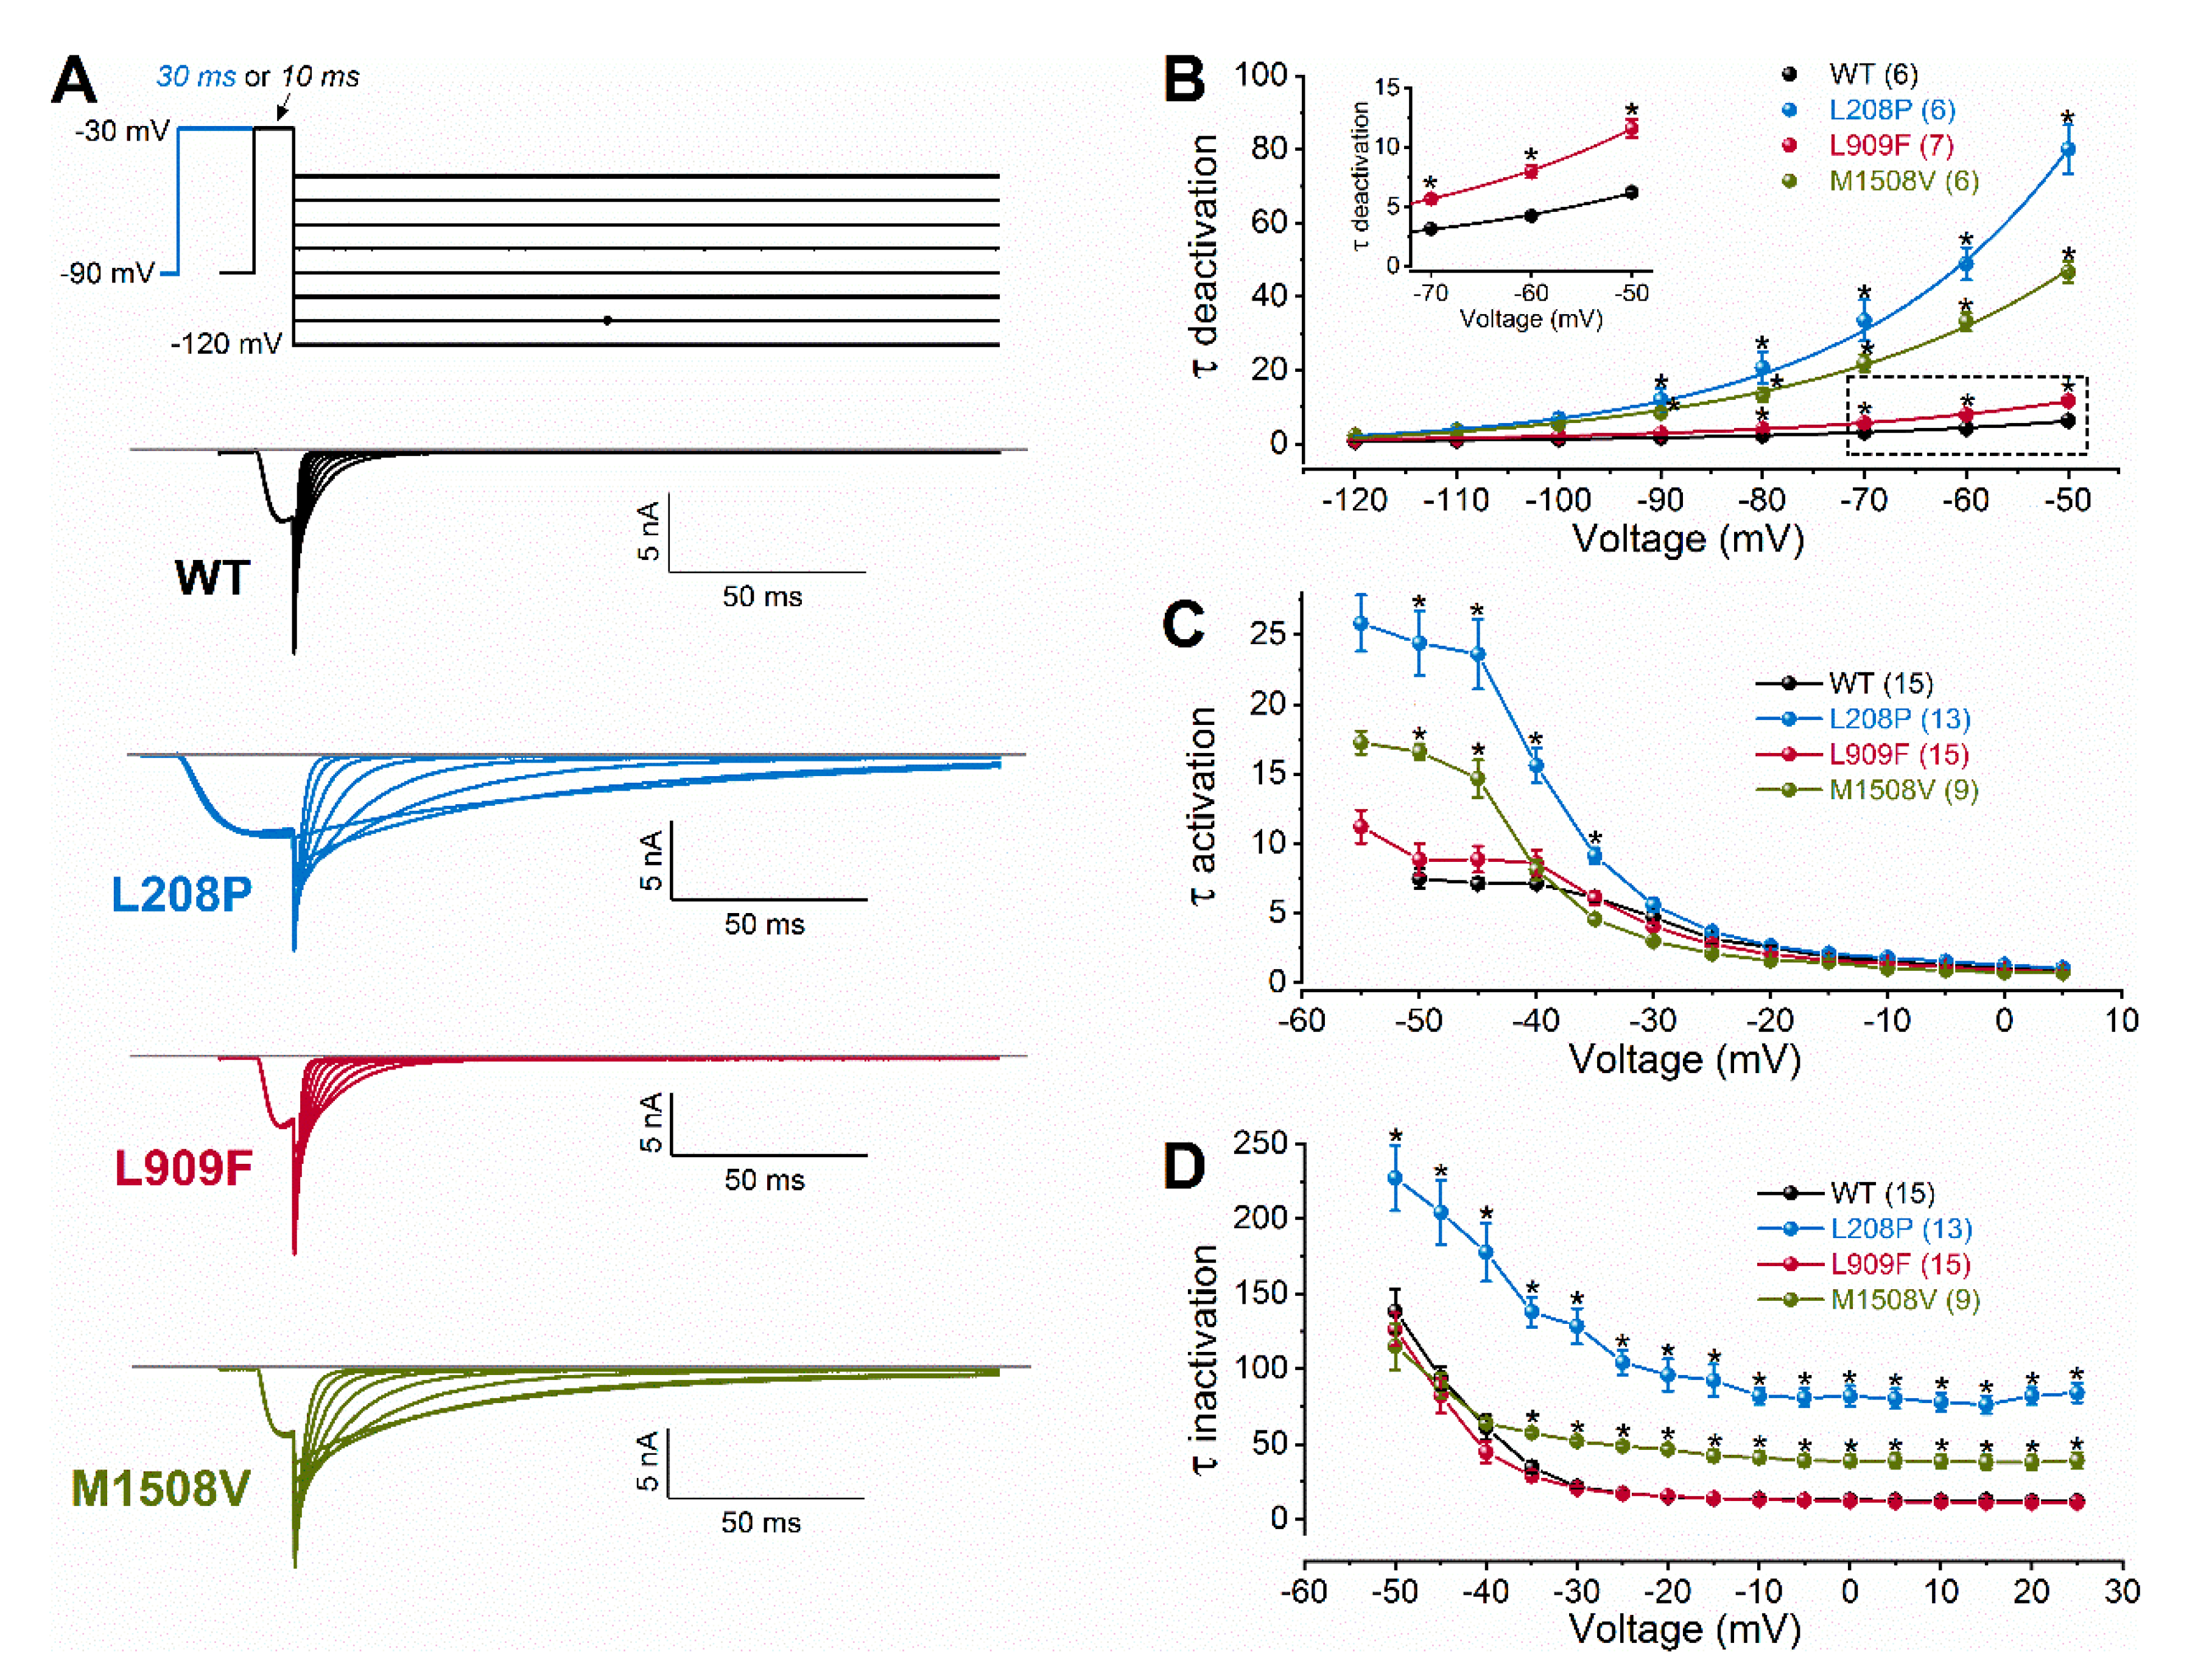
| Activation kinetics τ at −50 mV (ms) τ at −30 mV (ms) n | 7.49 ± 0.73 4.72 ± 0.35 15 | 24.40 ± 2.35 **** 5.60 ± 0.44 13 | 8.84 ± 1.14 4.03 ± 0.28 15 | 16.58 ± 0.58 **** 2.99 ± 0.16 9 |
| Inactivation kinetics τ at −50 mV (ms) τ at −10 mV (ms) n | 138.49 ± 14.62 13.56 ± 0.58 15 | 227.32 ± 22.0 **** 81.90 ± 5.4 **** 13 | 126.20 ± 11.0 13.07 ± 0.59 15 | 114.91 ± 15.6 41.16 ± 3.8 ** 9 |
| Deactivation kineticsτ at −70 mV (ms)τ at −50 mV (ms)n | 3.11 ± 0.10 6.21 ± 0.27 6 | 33.55 ± 5.54 **** 80.04 ± 6.58 **** 6 | 5.66 ± 0.35 **** 11.6 ± 0.76 **** 7 | 21.91 ± 2.30 ** 46.72 ± 2.80 **** 6 |
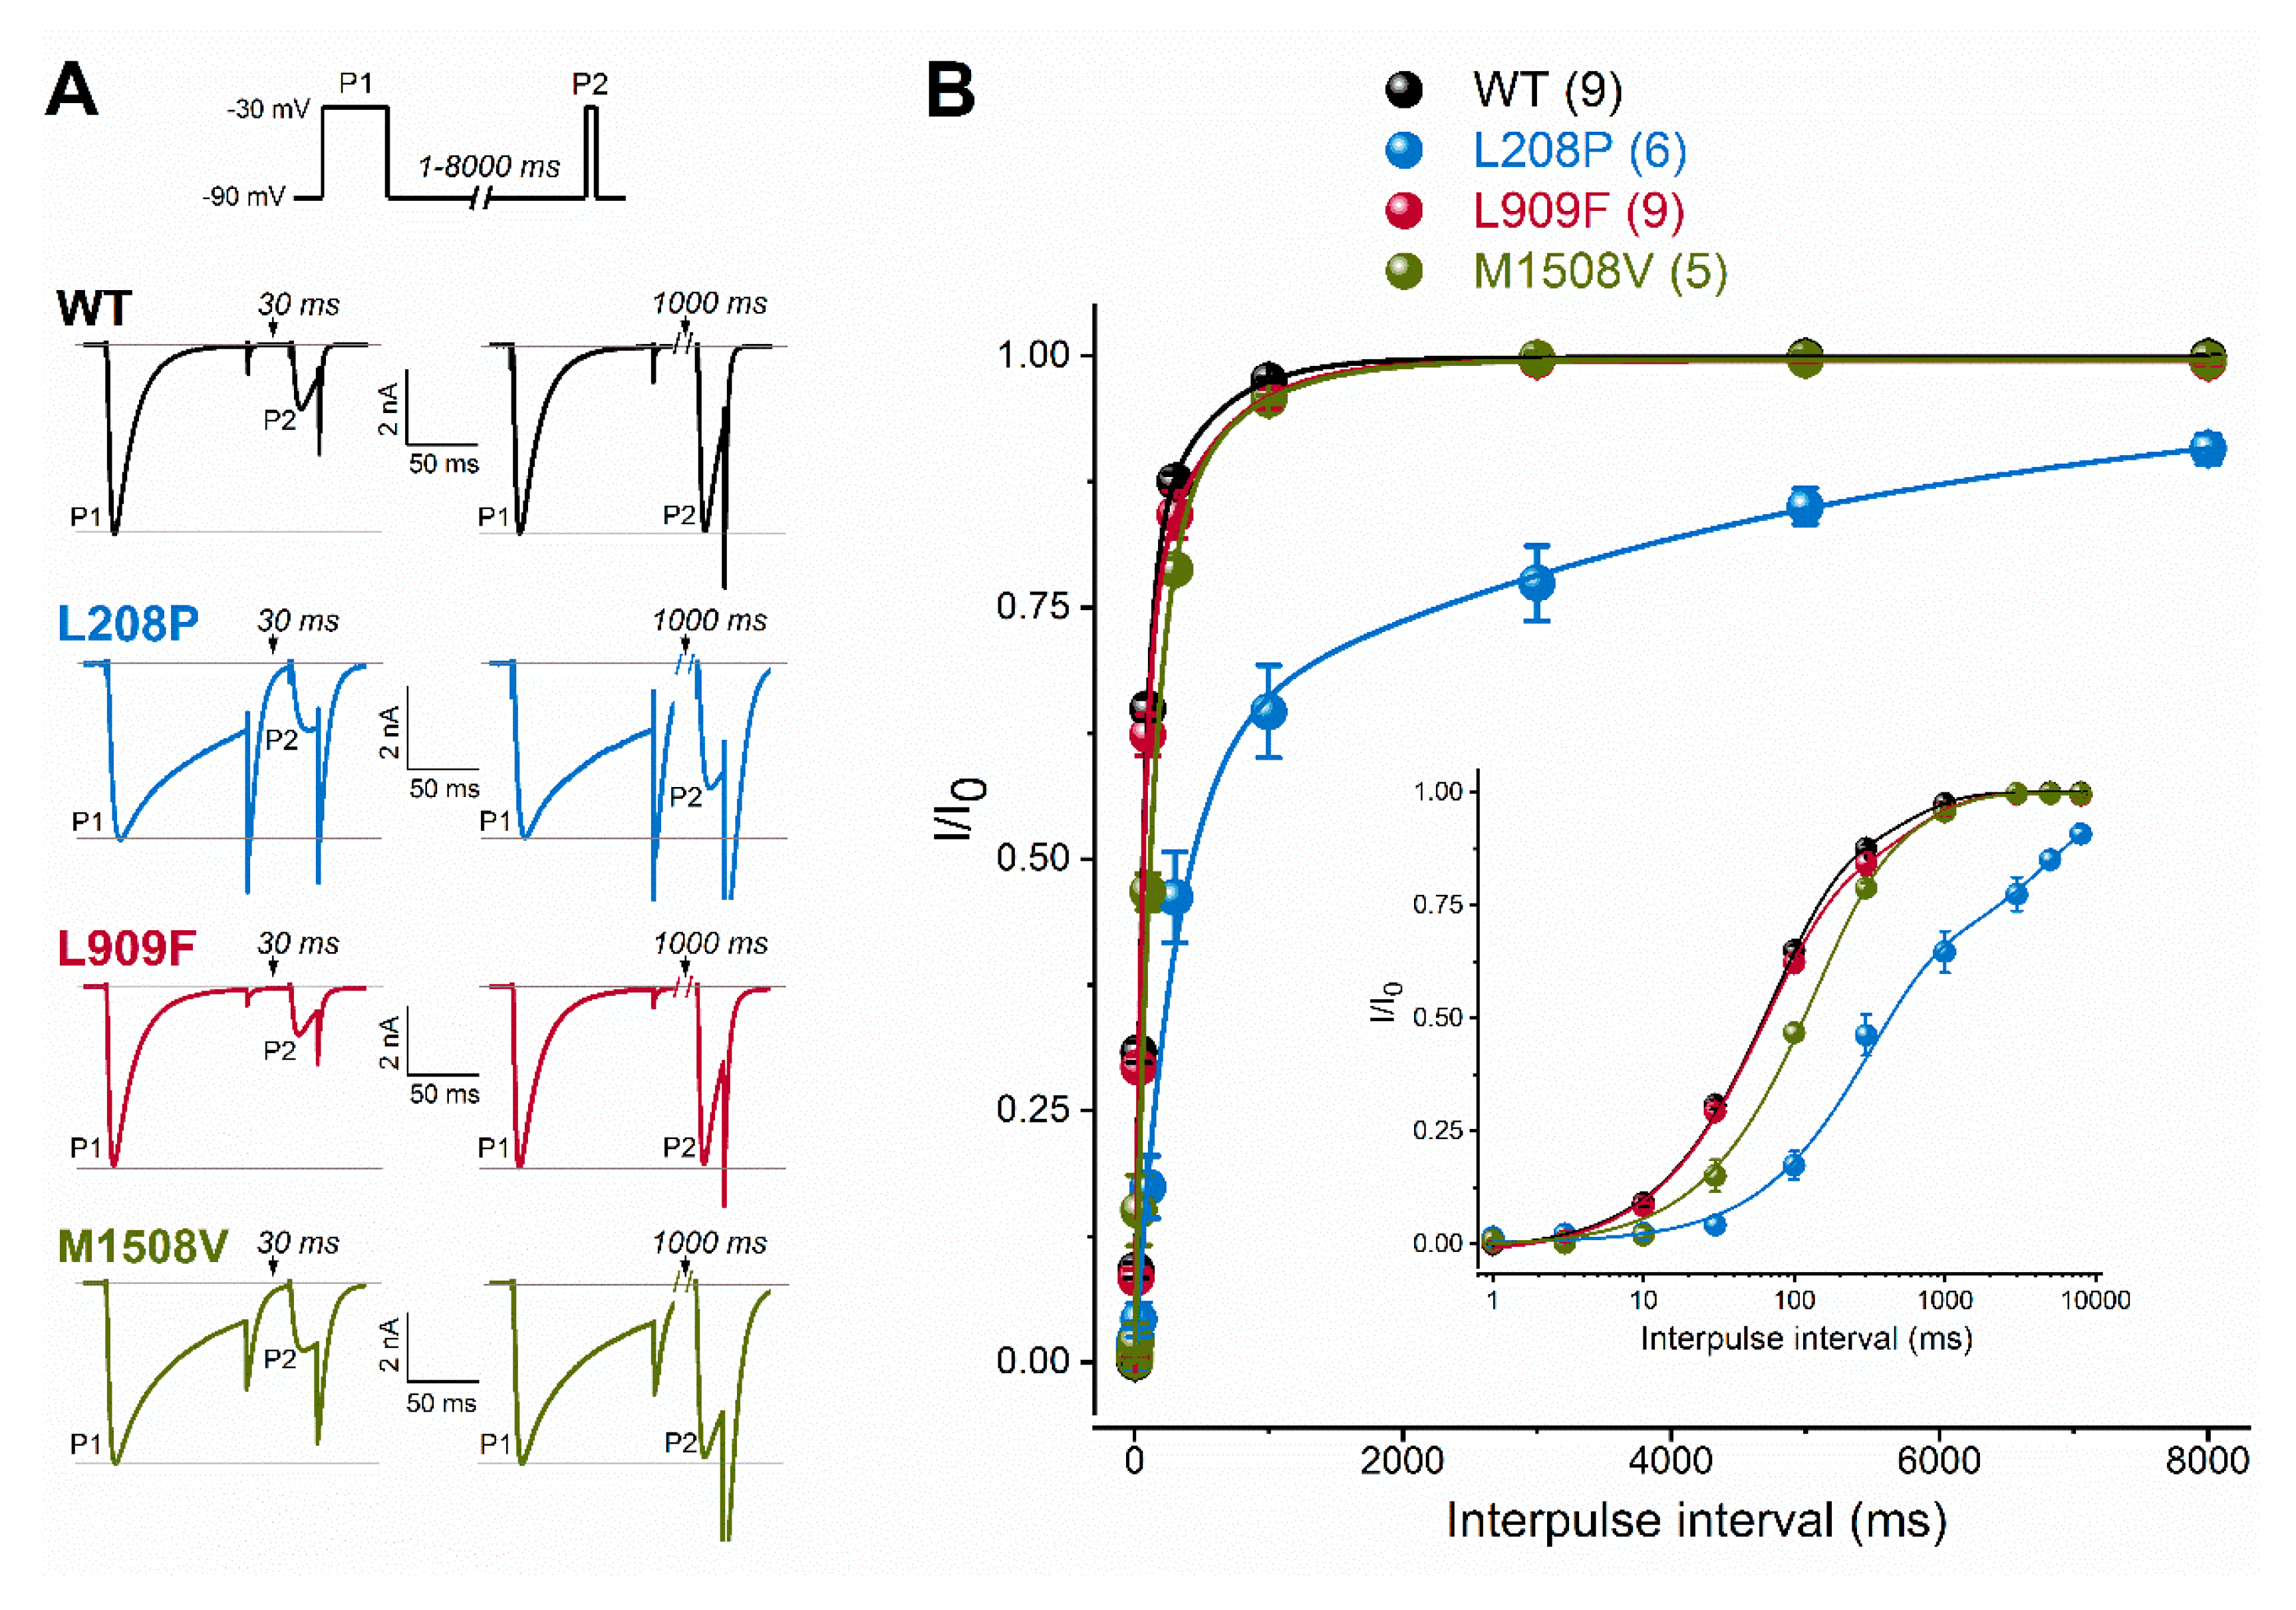
| Recovery§ τf (ms) Af (ms) τs (ms) As (ms) n | 66.52 ± 8.7 0.79 ± 0.07 450.03 ± 117.6 0.21 ± 0.07 9 | 299.82 ± 70.6 **** 0.61 ± 0.09 4904.4 ± 1608 *** 0.36 ± 0.06 6 | 61.05 ± 5.0 0.74 ± 0.04 492.28 ± 109.8 0.27 ± 0.04 9 | 112.18 ± 18.5 0.76 ± 0.12 534.03 ± 236 0.26 ± 0.13 5 |
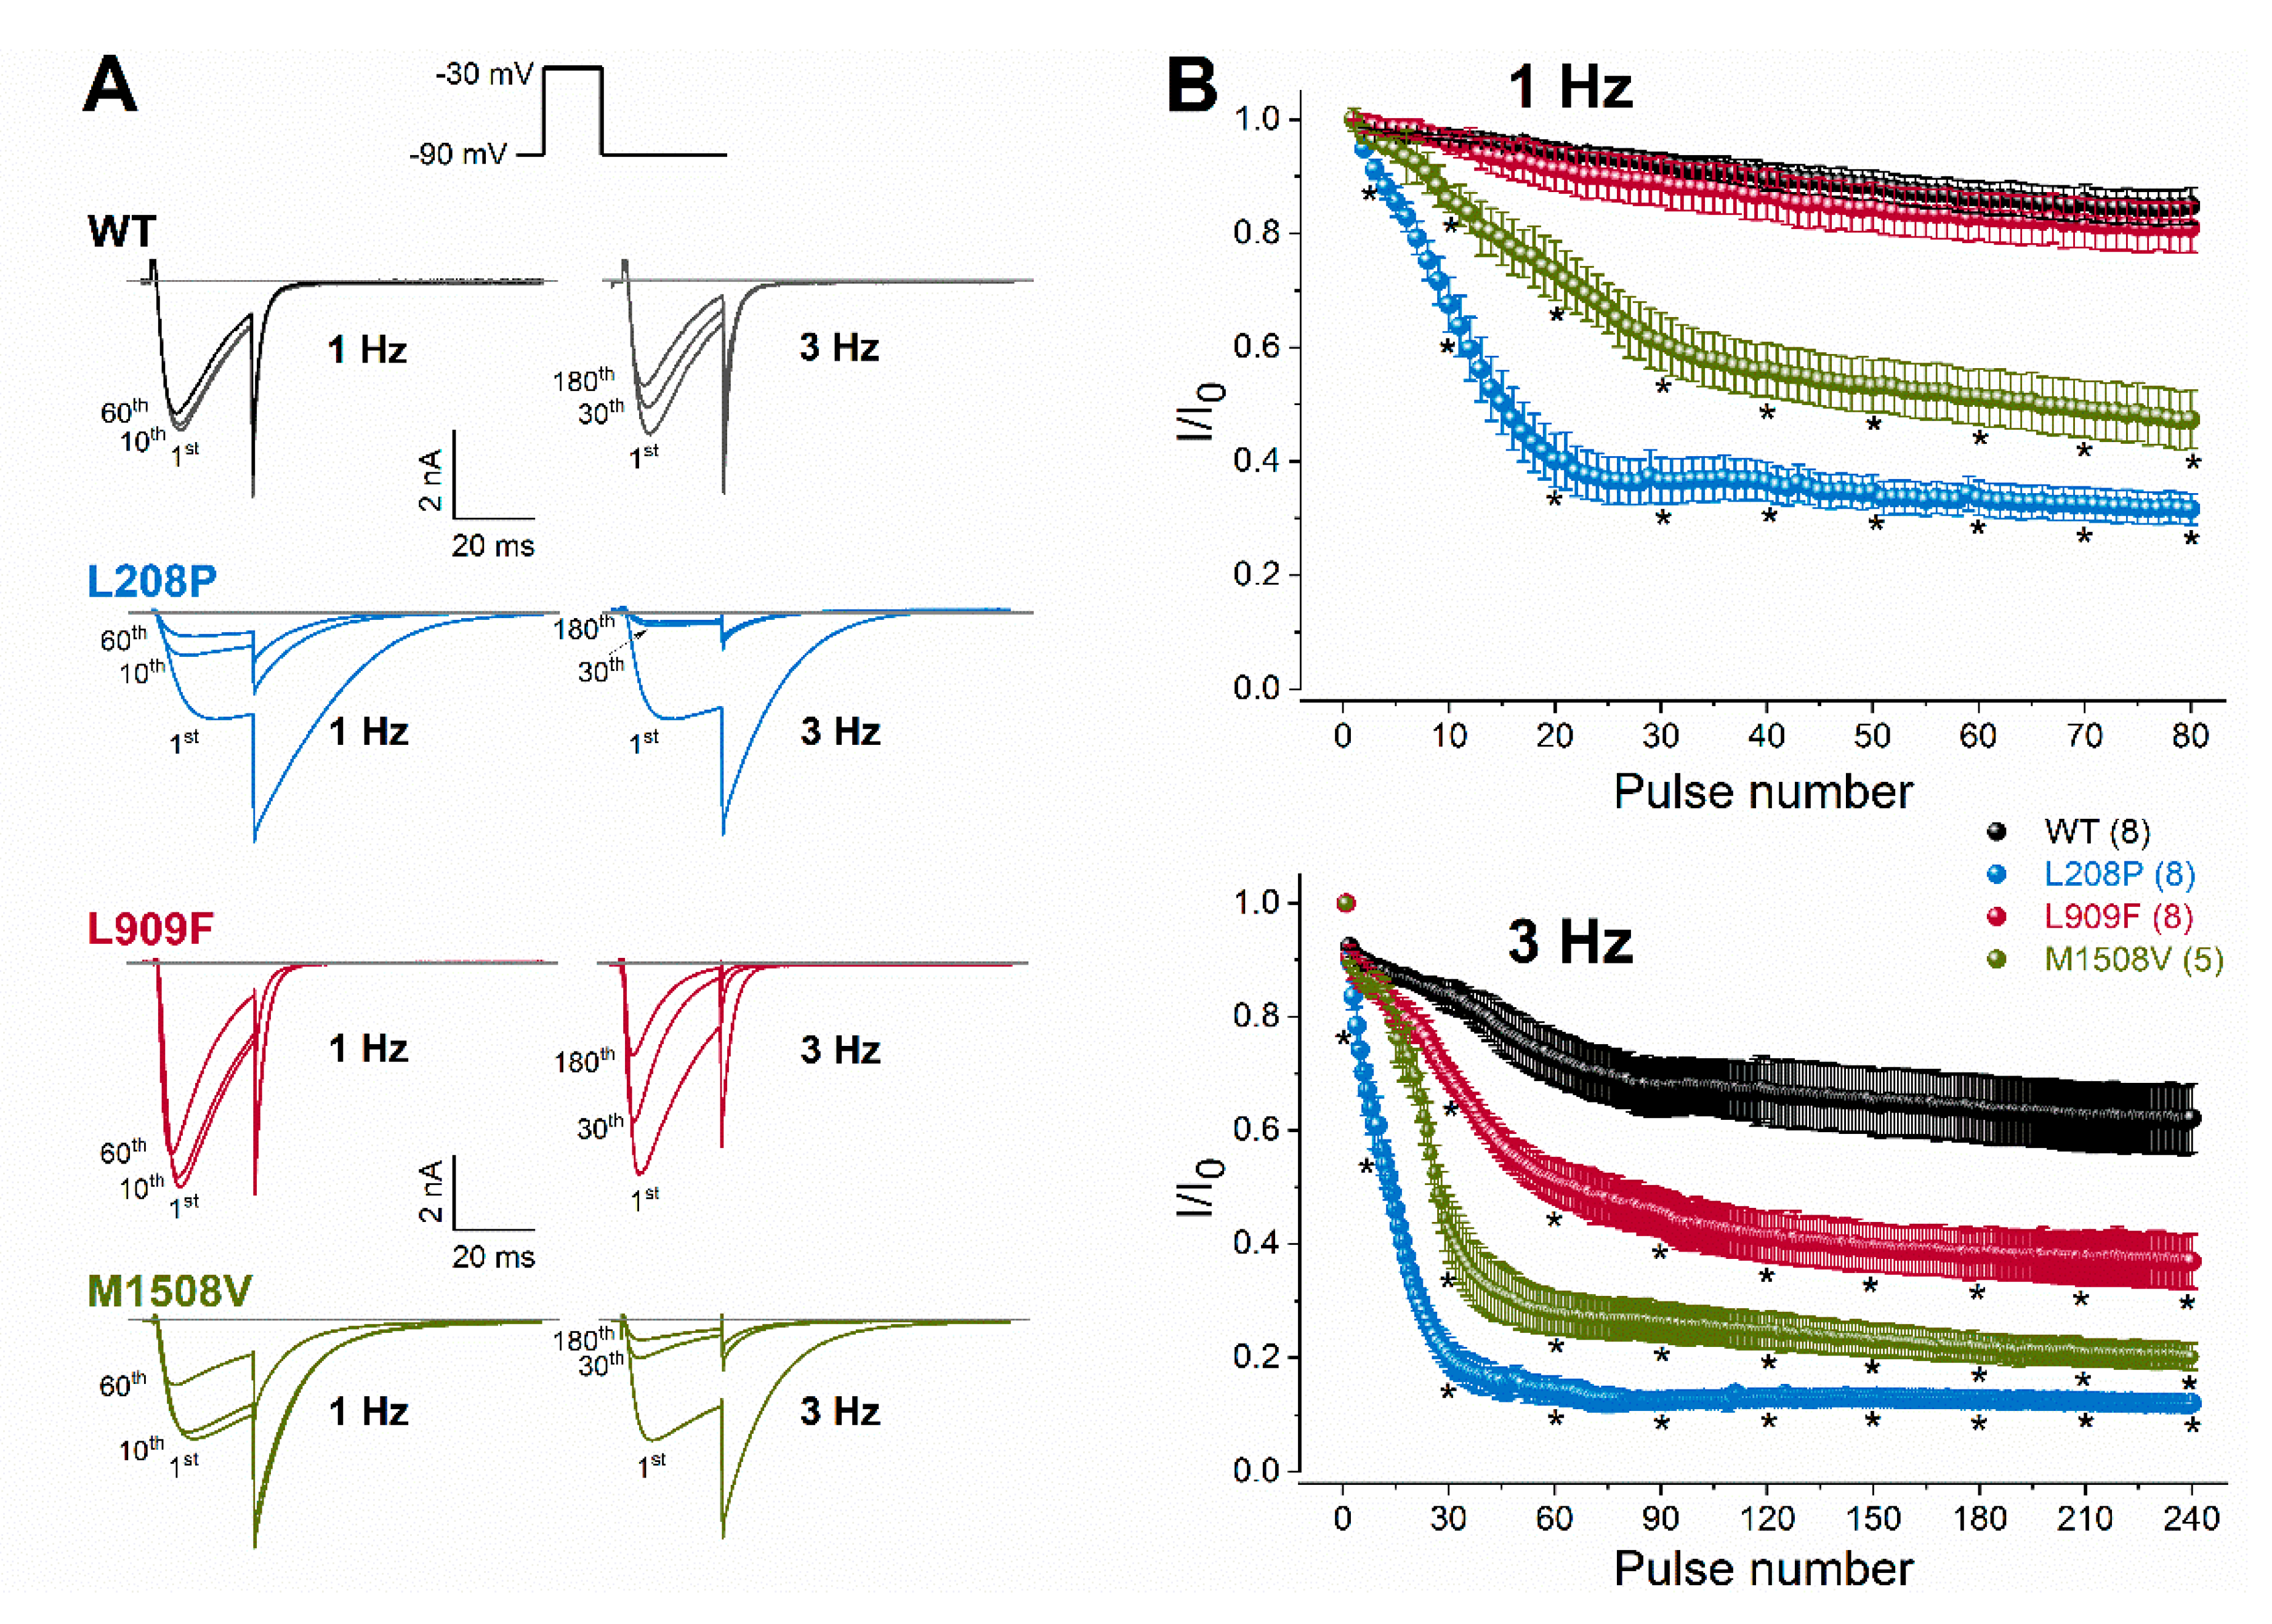
| Current availability 1 Hz, 10th stimulus (%)− 1 Hz, 60th stimulus (%)− 3 Hz, 30th stimulus (%)− 3 Hz, 180th stimulus (%)− n | 0.969 ± 0.01 0.864 ± 0.03 0.835 ± 0.03 0.635 ± 0.06 8 | 0.597 ± 0.05 **** 0.335 ± 0.03 **** 0.205 ± 0.03 **** 0.125 ± 0.01 **** 8 | 0.958 ± 0.03 0.829 ± 0.04 0.695 ± 0.02 ** 0.382 ± 0.04 **** 8 | 0.859 ± 0.02 * 0.514 ± 0.05 **** 0.437 ± 0.06 **** 0.221 ± 0.02 **** 5 |
© 2020 by the authors. Licensee MDPI, Basel, Switzerland. This article is an open access article distributed under the terms and conditions of the Creative Commons Attribution (CC BY) license (http://creativecommons.org/licenses/by/4.0/).
Share and Cite
Berecki, G.; Helbig, K.L.; Ware, T.L.; Grinton, B.; Skraban, C.M.; Marsh, E.D.; Berkovic, S.F.; Petrou, S. Novel Missense CACNA1G Mutations Associated with Infantile-Onset Developmental and Epileptic Encephalopathy. Int. J. Mol. Sci. 2020, 21, 6333. https://doi.org/10.3390/ijms21176333
Berecki G, Helbig KL, Ware TL, Grinton B, Skraban CM, Marsh ED, Berkovic SF, Petrou S. Novel Missense CACNA1G Mutations Associated with Infantile-Onset Developmental and Epileptic Encephalopathy. International Journal of Molecular Sciences. 2020; 21(17):6333. https://doi.org/10.3390/ijms21176333
Chicago/Turabian StyleBerecki, Géza, Katherine L. Helbig, Tyson L. Ware, Bronwyn Grinton, Cara M. Skraban, Eric D. Marsh, Samuel F. Berkovic, and Steven Petrou. 2020. "Novel Missense CACNA1G Mutations Associated with Infantile-Onset Developmental and Epileptic Encephalopathy" International Journal of Molecular Sciences 21, no. 17: 6333. https://doi.org/10.3390/ijms21176333