Polycyclic Aromatic Hydrocarbons Activate the Aryl Hydrocarbon Receptor and the Constitutive Androstane Receptor to Regulate Xenobiotic Metabolism in Human Liver Cells

 , , ,
, , , 
Abstract
:1. Introduction
2. Results
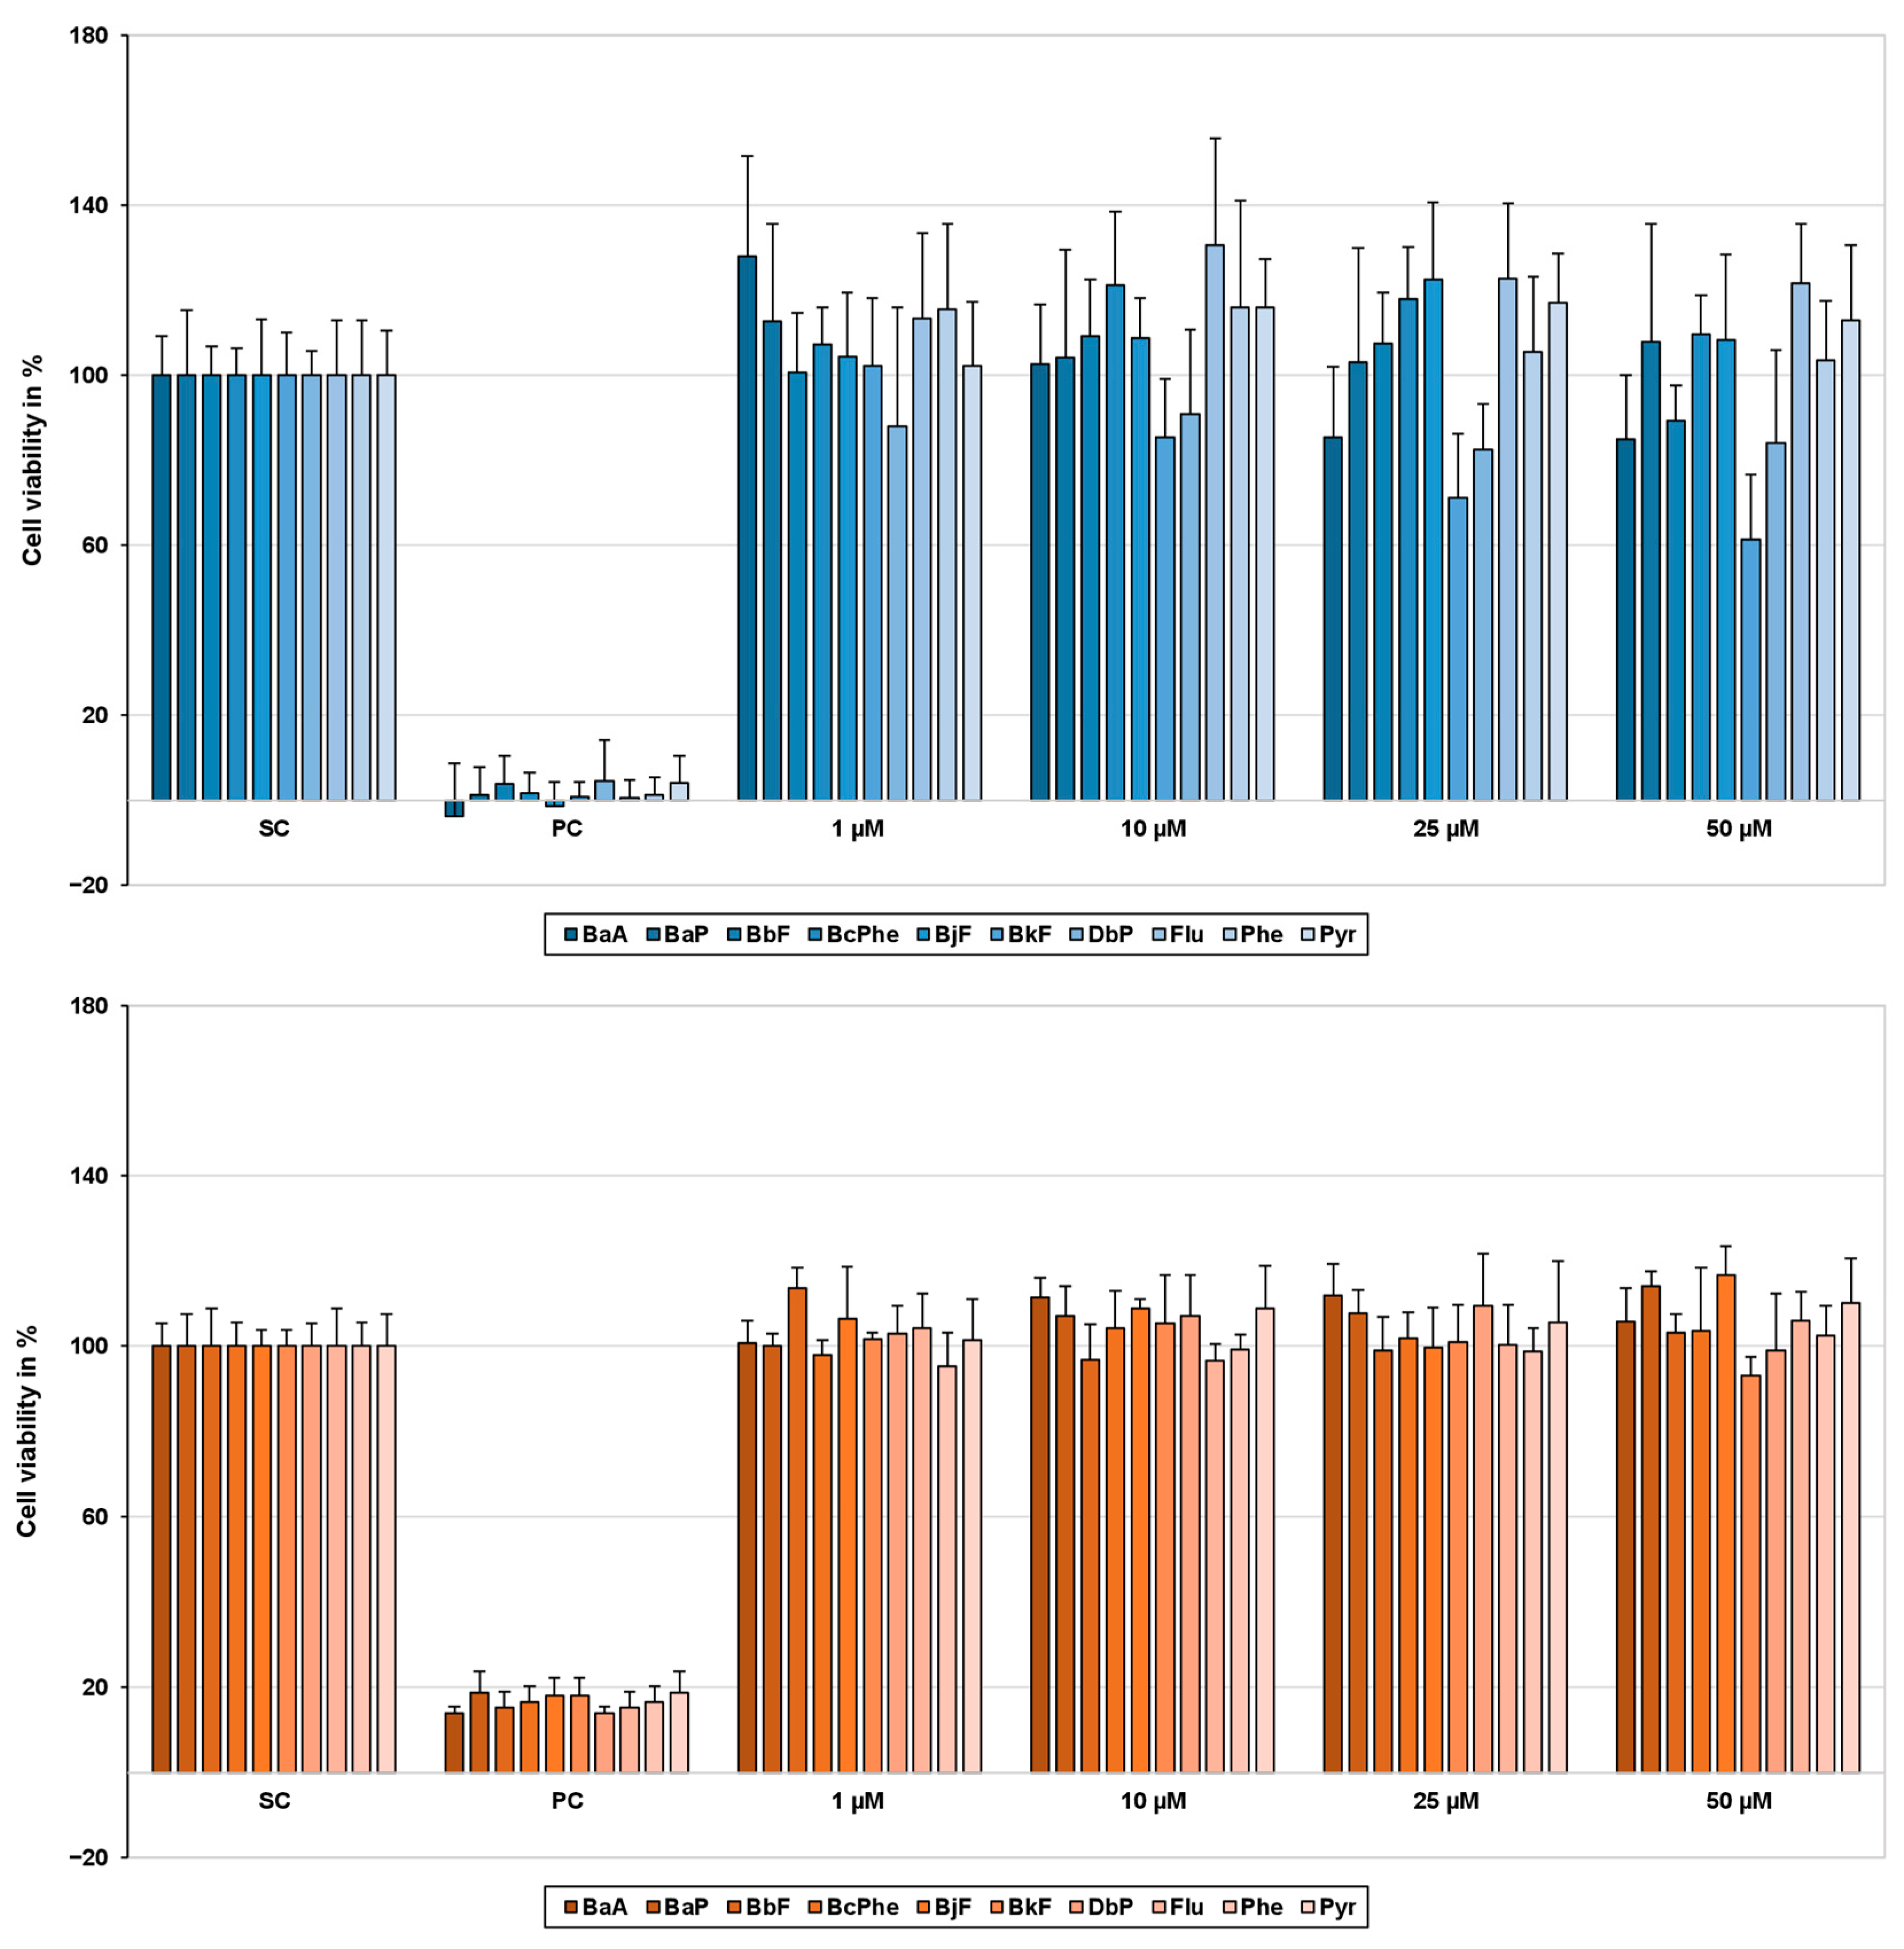
2.1. Cytotoxicity
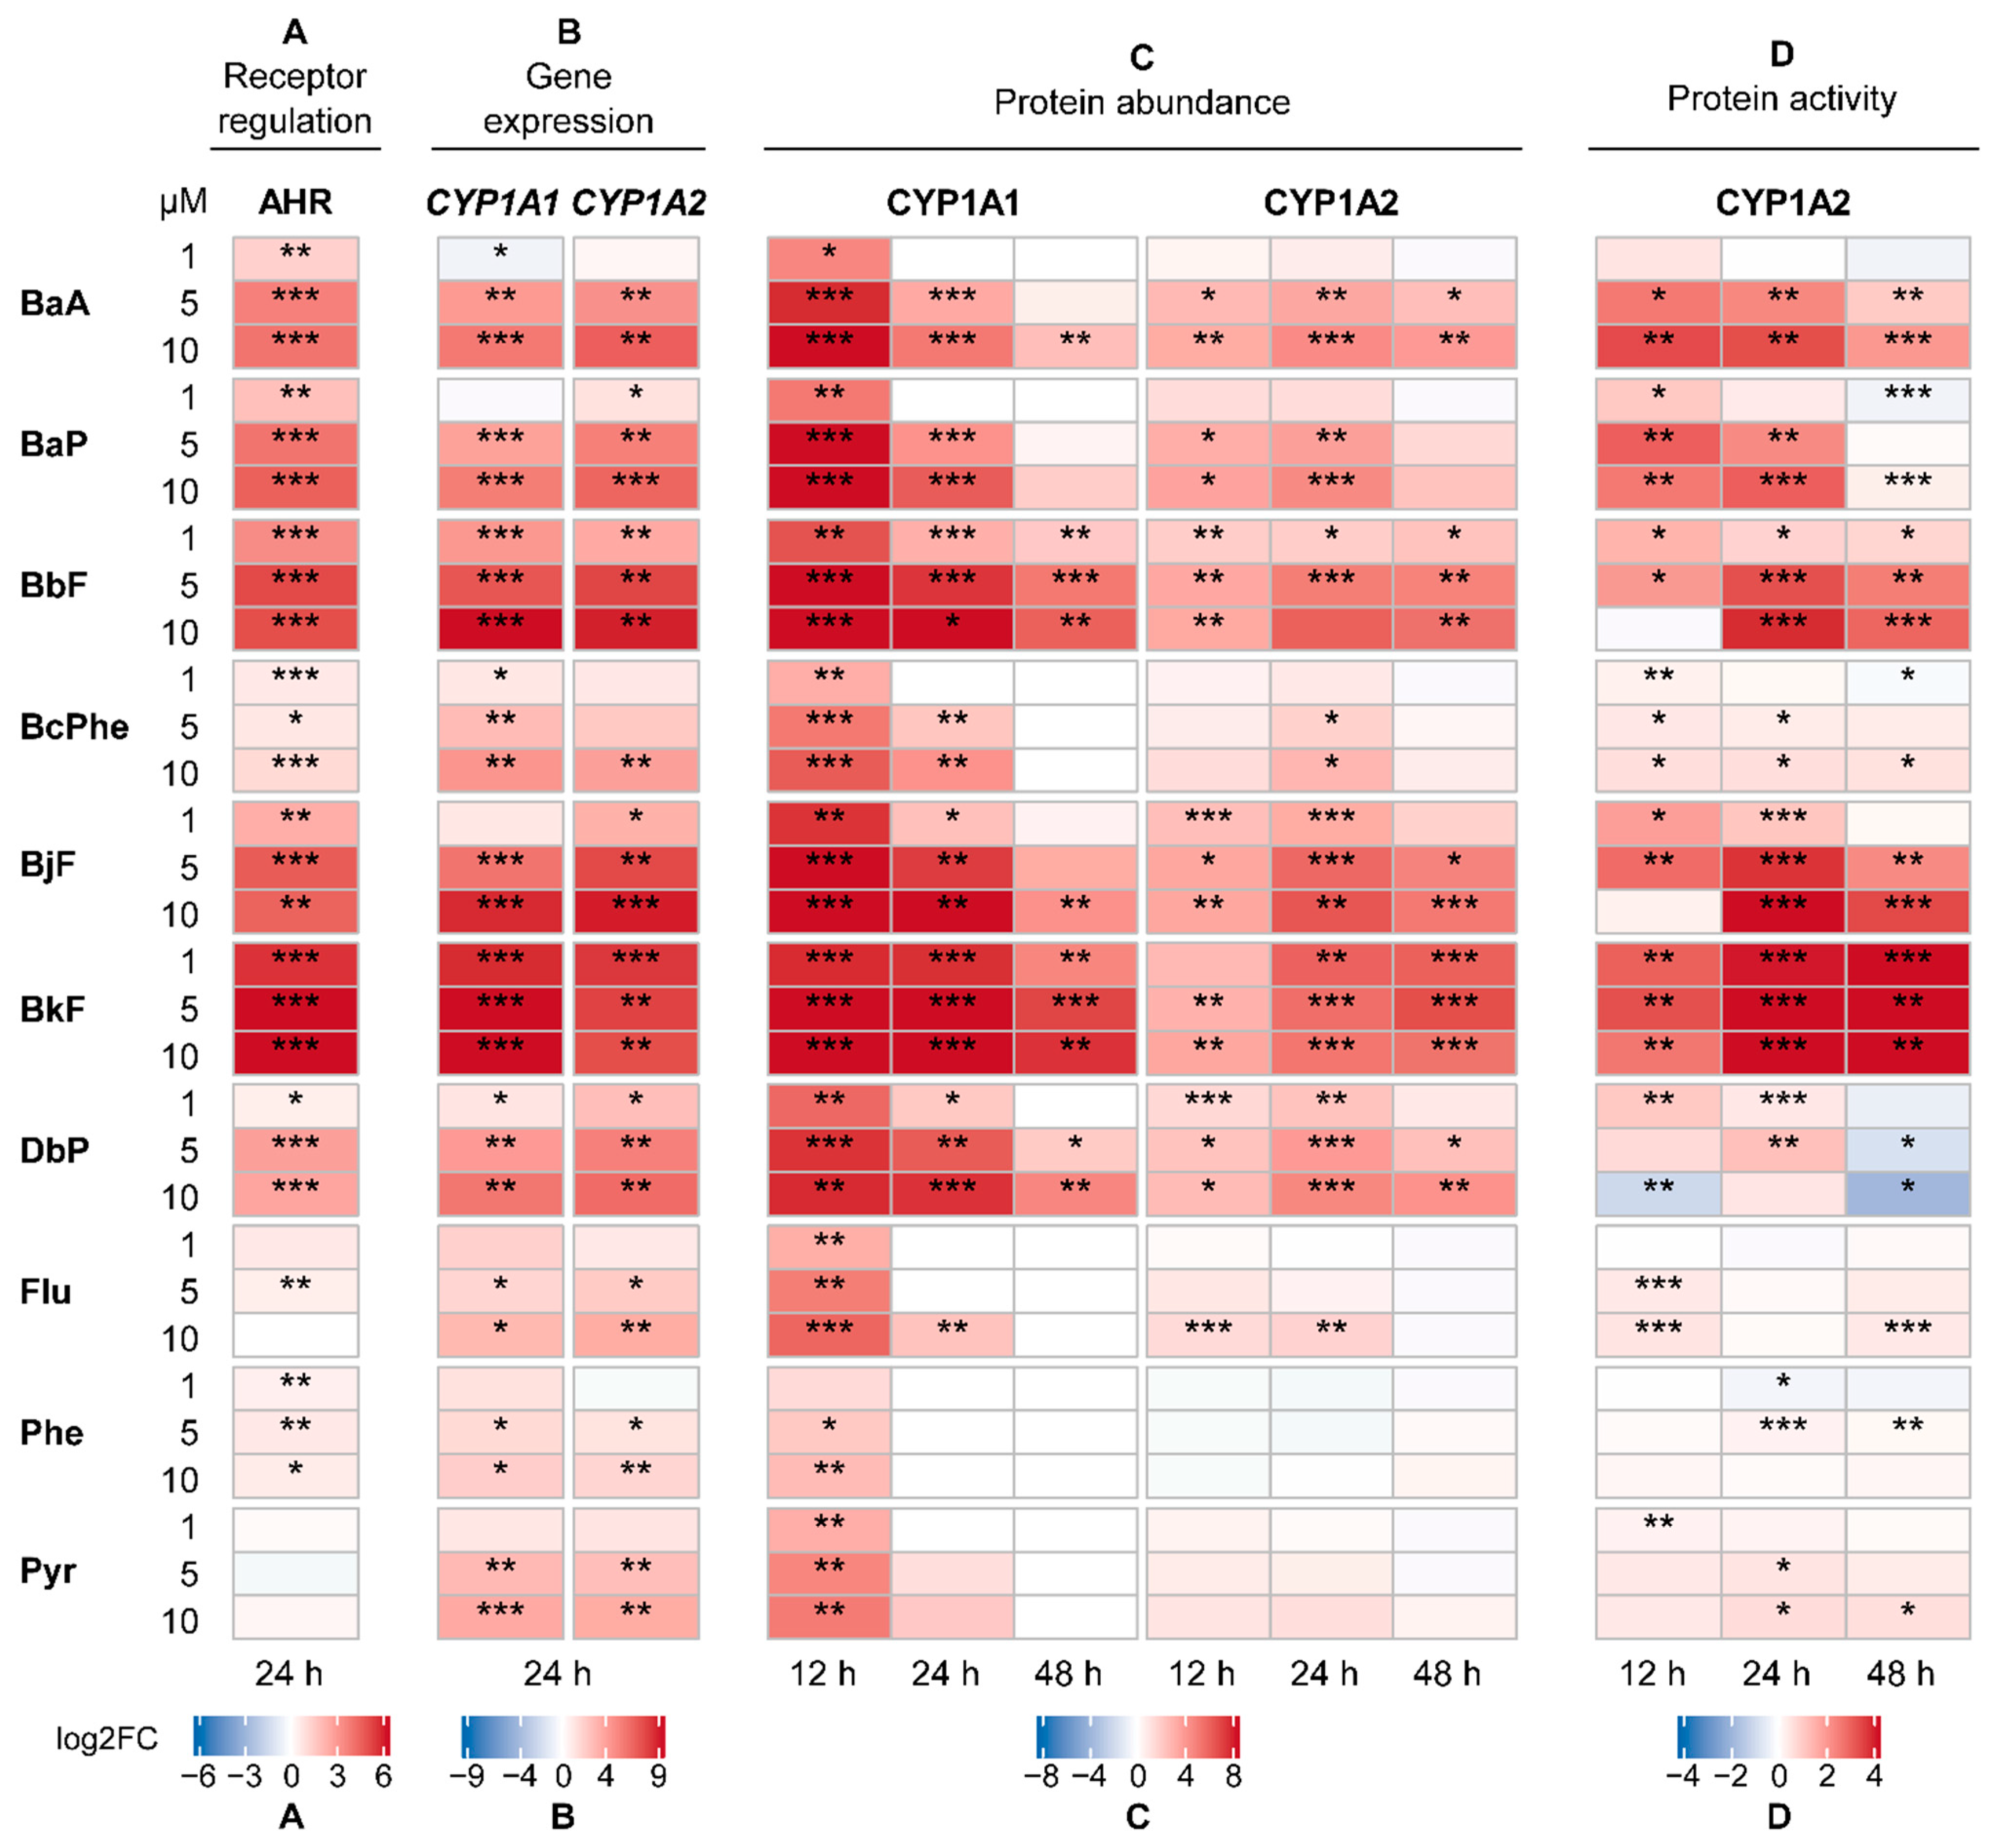
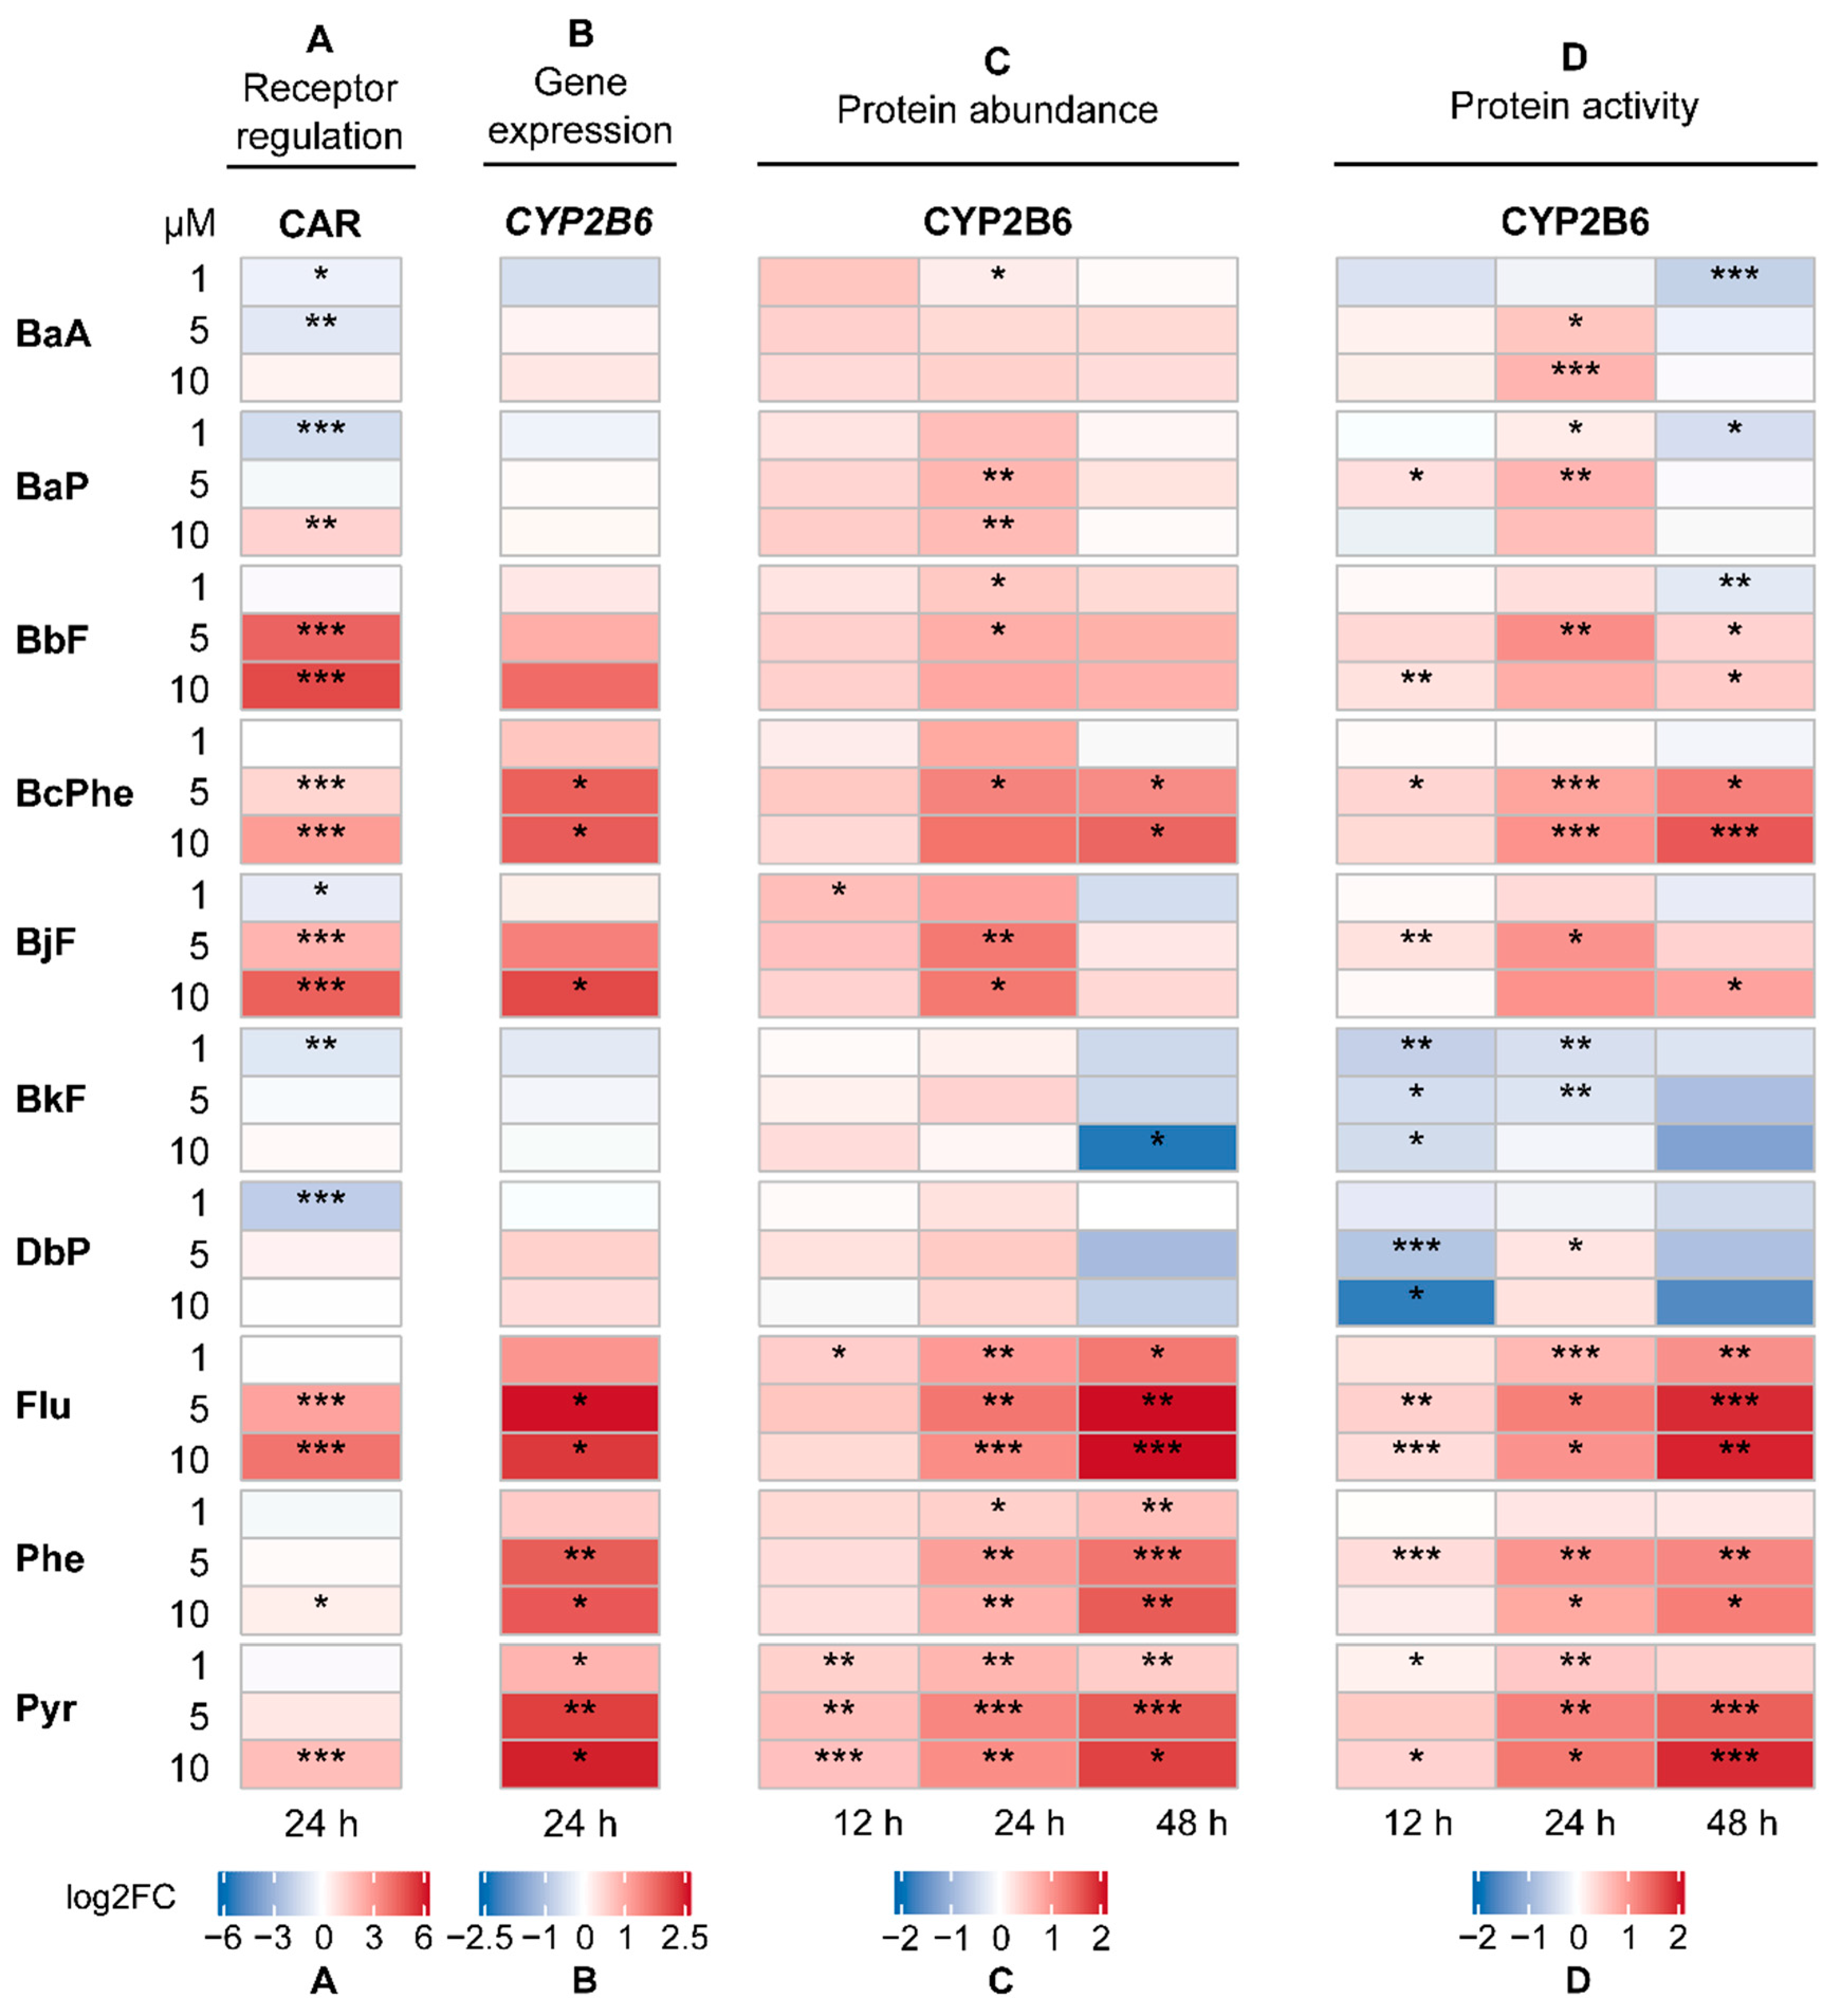
2.2. Activation of the Human Receptors AHR and CAR
2.3. Gene Expression Analysis
2.4. CYP Quantification
2.5. CYP Activity
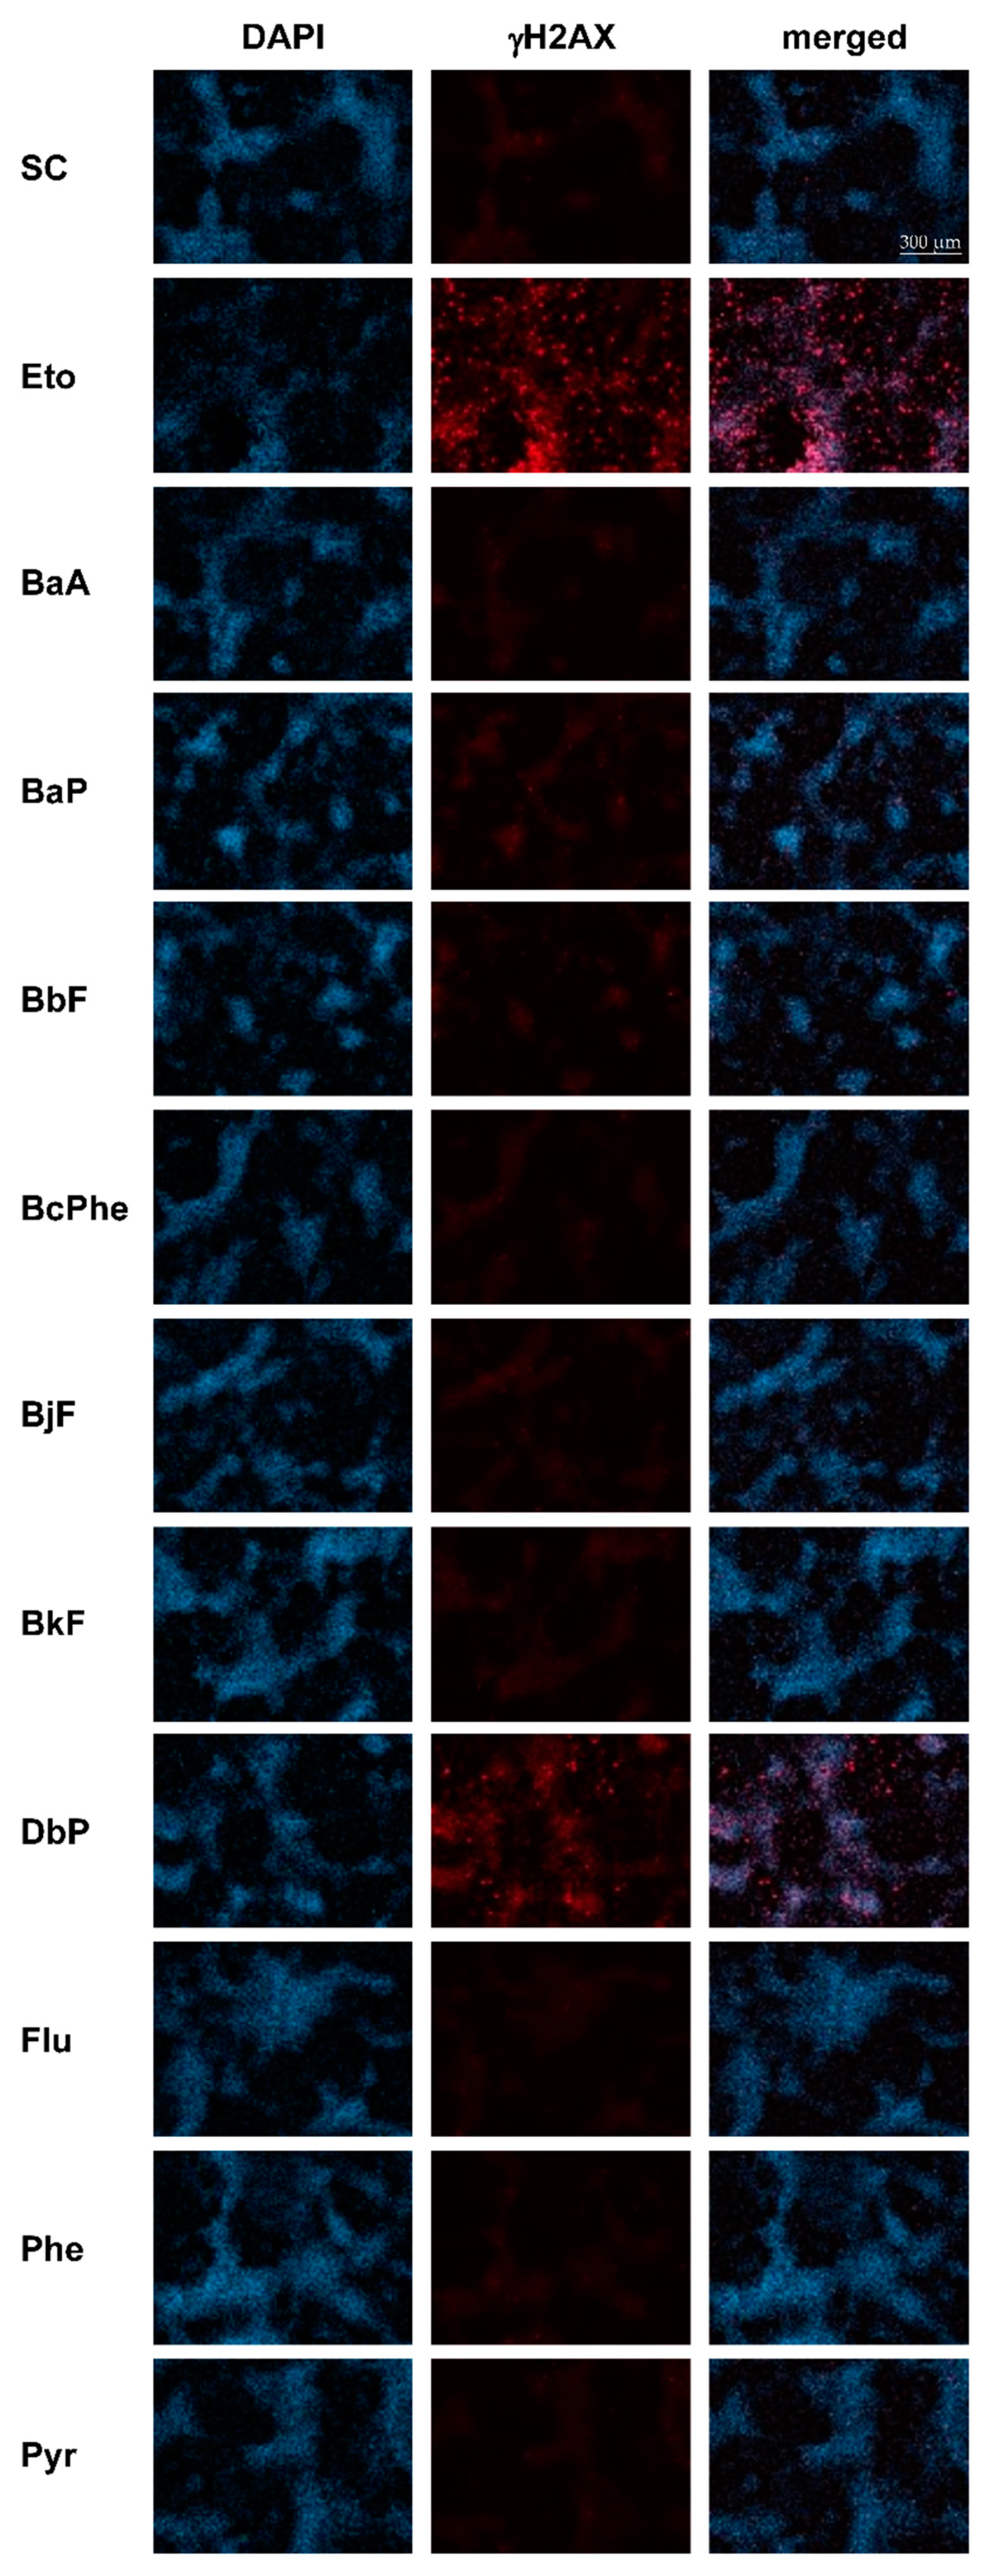
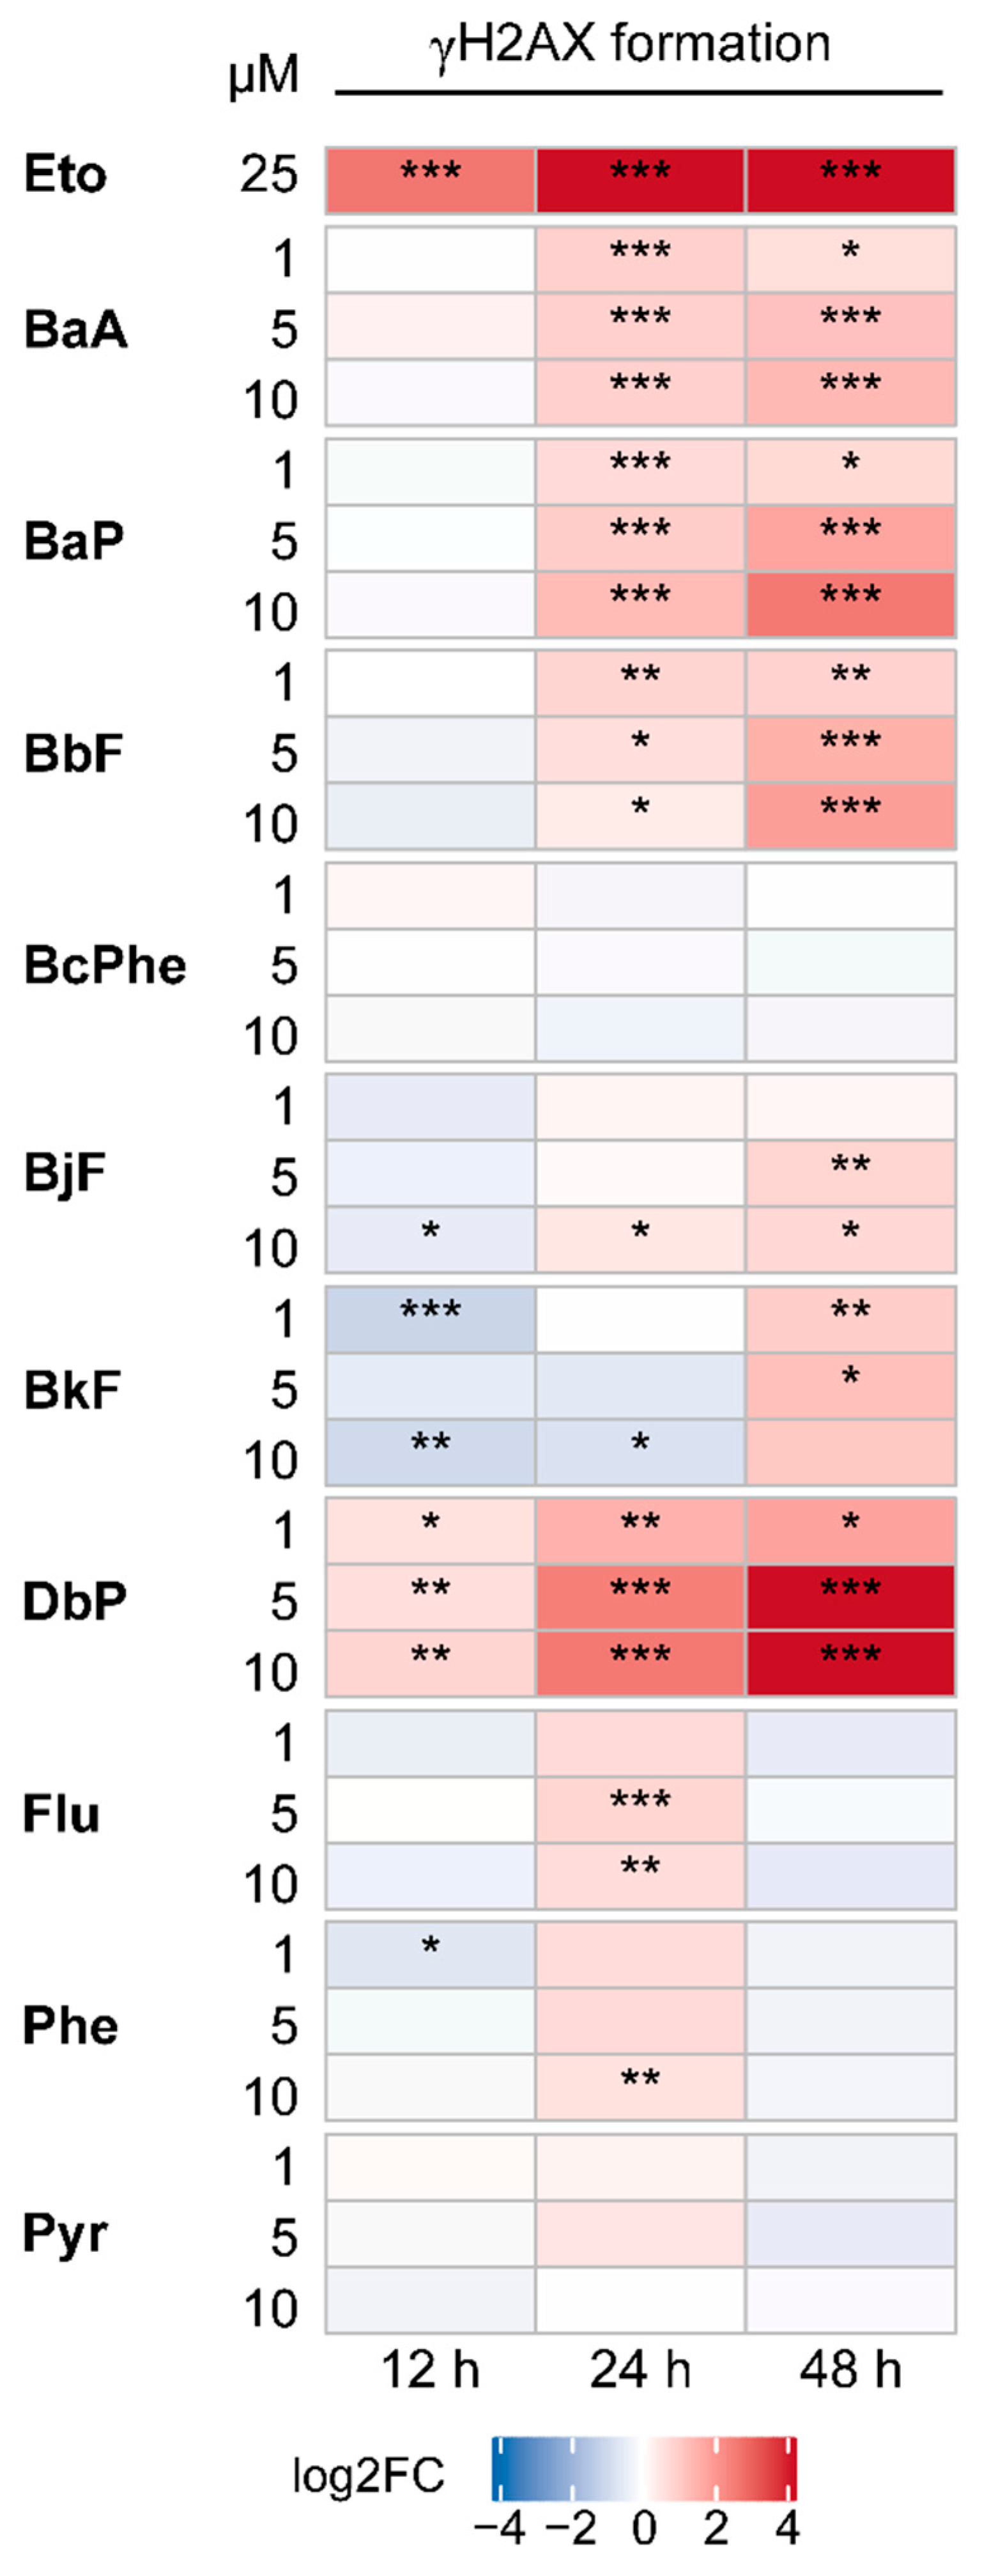
2.6. DNA Double-Strand Breaks (DSBs)
3. Discussion
4. Materials and Methods
4.1. Chemicals
4.2. Cell Culture, Seeding and Treatment
4.3. Reporter Gene Activity via Dual Luciferase Assay
4.4. RNA Isolation and Quantitative Real-Time PCR (qRT-PCR)
4.5. CYP Quantification
4.6. CYP Activity
4.7. γH2AX Immunofluorescence Staining and Microscopy
4.8. Statistical Analysis
Supplementary Materials
Author Contributions
Funding
Institutional Review Board Statement
Informed Consent Statement
Data Availability Statement
Acknowledgments
Conflicts of Interest
Abbreviations
| (γ)H2AX | (phosphorylated) histone H2AX |
| AHR | Aryl hydrocarbon receptor |
| BaA | Benzo[a]anthracene |
| BaP | Benzo[a]pyrene |
| BbF | Benzo[b]fluoranthene |
| BcPhe | Benzo[c]phenanthrene |
| BjF | Benzo[j]fluoranthene |
| BkF | Benzo[k]fluoranthene |
| BSA | Bovine serum albumin |
| CAR | Constitutive androstane receptor |
| CYP | Cytochrome P450 |
| DAPI | 4′,6-diamidino-2-phenylindole |
| DbP | Dibenzo[a,l]pyrene |
| DSB(s) | DNA double-strand break(s) |
| Flu | Fluoranthene |
| IARC | International Agency for Research on Cancer |
| PAH(s) | Polycyclic aromatic hydrocarbon(s) |
| PBS | Phosphate-buffered saline |
| PBS-T | PBS supplemented with 0.1% Tween-20 |
| Phe | Phenanthrene |
| PXR | Pregnane x receptor |
| Pyr | Pyrene |
| qRT-PCR | Quantitative real-time polymerase chain reaction |
| XRE | Xenobiotic response element |
References
- Boström, C.E.; Gerde, P.; Hanberg, A.; Jernstrom, B.; Johansson, C.; Kyrklund, T.; Rannug, A.; Tornqvist, M.; Victorin, K.; Westerholm, R. Cancer risk assessment, indicators, and guidelines for polycyclic aromatic hydrocarbons in the ambient air. Environ. Health Perspect. 2002, 110 (Suppl. S3), 451–488. [Google Scholar] [CrossRef] [Green Version]
- IARC. Some non-heterocyclic polycyclic aromatic hydrocarbons and some related exposures. Monogr. Eval. Carcinog. Risks Hum. 2010, 92, 1. [Google Scholar]
- Shimada, T. Xenobiotic-metabolizing enzymes involved in activation and detoxification of carcinogenic polycyclic aromatic hydrocarbons. Drug Metab. Pharmacokinet. 2006, 21, 257–276. [Google Scholar] [CrossRef] [PubMed] [Green Version]
- Koreeda, M.; Moore, P.D.; Wislocki, P.G.; Levin, W.; Yagi, H.; Jerina, D.M. Binding of benzo[a]pyrene 7,8-diol-9,10-epoxides to DNA, RNA, and protein of mouse skin occurs with high stereoselectivity. Science 1978, 199, 778–781. [Google Scholar] [CrossRef] [PubMed]
- Xue, W.; Warshawsky, D. Metabolic activation of polycyclic and heterocyclic aromatic hydrocarbons and DNA damage: A review. Toxicol. Appl. Pharmcol. 2005, 206, 73–93. [Google Scholar] [CrossRef] [PubMed]
- Denissenko, M.F.; Pao, A.; Tang, M.; Pfeifer, G.P. Preferential formation of benzo[a]pyrene adducts at lung cancer mutational hotspots in P53. Science 1996, 274, 430–432. [Google Scholar] [CrossRef] [Green Version]
- Nesnow, S.; Ross, J.A.; Mass, M.J.; Stoner, G.D. Mechanistic relationships between DNA adducts, oncogene mutations, and lung tumorigenesis in strain A mice. Exp. Lung Res. 1998, 24, 395–405. [Google Scholar] [CrossRef]
- Marlowe, J.L.; Puga, A. Aryl hydrocarbon receptor, cell cycle regulation, toxicity, and tumorigenesis. J. Cell. Biochem. 2005, 96, 1174–1184. [Google Scholar] [CrossRef]
- Puga, A.; Xia, Y.; Elferink, C. Role of the aryl hydrocarbon receptor in cell cycle regulation. Chem. Biol. Interact. 2002, 141, 117–130. [Google Scholar] [CrossRef]
- Gutiérrez-Vázquez, C.; Quintana, F.J. Regulation of the Immune Response by the Aryl Hydrocarbon Receptor. Immunity 2018, 48, 19–33. [Google Scholar] [CrossRef] [Green Version]
- Larigot, L.; Juricek, L.; Dairou, J.; Coumoul, X. AhR signaling pathways and regulatory functions. Biochim. Open 2018, 7, 1–9. [Google Scholar] [CrossRef] [PubMed]
- Nebert, D.W.; Shi, Z.; Galvez-Peralta, M.; Uno, S.; Dragin, N. Oral Benzo[a]pyrene: Understanding Pharmacokinetics, Detoxication and Consequences--Cyp1 Knockout Mouse Lines as a Paradigm. Mol. Pharmacol. 2013. [Google Scholar] [CrossRef] [PubMed] [Green Version]
- Vogel, C.F.A.; Van Winkle, L.S.; Esser, C.; Haarmann-Stemmann, T. The aryl hydrocarbon receptor as a target of environmental stressors—Implications for pollution mediated stress and inflammatory responses. Redox Biol. 2020, 34, 101530. [Google Scholar] [CrossRef] [PubMed]
- Goedtke, L.; John, A.; Lampen, A.; Seidel, A.; Braeuning, A.; Hessel-Pras, S. Mixture effects of food-relevant polycyclic aromatic hydrocarbons on the activation of nuclear receptors and gene expression, benzo[a]pyrene metabolite profile and DNA damage in HepaRG cells. Food Chem. Toxicol. 2020, 147, 111884. [Google Scholar] [CrossRef]
- Yang, H.; Shi, Z.; Wang, X.-X.; Cheng, R.; Lu, M.; Zhu, J.; Deng, W.; Zeng, Y.; Zhao, L.-Y.; Zhang, S.-Y. Phenanthrene, but not its isomer anthracene, effectively activates both human and mouse nuclear receptor constitutive androstane receptor (CAR) and induces hepatotoxicity in mice. Toxicol. Appl. Pharmacol. 2019, 378, 114618. [Google Scholar] [CrossRef]
- Zhang, X.J.; Shi, Z.; Lyv, J.X.; He, X.; Englert, N.A.; Zhang, S.Y. Pyrene is a Novel Constitutive Androstane Receptor (CAR) Activator and Causes Hepatotoxicity by CAR. Toxicol. Sci. Off. J. Soc. Toxicol. 2015, 147, 436–445. [Google Scholar] [CrossRef] [Green Version]
- Ferguson, S.S.; LeCluyse, E.L.; Negishi, M.; Goldstein, J.A. Regulation of Human CYP2C9 by the Constitutive Androstane Receptor: Discovery of a New Distal Binding Site. Mol. Pharmacol. 2002, 62, 737–746. [Google Scholar] [CrossRef] [Green Version]
- Goodwin, B.; Hodgson, E.; D’Costa, D.J.; Robertson, G.R.; Liddle, C. Transcriptional Regulation of the Human CYP3A4Gene by the Constitutive Androstane Receptor. Mol. Pharmacol. 2002, 62, 359–365. [Google Scholar] [CrossRef] [Green Version]
- Kawamoto, T.; Sueyoshi, T.; Zelko, I.; Moore, R.; Washburn, K.; Negishi, M. Phenobarbital-responsive nuclear translocation of the receptor CAR in induction of the CYP2B gene. Mol. Cell. Biol. 1999, 19, 6318–6322. [Google Scholar] [CrossRef] [Green Version]
- Yang, H.; Wang, H. Signaling control of the constitutive androstane receptor (CAR). Protein Cell 2014, 5, 113–123. [Google Scholar] [CrossRef] [Green Version]
- Molnár, F.; Küblbeck, J.; Jyrkkärinne, J.; Prantner, V.; Honkakoski, P. An update on the constitutive androstane receptor (CAR). Drug Metab. Drug Interact. 2013, 28, 79–93. [Google Scholar] [CrossRef] [PubMed]
- IARC. Agents Classified by the IARC Monographs. Volume 1–127. Available online: https://monographs.iarc.fr/agents-classified-by-the-iarc/ (accessed on 8 November 2020).
- de Sousa Abreu, R.; Penalva, L.O.; Marcotte, E.M.; Vogel, C. Global signatures of protein and mRNA expression levels. Mol. Biosyst. 2009, 5, 1512–1526. [Google Scholar] [CrossRef] [PubMed] [Green Version]
- Maier, T.; Güell, M.; Serrano, L. Correlation of mRNA and protein in complex biological samples. FEBS Lett. 2009, 583, 3966–3973. [Google Scholar] [CrossRef] [PubMed] [Green Version]
- Vogel, C.; Marcotte, E.M. Insights into the regulation of protein abundance from proteomic and transcriptomic analyses. Nat. Rev. Genet. 2012, 13, 227–232. [Google Scholar] [CrossRef]
- Croghan, W.; Egeghy, P. Methods of Dealing with Values Below the Limit of Detection Using SAS Carry. In Proceedings of the Southeastern SAS User Group, St. Petersburg, FL, USA, 22–24 September 2003. [Google Scholar]
- Pilch, D.R.; Sedelnikova, O.A.; Redon, C.; Celeste, A.; Nussenzweig, A.; Bonner, W.M. Characteristics of gamma-H2AX foci at DNA double-strand breaks sites. Biochem. Cell Biol. 2003, 81, 123–129. [Google Scholar] [CrossRef]
- Quesnot, N.; Rondel, K.; Audebert, M.; Martinais, S.; Glaise, D.; Morel, F.; Loyer, P.; Robin, M.A. Evaluation of genotoxicity using automated detection of gammaH2AX in metabolically competent HepaRG cells. Mutagenesis 2016, 31, 43–50. [Google Scholar] [CrossRef] [Green Version]
- Long, B.H.; Musial, S.T.; Brattain, M.G. Single- and double-strand DNA breakage and repair in human lung adenocarcinoma cells exposed to etoposide and teniposide. Cancer Res. 1985, 45, 3106–3112. [Google Scholar]
- Baird, W.M.; Hooven, L.A.; Mahadevan, B. Carcinogenic polycyclic aromatic hydrocarbon-DNA adducts and mechanism of action. Environ. Mol. Mutagen. 2005, 45, 106–114. [Google Scholar] [CrossRef]
- SCF. Opinion of the Scientific Committee on Food on the risks to human health of Polycyclic Aromatic Hydrocarbons in food. EFSA J. 2008, 724, 1–114. [Google Scholar] [CrossRef]
- Aninat, C.; Piton, A.; Glaise, D.; Le Charpentier, T.; Langouët, S.; Morel, F.; Guguen-Guillouzo, C.; Guillouzo, A. Expression of cytochromes P450, conjugating enzymes and nuclear receptors in human hepatoma HepaRG cells. Drug Metab. Dispos. 2006, 34, 75–83. [Google Scholar] [CrossRef] [Green Version]
- Kanebratt, K.P.; Andersson, T.B. HepaRG Cells as an in Vitro Model for Evaluation of Cytochrome P450 Induction in Humans. Drug Metab. Dispos. 2008, 36, 137–145. [Google Scholar] [CrossRef] [PubMed] [Green Version]
- Hu, W.; Sorrentino, C.; Denison, M.S.; Kolaja, K.; Fielden, M.R. Induction of Cyp1a1 Is a Nonspecific Biomarker of Aryl Hydrocarbon Receptor Activation: Results of Large Scale Screening of Pharmaceuticals and Toxicants in Vivo and in Vitro. Mol. Pharmacol. 2007, 71, 1475–1486. [Google Scholar] [CrossRef] [PubMed]
- Nebert, D.W.; Dalton, T.P.; Okey, A.B.; Gonzalez, F.J. Role of aryl hydrocarbon receptor-mediated induction of the CYP1 enzymes in environmental toxicity and cancer. J. Biol. Chem. 2004, 279, 23847–23850. [Google Scholar] [CrossRef] [PubMed] [Green Version]
- Clemons, J.H.; Allan, L.M.; Marvin, C.H.; Wu, Z.; McCarry, B.E.; Bryant, D.W.; Zacharewski, T.R. Evidence of Estrogen- and TCDD-Like Activities in Crude and Fractionated Extracts of PM10 Air Particulate Material Using in Vitro Gene Expression Assays. Environ. Sci. Technol. 1998, 32, 1853–1860. [Google Scholar] [CrossRef]
- Machala, M.; Vondráček, J.; Bláha, L.; Ciganek, M.; Neča, J. Aryl hydrocarbon receptor-mediated activity of mutagenic polycyclic aromatic hydrocarbons determined using in vitro reporter gene assay. Mutat. Res./Genet. Toxicol. Environ. Mutagen. 2001, 497, 49–62. [Google Scholar] [CrossRef]
- Sjögren, M.; Ehrenberg, L.; Rannug, U. Relevance of different biological assays in assessing initiating and promoting properties of polycyclic aromatic hydrocarbons with respect to carcinogenic potency. Mutat. Res. 1996, 358, 97–112. [Google Scholar] [CrossRef]
- Jorge-Nebert, L.F.; Jiang, Z.; Chakraborty, R.; Watson, J.; Jin, L.; McGarvey, S.T.; Deka, R.; Nebert, D.W. Analysis of human CYP1A1 and CYP1A2 genes and their shared bidirectional promoter in eight world populations. Hum. Mutat. 2010, 31, 27–40. [Google Scholar] [CrossRef] [Green Version]
- Shi, Z.; Dragin, N.; Gálvez-Peralta, M.; Jorge-Nebert, L.F.; Miller, M.L.; Wang, B.; Nebert, D.W. Organ-specific roles of CYP1A1 during detoxication of dietary benzo[a]pyrene. Mol. Pharmacol. 2010, 78, 46–57. [Google Scholar] [CrossRef] [PubMed] [Green Version]
- Luckert, C.; Ehlers, A.; Buhrke, T.; Seidel, A.; Lampen, A.; Hessel, S. Polycyclic aromatic hydrocarbons stimulate human CYP3A4 promoter activity via PXR. Toxicol. Lett. 2013, 222, 180–188. [Google Scholar] [CrossRef]
- Wang, Y.-M.; Ong, S.S.; Chai, S.C.; Chen, T. Role of CAR and PXR in xenobiotic sensing and metabolism. Expert Opin. Drug Metab. Toxicol. 2012, 8, 803–817. [Google Scholar] [CrossRef] [Green Version]
- Wei, P.; Zhang, J.; Dowhan, D.H.; Han, Y.; Moore, D.D. Specific and overlapping functions of the nuclear hormone receptors CAR and PXR in xenobiotic response. Pharmacogn. J. 2002, 2, 117–126. [Google Scholar] [CrossRef] [PubMed]
- Kim, Y.-D.; Todoroki, H.; Oyama, T.; Isse, T.; Matsumoto, A.; Yamaguchi, T.; Kim, H.; Uchiyama, I.; Kawamoto, T. Identification of cytochrome P450 isoforms involved in 1-hydroxylation of pyrene. Environ. Res. 2004, 94, 262–266. [Google Scholar] [CrossRef]
- Zapata-Pérez, O.; Gold-Bouchot, G.; Ortega, A.; López, T.; Albores, A. Effect of Pyrene on Hepatic Cytochrome P450 1A (CYP1A) Expression in Nile Tilapia (Oreochromis niloticus). Arch. Environ. Contam. Toxicol. 2002, 42, 477–485. [Google Scholar] [CrossRef] [PubMed]
- Cavalieri, E.L.; Higginbotham, S.; RamaKrishna, N.V.; Devanesan, P.D.; Todorovic, R.; Rogan, E.G.; Salmasi, S. Comparative dose-response tumorigenicity studies of dibenzo[alpha,l]pyrene versus 7,12-dimethylbenz[alpha]anthracene, benzo[alpha]pyrene and two dibenzo[alpha,l]pyrene dihydrodiols in mouse skin and rat mammary gland. Carcinogenesis 1991, 12, 1939–1944. [Google Scholar] [CrossRef] [PubMed]
- Cavalieri, E.L.; Rogan, E.G.; Li, K.M.; Todorovic, R.; Ariese, F.; Jankowiak, R.; Grubor, N.; Small, G.J. Identification and quantification of the depurinating DNA adducts formed in mouse skin treated with dibenzo[a,l]pyrene (DB[a,l]P) or its metabolites and in rat mammary gland treated with DB[a,l]P. Chem. Res. Toxicol. 2005, 18, 976–983. [Google Scholar] [CrossRef]
- Chen, K.M.; Guttenplan, J.B.; Zhang, S.M.; Aliaga, C.; Cooper, T.K.; Sun, Y.W.; DelTondo, J.; Kosinska, W.; Sharma, A.K.; Jiang, K.; et al. Mechanisms of oral carcinogenesis induced by dibenzo[a,l]pyrene: An environmental pollutant and a tobacco smoke constituent. Int. J. Cancer 2013, 133, 1300–1309. [Google Scholar] [CrossRef] [Green Version]
- Long, A.S.; Lemieux, C.L.; Arlt, V.M.; White, P.A. Tissue-specific in vivo genetic toxicity of nine polycyclic aromatic hydrocarbons assessed using the Muta™Mouse transgenic rodent assay. Toxicol. Appl. Pharmacol. 2016, 290, 31–42. [Google Scholar] [CrossRef] [Green Version]
- Uno, S.; Dalton, T.P.; Derkenne, S.; Curran, C.P.; Miller, M.L.; Shertzer, H.G.; Nebert, D.W. Oral Exposure to Benzo[a]pyrene in the Mouse: Detoxication by Inducible Cytochrome P450 Is More Important Than Metabolic Activation. Mol. Pharmacol. 2004, 65, 1225–1237. [Google Scholar] [CrossRef] [Green Version]
- Braeuning, A.; Gavrilov, A.; Brown, S.; Wolf, C.R.; Henderson, C.J.; Schwarz, M. Phenobarbital-mediated tumor promotion in transgenic mice with humanized CAR and PXR. Toxicol. Sci. Off. J. Soc. Toxicol. 2014, 140, 259–270. [Google Scholar] [CrossRef] [Green Version]
- Vondráček, J.; Pěnčíková, K.; Ciganek, M.; Pivnička, J.; Karasová, M.; Hýžďalová, M.; Strapáčová, S.; Pálková, L.; Neča, J.; Matthews, J.; et al. Environmental six-ring polycyclic aromatic hydrocarbons are potent inducers of the AhR-dependent signaling in human cells. Environ. Pollut. 2020, 266, 115125. [Google Scholar] [CrossRef]
- Luckert, C.; Hessel, S.; Lampen, A.; Braeuning, A. Utility of an appropriate reporter assay: Heliotrine interferes with GAL4/upstream activation sequence-driven reporter gene systems. Anal. Biochem. 2015, 487, 45–48. [Google Scholar] [CrossRef] [PubMed]
- Hampf, M.; Gossen, M. A protocol for combined Photinus and Renilla luciferase quantification compatible with protein assays. Anal. Biochem. 2006, 356, 94–99. [Google Scholar] [CrossRef] [PubMed] [Green Version]
- Livak, K.J.; Schmittgen, T.D. Analysis of relative gene expression data using real-time quantitative PCR and the 2(-Delta Delta C(T)) Method. Methods 2001, 25, 402–408. [Google Scholar] [CrossRef]
- Braeuning, A.; Mentz, A.; Schmidt, F.F.; Albaum, S.P.; Planatscher, H.; Kalinowski, J.; Joos, T.O.; Poetz, O.; Lichtenstein, D. RNA-protein correlation of liver toxicity markers in HepaRG cells. EXCLI J 2020, 19, 135–153. [Google Scholar] [CrossRef]
- Voss, L.; Yilmaz, K.; Burkard, L.; Vidmar, J.; Stock, V.; Hoffmann, U.; Pötz, O.; Hammer, H.S.; Peiser, M.; Braeuning, A.; et al. Impact of iron oxide nanoparticles on xenobiotic metabolism in HepaRG cells. Arch. Toxicol. 2020, 94, 4023–4035. [Google Scholar] [CrossRef]
- Feidt, D.M.; Klein, K.; Hofmann, U.; Riedmaier, S.; Knobeloch, D.; Thasler, W.E.; Weiss, T.S.; Schwab, M.; Zanger, U.M. Profiling Induction of Cytochrome P450 Enzyme Activity by Statins Using a New Liquid Chromatography-Tandem Mass Spectrometry Cocktail Assay in Human Hepatocytes. Drug Metab. Dispos. 2010, 38, 1589–1597. [Google Scholar] [CrossRef] [Green Version]
- Knebel, C.; Neeb, J.; Zahn, E.; Schmidt, F.; Carazo, A.; Holas, O.; Pavek, P.; Püschel, G.P.; Zanger, U.M.; Süssmuth, R.; et al. Unexpected Effects of Propiconazole, Tebuconazole, and Their Mixture on the Receptors CAR and PXR in Human Liver Cells. Toxicol. Sci. 2018, 163, 170–181. [Google Scholar] [CrossRef]
- Gu, Z.; Eils, R.; Schlesner, M. Complex heatmaps reveal patterns and correlations in multidimensional genomic data. Bioinformatics 2016, 32, 2847–2849. [Google Scholar] [CrossRef] [Green Version]
- R Core Team. R: A language and environment for statistical computing; R Foundation for Statistical Computing: Vienna, Austria, 2018; Available online: https://www.r-project.org/index.html (accessed on 23 November 2020).


Publisher’s Note: MDPI stays neutral with regard to jurisdictional claims in published maps and institutional affiliations. |
© 2020 by the authors. Licensee MDPI, Basel, Switzerland. This article is an open access article distributed under the terms and conditions of the Creative Commons Attribution (CC BY) license (http://creativecommons.org/licenses/by/4.0/).
Share and Cite
Goedtke, L.; Sprenger, H.; Hofmann, U.; Schmidt, F.F.; Hammer, H.S.; Zanger, U.M.; Poetz, O.; Seidel, A.; Braeuning, A.; Hessel-Pras, S. Polycyclic Aromatic Hydrocarbons Activate the Aryl Hydrocarbon Receptor and the Constitutive Androstane Receptor to Regulate Xenobiotic Metabolism in Human Liver Cells. Int. J. Mol. Sci. 2021, 22, 372. https://doi.org/10.3390/ijms22010372
Goedtke L, Sprenger H, Hofmann U, Schmidt FF, Hammer HS, Zanger UM, Poetz O, Seidel A, Braeuning A, Hessel-Pras S. Polycyclic Aromatic Hydrocarbons Activate the Aryl Hydrocarbon Receptor and the Constitutive Androstane Receptor to Regulate Xenobiotic Metabolism in Human Liver Cells. International Journal of Molecular Sciences. 2021; 22(1):372. https://doi.org/10.3390/ijms22010372
Chicago/Turabian StyleGoedtke, Lisa, Heike Sprenger, Ute Hofmann, Felix F. Schmidt, Helen S. Hammer, Ulrich M. Zanger, Oliver Poetz, Albrecht Seidel, Albert Braeuning, and Stefanie Hessel-Pras. 2021. "Polycyclic Aromatic Hydrocarbons Activate the Aryl Hydrocarbon Receptor and the Constitutive Androstane Receptor to Regulate Xenobiotic Metabolism in Human Liver Cells" International Journal of Molecular Sciences 22, no. 1: 372. https://doi.org/10.3390/ijms22010372