
Variability of Amyloid Propensity in Imperfect Repeats of CsgA Protein of Salmonella enterica and Escherichia coli

 , , , and
Abstract
:1. Introduction
2. Results
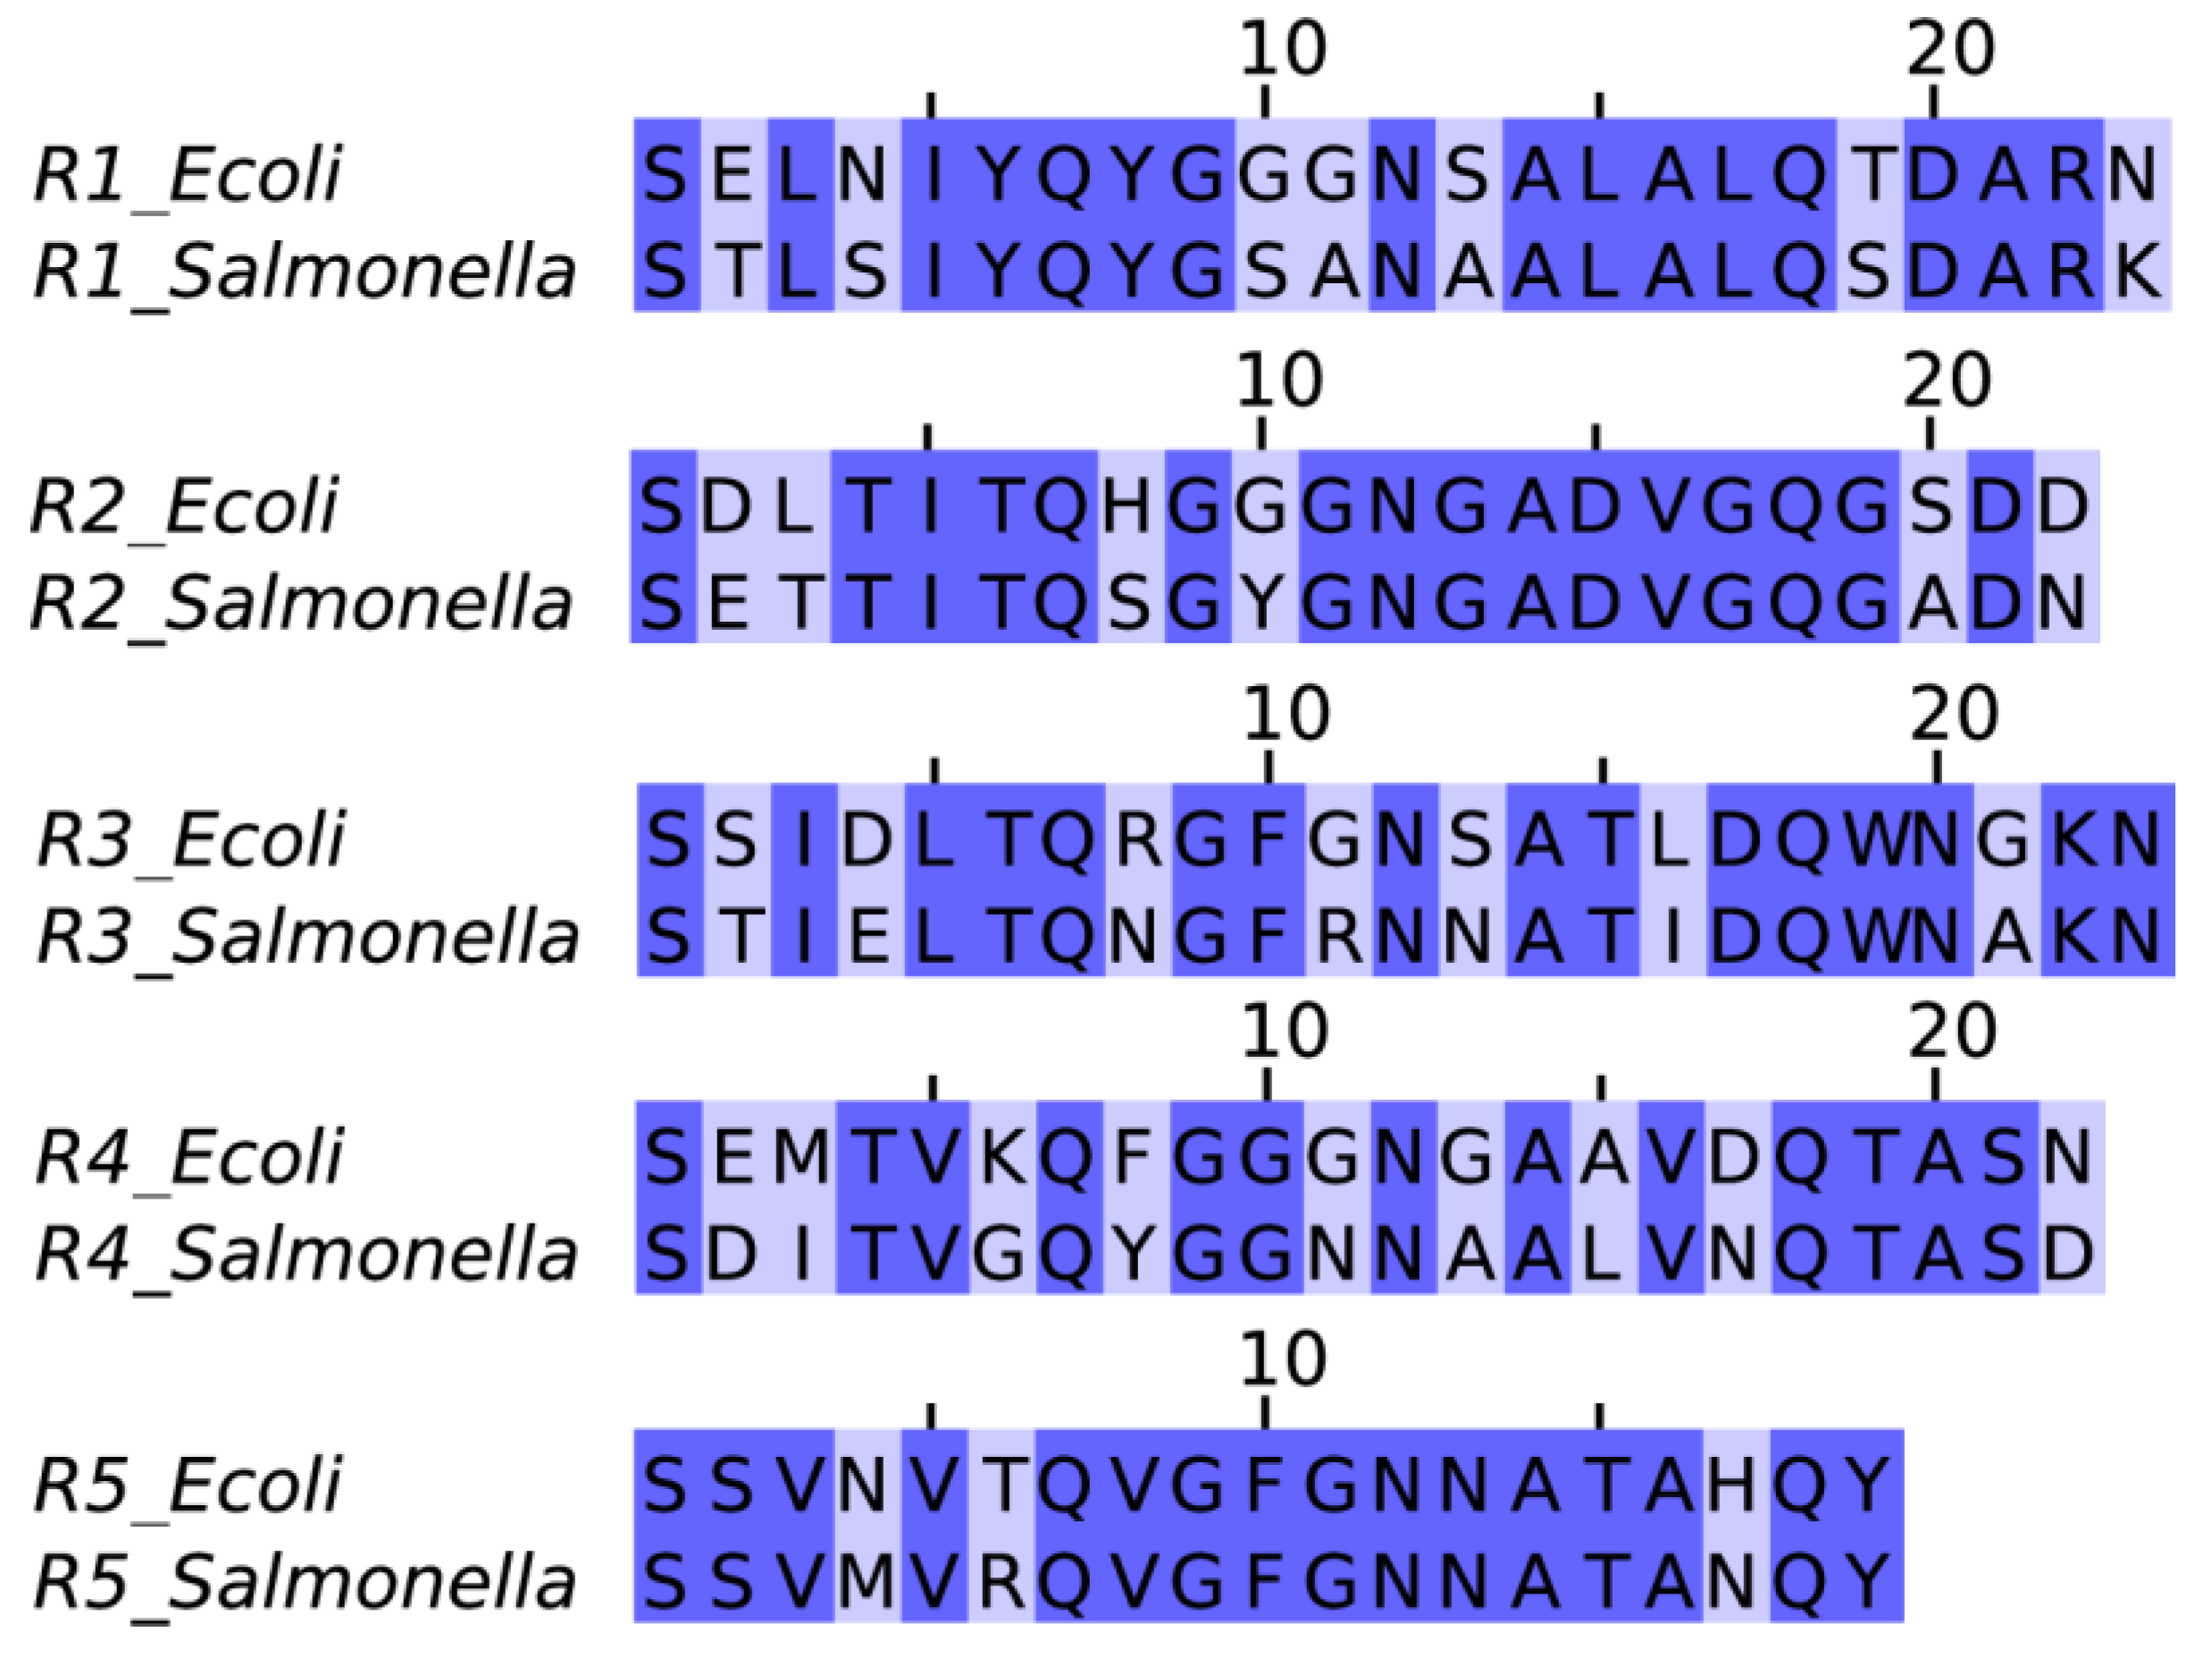
2.1. Sequence Alignment
2.2. Bioinformatics Analysis
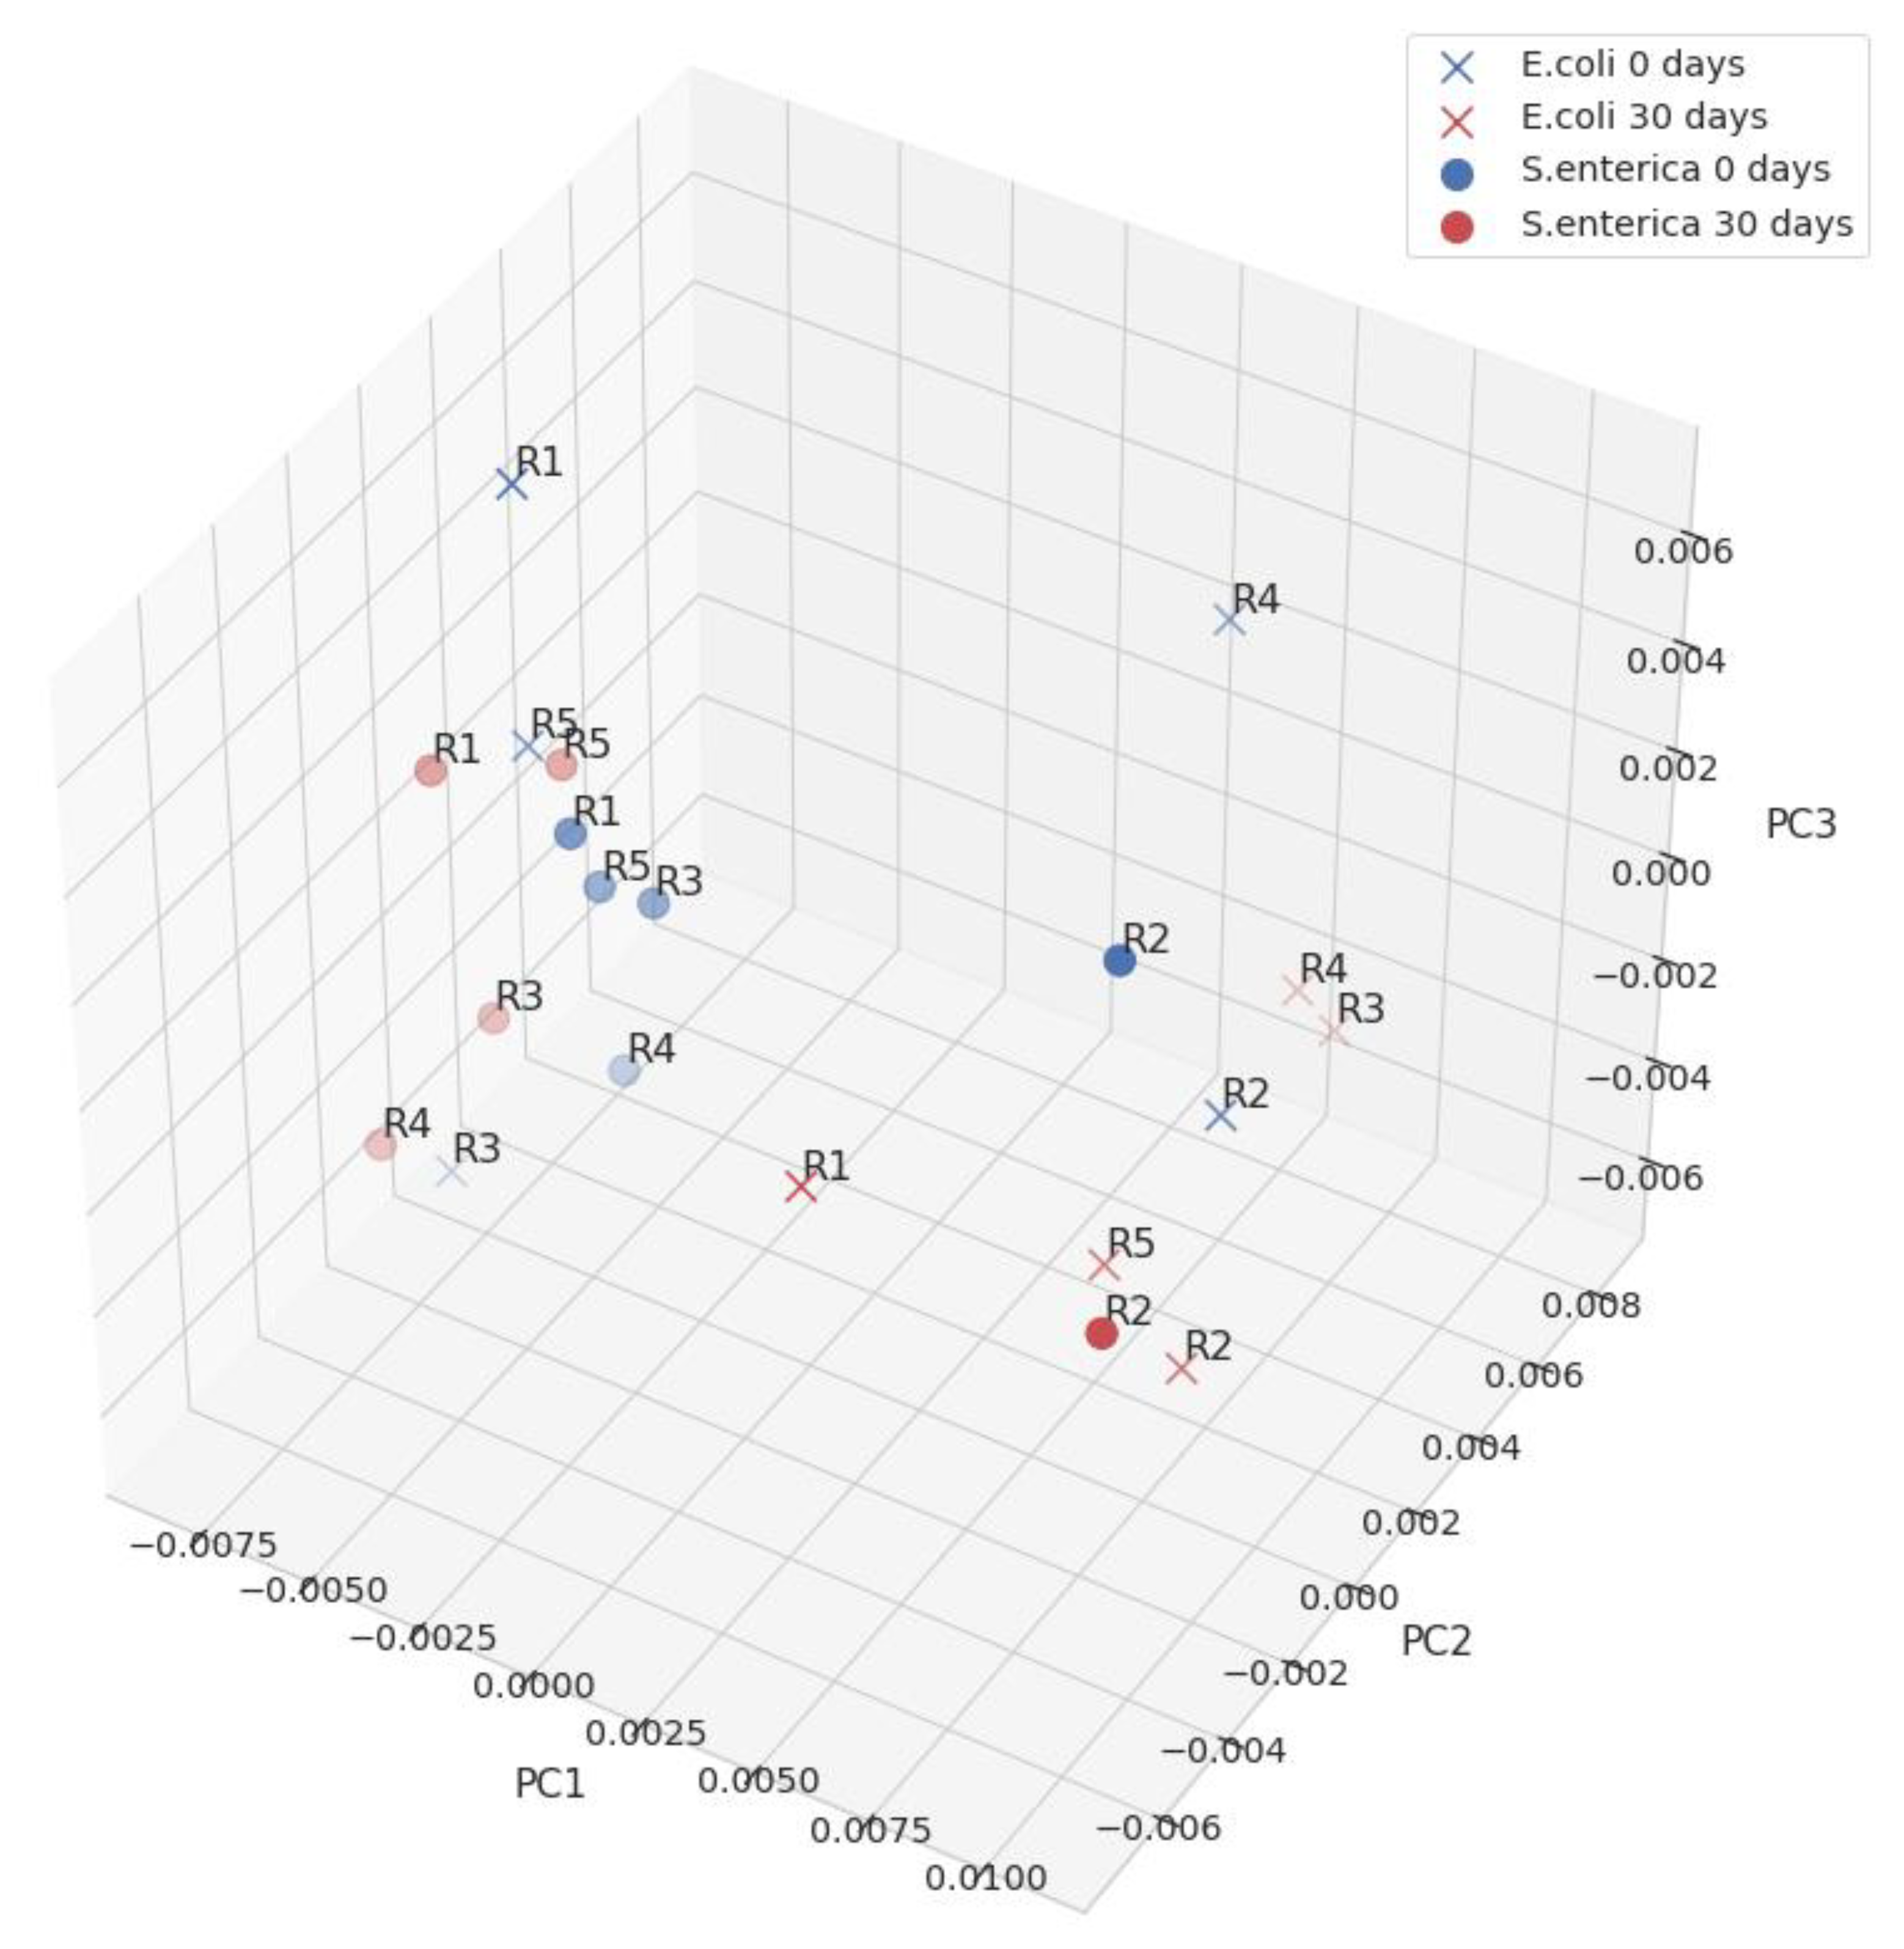
2.3. Experimental Analysis
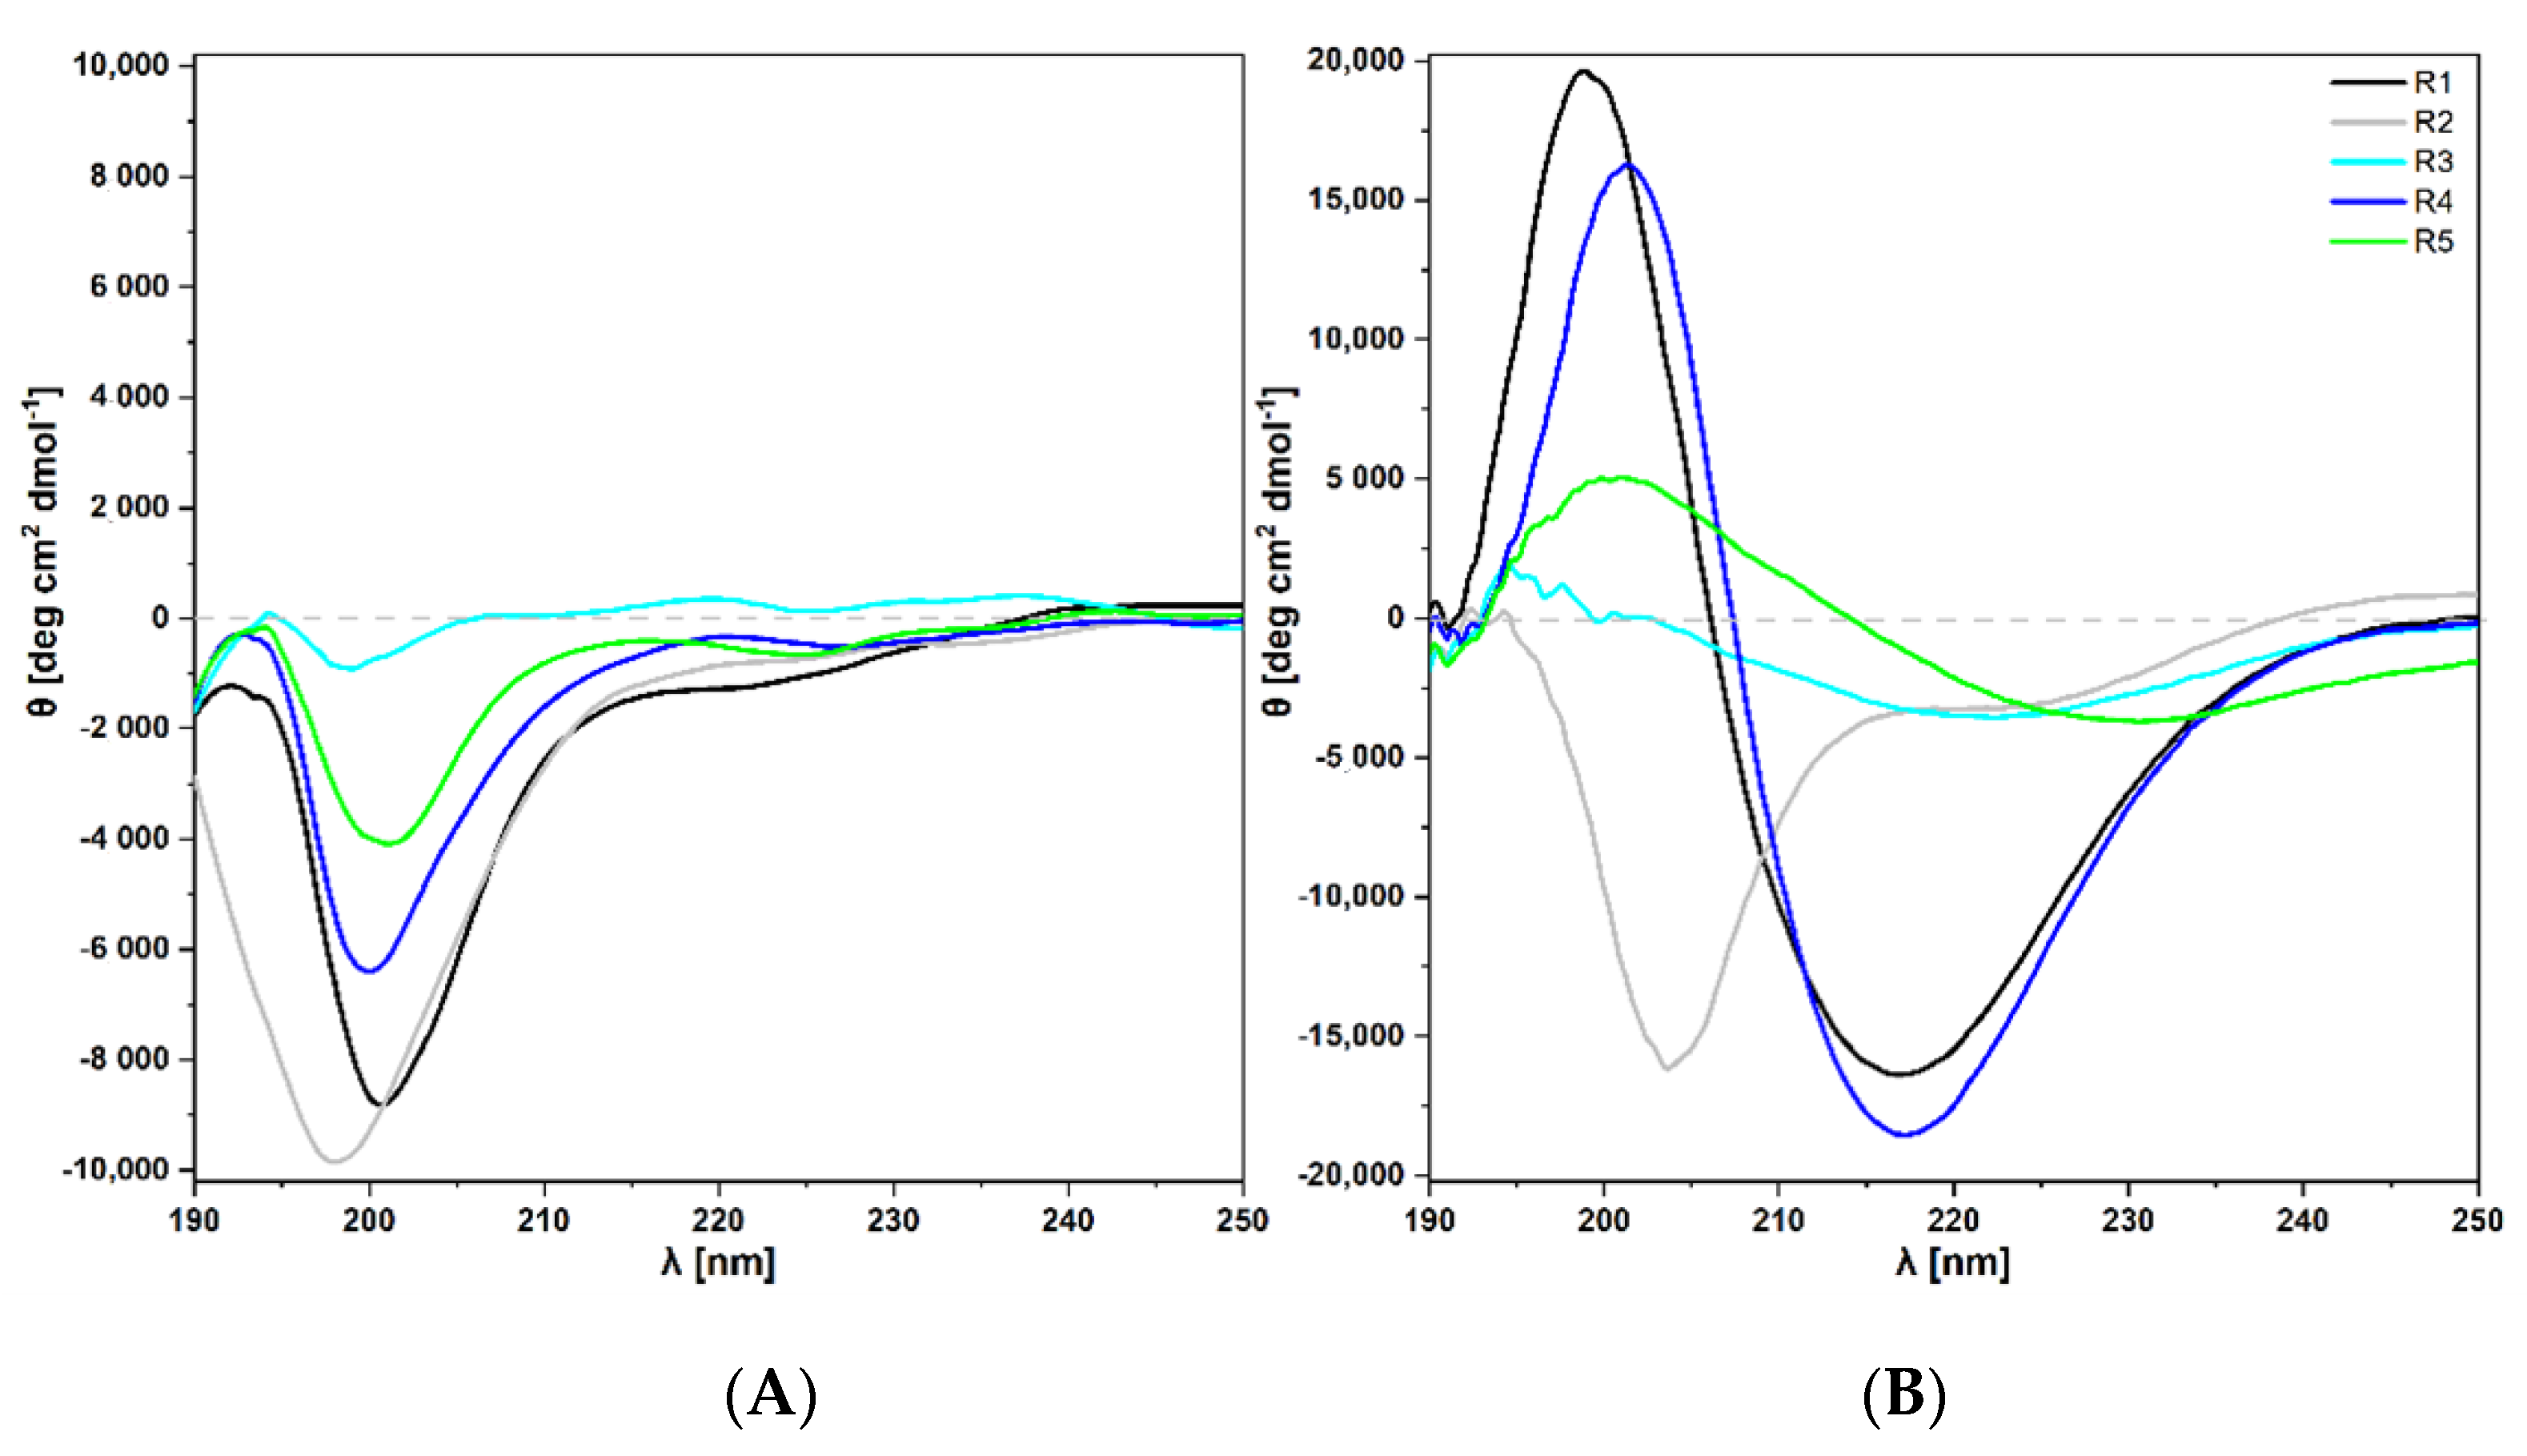
2.3.1. Circular Dichroism
2.3.2. ATR-FTIR
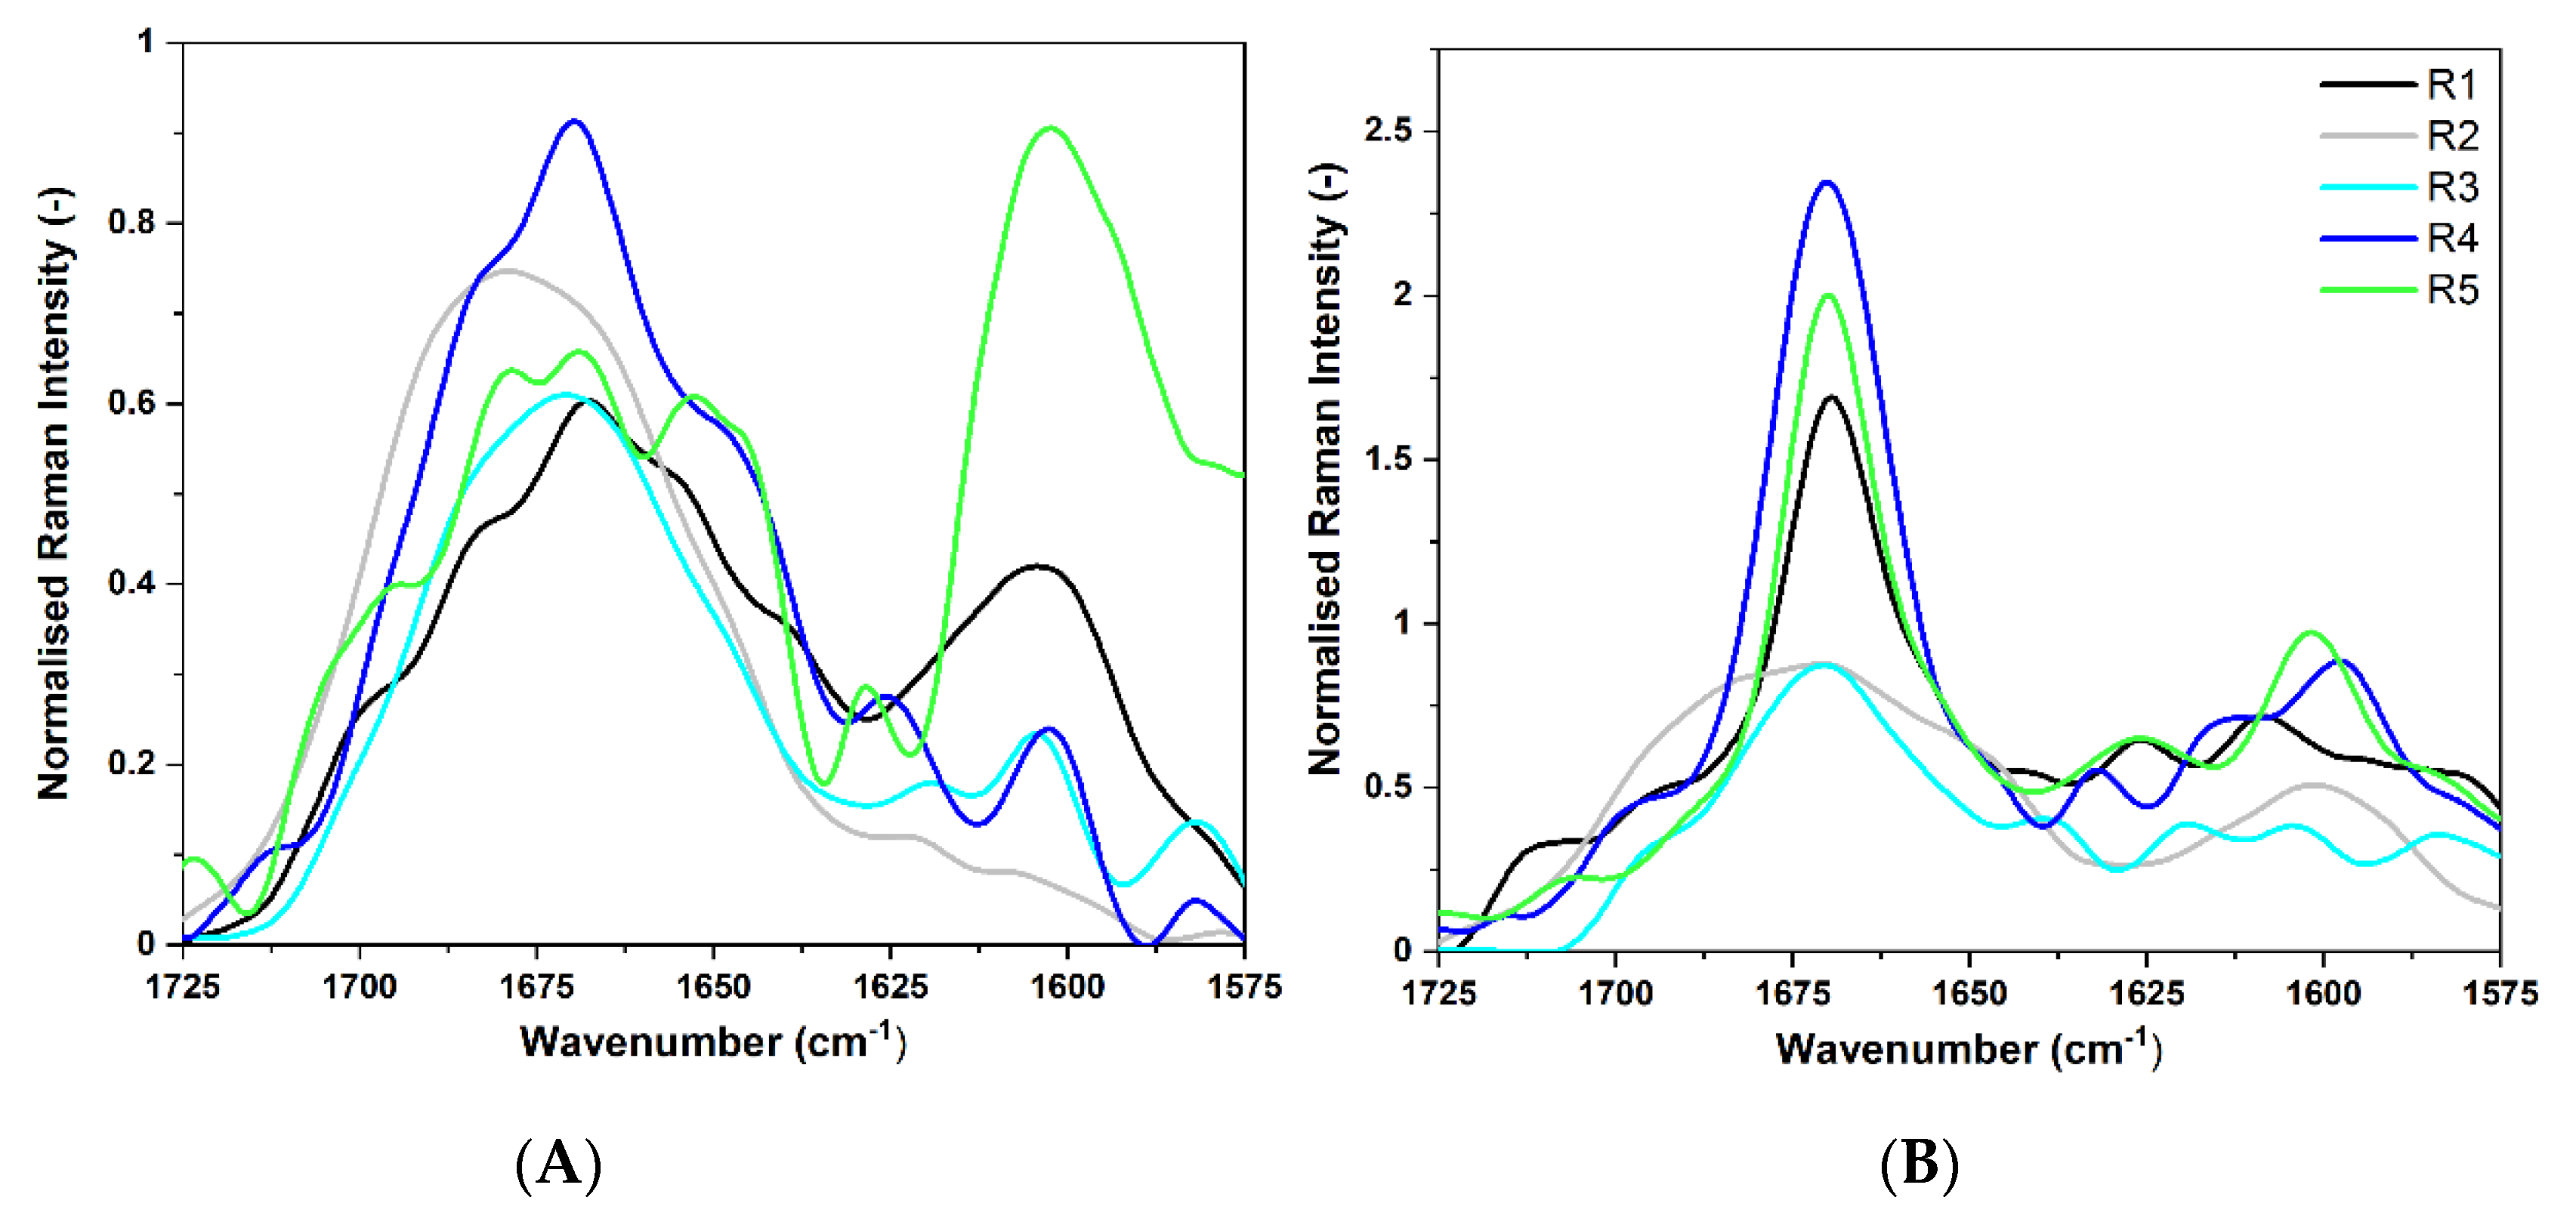
2.3.3. FT-Raman
2.3.4. Transmission Electron Microscopy
2.4. Comparative Analysis of R4 Fragments from S. enterica and E. coli
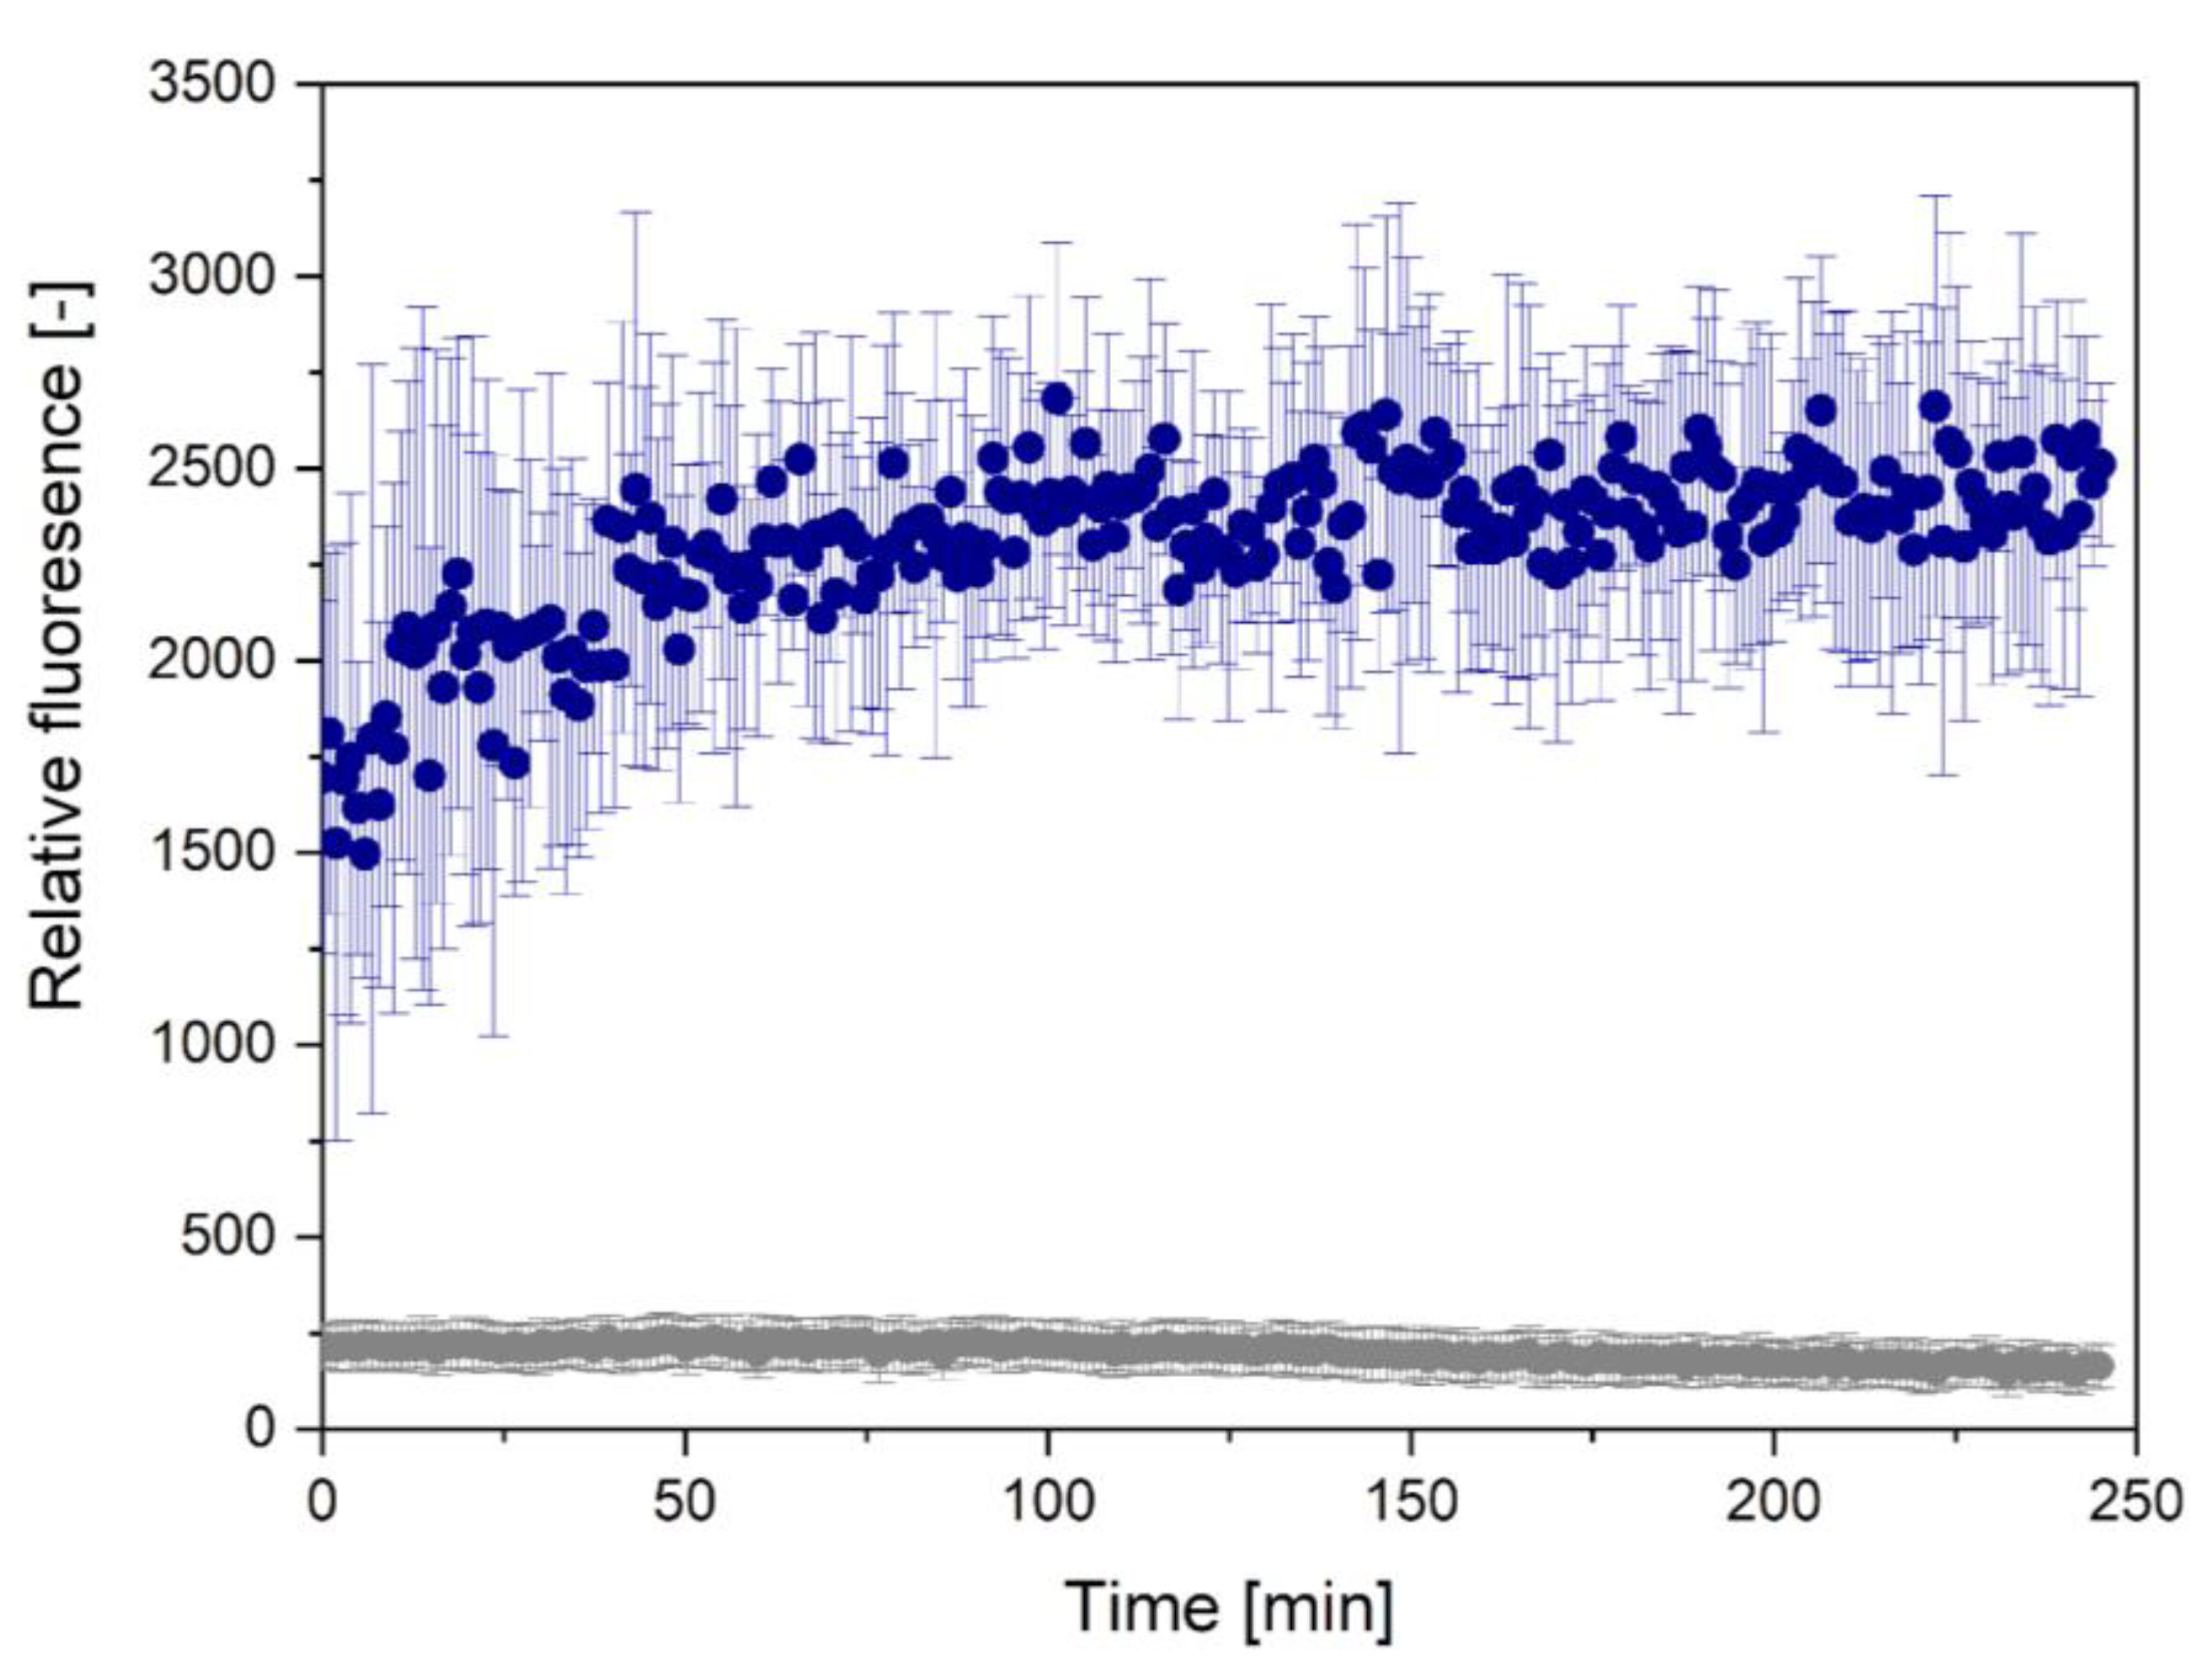
2.4.1. ThT Assay
2.4.2. Comparative Transmission Electron Microscopy Micrographs
3. Discussion
4. Materials and Methods
4.1. Sample Preparation
4.2. Bioinformatic Analysis
4.3. Circular Dichroism (CD)
4.4. Attenuated Total Reflectance—Fourier-Transform Infrared (ATR-FTIR)
4.5. FT-Raman
4.6. Spectral Analysis
4.7. Thioflavin T (ThT) Fluorescence Assay
4.8. Transmission Electron Microscopy (TEM)
Supplementary Materials
Author Contributions
Funding
Informed Consent Statement
Conflicts of Interest
References
- Shanmugam, N.; Baker, M.O.D.G.; Ball, S.R.; Steain, M.; Pham, C.L.L.; Sunde, M. Microbial functional amyloids serve diverse purposes for structure, adhesion and defence. Biophys. Rev. 2019, 11, 287–302. [Google Scholar] [CrossRef]
- Otzen, D.; Riek, R. Functional amyloids. Cold Spring Harb. Perspect. Biol. 2019, 11, a033860. [Google Scholar] [CrossRef] [PubMed]
- Flemming, H.C.; Wingender, J. The biofilm matrix. Nat. Rev. Microbiol. 2010, 8, 623–633. [Google Scholar] [CrossRef]
- Flemming, H.C.; Wuertz, S. Bacteria and archaea on Earth and their abundance in biofilms. Nat. Rev. Microbiol. 2019, 17, 247–260. [Google Scholar] [CrossRef] [PubMed]
- Schiebel, J.; Böhm, A.; Nitschke, J.; Burdukiewicz, M.; Weinreich, J.; Ali, A.; Roggenbuck, D.; Rödiger, S.; Schierack, P. Genotypic and phenotypic characteristics associated with biofilm formation by human clinical Escherichia coli isolates of different pathotypes. Appl. Environ. Microbiol. 2017, 83, 1660–1677. [Google Scholar] [CrossRef] [PubMed] [Green Version]
- Chapman, M.R.; Robinson, L.S.; Pinkner, J.S.; Roth, R.; Heuser, J.; Hammar, M.; Normark, S.; Hultgren, S.J. Role of Escherichia coli curli operons in directing amyloid fiber formation. Science 2002, 295, 851–855. [Google Scholar] [CrossRef] [Green Version]
- Robinson, L.S.; Ashman, E.M.; Hultgren, S.J.; Chapman, M.R. Secretion of curli fibre subunits is mediated by the outer membrane-localized CsgG protein. Mol. Microbiol. 2006, 59, 870–881. [Google Scholar] [CrossRef] [PubMed] [Green Version]
- Hammer, N.D.; Schmidt, J.C.; Chapman, M.R. The curli nucleator protein, CsgB, contains an amyloidogenic domain that directs CsgA polymerization. Proc. Natl. Acad. Sci. USA 2007, 104, 12494–12499. [Google Scholar] [CrossRef] [PubMed] [Green Version]
- Wang, X.; Chapman, M.R. Sequence determinants of bacterial amyloid formation. J. Mol. Biol. 2008, 380, 570–580. [Google Scholar] [CrossRef] [PubMed] [Green Version]
- Sewell, L.; Stylianou, F.; Xu, Y.; Taylor, J.; Sefer, L.; Matthews, S. NMR insights into the pre-amyloid ensemble and secretion targeting of the curli subunit CsgA. Sci. Rep. 2020, 10, 1–10. [Google Scholar] [CrossRef] [PubMed]
- Zhou, Y.; Smith, D.; Leong, B.J.; Brännström, K.; Almqvist, F.; Chapman, M.R. Promiscuous cross-seeding between bacterial amyloids promotes interspecies biofilms. J. Biol. Chem. 2012, 287, 35092–35103. [Google Scholar] [CrossRef] [PubMed] [Green Version]
- Dueholm, M.S.; Albertsen, M.; Otzen, D.; Nielsen, P.H. Curli functional amyloid systems are phylogenetically widespread and display large diversity in operon and protein structure. PLoS ONE 2012, 7, e51274. [Google Scholar] [CrossRef] [PubMed] [Green Version]
- Sampson, T.R.; Challis, C.; Jain, N.; Moiseyenko, A.; Ladinsky, M.S.; Shastri, G.G.; Thron, T.; Needham, B.D.; Horvath, I.; Debelius, J.W.; et al. A gut bacterial amyloid promotes a-synuclein aggregation and motor impairment in mice. eLife 2020, 9, e53111. [Google Scholar] [CrossRef] [PubMed]
- Miller, A.L.; Bessho, S.; Grando, K.; Tükel, Ç. Microbiome or infections: Amyloid-Containing biofilms as a trigger for complex human diseases. Front. Immunol. 2021, 12, 638867. [Google Scholar] [CrossRef] [PubMed]
- Friedland, R.P.; Chapman, M.R. The role of microbial amyloid in neurodegeneration. PLoS Pathog. 2017, 13, e1006654. [Google Scholar] [CrossRef] [PubMed]
- Harrell, J.E.; Hahn, M.M.; D’Souza, S.J.; Vasicek, E.M.; Sandala, J.L.; Gunn, J.S.; McLachlan, J.B. Salmonella biofilm formation, chronic infection, and immunity within the intestine and hepatobiliary tract. Front. Cell. Infect. Microbiol. 2021, 10, 624622. [Google Scholar] [CrossRef]
- Perov, S.; Lidor, O.; Salinas, N.; Golan, N.; Tayeb-Fligelman, E.; Deshmukh, M.; Willbold, D.; Landau, M. Structural insights into curli CsgA cross-β fibril architecture inspire repurposing of anti-amyloid compounds as anti-biofilm agents. PLoS Pathog. 2019, 15, e1007978. [Google Scholar] [CrossRef] [PubMed] [Green Version]
- Altschul, S.F.; Gish, W.; Miller, W.; Myers, E.W.; Lipman, D.J. Basic local alignment search tool. J. Mol. Biol. 1990, 215, 403–410. [Google Scholar] [CrossRef]
- Ahmed, A.B.; Znassi, N.; Château, M.-T.; Kajava, A.V. A structure-based approach to predict predisposition to amyloidosis. Alzheimer’s Dement. 2015, 11, 681–690. [Google Scholar] [CrossRef]
- Gazit, E. A possible role for π-stacking in the self-assembly of amyloid fibrils. FASEB J. 2002, 16, 77–83. [Google Scholar] [CrossRef] [PubMed]
- Guo, M.; Gorman, P.M.; Rico, M.; Chakrabartty, A.; Laurents, D.V. Charge substitution shows that repulsive electrostatic interactions impede the oligomerization of Alzheimer amyloid peptides. FEBS Lett. 2005, 579, 3574–3578. [Google Scholar] [CrossRef] [Green Version]
- Santos, J.; Iglesias, V.; Santos-Suárez, J.; Mangiagalli, M.; Brocca, S.; Pallarès, I.; Ventura, S. pH-dependent aggregation in intrinsically disordered proteins is determined by charge and lipophilicity. Cells 2020, 9, 145. [Google Scholar] [CrossRef] [Green Version]
- Dueholm, M.S.; Nielsen, S.B.; Hein, K.L.; Nissen, P.; Chapman, M.; Christiansen, G.; Nielsen, P.H.; Otzen, D.E. Fibrillation of the major curli subunit CsgA under a wide range of conditions implies a robust design of aggregation. Biochemistry 2011, 50, 8281–8290. [Google Scholar] [CrossRef] [PubMed] [Green Version]
- Burdukiewicz, M.; Sobczyk, P.; Rödiger, S.; Duda-Madej, A.; MacKiewicz, P.; Kotulska, M. Amyloidogenic motifs revealed by n-gram analysis. Sci. Rep. 2017, 7. [Google Scholar] [CrossRef] [PubMed] [Green Version]
- Wojciechowski, J.W.; Kotulska, M. PATH—Prediction of amyloidogenicity by threading and machine learning. Sci. Rep. 2020, 10, 1–9. [Google Scholar] [CrossRef] [PubMed]
- Wozniak, P.P.; Kotulska, M. AmyLoad: Website dedicated to amyloidogenic protein fragments. Bioinformatics 2015, 31, 3395–3397. [Google Scholar] [CrossRef] [PubMed] [Green Version]
- Louros, N.; Konstantoulea, K.; De Vleeschouwer, M.; Ramakers, M.; Schymkowitz, J.; Rousseau, F. WALTZ-DB 2.0: An updated database containing structural information of experimentally determined amyloid-forming peptides. Nucleic Acids Res. 2020, 48, D389–D393. [Google Scholar] [CrossRef] [PubMed]
- Walsh, I.; Seno, F.; Tosatto, S.C.E.; Trovato, A. PASTA 2.0: An improved server for protein aggregation prediction. Nucleic Acids Res. 2014, 42, 301–307. [Google Scholar] [CrossRef]
- Maurer-Stroh, S.; Debulpaep, M.; Kuemmerer, N.; De La Paz, M.L.; Martins, I.C.; Reumers, J.; Morris, K.L.; Copland, A.; Serpell, L.; Serrano, L.; et al. Exploring the sequence determinants of amyloid structure using position-specific scoring matrices. Nat. Methods 2010, 7, 237–242. [Google Scholar] [CrossRef] [PubMed]
- Tsolis, A.C.; Papandreou, N.C.; Iconomidou, V.A.; Hamodrakas, S.J. A consensus method for the prediction of “Aggregation-prone” peptides in globular proteins. PLoS ONE 2013, 8, e54175. [Google Scholar] [CrossRef] [Green Version]
- Garbuzynskiy, S.O.; Lobanov, M.Y.; Galzitskaya, O.V. FoldAmyloid: A method of prediction of amyloidogenic regions from protein sequence. Bioinformatics 2010, 26, 326–332. [Google Scholar] [CrossRef] [PubMed]
- Emily, M.; Talvas, A.; Delamarche, C. MetAmyl: A METa-predictor for AMYLoid proteins. PLoS ONE 2013, 8, e79722. [Google Scholar] [CrossRef] [PubMed]
- Fernandez-Escamilla, A.M.; Rousseau, F.; Schymkowitz, J.; Serrano, L. Prediction of sequence-dependent and mutational effects on the aggregation of peptides and proteins. Nat. Biotechnol. 2004, 22, 1302–1306. [Google Scholar] [CrossRef] [PubMed]
- Jackson, M.P.; Hewitt, E.W. Why are functional amyloids non-toxic in humans? Biomolecules 2017, 7, 71. [Google Scholar] [CrossRef] [PubMed] [Green Version]
- Roberts, R.G. Good amyloid, bad amyloid—What’s the difference? PLoS Biol. 2016, 14, e1002362. [Google Scholar] [CrossRef] [PubMed] [Green Version]
- Sarroukh, R.; Goormaghtigh, E.; Ruysschaert, J.M.; Raussens, V. ATR-FTIR: A “rejuvenated” tool to investigate amyloid proteins. Biochim. Biophys. Acta Biomembr. 2013, 1828, 2328–2338. [Google Scholar] [CrossRef] [PubMed]
- Shivu, B.; Seshadri, S.; Li, J.; Oberg, K.A.; Uversky, V.N.; Fink, A.L. Distinct β-sheet structure in protein aggregates determined by ATR-FTIR spectroscopy. Biochemistry 2013, 52, 5176–5183. [Google Scholar] [CrossRef] [PubMed]
- Ettah, I.; Ashton, L. Engaging with raman spectroscopy to investigate antibody aggregation. Antibodies 2018, 7, 24. [Google Scholar] [CrossRef] [Green Version]
- Ridgley, D.M.; Claunch, E.C.; Barone, J.R. Characterization of large amyloid fibers and tapes with Fourier transform infrared (FT-IR) and raman spectroscopy. Appl. Spectrosc. 2013, 67, 1417–1426. [Google Scholar] [CrossRef]
- Ojha, B.; Fukui, N.; Hongo, K.; Mizobata, T.; Kawata, Y. Suppression of amyloid fibrils using the GroEL apical domain. Sci. Rep. 2016, 6, 1–13. [Google Scholar] [CrossRef] [Green Version]
- Shu, Q.; Crick, S.L.; Pinkner, J.S.; Ford, B.; Hultgren, S.J.; Frieden, C. The E. coli CsgB nucleator of curli assembles to β-sheet oligomers that alter the CsgA fibrillization mechanism. Proc. Natl. Acad. Sci. USA 2012, 109, 6502–6507. [Google Scholar] [CrossRef] [PubMed] [Green Version]
- Zou, Y.; Li, Y.; Hao, W.; Hu, X.; Ma, G. Parallel β-sheet fibril and antiparallel β-sheet oligomer: New insights into amyloid formation of hen egg white lysozyme under heat and acidic condition from FTIR spectroscopy. J. Phys. Chem. B 2013, 117, 4003–4013. [Google Scholar] [CrossRef] [PubMed]
- Seo, J.; Hoffmann, W.; Warnke, S.; Huang, X.; Gewinner, S.; Schöllkopf, W.; Bowers, M.T.; Helden, G.V.; Pagel, K. An infrared spectroscopy approach to follow β-sheet formation in peptide amyloid assemblies. Nat. Chem. 2017, 9, 39–44. [Google Scholar] [CrossRef] [PubMed]
- Sadat, A.; Joye, I.J. Peak fitting applied to Fourier transform infrared and Raman spectroscopic analysis of proteins. Appl. Sci. 2020, 10, 5918. [Google Scholar] [CrossRef]
- Khurana, R.; Fink, A.L. Do parallel β-helix proteins have a unique Fourier transform infrared spectrum? Biophys. J. 2000, 78, 994–1000. [Google Scholar] [CrossRef] [Green Version]
- Berthelot, K.; Ta, H.P.; Géan, J.; Lecomte, S.; Cullin, C. In vivo and in vitro analyses of toxic mutants of HET-s: FTIR antiparallel signature correlates with amyloid toxicity. J. Mol. Biol. 2011, 412, 137–152. [Google Scholar] [CrossRef] [PubMed]
- Requena, J.R.; Wille, H. The structure of the infectious prion protein Experimental data and molecular models. Prion 2014, 8, 60–66. [Google Scholar] [CrossRef] [Green Version]
- Kong, J.; Yu, S. Fourier transform infrared spectroscopic analysis of protein secondary structures. Acta Biochim. Biophys. Sin. 2007, 39, 549–559. [Google Scholar] [CrossRef] [Green Version]
- Evans, M.L.; Chapman, M.R. Curli biogenesis: Order out of disorder. Biochim. Biophys. Acta Mol. Cell Res. 2014, 1843, 1551–1558. [Google Scholar] [CrossRef] [PubMed] [Green Version]
- Van Gerven, N.; Klein, R.D.; Hultgren, S.J.; Remaut, H. Bacterial amyloid formation: Structural insights into curli biogensis. Trends Microbiol. 2015, 23, 693–706. [Google Scholar] [CrossRef] [Green Version]
- Wang, X.; Smith, D.R.; Jones, J.W.; Chapman, M.R. In vitro polymerization of a functional Escherichia coli amyloid protein. J. Biol. Chem. 2007, 282, 3713–3719. [Google Scholar] [CrossRef] [PubMed] [Green Version]
- Cerf, E.; Sarroukh, R.; Tamamizu-Kato, S.; Breydo, L.; Derclaye, S.; Dufrêne, Y.; Narayanaswami, V.; Goormaghtigh, E.; Ruysschaert, J.-M.; Raussens, V. Anti-parallel β-sheet-a signature structure of the oligomeric amyloid-beta peptide. Biochem. J. 2009, 421, 415–423. [Google Scholar] [CrossRef] [PubMed]
- Svozil, J.; Baerenfaller, K. A cautionary tale on the inclusion of variable posttranslational modifications in database-dependent searches of mass spectrometry data. In Methods in Enzymology; Academic Press Inc.: Cambridge, MA, USA, 2017; pp. 433–452. [Google Scholar]
- Wang, H.; Shu, Q.; Frieden, C.; Gross, M.L. Deamidation slows curli amyloid-protein aggregation. Biochemistry 2017, 56, 2865–2872. [Google Scholar] [CrossRef] [PubMed]
- Robinson, A.B.; Mckerrow, J.H.; Cary, P. Controlled deamidation of peptides and proteins: An experimental hazard and a possible biological timer. Proc. Natl. Acad. Sci. USA 1970, 66, 753–757. [Google Scholar] [CrossRef] [PubMed] [Green Version]
- Ruysschaert, J.M.; Raussens, V. ATR-FTIR analysis of amyloid proteins. In Methods in Molecular Biology; Humana Press Inc.: Totowa, NJ, USA, 2018; pp. 69–81. [Google Scholar]
- Milošević, J.; Prodanović, R.; Polović, N. On the protein fibrillation pathway: Oligomer intermediates detection using ATR-FTIR spectroscopy. Molecules 2021, 26, 970. [Google Scholar] [CrossRef] [PubMed]
- Cai, S.; Singh, B.R. A Distinct utility of the amide III infrared band for secondary structure estimation of aqueous protein solutions using partial least squares methods. Biochemistry 2004, 43, 2541–2549. [Google Scholar] [CrossRef] [PubMed]
- Flynn, J.D.; McGlinchey, R.P.; Walker, R.L.; Lee, J.C. Structural features of-synuclein amyloid fibrils revealed by Raman spectroscopy. J. Biol. Chem. 2018, 293, 767–776. [Google Scholar] [CrossRef] [PubMed] [Green Version]
- Ngarize, S.; Herman, H.; Adams, A.; Howell, N. Comparison of changes in the secondary structure of unheated, heated, and high-pressure-treated β-lactoglobulin and ovalbumin proteins using Fourier transform Raman spectroscopy and self-deconvolution. J. Agric. Food Chem. 2004, 52, 6470–6477. [Google Scholar] [CrossRef] [PubMed]
- Devitt, G.; Rice, W.; Crisford, A.; Nandhakumar, I.; Mudher, A.; Mahajan, S. Conformational evolution of molecular signatures during amyloidogenic protein aggregation. ACS Chem. Neurosci. 2019, 10, 4593–4611. [Google Scholar] [CrossRef]
- Signorelli, S.; Cannistraro, S.; Bizzarri, A.R. Structural characterization of the intrinsically disordered protein p53 using Raman spectroscopy. Appl. Spectrosc. 2017, 71, 823–832. [Google Scholar] [CrossRef]
- Celis, F.; Garcia, M.; Diaz-Fleming, G.; Campos-Vallette, M. A review of Raman, SURFACE-enhanced Raman scattering (SERS) and related spectroscopic techniques applied to biomolecules in biomaterials. J. Chil. Chem. Soc. 2017, 62, 3627–3632. [Google Scholar] [CrossRef] [Green Version]
- Takeuchi, H.; Watanabe, N.; Satoh, Y.; Harada, I. Effects of hydrogen bonding on the tyrosine Raman bands in the 1300-1150 cm −1 region. J. Raman Spectrosc. 1989, 20, 233–237. [Google Scholar] [CrossRef]
- Schwenk, N.; Mizaikoff, B.; Cárdenas, S.; López-Lorente, Á.I. Gold-nanostar-based SERS substrates for studying protein aggregation processes. Analyst 2018, 143, 5103–5111. [Google Scholar] [CrossRef] [PubMed]
- JiJi, R.D.; Balakrishnan, G.; Hu, Y.; Spiro, T.G. Intermediacy of poly(L-proline) II and beta-strand conformations in poly(L-lysine) beta-sheet formation probed by temperature-jump/UV resonance Raman spectroscopy. Biochemistry 2006, 45, 34–41. [Google Scholar] [CrossRef] [Green Version]
- Ji, M.; Arbel, M.; Zhang, L.; Freudiger, C.W.; Hou, S.S.; Lin, D.; Yang, X.; Bacskai, B.J.; Xie, X.S. Label-Free imaging of amyloid plaques in Alzheimer’s disease with stimulated raman scattering microscopy. Sci. Adv. 2018, 4. [Google Scholar] [CrossRef] [Green Version]
- Kurouski, D.; Van Duyne, R.P.; Lednev, I.K. Exploring the structure and formation mechanism of amyloid fibrils by Raman spectroscopy: A review. Analyst 2015, 140, 4967–4980. [Google Scholar] [CrossRef]
- Dolui, S.; Mondal, A.; Roy, A.; Pal, U.; Das, S.; Saha, A.; Maiti, N.C. Order, disorder, and reorder state of lysozyme: Aggregation mechanism by raman spectroscopy. J. Phys. Chem. B 2020, 124, 50–60. [Google Scholar] [CrossRef] [PubMed]
- Gras, S.L.; Waddington, L.J.; Goldie, K.N. Transmission electron microscopy of amyloid fibrils. Methods Mol. Biol. 2011, 752, 197–214. [Google Scholar]
- Selivanova, O.M.; Galzitskaya, O.V. Structural polymorphism and possible pathways of amyloid fibril formation on the example of insulin protein. Biochemistry 2012, 77, 1237–1247. [Google Scholar] [CrossRef]
- Gade Malmos, K.; Blancas-Mejia, L.M.; Weber, B.; Buchner, J.; Ramirez-Alvarado, M.; Naiki, H.; Otzen, D. ThT 101: A primer on the use of thioflavin T to investigate amyloid formation. Amyloid 2017, 24, 1–16. [Google Scholar] [CrossRef]
- Manno, M.; Craparo, E.F.; Martorana, V.; Bulone, D.; San Biagio, P.L. Kinetics of insulin aggregation: Disentanglement of amyloid fibrillation from large-size cluster formation. Biophys. J. 2006, 90, 4585–4591. [Google Scholar] [CrossRef] [PubMed] [Green Version]
- Debenedictis, E.P.; Ma, D.; Keten, S. Structural predictions for curli amyloid fibril subunits CsgA and CsgB. RSC Adv. 2017, 7, 48102–48112. [Google Scholar] [CrossRef] [Green Version]
- Debenedictis, E.P.; Keten, S. Mechanical unfolding of alpha-and beta-helical protein motifs. Soft Matter 2019, 15, 1243–1252. [Google Scholar] [CrossRef] [PubMed]
- Tian, P.; Boomsma, W.; Wang, Y.; Otzen, D.E.; Jensen, M.H.; Lindorff-Larsen, K. Structure of a functional amyloid protein subunit computed using sequence variation. J. Am. Chem. Soc. 2015, 137, 22–25. [Google Scholar] [CrossRef] [PubMed]
- Wilkosz, N.; Czaja, M.; Seweryn, S.; Skirlińska-Nosek, K.; Szymonski, M.; Lipiec, E.; Sofińska, K. Molecular Spectroscopic markers of abnormal protein aggregation. Molecules 2020, 25, 2498. [Google Scholar] [CrossRef]
- Desai, S.K.; Padmanabhan, A.; Harshe, S.; Zaidel-Bar, R.; Kenney, L.J. Salmonella biofilms program innate immunity for persistence in Caenorhabditis elegans. Proc. Natl. Acad. Sci. USA 2019, 116, 12462–12467. [Google Scholar] [CrossRef] [Green Version]
- Kumar, D.K.; Choi, S.H.; Washicosky, K.J.; Eimer, W.A.; Tucker, S.; Ghofrani, J.; Lefkowitz, A.; McColl, G.; Goldstein, L.E.; Tanzi, R.E.; et al. Amyloid-β peptide protects against microbial infection in mouse and worm models of Alzheimer’s disease. Sci. Transl. Med. 2016, 8, 340ra72. [Google Scholar] [CrossRef] [PubMed] [Green Version]
- Martins, P.M.; Navarro, S.; Silva, A.; Pinto, M.F.; Sárkány, Z.; Figueiredo, F.; Barbosa Pereira, P.J.; Pinheiro, F.; Bednarikova, Z.; Burdukiewicz, M.; et al. MIRRAGGE—Minimum information required for reproducible AGGregation experiments. Front. Mol. Neurosci. 2020, 13, 222. [Google Scholar] [CrossRef] [PubMed]
- Waterhouse, A.M.; Procter, J.B.; Martin, D.M.A.; Clamp, M.; Barton, G.J. Jalview version 2—A multiple sequence alignment editor and analysis workbench. Bioinformatics 2009, 25, 1189–1191. [Google Scholar] [CrossRef] [Green Version]
- Savitzky, A.; Golay, M.J.E. Smoothing and differentiation of data by simplified least squares procedures. Anal. Chem. 1964, 36, 1627–1639. [Google Scholar] [CrossRef]
- Pedregosa, F.; Varoquaux, G.; Gramfort, A.; Michel, V.; Thirion, B.; Grisel, O.; Blondel, M.; Müller, A.; Nothman, J.; Louppe, G.; et al. Scikit-Learn: Machine learning in python. J. Mach. Learn. Res. 2011, 12, 2825–2830. [Google Scholar]
- Hunter, J.D. Matplotlib: A 2D graphics environment. Comput. Sci. Eng. 2007, 9, 90–95. [Google Scholar] [CrossRef]


| After Dissolving | 30 Days | |||
|---|---|---|---|---|
| cm−1 | Assignment | cm−1 | Assignment | |
| E. coli | ||||
| R1 | 1626 | aggregates | 1679 | turns |
| R2 | 1667 | turns | 1646 | random |
| R3 | 1621 | aggregates | 1679 | turns |
| R4 | 1654 | random | 1642 | random |
| R5 | 1624 | aggregates | 1646 | random |
| S. enterica | ||||
| R1 | 1626 | aggregates | 1679 | turns |
| R2 | 1645 | random | 1646 | random |
| R3 | 1622 | aggregates | 1623 | aggregates |
| R4 | 1622 | aggregates | 1623 | aggregates |
| R5 | 1622 | aggregates | 1624 | aggregates |
| 30 Days | ||
|---|---|---|
| cm−1 | Assignment | |
| E. coli | ||
| R1 | 1668 | β-sheet |
| R2 | 1691 | turns |
| R3 | 1667 | β-sheet |
| R4 | 1669 | β-sheet |
| R5 | 1668, 1680 | β-sheet/turns |
| S. enterica | ||
| R1 | 1670 | β-sheet |
| R2 | 1670, 1697 | β-sheet/turns |
| R3 | 1671 | β-sheet |
| R4 | 1670 | β-sheet |
| R5 | 1670 | β-sheet |
Publisher’s Note: MDPI stays neutral with regard to jurisdictional claims in published maps and institutional affiliations. |
© 2021 by the authors. Licensee MDPI, Basel, Switzerland. This article is an open access article distributed under the terms and conditions of the Creative Commons Attribution (CC BY) license (https://creativecommons.org/licenses/by/4.0/).
Share and Cite
Szulc, N.; Gąsior-Głogowska, M.; Wojciechowski, J.W.; Szefczyk, M.; Żak, A.M.; Burdukiewicz, M.; Kotulska, M. Variability of Amyloid Propensity in Imperfect Repeats of CsgA Protein of Salmonella enterica and Escherichia coli. Int. J. Mol. Sci. 2021, 22, 5127. https://doi.org/10.3390/ijms22105127
Szulc N, Gąsior-Głogowska M, Wojciechowski JW, Szefczyk M, Żak AM, Burdukiewicz M, Kotulska M. Variability of Amyloid Propensity in Imperfect Repeats of CsgA Protein of Salmonella enterica and Escherichia coli. International Journal of Molecular Sciences. 2021; 22(10):5127. https://doi.org/10.3390/ijms22105127
Chicago/Turabian StyleSzulc, Natalia, Marlena Gąsior-Głogowska, Jakub W. Wojciechowski, Monika Szefczyk, Andrzej M. Żak, Michał Burdukiewicz, and Malgorzata Kotulska. 2021. "Variability of Amyloid Propensity in Imperfect Repeats of CsgA Protein of Salmonella enterica and Escherichia coli" International Journal of Molecular Sciences 22, no. 10: 5127. https://doi.org/10.3390/ijms22105127