
Biophysical and Biochemical Comparison of Extracellular Vesicles Produced by Infective and Non-Infective Stages of Trypanosoma cruzi

 , , , , and
Abstract
:1. Introduction
2. Results
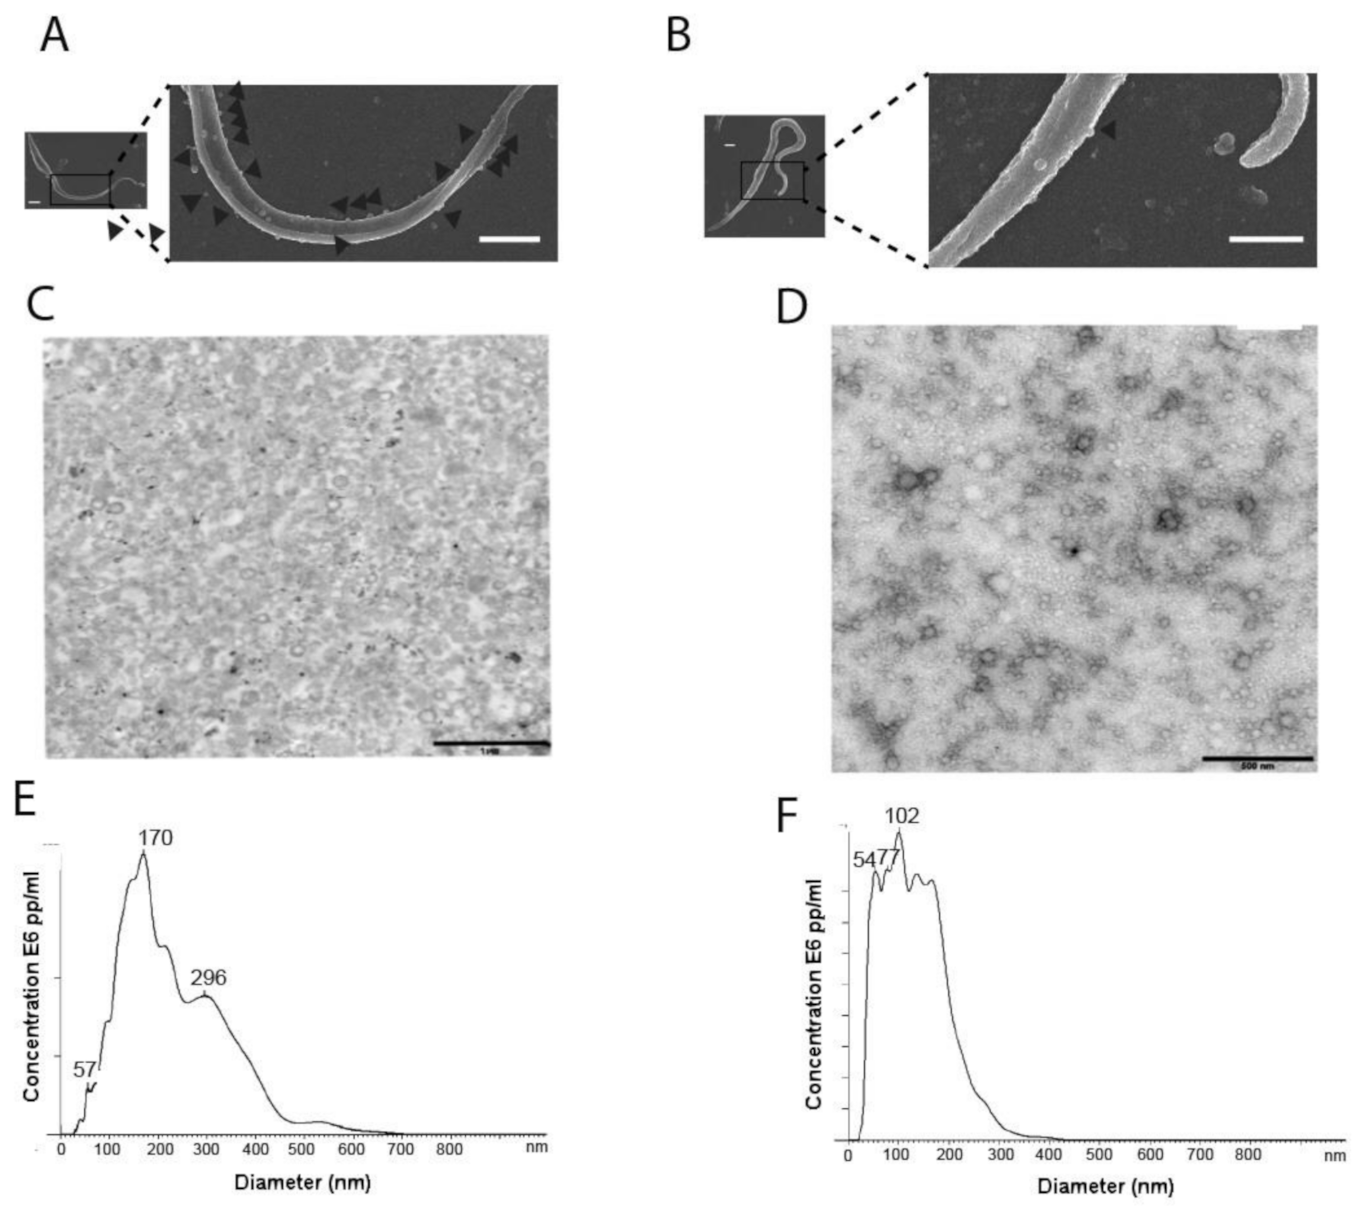
2.1. Purification and Characterization of EVs
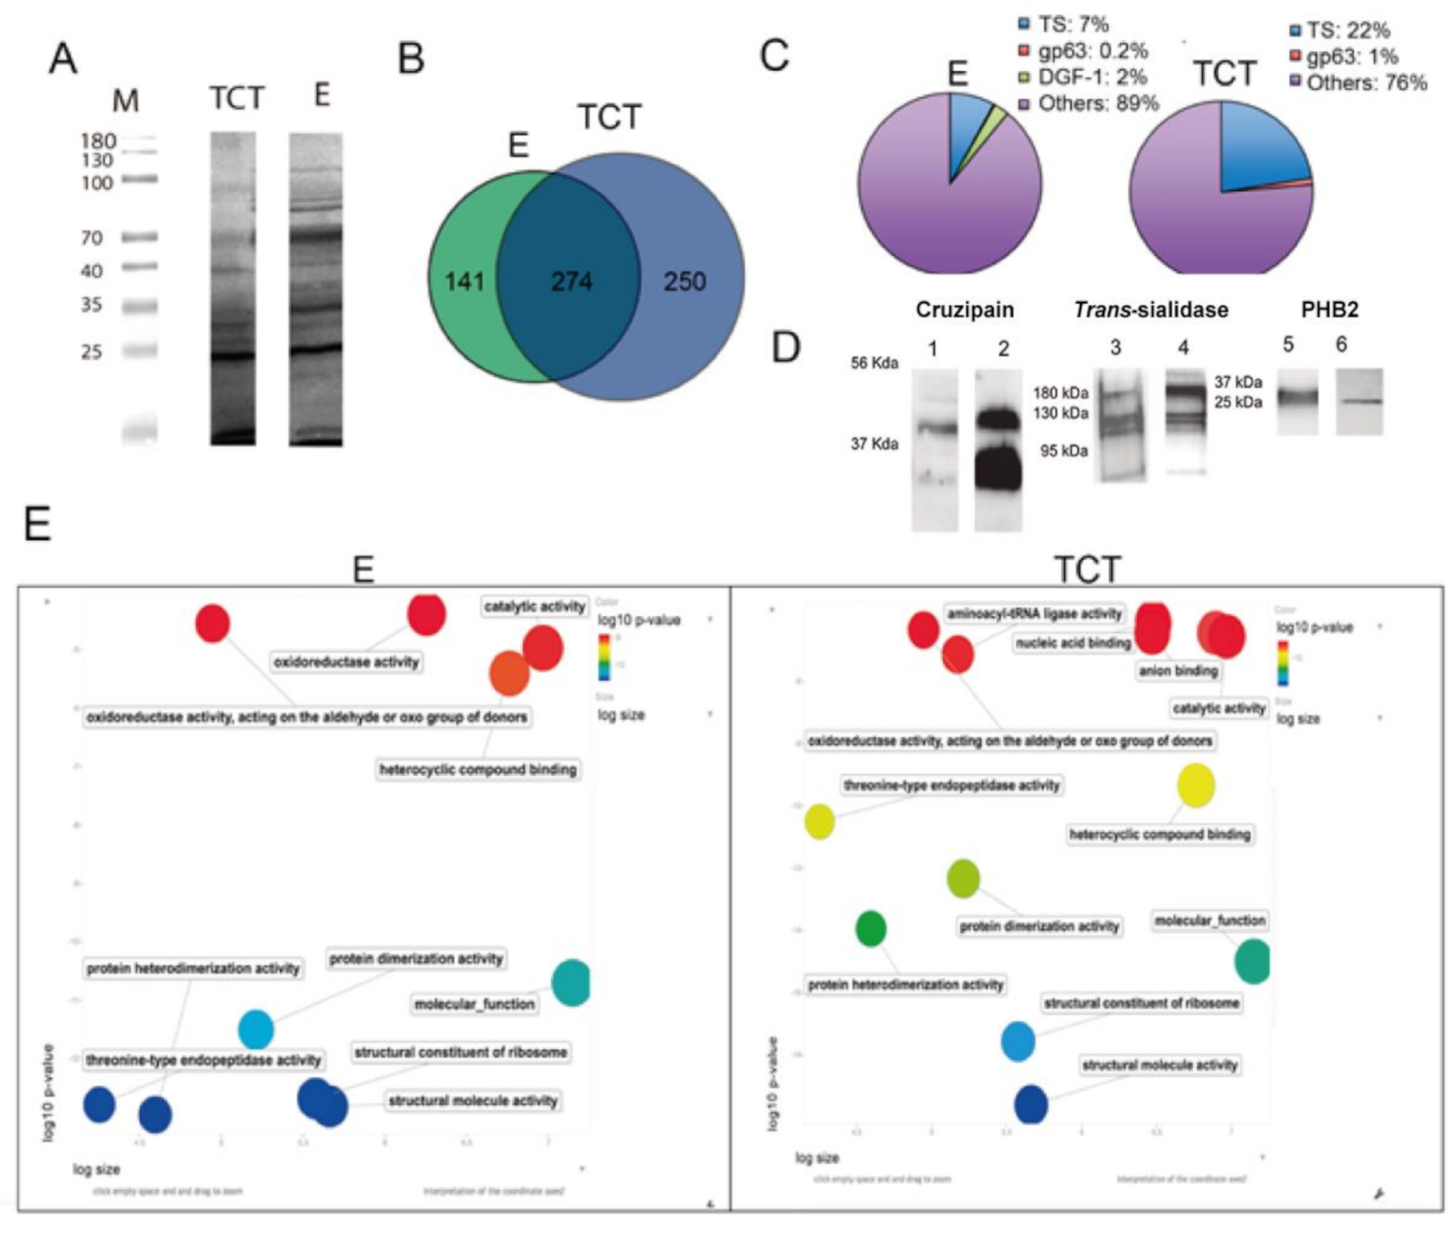
2.2. Proteomic Profile of EVs of E and TCT
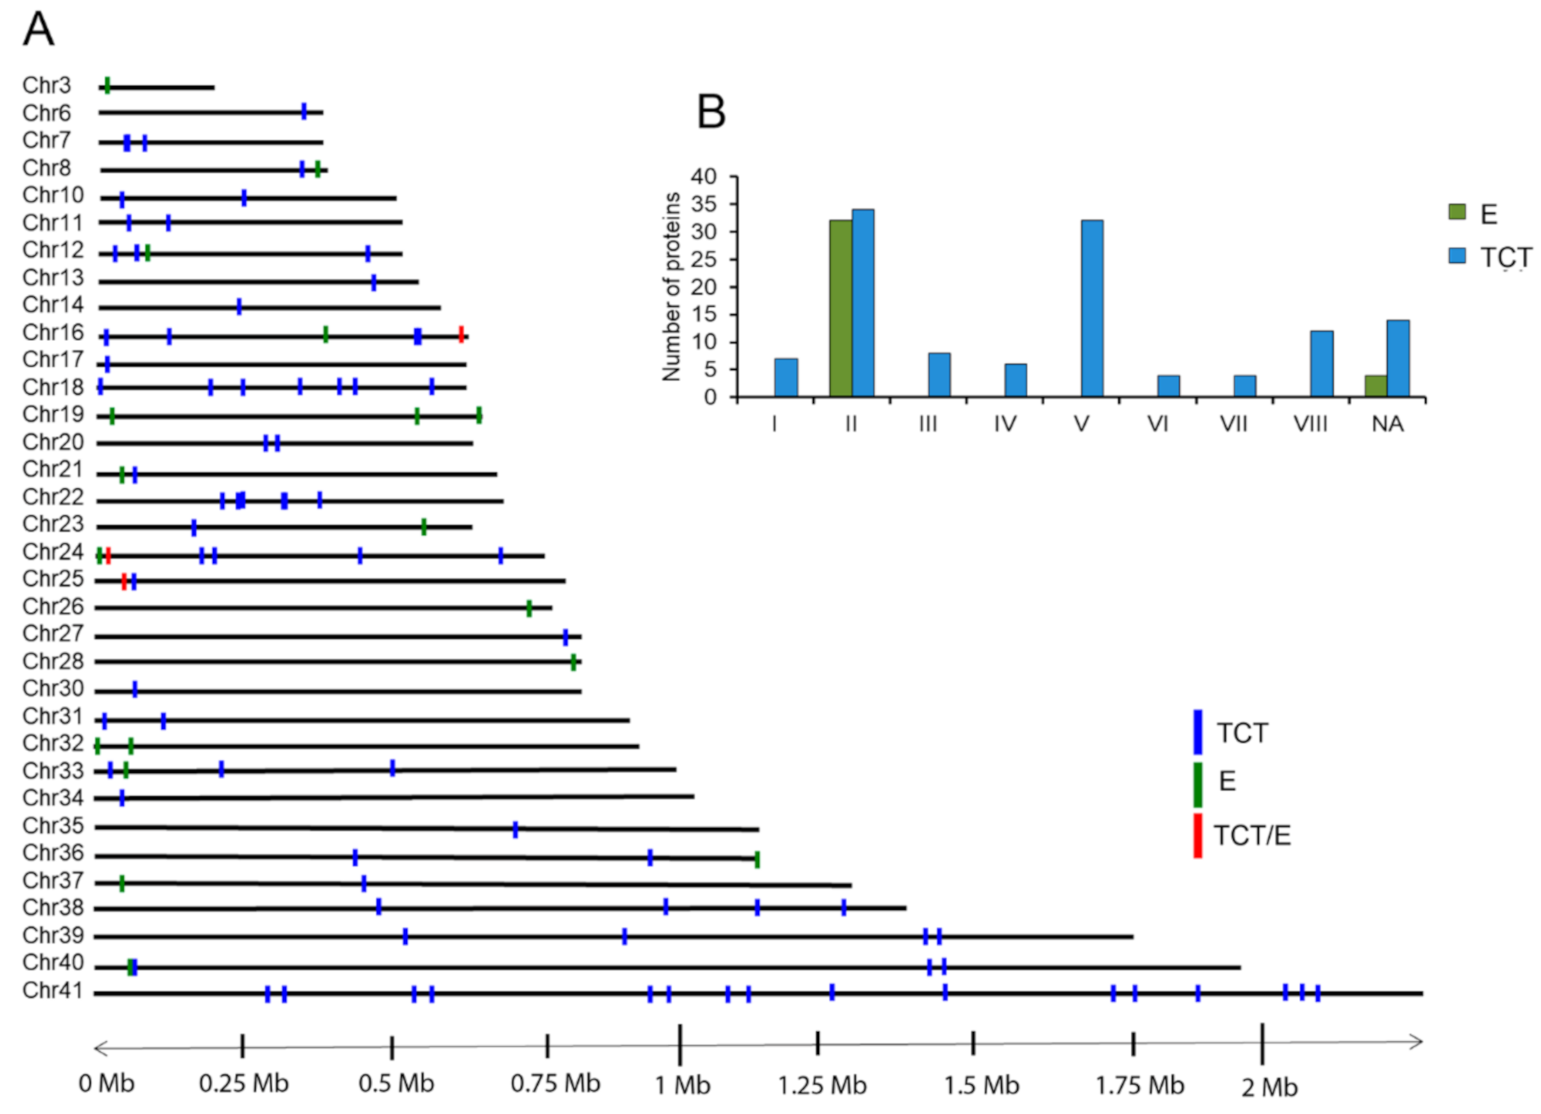
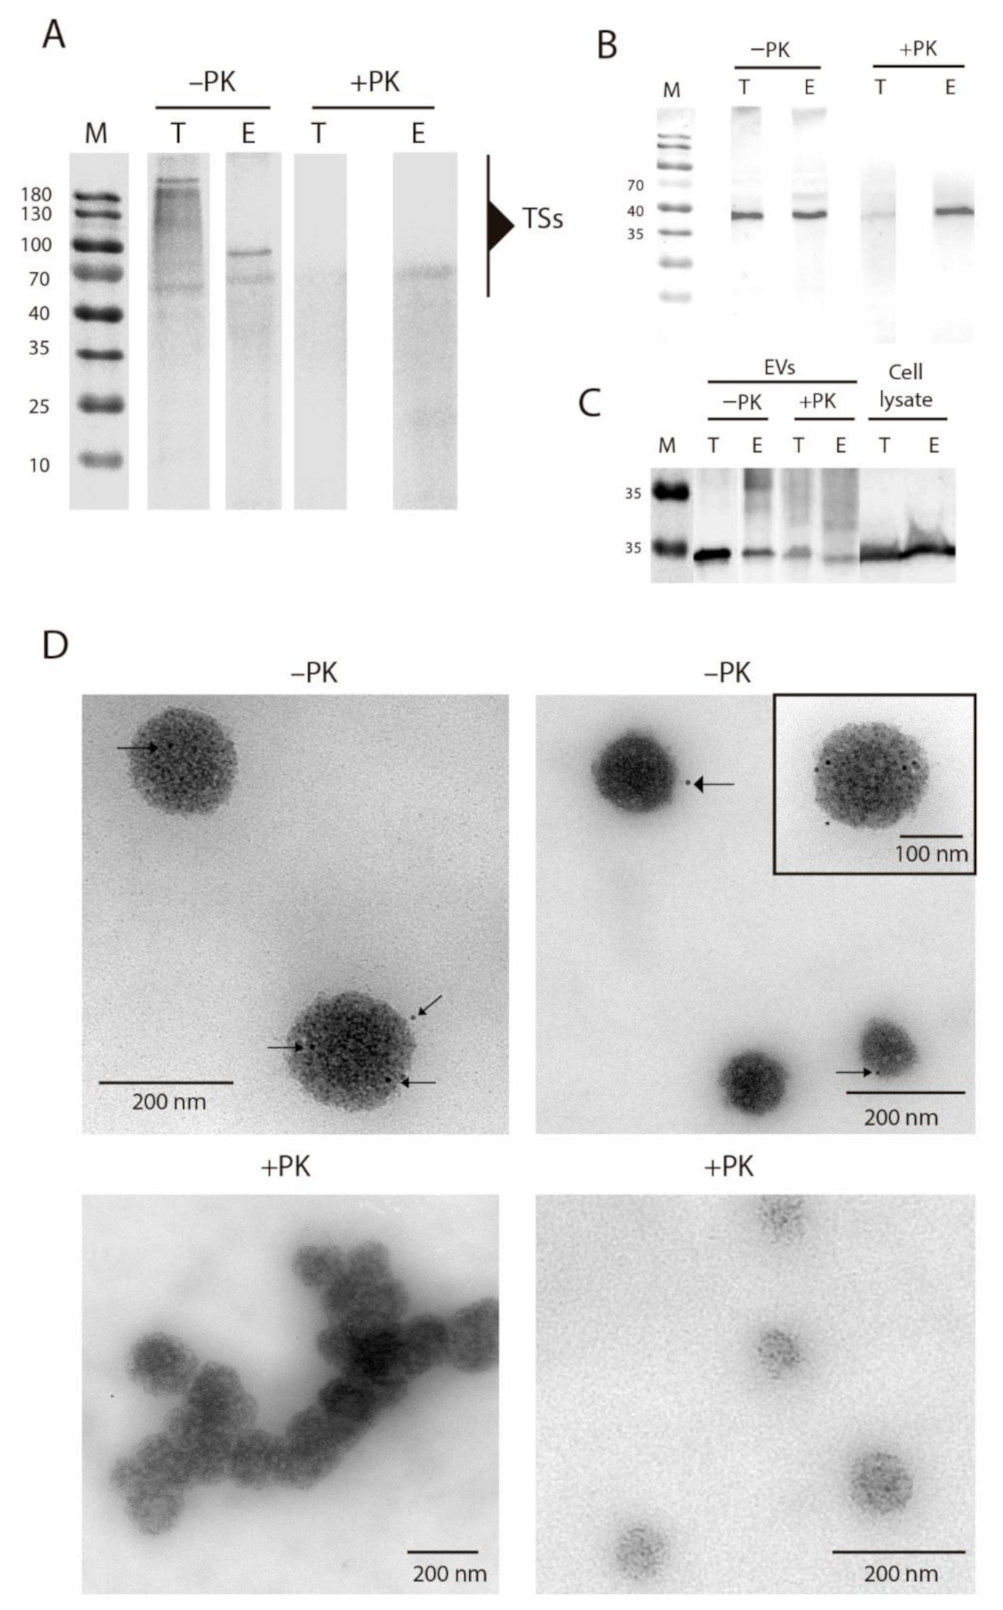
2.3. Composition, Variability and Location of TS Proteins in EVs of E and TCT
2.4. Biophysical Properties of EVs of E and TCT
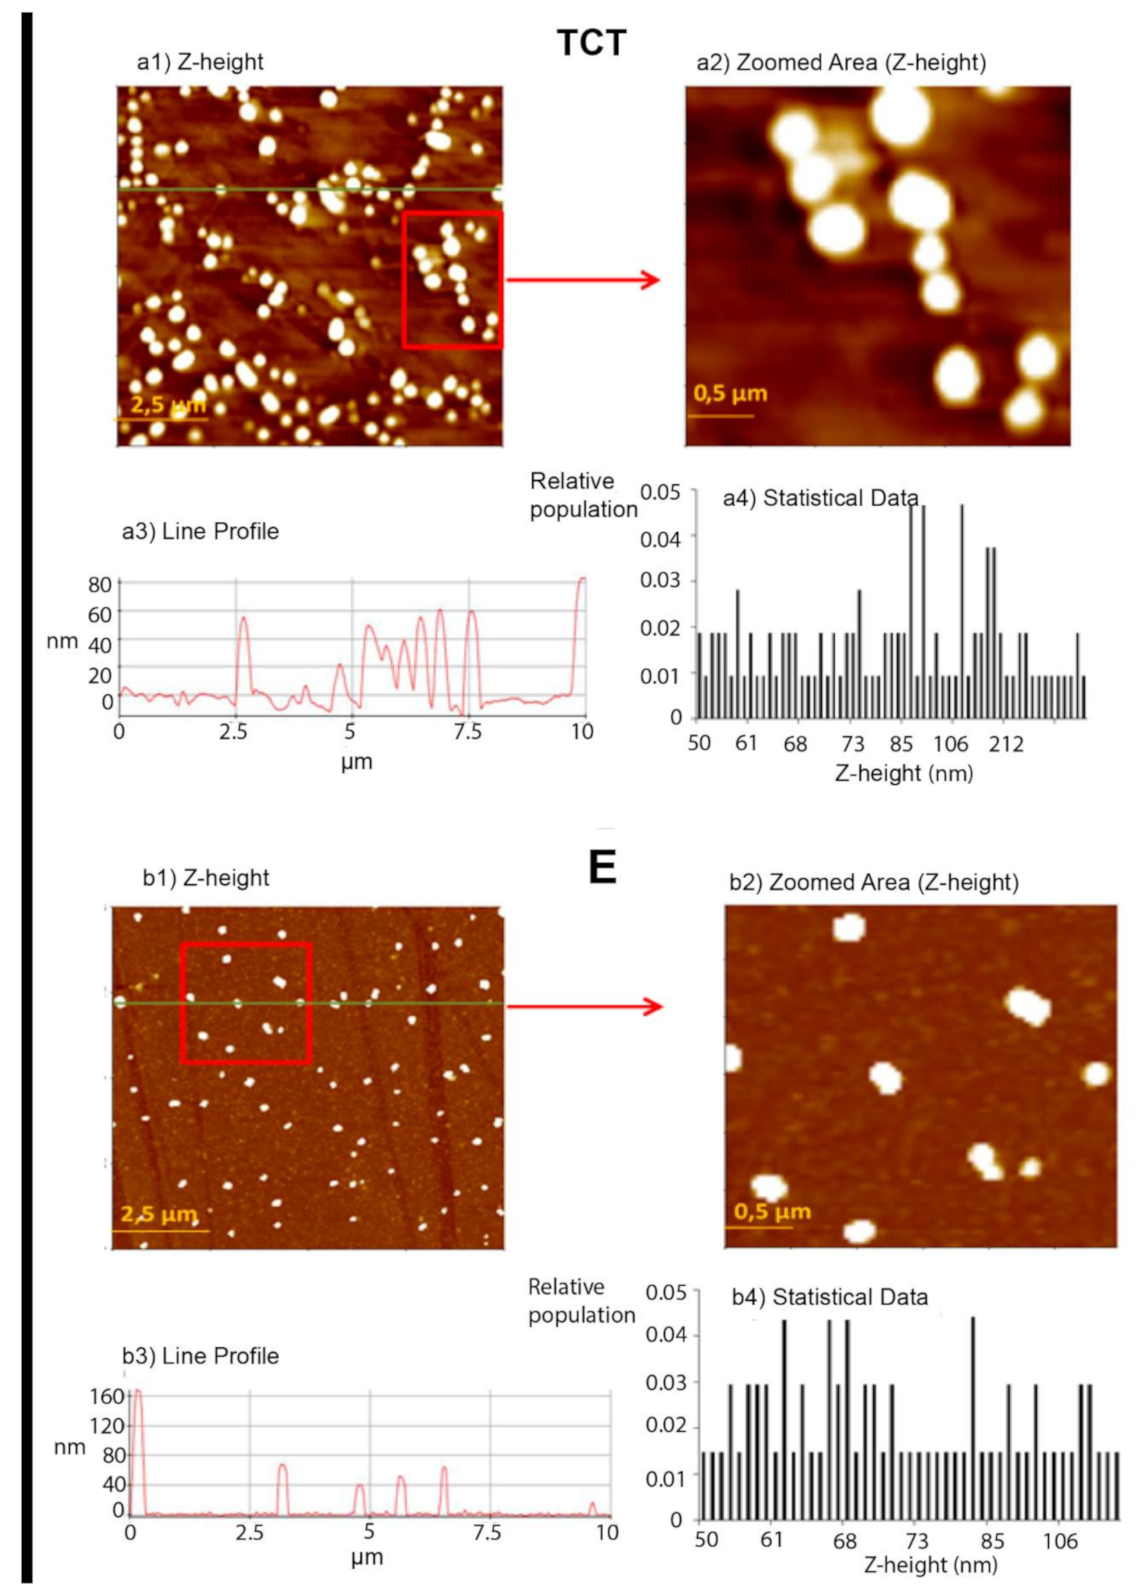
2.4.1. Atomic Force Microscopy (AFM) Analysis
Topographic Measurements and Imaging
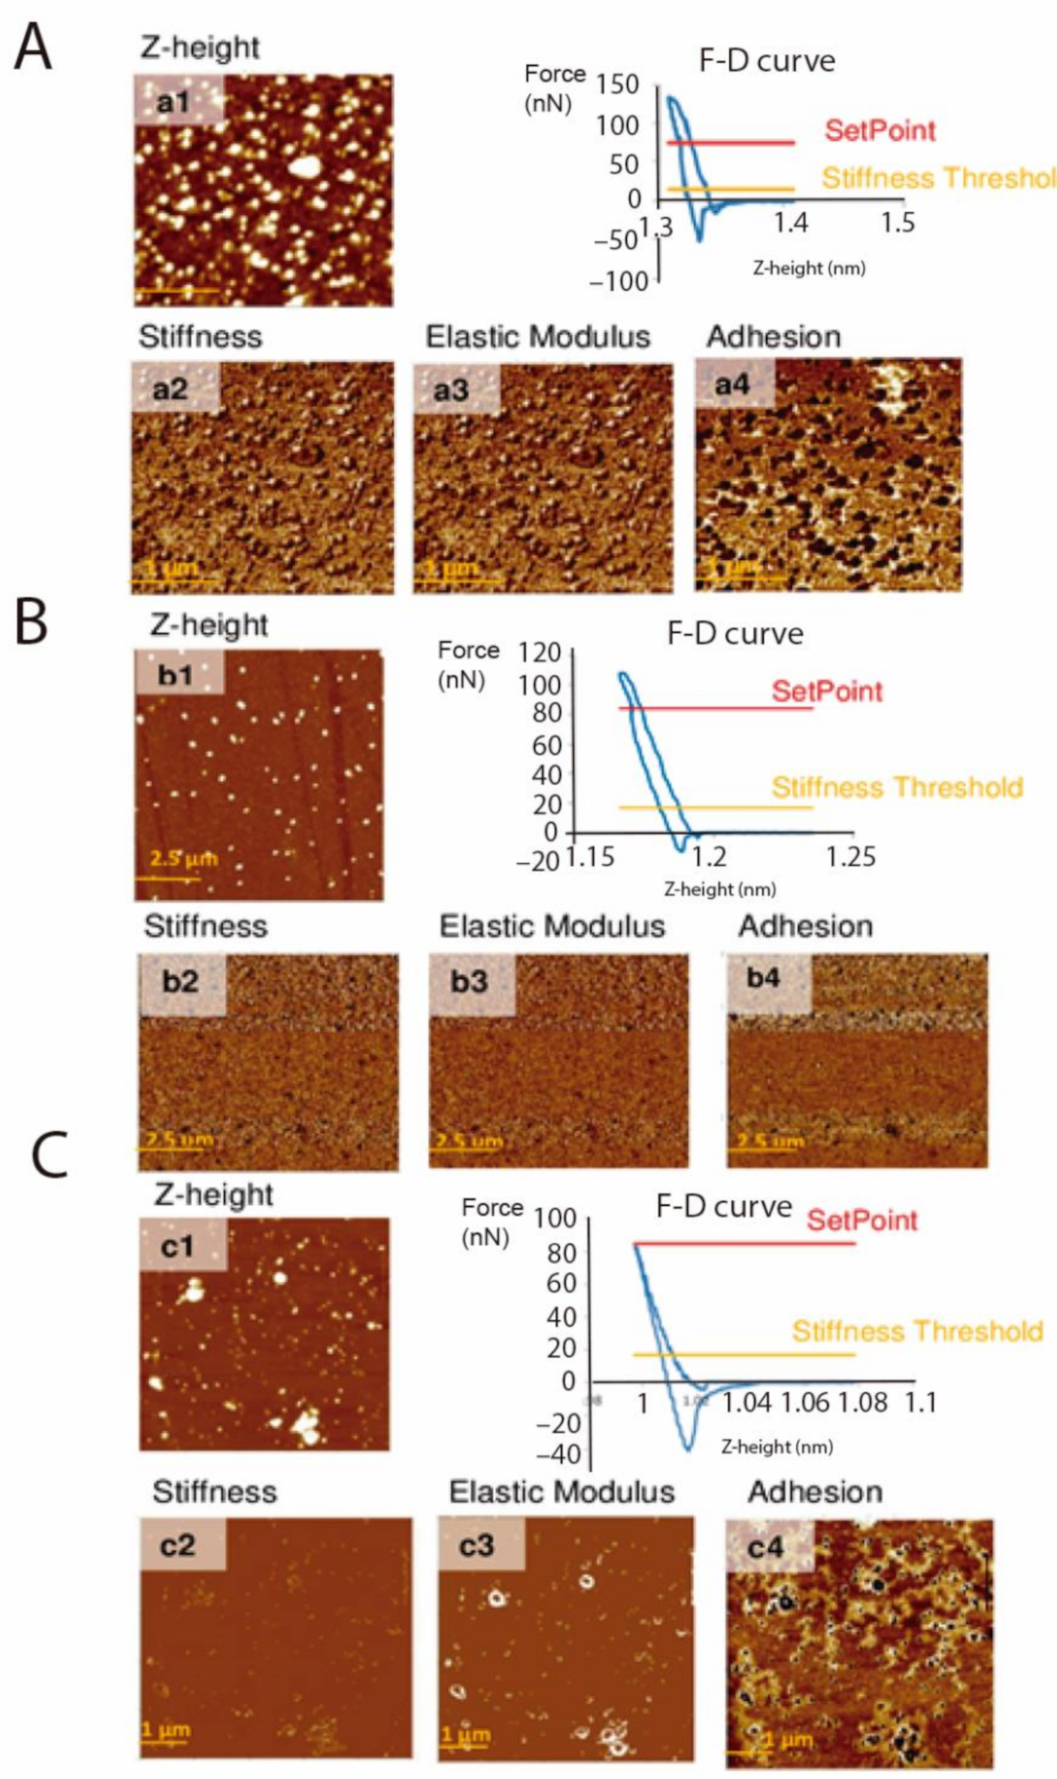
Force Spectroscopy
2.4.2. Measurement of zeta-potential (ZP)
3. Discussion
4. Materials and Methods
4.1. Cell Culture, Parasite Strain and Stages
4.2. Isolation and Purification of EVs of TCT and EVs of E of T. cruzi
4.2.1. Isolation of EVs
4.2.2. Transmission Electron Microscopy
4.2.3. Dynamic Light Scattering and Nanoparticle Tracking Analysis
4.3. Scanning Electron Microscopy of TCT and E
4.4. Enzymatical and Chemical Treatment of EVs
4.5. Proteomic Analyses of EVs from TCT and E
4.6. Bioinformatic Analyses
4.7. Production of Polyclonal Anti-T. cruzi Antibodies
4.8. Western Blotting
4.9. Measurement of Zeta-potential of EVs
4.10. Atomic Force Microscopy
4.10.1. Topographic Measurements and Imaging
4.10.2. Force Spectroscopy
5. Conclusions
Supplementary Materials
Author Contributions
Funding
Institutional Review Board Statement
Informed Consent Statement
Data Availability Statement
Acknowledgments
Conflicts of Interest
References
- Van der Pol, E.; Böing, A.N.; Harrison, P.; Sturk, A.; Nieuwland, R. Classification, functions, and clinical relevance of extracellular vesicles. Pharmacol. Rev. 2012, 64, 676–705. [Google Scholar] [CrossRef] [PubMed] [Green Version]
- Bayer Santos, E.; Lima, F.M.; Ruiz, J.C.; Almeida, I.C.; da Silveira, J.F. Characterization of the small RNA content of Trypanosoma cruzi extracellular vesicles. Mol. Biochem. Parasitol. 2014, 193, 71–74. [Google Scholar] [CrossRef] [PubMed]
- Raposo, G.; Stoorvogel, W. Extracellular vesicles: Exosomes, microvesicles, and friends. J. Cell Biol. 2013, 200, 373–383. [Google Scholar] [CrossRef] [PubMed] [Green Version]
- Wang, J.; Sun, X.; Zhao, J.; Yang, Y.; Cai, X.; Xu, J.; Cao, P. Exosomes: A novel strategy for treatment and prevention of diseases. Front. Pharmacol. 2017, 8, 300. [Google Scholar] [CrossRef] [Green Version]
- Marcilla, A.; Martin Jaular, L.; Trelis, M.; de Menezes Neto, A.; Osuna, A.; Bernal, D.; Fernandez Becerra, C.; Almeida, Igor, C.; del Portillo, H.A. Extracellular vesicles in parasitic diseases. J. Extracell. Vesicles. 2014, 3, 25040. [Google Scholar] [CrossRef] [Green Version]
- De Pablos, L.M.; Retana Moreira, L.; Osuna, A. Exovesicles in Chagas disease: New passengers for an old disease. Front. Microbiol. 2018, 9, 1190. [Google Scholar] [CrossRef] [Green Version]
- Ofir Birin, Y.; Heidenreich, M.; Regev Rudzki, N. Pathogen-derived extracellular vesicles coordinate social behaviour and host manipulation. Semin. Cell Dev. Biol. 2017, 67, 83–90. [Google Scholar] [CrossRef]
- Retana Moreira, L.; Rodríguez Serrano, F.; Osuna, A. Extracellular vesicles of Trypanosoma cruzi: Induction of physiological changes in non-parasitized culture cells. PLoS Negl. Trop. Dis. 2019, 13, e0007163. [Google Scholar] [CrossRef] [Green Version]
- Silverman, J.M.; Clos, J.; de’Oliveira, C.C.; Shirvani, O.; Fang, Y.; Wang, C.; Foster, L.J.; Reiner, N.E. An exosome-based secretion pathway is responsible for protein export from Leishmania and communication with macrophages. J. Cell Sci. 2010, 123, 842–852. [Google Scholar] [CrossRef] [Green Version]
- Atayde, V.D.; Aslan, H.; Townsend, S.; Hassani, K.; Kamhawi, S.; Olivier, M. Exosome secretion by the parasitic protozoan Leishmania within the sand fly midgut. Cell Rep. 2015, 13, 957–967. [Google Scholar] [CrossRef] [Green Version]
- World Health Organization (WHO). Chagas Disease. 2017. Available online: http://www.who.int/mediacentre/factsheets/fs340/en/ (accessed on 8 March 2021).
- Da Silveira, J.; Abrahamsohn, P.; Colli, W. Plasma membrane vesicles isolated from epimastigote forms of Trypanosoma cruzi. Biochim. Biophys. Acta 1979, 550, 222–232. [Google Scholar] [CrossRef]
- Gonçalves, R.L.; Barreto, R.F.; Polycarpo, C.R.; Gadelha, F.R.; Castro, S.L.; Oliveira, M.F. A comparative assessment of mitochondrial function in epimastigotes and bloodstream trypomastigotes of Trypanosoma cruzi. J. Bioenerg. Biomembr. 2011, 43, 651–661. [Google Scholar] [CrossRef]
- Kaneda, Y.; Nagakura, K.; Goutsu, T. Lipid composition of three morphological stages of Trypanosoma cruzi. Comp. Biochem. Physiol. 1986, 83, 533–536. [Google Scholar] [CrossRef]
- Sharma, A.I.; Olson, C.L.; Mamede, J.I.; Gazos-Lopes, F.; Epting, C.L.; Almeida, I.C.; Engman, D.M. Sterol targeting drugs reveal life cycle stage-specific differences in trypanosome lipid rafts. Sci. Rep. 2017, 7, 9105. [Google Scholar] [CrossRef]
- Li, Y.; Shah-Simpson, S.; Okrah, K.; Belew, A.T.; Choi, J.; Caradonna, K.L.; Padmanabhan, P.; Ndegwa, D.M.; Temanni, M.R.; Corrada Bravo, H.; et al. Transcriptome remodeling in Trypanosoma cruzi and human cells during intracellular infection. PLoS Pathog. 2016, 12, e1005511. [Google Scholar] [CrossRef] [Green Version]
- Alves, M.J.; Kawahara, R.; Viner, R.; Colli, W.; Mattos, E.C.; Thaysen-Andersen, M.; Larsen, M.R.; Palmisano, G. Comprehensive glycoprofiling of the epimastigote and trypomastigote stages of Trypanosoma cruzi. J. Proteom. 2017, 151, 182–192. [Google Scholar] [CrossRef]
- Atwood, J.A. The Trypanosoma cruzi proteome. Science 2005, 309, 473–476. [Google Scholar] [CrossRef]
- Schenkman, S.; Ferguson, M.A.; Heise, N.; de Almeida, M.L.; Mortara, R.A.; Yoshida, N. Mucin-like glycoproteins linked to the membrane by glycosylphosphatidylinositol anchor are the major acceptors of sialic acid in a reaction catalyzed by trans-sialidase in metacyclic forms of Trypanosoma cruzi. Mol. Biochem. Parasitol. 1993, 59, 293–303. [Google Scholar] [CrossRef]
- San Francisco, J.; Barría, I.; Gutiérrez, B.; Neira, I.; Muñoz, C.; Sagua, H.; Araya, J.E.; Andrade, J.C.; Zailberger, A.; Catalán, A.; et al. Decreased cruzipain and gp85/trans-sialidase family protein expression contributes to loss of Trypanosoma cruzi trypomastigote virulence. Microbes Infect. 2017, 19, 55–61. [Google Scholar] [CrossRef]
- Tonelli, R.R.; Torrecilhas, A.C.; Jacysyn, J.F.; Juliano, M.A.; Colli, W.; Alves, M.J. In vivo infection by Trypanosoma cruzi: The conserved FLY domain of the gp85/trans-sialidase family potentiates host infection. Parasitology 2011, 138, 481–492. [Google Scholar] [CrossRef]
- Freire de Lima, L.; Fonseca, L.; Oeltmann, T.; Mendonça Previato, L.; Previato, J. The trans-sialidase, the major Trypanosoma cruzi virulence factor: Three decades of studies. Glycobiology 2015, 25, 1142–1149. [Google Scholar] [CrossRef] [Green Version]
- Lantos, A.B.; Carlevaro, G.; Araoz, B.; Ruiz Diaz, P.; Camara Mde, L.; Buscaglia, C.A.; Bossi, M.; Yu, H.; Chen, X.; Bertozzi, C.R.; et al. Sialic acid glycobiology unveils Trypanosoma cruzi trypomastigote membrane physiology. PLoS Pathog. 2016, 12, e1005559. [Google Scholar] [CrossRef] [Green Version]
- Bayer Santos, E. Proteomic analysis of Trypanosoma cruzi secretome: Characterization of two populations of extracellular vesicles and soluble proteins. J. Proteome Res. 2013, 12, 883–897. [Google Scholar] [CrossRef]
- Cestari, I.; Ansa Addo, E.; Deolindo, P.; Inal, J.M.; Ramirez, M.I. Trypanosoma cruzi immune evasion mediated by host cell-derived microvesicles. J. Immunol. 2012, 188, 1942–1952. [Google Scholar] [CrossRef] [Green Version]
- Ramirez, M.I.; Deolindo, P.; de Messias-Reason, I.J.; Arigi, E.A.; Choi, H.; Almeida, I.C.; Evans-Osses, I. Dynamic flux of microvesicles modulate parasite-host cell interaction of Trypanosoma cruzi in eukaryotic cells. Cell. Microbiol. 2016, 19, e12672. [Google Scholar] [CrossRef]
- Freitas, L.M.; dos Santos, S.L.; Rodrigues-Luiz, G.F.; Mendes, T.A.; Rodrigues, T.S.; Gazzinelli, R.T.; Teixeira, S.M.; Fujiwara, R.T.; Bartholomeu, D.C. Genomic analyses, gene expression and antigenic profile of the trans-sialidase superfamily of Trypanosoma cruzi reveal an undetected level of complexity. PLoS ONE 2011, 6, e25914. [Google Scholar] [CrossRef] [Green Version]
- Schenkman, S.; Pontes de Carvalho, L.; Nussenzweig, V. Trypanosoma cruzi trans-sialidase and neuraminidase activities can be mediated by the same enzymes. J. Exp. Med. 1992, 175, 567–575. [Google Scholar]
- Akers, J.C.; Gonda, D.; Kim, R.; Carter, B.S.; Chen, C.C. Biogenesis of extracellular vesicles (EV): Exosomes, microvesicles, retrovirus-like vesicles, and apoptotic bodies. J. Neuro Oncol. 2013, 113, 1–11. [Google Scholar] [CrossRef] [Green Version]
- Théry, C.; Ostrowski, M.; Segura, E. Membrane vesicles as conveyors of immune responses. Nat. Rev. Immunol. 2009, 9, 581–593. [Google Scholar] [CrossRef]
- Sharma, S.; Rasool, H.I.; Palanisamy, V.; Mathisen, C.; Schmidt, M.; Wong, D.T.; Gimzewski, J.K. Structural-mechanical characterization of nanoparticle exosomes in human saliva, using correlative AFM, FESEM, and Force Spectroscopy. ACS Nano 2010, 4, 1921–1926. [Google Scholar] [CrossRef] [Green Version]
- Woo, J.; Sharma, S.; Gimzewski, J. The role of isolation methods on a nanoscale surface structure and its effect on the size of exosomes. J. Circ. Biomark. 2016, 5, 11. [Google Scholar] [CrossRef] [PubMed] [Green Version]
- Midekessa, G.; Godakumara, K.; Ord, J.; Viil, J.; Lättekivi, F.; Dissanayake, K.; Kopanchuk, S.; Rinken, A.; Andronowska, A.; Bhattacharjee, S.; et al. Zeta potential of extracellular vesicles: Toward understanding the attributes that determine colloidal stability. ACS Omega 2020, 5, 16701–16710. [Google Scholar] [CrossRef] [PubMed]
- Beit Yannai, E.; Tabak, S.; Stamer, W.D. Physical exosome:exosome interactions. J. Cell. Mol. Med. 2018, 22, 2001–2006. [Google Scholar] [CrossRef] [PubMed] [Green Version]
- Akagi, T.; Ichiki, T.; Ohshima, H. Evaluation of Zeta potential of individual exosomes secreted from biological cells using a microcapillary electrophoresis Chip. Encycl. Biocolloid Biointerface Sci. 2016. [Google Scholar] [CrossRef]
- Whitehead, B.; Wu, L.; Hvam, M.L.; Aslan, H.; Dong, M.; Dyrskjøt, L.; Ostenfeld, M.S.; Moghimi, S.M.; Howard, K.A. Tumour exosomes display differential mechanical and complement activation properties dependent on malignant state: Implications in endothelial leakiness. J. Extracell. Vesicles 2015, 4, 29685. [Google Scholar] [CrossRef]
- Wang, H.; Zhang, M.; Bianchi, M.; Sherry, B.; Sama, A.; Tracey, K.J. Fetuin (alpha2-HS-glycoprotein) opsonizes cationic macrophage deactivating molecules. Proc. Natl. Acad. Sci. USA 1998, 95, 14429–14434. [Google Scholar] [CrossRef] [Green Version]
- Torrecilhas, A.C.; Soares, R.P.; Schenkman, S.; Fernández Prada, C.; Olivier, M. Extracellular vesicles in trypanosomatids: Host cell communication. Front. Cell. Infect. Microbiol. 2020. [Google Scholar] [CrossRef]
- El-Sayed, N.M.; Myler, P.J.; Bartholomeu, D.C.; Nilsson, D.; Aggarwal, G.; Tran, A.N.; Ghedin, E.; Worthey, E.A.; Delcher, A.L.; Blandin, G. The genome sequence of Trypanosoma cruzi, etiologic agent of Chagas disease. Science 2005, 309, 409–415. [Google Scholar] [CrossRef] [Green Version]
- Herreros Cabello, A.; Callejas Hernández, F.; Gironès, N.; Fresno, M. Trypanosoma Cruzi genome: Organization, multi-gene families, transcription, and biological implications. Genes 2020, 11, 1196. [Google Scholar]
- Schenkman, S.; Eichinger, D.; Pereira, M.E.; Nussenzweig, V. Structural and functional properties of Trypanosoma trans-sialidase. Annu. Rev. Microbiol. 1994, 48, 499–523. [Google Scholar] [CrossRef]
- Urban, I.; Santurio, L.B.; Chidichimo, A.; Yu, H.; Chen, X.; Mucci, J.; Agüero, F.; Buscaglia, C.A. Molecular diversity of the Trypanosoma cruzi TcSMUG family of mucin genes and proteins. Biochem. J. 2011, 438, 303–313. [Google Scholar] [CrossRef] [Green Version]
- De Lederkremer, R.M.; Agusti, R. Chapter 7 Glycobiology of Trypanosoma cruzi. Adv. Carbohydr. Chem. Biochem. 2009, 62, 311–366. [Google Scholar]
- Tribulatti, M.V.; Mucci, J.; Van Rooijen, N.; Leguizamon, M.S.; Campetella, O. The Trans-sialidase from Trypanosoma cruzi induces thrombocytopenia during acute Chagas’ disease by reducing the platelet sialic acid contents. Infect. Immun. 2005, 73, 201–207. [Google Scholar] [CrossRef] [Green Version]
- De Pablos, L.M.; Osuna, A. multigene families in Trypanosoma cruzi and their role in infectivity. Infect. Immun. 2012, 80, 2258–2264. [Google Scholar] [CrossRef] [Green Version]
- Beucher, M.; Norris, K.A. Sequence diversity of the Trypanosoma cruzi complement regulatory protein family. Infect. Immun. 2008, 76, 750–758. [Google Scholar] [CrossRef] [Green Version]
- Norris, K.A.; Bradt, B.; Cooper, N.R.; So, M. Characterization of a Trypanosoma cruzi C3 binding protein with functional and genetic similarities to the human complement regulatory protein, decay-accelerating factor. J. Immunol. 1991, 147, 2240–2247. [Google Scholar]
- Nardy, A.F.F.R.; Freire de Lima, C.G.; Pérez, A.R.; Morrot, A. Role of Trypanosoma cruzi trans-sialidase on the escape from host immune surveillance. Front. Microbiol. 2016, 7, 348. [Google Scholar] [CrossRef] [Green Version]
- García, G.A.; Joensen, L.G.; Búa, J.; Ainciart, N.; Perry, S.J.; Ruiz, A.M. Trypanosoma cruzi: Molecular identification and characterization of new members of the Tc13 family. Description of the interaction between the Tc13 antigen from Tulahuén strain and the second extracellular loop of the β1-adrenergic receptor. Exp. Parasitol. 2003, 103, 112–119. [Google Scholar] [CrossRef]
- Joensen, L.; Borda, E.; Kohout, T.; Perry, S.; García, G.; Sterin-Borda, L. Trypanosoma cruzi antigen that interacts with the β1-adrenergic receptor and modifies myocardial contractile activity. Mol. Biochem. Parasitol. 2003, 127, 169–177. [Google Scholar] [CrossRef]
- Díaz Lozano, I.M.; De Pablos, L.M.; Longhi, S.A.; Zago, M.P.; Schijman, A.G.; Osuna, A. Immune complexes in chronic Chagas disease patients are formed by exovesicles from Trypanosoma cruzi carrying the conserved MASP N-terminal region. Sci. Rep. 2017, 7, 44451. [Google Scholar] [CrossRef] [Green Version]
- Cura, C.I.; Mejía-Jaramillo, A.M.; Duffy, T.; Burgos, J.M.; Rodriguero, M.; Cardinal, M.V.; Kjos, S.; Gurgel-Gonçalves, R.; Blanchet, D.; De Pablos, L.M. Trypanosoma cruzi I genotypes in different geographic regions and transmission cycles based on a microsatellite motif of the intergenic spacer of spliced leader genes. Int. J. Parasitol. 2010, 40, 1599–1607. [Google Scholar] [CrossRef] [Green Version]
- Osuna, A.; Gamarro, F.; Castanys, S.; Ruiz Perez, L.M. Inhibition of lysosomal fusion by Trypanosoma cruzi in peritoneal macrophages. Int. J. Parasitol. 1986, 16, 629–632. [Google Scholar] [CrossRef]
- Campelo, R.; Díaz Lozano, I.; Figarella, K.; Osuna, A.; Ramírez, J.L. Leishmania major telomerase TERT protein has a nuclear/mitochondrial eclipsed distribution that is affected by oxidative stress. Infect. Immun. 2015, 83, 57–66. [Google Scholar] [CrossRef] [Green Version]
- Moreno, M.L.; Escobar, J.; Finamor, I.; Martinez-Ruiz, A.; Sastre, J. Disulfide stress: A novel type of oxidative stress in acute pancreatitis. Free Radic. Biol. 2014, 70, 265–277. [Google Scholar] [CrossRef]
- Shevchenko, A.; Jensen, O.N.; Podtelejnikov, A.V.; Sagliocco, F.; Wilm, M.; Vorm, O.; Mortensen, P.; Shevchenko, A.; Boucherie, H.; Mann, M. Linking genome and proteome by mass spectrometry: Large-scale identification of yeast proteins from two dimensional gels. Proc. Natl. Acad. Sci. USA 1996, 93, 14440–14445. [Google Scholar] [CrossRef] [Green Version]
- Queiroz, R.M.; Ricart, C.A.; Machado, M.O.; Bastos, I.M.; de Santana, J.M.; de Sousa, M.V.; Roepstorff, P.; Charneau, S. Insight into the exoproteome of the tissue-derived trypomastigote form of Trypanosoma cruzi. Front. Chem. 2016, 4, 42. [Google Scholar] [CrossRef] [PubMed] [Green Version]
- De Pablos, L.M.; González, G.G.; Solano Parada, J.; Seco Hidalgo, V.; Díaz Lozano, I.M.; Gómez Samblás, M.M.; Cruz Bustos, T.; Osuna, A. Differential expression and characterization of a member of the mucin-associated surface protein family secreted by Trypanosoma cruzi. Infect. Immun. 2011, 79, 3993–4001. [Google Scholar] [CrossRef] [Green Version]
- Parisse, P.; Rago, I.; Ulloa Severino, L.; Perissinotto, F.; Ambrosetti, E.; Paoletti, P.; Ricci, M.; Beltrami, A.P.; Cesselli, D.; Casalis, L. Atomic force microscopy analysis of extracellular vesicles. Eur. Biophys. J. 2017, 46, 813–820. [Google Scholar] [CrossRef]


| Sample Type | Stiffness (N m–1) | Elastic Modulus (GPa) | Adhesion (nN) |
|---|---|---|---|
| EVs of TCT | 13.913 ± 02.783 | 1.111 ± 0.218 | 39.667 ± 07.140 |
| EVs of E | 20.471 ± 04.709 | 2.605 ± 0.706 | 19.894 ± 02.163 |
| EVs of TCT +PK | 57.581 ± 05.043 | 6.351 ± 0.896 | 41.200 ± 04.293 |
| Sample Type | Zeta-Potential (mV) |
|---|---|
| EVs of TCT | –16 ± 4 |
| EVs of E | –18 ± 8 |
| EVs of TCT + PK | –18 ± 6 |
| EVs of TCT + SP | –17 ± 4 |
| EVs of TCT + fetuin | –19 ± 5 |
Publisher’s Note: MDPI stays neutral with regard to jurisdictional claims in published maps and institutional affiliations. |
© 2021 by the authors. Licensee MDPI, Basel, Switzerland. This article is an open access article distributed under the terms and conditions of the Creative Commons Attribution (CC BY) license (https://creativecommons.org/licenses/by/4.0/).
Share and Cite
Retana Moreira, L.; Prescilla-Ledezma, A.; Cornet-Gomez, A.; Linares, F.; Jódar-Reyes, A.B.; Fernandez, J.; Ibarrola Vannucci, A.K.; De Pablos, L.M.; Osuna, A. Biophysical and Biochemical Comparison of Extracellular Vesicles Produced by Infective and Non-Infective Stages of Trypanosoma cruzi. Int. J. Mol. Sci. 2021, 22, 5183. https://doi.org/10.3390/ijms22105183
Retana Moreira L, Prescilla-Ledezma A, Cornet-Gomez A, Linares F, Jódar-Reyes AB, Fernandez J, Ibarrola Vannucci AK, De Pablos LM, Osuna A. Biophysical and Biochemical Comparison of Extracellular Vesicles Produced by Infective and Non-Infective Stages of Trypanosoma cruzi. International Journal of Molecular Sciences. 2021; 22(10):5183. https://doi.org/10.3390/ijms22105183
Chicago/Turabian StyleRetana Moreira, Lissette, Alexa Prescilla-Ledezma, Alberto Cornet-Gomez, Fátima Linares, Ana Belén Jódar-Reyes, Jorge Fernandez, Ana Karina Ibarrola Vannucci, Luis Miguel De Pablos, and Antonio Osuna. 2021. "Biophysical and Biochemical Comparison of Extracellular Vesicles Produced by Infective and Non-Infective Stages of Trypanosoma cruzi" International Journal of Molecular Sciences 22, no. 10: 5183. https://doi.org/10.3390/ijms22105183