Article

Both Specific Endothelial and Proximal Tubular Adam17 Deletion Protect against Diabetic Nephropathy

1
Department of Nephrology, Hospital del Mar-Institut Hospital del Mar d’Investigacions Mèdiques, 08003 Barcelona, Spain
2
Institute for Regenerative Medicine (IREM), Faculty of Medicine, University of Zurich, 8952 Schlieren, Switzerland
3
Institute of Parasitology, Vetsuisse Faculty and Faculty of Medicine, University of Zurich, CH-8057 Zurich, Switzerland
4
Department of Cardiovascular Surgery, Charité Universitätsmedizin Berlin, 10117 Berlin, Germany
5
German Heart Center Berlin, Department of Cardiothoracic and Vascular Surgery, 13353 Berlin, Germany
*
Authors to whom correspondence should be addressed.
Current location: Bioscience Cardiovascular, Research and Early Development, Cardiovascular, Renal and Metabolism, R&D BioPharmaceuticals, AstraZeneca, 431 50 Gothenburg, Sweden.
Current location: Nephrology Research Group, Vall d’Hebron Research Institute (VHIR), Nephrology Deparment, Hospital Universitari Vall d’Hebron, Univeristat Autònoma de Barcelona, 08035 Barcelona, Spain.
Int. J. Mol. Sci. 2021, 22(11), 5520; https://doi.org/10.3390/ijms22115520
Submission received: 21 April 2021 / Revised: 17 May 2021 / Accepted: 19 May 2021 / Published: 24 May 2021

Abstract

:
ADAM17 is a disintegrin and metalloproteinase capable of cleaving the ectodomains of a diverse variety of molecules including TNF-α, TGF-α, L-selectin, and ACE2. We have previously demonstrated that renal ADAM17 is upregulated in diabetic mice. The role of endothelial (eAdam17) and proximal tubular (tAdam17) Adam17 deletion in renal histology, modulation of the renin angiotensin system (RAS), renal inflammation, and fibrosis was studied in a mouse model of type 1 Diabetes Mellitus. Moreover, the effect of Adam17 deletion in an in vitro 3D cell culture from human proximal tubular cells under high glucose conditions was evaluated. eAdam17 deletion attenuates renal fibrosis and inflammation, whereas tAdam17 deletion decreases podocyte loss, attenuates the RAS, and decreases macrophage infiltration, α-SMA and collagen accumulation. The 3D in vitro cell culture reinforced the findings obtained in tAdam17KO mice with decreased fibrosis in the Adam17 knockout spheroids. In conclusion, Adam17 deletion either in the endothelial or the tubular cells mitigates kidney injury in the diabetic mice by targeting different pathways. The manipulation of Adam17 should be considered as a therapeutic strategy for treating DN.

1. Introduction

Diabetic nephropathy (DN) is the leading cause of end-stage renal disease in developed countries. Early DN is associated with glomerular injury, hyperfiltration and microalbuminuria, both attributable to podocyte loss, and tubular and endothelial dysfunction [1,2]. DN progression is followed by proteinuria, extracellular matrix deposition, glomerulosclerosis, and tubulointerstitial fibrosis [3,4,5]. Macrophage infiltration in DN characteristically appears in both human and experimental models and it is associated with hypertrophy, hypercellularity, interstitial myofibroblast accumulation, and collagen-IV deposition in the glomeruli and tubulointerstitium [6]. Profibrotic growth factors, such as transforming growth factor β (TGF-β), have a key role in extracellular matrix accumulation in high-glucose environments [7,8].
The disintegrin and metalloproteinase domain 17 (ADAM17) has been shown to be upregulated in kidneys of diabetic mice, contributing to renal inflammation and fibrosis [9,10,11]. In vitro experiments mimicking the diabetic milieu demonstrated an increase in ADAM17 protein expression in podocytes, glomerular endothelial cells, mesangial cells, and tubular epithelial cells [12,13,14]. ADAM17 activity is involved in the shedding of EGFR ligands, inducing TGF-β upregulation and extracellular matrix accumulation [12,15].
Adam17 knockout (Adam17KO) mice presented reduced renal fibrosis and inflammation after acute kidney injury (AKI) induction or angiotensin II (ANG II) infusion [16,17]. Furthermore, the decrease in cleaved tumor necrosis factor alpha (TNF-α) in these mice correlated with renal reduction in pro-inflammatory markers and infiltrating macrophages and neutrophils [16]. ADAM17 expression is increased in endothelial and proximal tubular cells of DN patients [18]. However, the effect of the specific deletion of endothelial or tubular Adam17 on DN has not been previously studied. Here, we elucidate whether specific Adam17 deletion on endothelial or renal proximal tubular cells has a beneficial effect in type 1 diabetic mice. Moreover, we performed an in vitro 3D-cell culture of human proximal tubular cells incubated with high-glucose as a disease model for kidney fibrosis aimed to decipher the effect of Adam17 deletion against a fibrotic diabetic milieu.

2. Results

2.1. Confirmation of Adam17 Deletion on Endothelial and Renal Proximal Tubular Cells

eAdam17 and tAdam17 deletions were confirmed by immunohistochemistry, β-galactosidase staining and Adam17 gene expression. eAdam17KO mice presented reduced ADAM17 expression in the endothelium of the kidney arteries as compared with wild-type mice. Within the kidney tubules, tAdam17KO mice presented reduced ADAM17 protein expression in the proximal tubular cells compared with wild-type mice (Supplementary Figure S1B).
In addition, β-galactosidase staining as control of recombination was performed. tAdam17 mice presented the ROSA26-driven LacZ-Cre reporter with β-galactosidase activity after a STOP codon flanked by loxP sites (Figure S1C). Therefore, only if recombination takes place will positive staining for β-galactosidase be detected. Moreover, we also showed lower Adam17 gene expression in tAdam17KO mice as compared to WT mice (Supplementary Figure S1D).

2.2. Tubular Adam17 Knockout Protects from DN Hyperfiltration

Increased blood glucose levels and decreased body weight (BW) were observed in all diabetic mice. Kidney hypertrophy was calculated by the ratio kidney weight (KW)/BW. Diabetic animals presented a higher KW/BW ratio than their controls in both animal models. Diabetic tAdam17KO mice presented a lower KW/BW ratio when compared with diabetic wild-type mice, suggesting a reduced hypertrophy (Table 1).
Diabetes was associated with increased urine albumin-to-creatinine ratio in both animal models (Supplementary Figure S2).

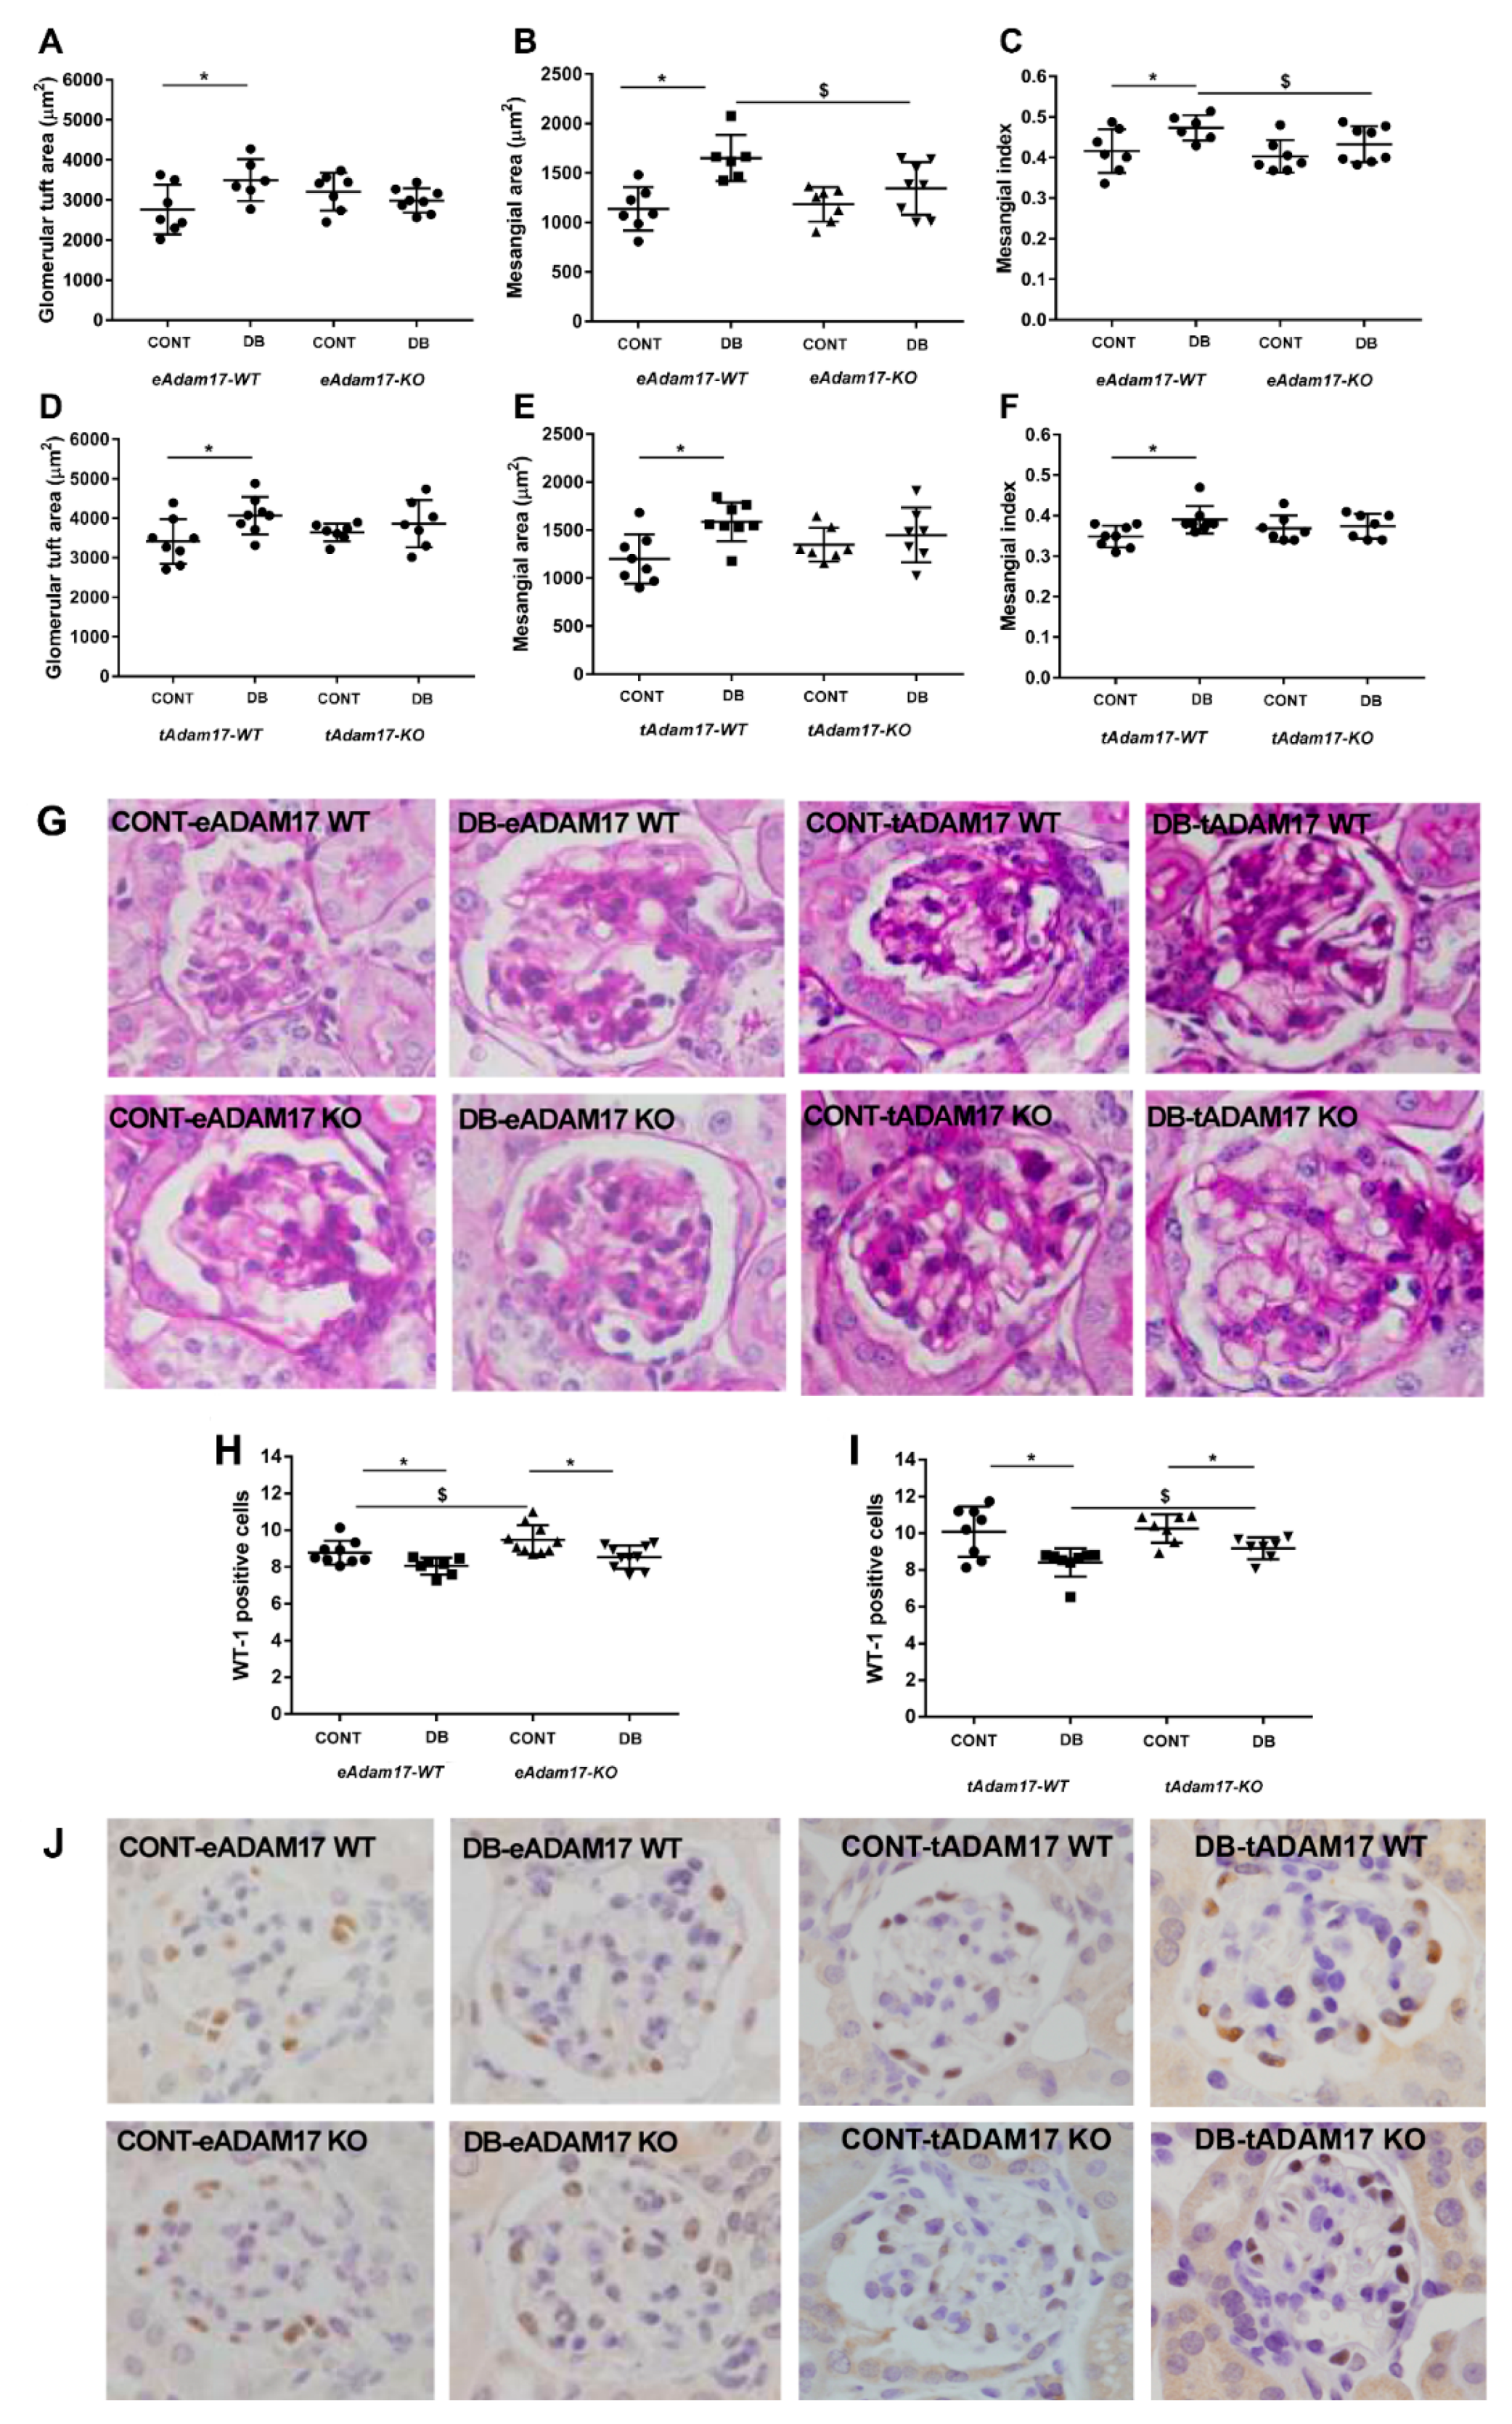
2.3. Diabetic Kidneys of Adam17-Deficient Mice at Either Proximal Tubular Cells or Endothelial Cells Are Protected from Matrix Mesangial Expansion

PAS-stained kidney samples revealed a significant increase in glomerular tuft area, matrix mesangial expansion and mesangial index in all diabetic wild-type mice. This increase was attenuated in diabetic knockout mice (Figure 1A–G). Moreover, among diabetic animals, eAdam17KO mice exhibited a significantly decreased mesangial matrix expansion and mesangial index when compared with wild-type mice (Figure 1B,C).

2.4. Adam17 Deletion in Proximal Tubular Cells Protects against Podocyte Loss

The podocyte number was significantly decreased in diabetic groups. However, diabetic tAdam17KO displayed lower podocyte loss in comparison with diabetic wild-type mice (Figure 1H–J).

2.5. Adam17 Deletion in Proximal Tubular Cells Attenuates the Renin Angiotensin System

Circulating ACE2 enzymatic activity was increased in all diabetic mice. Interestingly, tAdam17 deletion in diabetic mice reduced circulating ACE2 activity when compared with diabetic wild-type mice (Figure 2A,B).
Renal ACE2 enzymatic activity was significantly increased in diabetic mice (Figure 2C,D). eAdam17 deletion exacerbates renal ACE2 activity in such mice (Figure 2C), while tAdam17 deletion attenuates the increase in renal ACE2 activity in diabetic mice (Figure 2D).
We also analysed the gene expression of different RAS components. All diabetic mice presented upregulated Agt gene expression (Supplementary Figure S3). Regarding ANG II receptors, At1r gene expression was downregulated in eAdam17 diabetic mice (Figure 2E). In contrast, At2r gene expression increased in diabetic wild-type mice of both animal models (Figure 2G,H).

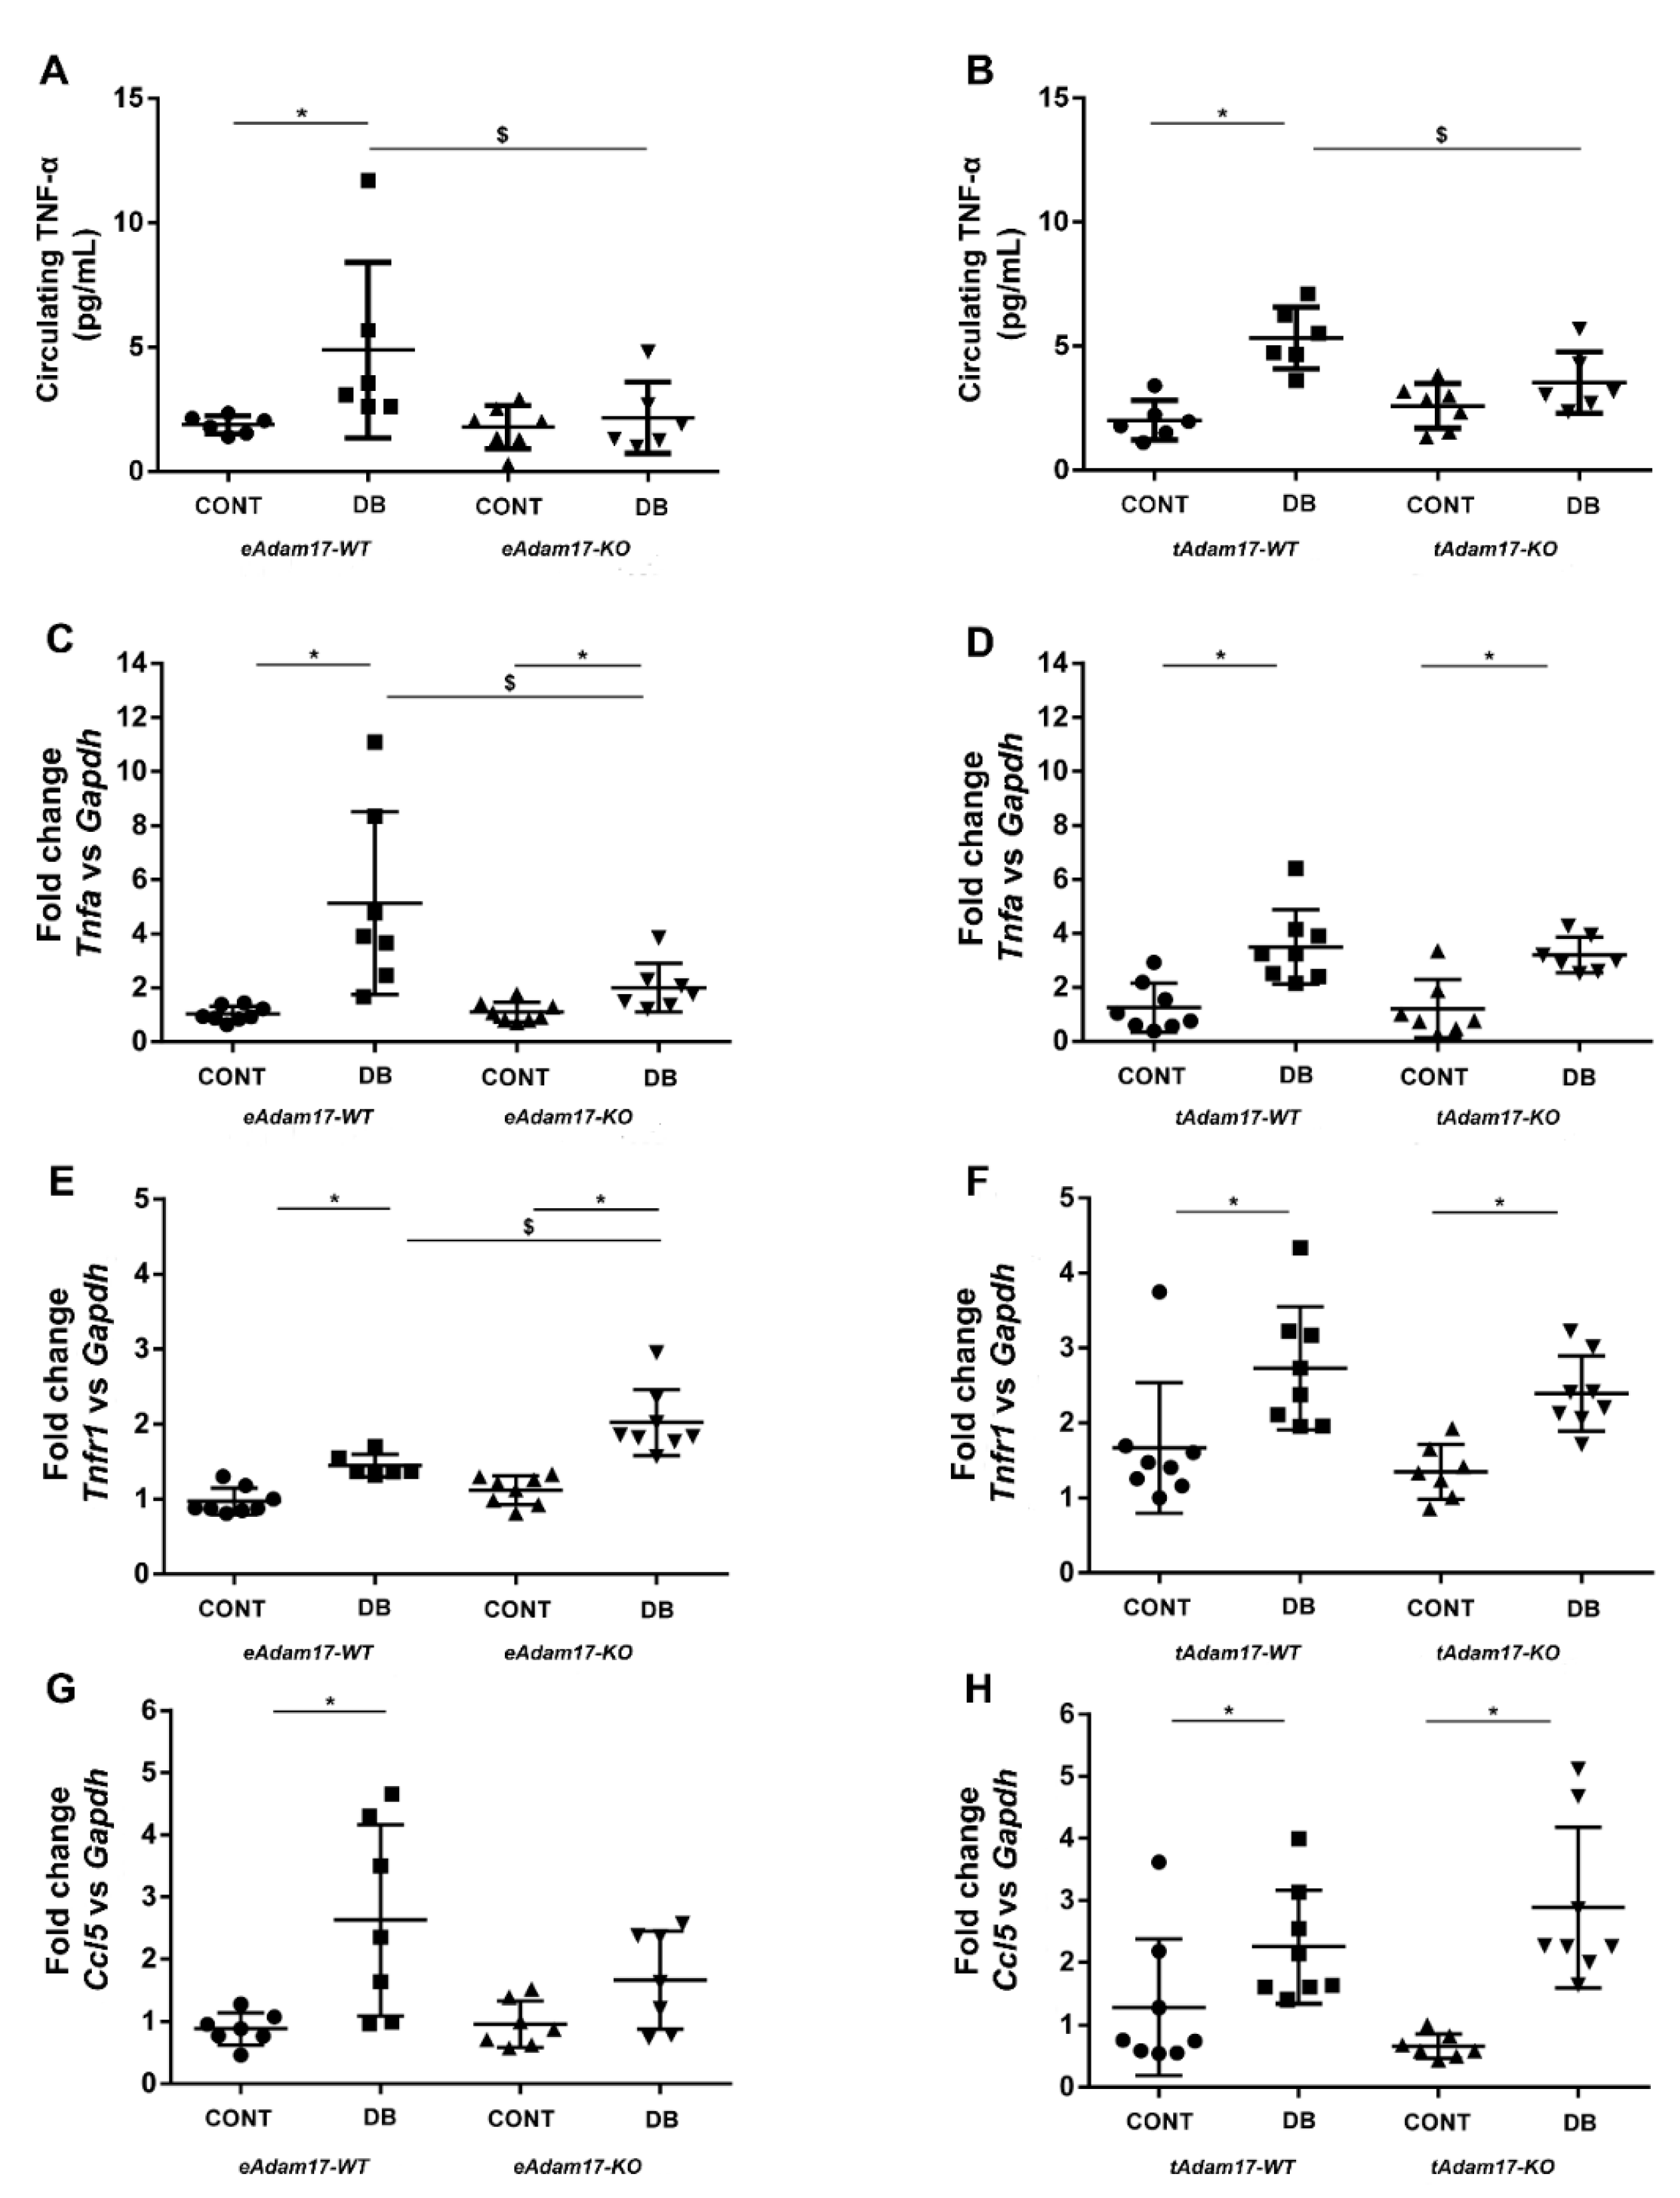
2.6. Adam17 Deletion Decreased Inflammation in DN

To evaluate whether deleting Adam17 in endothelial or proximal tubular cells reduces renal inflammation, we analysed the expression of different pro-inflammatory markers. Circulating TNF-α levels were significantly increased in diabetic wild-type mice in comparison with controls. Interestingly, among diabetic animals, both knockout mice exhibited significantly decreased TNF-α levels when compared with wild-type mice (Figure 3A,B). Moreover, hyperglycaemia was accompanied by a significant increase in mRNA levels of Tnfα (Figure 3C,D). Similarly, Tnfr1 expression was upregulated in all diabetic mice (Figure 3E,F). Interestingly, diabetic eAdam17KO mice presented decreased Tnf-α (Figure 3C) and increased Tnfr1 (Figure 3E) gene expression when compared with eAdam17WT mice.
A similar pattern was observed for chemokine Ccl5 ((C-C motif) ligand 5) gene expression. While hyperglycaemia induced an increase in Ccl5 gene expression, Adam17 deletion in endothelial cells attenuates Ccl5 upregulation in diabetic mice (Figure 3G).
Macrophage infiltration in the kidney was assessed by F4/80 protein detection. In both strains, F4/80 staining was increased in wild-type diabetic mice as compared to controls. Adam17 deletion either in endothelial or proximal tubular cells reduced macrophage infiltration in diabetic mice in comparison with diabetic wild-type mice (Figure 4).

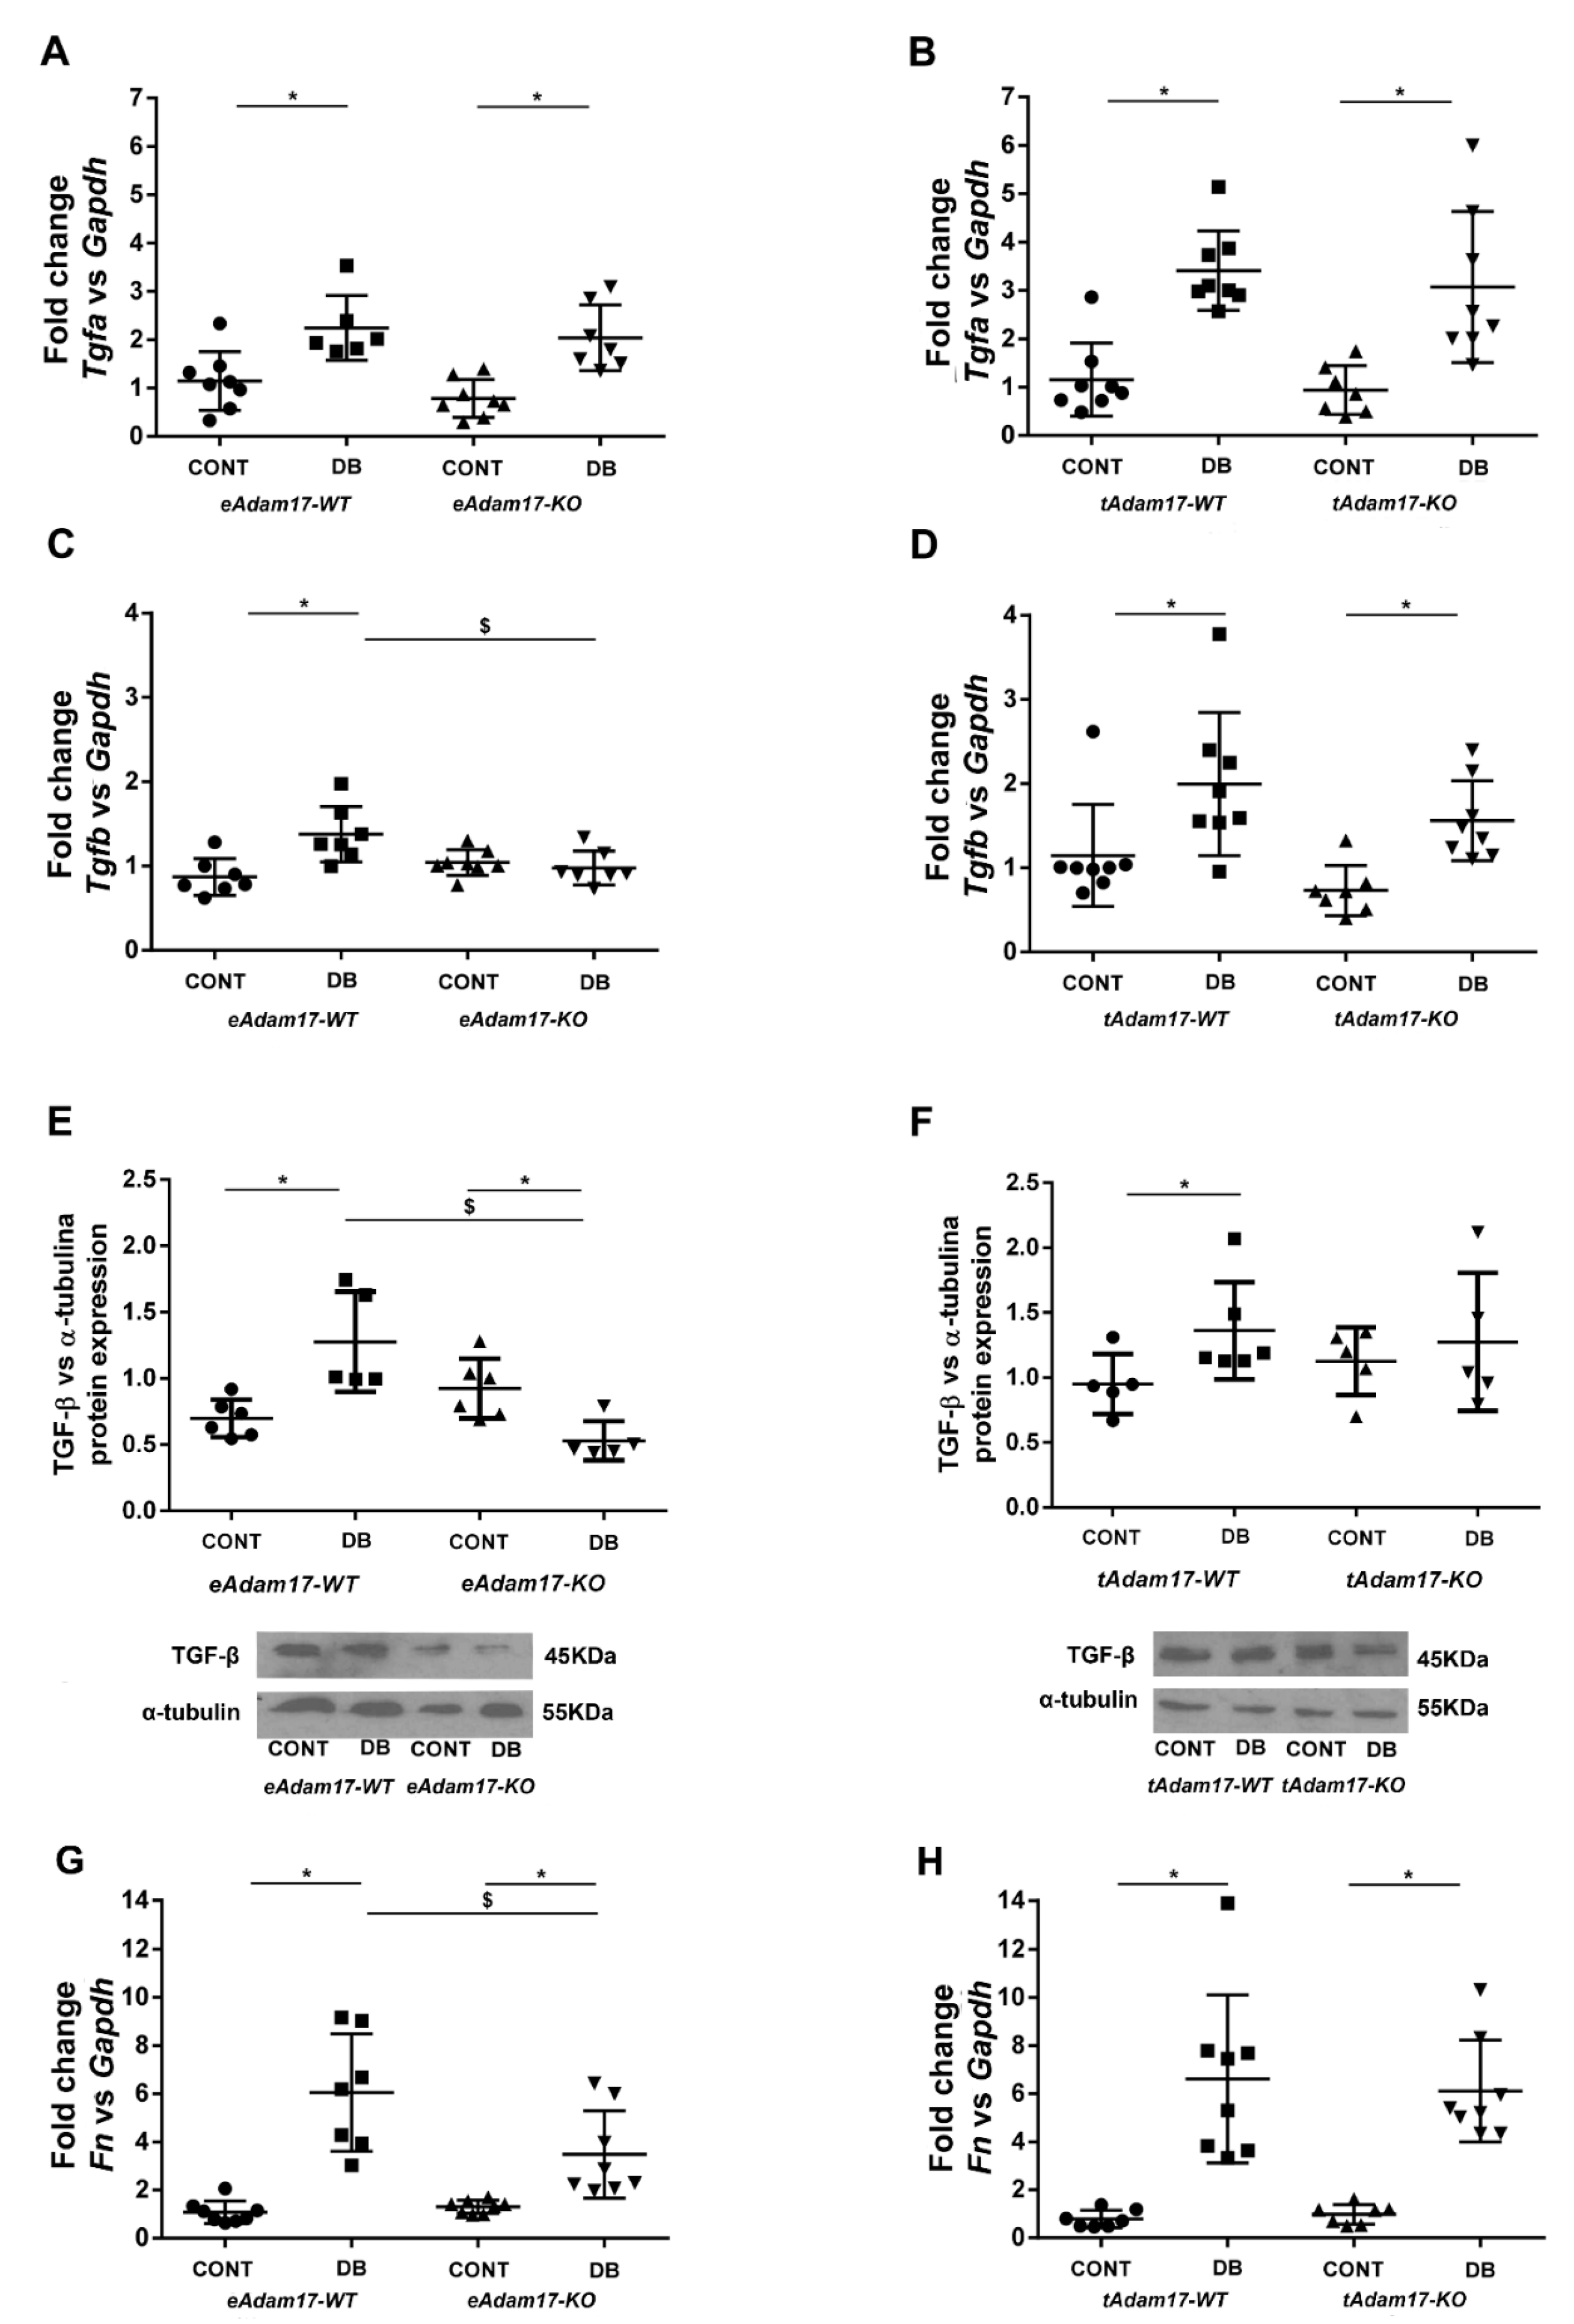
2.7. Diabetic Kidneys of Adam17 Deficient Mice in Either Proximal Tubular Cells or Endothelial Cells Are Protected from Renal Fibrosis

To establish whether Adam17 deletion ameliorates renal fibrosis, gene expression for different fibrotic markers related to EGFR signaling pathways was studied. Tgfα and Hb-egf gene expression were analysed as substrates of the EGFR signaling pathway. In both strains, Tgfα gene expression was increased in all diabetic mice (Figure 5A,B). However, no differences were observed between groups regarding Hb-egf gene expression (Supplementary Figure S4).
For downstream effectors of the EGFR signaling pathway, we observed downregulated Tgfβ gene expression in diabetic mice except for the eAdam17KO mice. Interestingly, only eAdam17 deletion ameliorated the diabetes effect on renal Tgfβ gene expression (Figure 5C,D). At the protein level, only diabetic wild-type mice increased TGF-β (Figure 5E,F). Surprisingly, diabetic eAdam17KO mice presented lower TGF-β protein expression than control mice (Figure 5E). Moreover, both endothelial and proximal tubular Adam17 deletion reduced or attenuated TGF-β production in diabetic mice.
An increase in Fn gene expression was seen in all diabetic mice and Fn gene expression was attenuated only in diabetic eAdam17KO mice (Figure 5).
To gain an insight into the role of Adam17 deletion on renal fibrosis, we examined cortical α-SMA expression and collagen depositions in the studied groups. As depicted in Figure 5A–C, diabetes induced α-SMA accumulation in the interstitial compartment of both animal models. However, this effect was subtly lost on diabetic eAdam17 knockout mice (Figure 6A).
In concordance with gene expression data, semiquantitative scoring of collagen deposition showed increased accumulation of collagen fibres in diabetic mice. In contrast to the gene expression profiles, collagen accumulation was downregulated by endothelial and proximal tubular Adam17 deletion in diabetic mice (Figure 6D–F).
PI3K/Akt signaling pathway is the downstream mediator of the EGFR, important in glucose-induced pro-fibrotic responses in the kidney. While all diabetic mice exhibited a significantly increased pAkt/Akt ratio in renal tissue, eAdam17 deletion attenuated diabetes’ effect on pAkt/Akt ratio (Figure 6).

2.8. Fibrotic Markers Expression in Adam17-Deleted HKC-8 Spheroids

To further delineate the effect of tAdam17 deletion against fibrosis, a 3D in vitro culture with HKC-8 cells resembling the human diabetic microenvironment was used.
Mature HKC-8 spheroids expressed proximal tubular transporters GLUT-1 and AQP1 keeping phenotypic characteristics (data not shown). In concordance with our results in mice, wild-type Adam17 spheroids incubated with HG for 72 h increased the expression of α-SMA and type-IV collagen. Interestingly, Adam17 deletion blocked the increase of α-SMA and type-IV collagen expression compared with wild-type cells (Figure 7A–D).

3. Discussion

We demonstrate that specific Adam17 deletion on endothelial cells prevents renal pro-inflammatory and pro-fibrotic events caused by DN, and specific Adam17 deletion on renal proximal tubular cells protect from diabetic pro-fibrotic events, podocyte loss, and attenuates renal RAS. Remarkably, this is the first evidence of the beneficial effect of Adam17 downregulation either in endothelial or renal proximal tubular cells in experimental DN (Figure 8).
Hyperglycaemia stimulates cells to release pro-inflammatory cytokines into the kidney, leading to the recruitment of fibroblasts, which initiates fibrotic processes [19]. ADAM17 is a disintegrin and metalloprotease associated with the shedding of most pro-inflammatory and pro-fibrotic substrates [15,20,21]. Targeting the specific inflammatory and fibrotic pathways could be an effective approach for the management of DN.
Although paricalcitol, an analogue of the active form of vitamin D with ADAM17 inhibitory properties had shown a reduction in ACR levels in diabetic patients [22]; our study showed that Adam17 deletion either in endothelial or renal proximal tubular cells was unable to prevent albuminuria in the STZ model. The lack of effect on albuminuria in Adam17 knockout mice might be ascribed to the huge ACR variability among animals. This variability could be associated with the urine collection method by morning urine spots.
Regarding renal hypertrophy, we demonstrated that tAdam17 deletion in diabetic mice reduced the KW/BW ratio as previously shown with paricalcitol administration in non-obese diabetic (NOD) mice [11]. Taken together, ADAM17 modulation may exert a positive effect in the diabetic kidney by decreasing renal hypertrophy.
At the glomerular level, our histological analyses revealed glomerular alterations in diabetic mice due to an increased mesangial index, as previously shown [23,24,25]. However, in eAdam17 and tAdam17 deletion, diabetes-induced glomerular hypertrophy and mesangial matrix expansion were lost. These results suggested that tissue-specific deletion of Adam17 from either endothelial cells or proximal tubular cells protected glomeruli from diabetic deleterious effects, probably by decreasing macrophage infiltration in the glomeruli of diabetic animals [26,27].
We and others demonstrated podocyte loss in diabetic mice [1,28,29]. In this line, we observed a decrease in podocyte number in the glomeruli of all diabetic mice. Interestingly, Guo et al. described TNF-α as a key mediator of HG-activated macrophages to induce podocyte apoptosis [27]. This may explain why we observed a decrease in podocyte loss in diabetic tAdam17KO mice. Blocking renal Adam17 and consequently TNF-α signaling at a proximal tubular level might induce a tubular-glomerular feedback recovery that leads to podocyte protection during DN. In this line, Hasegawa et al. proved that molecular changes in proximal tubular cells affected contiguous cells including podocytes [30].
Serum ACE2 activity in diabetes has been widely described [1,31,32] and ADAM17 has been shown to induce this shedding [33]. Our study also showed increased circulating ACE2 activity in diabetic mice, which was reduced by Adam17 deletion in proximal tubular cells. In concordance, Riera et al. demonstrated that paricalcitol administration in NOD mice significantly decreased circulating ACE2 activity in diabetic mice [11]. These results suggest a possible crosstalk between both proteins in which ADAM17 in the proximal tubular cell may transduce cellular signals somehow resulting in increased circulating ACE2.
In concordance with previous studies [1,31], we observed that diabetic mice presented increased kidney ACE2 activity that could be a compensatory beneficial mechanism, counterbalancing the deleterious effect of ANG II accumulation. Interestingly, after eAdam17 deletion, a further increase in renal ACE2 activity was detected in diabetic mice in comparison with diabetic wild-type mice. These data suggested that because of diabetes, more ACE2 was produced at the tubular level and due to the deletion of eAdam17, less ACE2 shedding occurred from the endothelium, resulting in ACE2 accumulation in the renal cortex. In contrast, tAdam17 deletion attenuated the increase of renal ACE2 activity in diabetic mice. We surmise that tAdam17 deletion attenuates ACE2 shedding, leading to more ANG II degradation and therefore decreased activation of inflammatory signaling pathways in diabetic mice, preventing the increase in renal ACE2 activity.
ADAM17 upregulation leads to the activation of TNFR and EGFR signaling pathways, stimulating the shedding of its substrates and inducing a protein matrix accumulation, ending in renal inflammation and fibrosis [13,18,21]. We observed an increase in soluble TNF-α in diabetic wild-type mice that was reduced with a specific deletion of Adam17. These results suggested that blocking Adam17 at a renal level during DN is enough to prevent TNF-α shedding and attenuate renal inflammation. Decreased renal Tnf-α and increased Tnfr1 gene expression were found in diabetic eAdam17KO mice. These results may be due to a possible negative feedback, since the decrease in the release of TNF-α into the circulation could be well explained by the absence of ADAM17. In these circumstances, more TNFR1 may be needed to balance the downstream signaling pathway.
Omote et al. demonstrated increased renal macrophage infiltration in diabetic KK-Ay mice that was reduced by etanercept, a TNF-α inhibitor [34]. In line with these results, we observed increased macrophage infiltration in diabetic wild-type kidneys. Instead, both eAdam17 and tAdam17 deletion reduced F4/80 immunostaining in diabetic mice when compared with diabetic wild-type mice. Additionally, eAdam17KO mice were protected against the increase in Ccl5 gene expression. The attenuation of inflammatory markers suggests that Adam17 deletion ameliorates kidney inflammation by decreasing TNFR signaling.
ADAM17 releases the active ectodomains of EGFR ligands in injured proximal tubular cells. Accordingly, EGFR is persistently activated and induces the pro-inflammatory response favoring kidney fibrosis [16,35]. EGFR ligands are found to be low-affinity (TGF-α, epiregulin, and amphiregulin) or high-affinity EGFR ligands (HG-EGF). However, only low-affinity EGFR ligands can be responsible for sustained profibrotic EGFR activation [35]. In concordance, we observed higher renal Tgfα gene expression but not increased Hb-egf gene expression in diabetic mice.
EGFR hyperactivation induces renal fibrosis by stimulating TGF-β signaling [36]. Activation of the TGF-β signaling pathway favors DN progression through enhancing synthesis of collagen, fibronectin, and laminin and blocking matrix metalloproteinase-mediated extracellular matrix degradation [37]. EGFR transactivation has been demonstrated to be required for TGF-β upregulation by high-glucose [38]. In concordance, we also observed increased Tgfβ and Fn gene expression and increased TGF-β and pAkt protein expression in diabetic mice. Overstreet et al. showed that TGF-β protein expression in tubular epithelial cells was decreased after the administration of erlotinib, an EGFR inhibitor [39]. We observed that only eAdam17 deletion prevents the activation of pAKT and the upregulation of Tgf-β gene expression in the diabetic renal cortex. However, both eAdam17 and tAdam17 deletion protects from TGF-β and collagen accumulation. In this line, immunofluorescence on HKC-8 spheroids showed increased accumulation of type-IV collagen when incubated in HG medium that was decreased with Adam17 deletion. These findings suggest that in Adam17-deleted spheroids, EGFR activation is reduced due to less shedding of the EGFR substrates. Hence, TGF-β signaling is downregulated, leading to less type-IV collagen production.
In an experimental model of ischemia–reperfusion injury, Kefaloyianni et al. demonstrated that tAdam17 deletion decreases α-SMA expression after kidney injury [35]. In this line, our results demonstrated that both eAdam17 and tAdam17 deletion prevent the accumulation of α-SMA induced by diabetes. Immunofluorescence on HKC-8 spheroids strengthen the fact that tAdam17 deletion exerts a higher effect on blocking kidney fibrosis.

4. Materials and Methods

4.1. Animal Models and Diabetes Induction

Experiments were performed on wild-type and endothelial or proximal-tubular Adam17KO male mice on a C57BL/6 background. Mice were housed in ventilated cages with full access to chow and water. Diabetes was induced in 12-week-old mice by two intraperitoneal injections of 150 mg/kg streptozotocin (STZ) (Sigma, St Louis, MO, USA) on 4 h-fasted mice in 2 consecutive weeks as previously described [28]. Induction of diabetes was confirmed by measuring non-fasting blood glucose (BG) with the ACCU-CHEK Compact System (Roche, Basel, Switzerland) on blood samples from the caudal vein. Mice were considered diabetic when BG > 13.88 mmol/L during the first 4 weeks after STZ administration.
Diabetic mice were followed for 19 weeks after diabetes induction. At the end of the follow-up, mice were sacrificed by terminal surgery as previously described [28]. Blood was extracted by cardiac puncture and serum was obtained by centrifugation at 6000 g for 10 min. Mice were perfused with cold PBS prior to kidney removal. Half of the right kidney was embedded in OCT (Sakura Finetek, Alphen aan den Rijn, Netherlands) medium and the other half was maintained in 10% formalin solution (Sigma-Aldrich, Saint Louis, MO, USA) for paraffin embedding. The remaining tissue was snap frozen on liquid nitrogen and kept at −80 °C for further analyses.

4.2. Generation of the Specific Endothelial or Tubular Adam17KO Mice

We conditionally deleted Adam17 in endothelial (eAdam17) or renal proximal tubular (tAdam17) cells. Adam17flox/flox mice (kindly provided by Dr. Raines, Washington University, Saint Louis, MO, USA) [40], tamoxifen-inducible platelet-derived growth factor (Pdgf)-iCreER mice (kindly provided by Dr. Fruttiger, University College London, London, UK) [41] and spontaneous phosphoenolpyruvate carboxykinase (Pepck)-CreER mice (kindly provided by Dr. Haase, Vanderbilt University, Nashville, TN, USA) [42] were previously described. The inducible and spontaneous Cre recombinase was fused to the PDGF or PEPCK promoter, allowing the generation of Adam17 deletion in endothelial or proximal tubular cells, respectively. The Pepck-CreER transgene contains a mutated version of the Pepck promoter, which reduces Pepck expression in the liver by 60% and increases Pepck expression in the kidney by 10-fold [43]. Adam17flox/flox mice presented two loxP sites surrounding the exon 5 of the Adam17 gene. After recombination, the excision of the sequence results in a frame shift producing a nonsense protein [40] (Supplementary Figure S1). To induce Adam17 gene recombination in endothelial cells, five intraperitoneal doses of 0.1 mg/g body weight of tamoxifen were administrated to 10-week-old mice. Wild-type (WT) mice receiving tamoxifen were used as controls. These animals did not carry any loxP site surrounding the exon 5 of the Adam17 gene, so a recombination did not occur. Then, all WT mice expressed ADAM17 in all cell types.

4.3. Urine Albumin Creatinine Ratio

Urinary albumin excretion (UAE) was determined using the albumin-to-creatinine (ACR) ratio on morning spot urine collections obtained on the last week of the follow-up. Urinary albumin levels were measured by an ELISA kit (Albuwell M, Exocell, Philadelphia, PA, USA). Creatinine levels were measured by a colorimetric assay (Creatinine Companion, Exocell, Philadelphia, PA, USA). The albumin-to-creatinine ratio was calculated and expressed as µg Alb/mg Crea [11].

4.4. Immunohistochemistry on OCT-Embedded Tissue

Immunohistochemistry staining for ADAM17 was performed on 8µm-sections of OCT-embedded kidneys. Samples were fixed on 4% formalin (Sigma-Aldrich, Saint Louis, MO, USA) for 10 min. After PBS1X washing, slides were incubated in 3% H2O2 in methanol (MilliporeSigma, Burlington, MA, USA) for 10 min. To block non-specific interactions, slides were incubated with 10% goat serum (Sigma-Aldrich, Saint Louis, MO, USA) diluted in PBS1X for 1 h. Sections were incubated with an anti-ADAM17 antibody (ab2051; 1:100, Abcam, Cambridge, UK) for 1 h. After washing, the slides were incubated with HRP-conjugated anti-rabbit IgG (Agilent Technologies, Santa Clara, CA, USA) for 1 h. Arteries were microphotographed at ×200 magnification and kidney tubules at ×100 magnification.

4.5. Immunohistochemistry on Paraffined-Embedded Tissue

Paraffin-embedded tissues were cut into 3 µm sections, deparaffined in xylene, and rehydrated through graded alcohols. Sections were stained with periodic acid-Schiff (PAS) for glomerular area and mesangial matrix expansion measurements as previously reported [1]. Twenty microphotographs of glomeruli were taken at ×400 magnification for each animal.
Immunohistochemistry for β-galactosidase, podocyte marker Wilms Tumor 1 (WT-1), alpha smooth muscle actin (α-SMA), and F4/80 was also performed in sections of paraffin-embedded tissue. Antigen retrieval was carried out with 0.01 M sodium citrate buffer pH6 by heating in a pressure cooker. The slides were incubated in 3% H2O2 (Sigma-Aldrich, Saint Louis, MO, USA) in TBS1X for 15 min. Non-specific interaction blocking was done by 1% BSA (MilliporeSigma, Burlington, MA, USA) and 3% goat serum (Sigma-Aldrich, Saint Louis, MO, USA) for 1 h. Sections were then incubated with anti-β-galactosidase antibody (A11132, Invitrogen;1:2500, Carslbad, CA, USA), anti-WT-1 antibody (sc192; 1:1000, Santa Cruz Biotechnology, Dallas, TX, USA), anti-α-SMA antibody (A2547, mouse monoclonal, Sigma-Aldrich, Saint Louis, MO, USA; 1/1000 in PBS), or anti-F4/80 antibody (400501; 1:500, Biolegend, San Diego, CA, USA) overnight. After washing, the slides were incubated with HRP-conjugated anti-rabbit IgG, anti-mouse IgG or anti-rat IgG (Agilent Technologies, Santa Clara, CA, USA) for 1 h.
Binding of the antibodies was detected by oxidation of DAB using the Liquid DAB+Substrate Chromogen System (Dako, Santa Clara, CA, USA). Samples were counterstained with hematoxylin and dehydrated through graded alcohols and preserved with DPX mounting media (Sigma-Aldrich, Saint Louis, MO, USA). Twenty microphotographs of glomeruli stained with anti-WT-1 were taken at ×400 magnification. Six microphotographs of renal cortex stained with anti-α-SMA or anti-F4/80 were taken at ×100 or ×200 magnification respectively. All analyses were performed on ImageJ software v1.51j8 (Bethesda, MD, USA).
Picrosirius red staining was performed on 4.5 μm sections of paraffin-embedded kidneys. Tubulointerstitial collagen accumulation was semi-quantitatively measured (0–4 score) as previously described [44]. Representative images were taken at ×100 magnifications.

4.6. Western Blot

Kidney cortical tissue was prepared for immunoblot analysis with antibodies against phosphorylated and total Akt and TGF-β. Kidney cortex samples were homogenized in extraction buffer containing 50 mM HEPES, pH 7.4, 150 mM NaCl, 0.5% Triton X-100, 0.025 mM ZnCl2, (all from Sigma-Aldrich, Saint Louis, MO, USA) 0.1 mM Pefabloc SC Plus (Roche, Basel, Switzerland), EDTA-free protease inhibitor cocktail tablet (Roche, Basel, Switzerland), and phosphatase inhibitor cocktail (Sigma-Aldrich, Saint Louis, MO, USA). Protein concentration was determined using the Micro BCA Protein Assay Kit (ThermoFisher Scientific, Waltham, MA, USA).
Western Blot was performed by separating 15 µg of total protein in 7% SDS-polyacrylamide gels and transfer into Immobilon-P PVDF membranes (Millipore, Burlington, MA, USA). Membranes were incubated in skimmed milk blocking solution (5%) for 1 h and incubated overnight at 4 °C with anti-pAKT (Ser473) antibody (9271 S; 1:1000, Cell Signaling Technology, Danvers, MA, USA) in 2.5% BSA, anti-Akt antibody (9272 S; 1:2000, Cell Signaling Technology, Danvers, MA, USA) in 2.5% BSA and anti-TGFβ antibody (3711 S; 1:1000 Cell Signaling Technology, Danvers, MA, USA) in 2.5% BSA. HRP-conjugated anti-rabbit IgG antibody (A0545; 1:2000 or 1:4000, Sigma-Aldrich, Saint Louis, MO, USA) was used as a secondary antibody.
Proteins were detected in films (AGFA CURIX) after 3-min incubation with Clarity Western ECL Substrate (Bio-Rad, Hercules, CA, USA). Protein bands were quantified by densitometry with the ImageJ software v1.51j8 (Bethesda, MD, USA).

4.7. Soluble TNF-α ELISA

Serum TNF-α levels were measured using the Mouse TNF-α Quantikine ELISA Kit (R&D Systems, Minneapolis, MN, USA) according to the manufacturer’s instructions. Next, 50 μL of mouse serum were incubated with the Assay Diluent for 2 h in microplates coated with a monoclonal antibody specific for mouse TNF-α. After washing unbound substances, an enzyme-linked polyclonal antibody specific for mouse TNF-α conjugated to HRP was added and incubated for 2 h. After washing, the plate was incubated with the Substrate Solution for 30 min. The enzyme reaction yields a blue product that turns yellow when the Stop Solution was added. Finally, optical density was determined using the Tecan Infinite 200 reader at 450 nm and 570 nm for wavelength correction. Results were expressed as pg/mL.

4.8. 3D Cell Culture Set up and CRISPR/Cas9 Adam17 Silencing

Human proximal tubular cells (HKC-8) kindly provided by Dr. Nugraha were cultured in DMEM/F12 without glucose medium (Biowest LLC, Riverside, MO, USA) and were supplemented with low glucose (5.5 mM, Sigma-Aldrich, Saint Louis, MO, USA), 2.5% FBS (Biowest LLC, Riverside, MO, USA), 1% Insulin-Transferrin-Selenium (Corning, Corning, NY, USA), Penicillin (100 Units/mL), and Streptomycin (100 µg/mL) (Biowest LLC, Riverside, MO, USA) at 37 °C and 5% CO2.
To obtain the HKC-8 spheroids, the 3D Life dextran hydrogel kit (BioCat, Heidelberg, Germany) was functionalized with RGD peptide (BioCat, Heidelberg, Germany). The HKC-8 single cell suspension (around 57,600 cells) was mixed with the RGD-functionalized dextran hydrogel and crosslinked with PEG-based crosslinker as previously described [45].
Thirteen days post-seeding, the spheroids were incubated with either of the final concentrations of 35 mM d-glucose (HG, high-glucose), 5.5 mM d-glucose (LG, low-glucose), or 35 mM mannitol (M) (Sigma-Aldrich, Saint Louis, MO, USA) as an osmotic control for 72 h.
Adam17 deletion on HKC-8 cells was performed using the human TACE CRISPR/Cas9 KO plasmid (sc-400827, Santa Cruz Biotechnology, Dallas, TX, USA). The TACE CRISPR/Cas9 KO Plasmid consists of a pool of three plasmids, each encoding for a GFP protein, the Cas9 nuclease, and a target-specific 20 nt guide RNA designed for maximum knockout efficiency.
Positive transfected cells were selected by GFP+ sorting. Cells were resuspended in PBS + 1% FBS and filtered directly before sorting using cell strainer caps in 5 mL FACS tubes (Corning, Corning, NY, USA). Non-transfected cells were used as controls to estimate background signals. The cell sorting was performed using the FACSAria III sorter (BD Biosciences, San Jose, CA, USA). GFP+ cells were collected in 5 mL tubes with complete DMEM-F12 medium and centrifuged at 300 g for 5 min. After aspiration, cells were resuspended in complete DMEM-F12 medium and seeded in the single well of a 24-well plate.

4.9. Immunofluorescence in Tubular Spheroids

Immunofluorescence for fibrotic markers such as type-IV collagen and α-SMA was performed on HKC-8 spheroids after fixing them in 4% PFA (ThermoFischer Scientific, Waltham, MA, USA) for 30 min. The spheroids were then permeabilized and blocked with 0.2% saponin (Sigma-Aldrich, Saint Louis, MO, USA), 3% BSA (Sigma-Aldrich, Saint Louis, MO, USA) and 20% FCS (Sigma-Aldrich, Saint Louis, MO, USA) for 40 min and incubated with a primary α-SMA antibody (A5228; 1:1000, Sigma-Aldrich, Saint Louis, MO, USA) and a type-IV Collagen antibody (C1926; 1:1000, Sigma-Aldrich, Saint Louis, MO, USA) for 1 h. After secondary antibodies, anti-mouse IgG (Alexa 488, A32723; 1:500, ThermoFisher Scientific, Waltham, MA, USA) incubation for 1 h, samples were mounted with Fluorsave (Merck, Darmstadt, Germany) to minimize laser-induced photo bleaching. The quality of the established 3D-cell culture with mature HKC-8 spheroids was assessed by AQP-1 (SC-32737; 1:1000, Santa Cruz Biotechnology; Dallas, TX, USA) and GLUT-1 (Ab652; 1:500, Abcam; Cambridge, UK) staining.
Microscopical images from the middle of the spheroid core were acquired using a HC APO CS2 20x/0.75 IMM on a Leica SP8 inverted confocal microscope (Leica, Wetzlar, Germany). The 3D image stack was reconstructed using Imaris Software (Bitplane, Zürich, Switzerland). The experiment was repeated three times and eight to ten images were taken from each slide. The staining intensity was normalized to the spheroid volume.

4.10. Gene Expression

Renal cortex RNA was isolated from frozen tissue using the Tripure Isolation Reagent (Sigma-Aldrich, Saint Louis, MO, USA) as previously reported [23] and 1.5 µg of total RNA were retrotranscribed using the High Capacity cDNA RT Kit (ThermoFisher Scientific, Waltham, MA, USA). Gene expressions for Adam17, Angiotensin II receptor type 1 A (At1ra), Angiotensin II receptor type 2 (At2r), angiotensinogen (Agt), Tnfα, Tnfr1, fibronectin (Fn), Tgfα, heparin-binding EGF-like growth factor (Hb-egf), Tgfβ, and chemokine (C-C motif) ligand 5 (Ccl5) were determined by Real-Time PCR using LightCycler®480 SYBR Green I Master Mix (Roche, Basel, Switzerland). Glyceraldehyde-3-phosphate dehydrogenase (Gapdh) was used as a housekeeping gene. Primer sequences were synthesized by Sigma (Saint Louis, MO, USA) and described in Supplementary Table S1.

4.11. ACE2 Enzymatic Activity

The ACE2 fluorescent enzymatic assay was performed as previously described using the ACE2 quenched fluorogenic substrate Mca-Ala-Pro-Lys(Dnp)-OH (Enzo Biochem, Farmingdale, NY, USA) [11]. For ACE2 enzymatic activity, 2 µL of serum or 1 µg of total protein were incubated in duplicate with an ACE2 assay buffer consisting of 100 mM Tris-HCl, 600 mM NaCl, 10 µM ZnCl2 pH 7.5 (Sigma-Aldrich, Saint Louis, MO, USA) plus inhibitors: 100 µM captopril, 5 µM amastatin, 5 µM bestatin (all from Sigma-Aldrich, Saint Louis, MO, USA), and 10 µM Z-Prolyl-prolinal (Enzo Biochem, Farmingdale, NY, USA). The reaction was initiated with the addition of 10 µM (serum) or 5 µM (kidney) of fluorogenic substrate and incubated at 37 °C for 16 h or 4 h, respectively. Fluorescence was measured using the Tecan Infinite 200 (Männedorf, Switzerland) at λex320 nm/λem400 nm. Results were expressed as RFU/µL/h and RFU/µg/h, respectively.

4.12. Statistical Analyses

Statistical analyses between groups were performed by one-way ANOVA test (SPSS 22.0 software, Armonk, NY, USA). Non-parametric Kruskal–Wallis tests were performed between groups. Non-parametric Mann–Whitney tests were used for group-to-group comparisons. Data were expressed as mean ± SD. Significance was defined as p < 0.05.

5. Conclusions

In conclusion, this study shows that tissue-specific Adam17 deletion protects against renal inflammation and fibrosis. Diabetic mice lacking specific eAdam17 displayed attenuated renal inflammation and ameliorated renal fibrosis. Adam17 deletion in the renal proximal tubular cells of diabetic mice attenuated podocyte loss, RAS, renal inflammation and fibrosis in terms of macrophage infiltration, collagen and α-SMA accumulation. The study of fibrotic markers on a renal proximal tubular 3D in vitro cell culture reinforced the animal findings. All things considered, these results suggest that Adam17 should be considered as a therapeutic strategy for treating DN.

Supplementary Materials

The following are available online at https://www.mdpi.com/article/10.3390/ijms22115520/s1, Figure S1: Confirmation of Adam17 deletion on endothelial and renal proximal tubular cells. (a) Schematic representation of the targeting construct, showing replacement of the loxP sites for Cre-mediated recombination on the Adam17 and LacZ genes. (b) Endothelial and proximal tubular Adam17 deletion was confirmed by immunohistochemistry. Images were taken at ×20 magnifications for the arteries and at ×10 magnifications for the renal cortex. (c) β-galactosidase staining as control of recombination for proximal tubular Adam17 deletion. Images were taken at 10× magnifications. (d) Adam17 gene expression from tAdam17 model; n = 7–8 in each group. * p < 0.05 DB vs. CONT, $ p < 0.05 KO vs. WT. Figure S2: Influence of diabetes and Adam17 deletion on ACR ratio. (a) ACR ratio from eAdam17 model. (b) ACR ratio from tAdam17 model. ACR, albumin-to-creatinine ratio; CONT, control; DB, diabetic; eAdam17, endothelial ADAM17; KO, knockout; tAdam17, proximal tubular ADAM17; WT, wild-type. * p < 0.05 DB vs. NoDB; n = 6–10 in each group. Figure S3: Influence of diabetes and Adam17 deletion on Angiotensinogen gene expression. (a) Agt gene expression from eAdam17 model. (b) Agt gene expression from tAdam17 model. Agt, angiotensinogen; CONT, control; DB, diabetic; eAdam17, endothelial ADAM17; KO, knockout; tAdam17, proximal tubular ADAM17; WT, wild-type. * p < 0.05 DB vs. NoDB, $ p < 0.05 KO vs. WT; n = 7–8 in each group. Figure S4: Influence of diabetes and Adam17 deletion on Hb-egf gene expression. (a) Hb-egf gene expression from eAdam17 model. (b) Hb-egf gene expression from tAdam17 model. CONT, control; DB, diabetic; eAdam17, endothelial ADAM17; KO, knockout; tAdam17, proximal tubular ADAM17; WT, wild-type; n = 7–8 in each group. Table S1: Primer sequences used for Real Time qPCR analysis.

Author Contributions

Conceptualization, M.J.S., M.R., J.P., B.N., M.Y.E. and S.P.H.; methodology, V.P. and D.B.; validation, M.J.S., M.R. and V.P.; writing—original draft preparation, V.P.; writing—review and editing, V.P., M.J.S., M.R., B.N., M.Y.E. and S.P.H.; supervision, J.P.; funding acquisition, J.P. and M.J.S. All authors have read and agreed to the published version of the manuscript.

Funding

This research was funded by ISCIIII-FEDER and ISCIII-RETICS REDinREN, grant number PI14/00557, PI17/00257 and RD16/0009/0013.

Institutional Review Board Statement

The study was conducted according to the guidelines of the Declaration of Helsinki, and approved by the Ethics Committee of Animal Experimentation of the Barcelona Biomedical Research Park and the Catalan Government (DMAH no. 9302 and 2017.07.04).

Informed Consent Statement

Not applicable.

Data Availability Statement

Not applicable.

Acknowledgments

Vanesa Palau did the study as part of her doctoral thesis at Departament de Medicina of Universitat Autònoma de Barcelona. The authors would like to thank Ester Aguado and Isaac Aran for their technical assistance.

Conflicts of Interest

M.J.S. serves as a consultant for NovoNordisk, Cogora, Pfizer, Boehringer, AstraZeneca and Mundipharma.

References

  1. Riera, M.; Márquez, E.; Clotet, S.; Gimeno, J.; Roca-Ho, H.; Lloreta, J.; Juanpere, N.; Batlle, D.; Pascual, J.; Soler, M.J. Effect of insulin on ACE2 activity and kidney function in the non-obese diabetic mouse. PLoS ONE 2014, 9, e84683. [Google Scholar] [CrossRef]
  2. Diez-Sampedro, A.; Lenz, O.; Fornoni, A. Podocytopathy in diabetes: A metabolic and endocrine disorder. Am. J. Kidney Dis. 2011, 58, 637–646. [Google Scholar] [CrossRef] [Green Version]
  3. Gross, J.L.; De Azevedo, M.J.; Silveiro, S.P.; Canani, L.H.; Caramori, M.L.; Zelmanovitz, T. Diabetic nephropathy: Diagnosis, prevention, and treatment. Diabetes Care 2005, 28, 164–176. [Google Scholar] [CrossRef] [PubMed] [Green Version]
  4. Qian, Y.; Feldman, E.; Pennathur, S.; Kretzler, M.; Brosius, F.C. From fibrosis to sclerosis: Mechanisms of glomerulosclerosis in diabetic nephropathy. Diabetes 2008, 57, 1439–1445. [Google Scholar] [CrossRef] [Green Version]
  5. Forbes, J.M.; Cooper, M.E. Mechanisms of Diabetic Complications. Physiol. Rev. 2013, 93, 137–188. [Google Scholar] [CrossRef]
  6. Tesch, G.H. Macrophages and diabetic nephropathy. Semin. Nephrol. 2010, 30, 290–301. [Google Scholar] [CrossRef] [PubMed]
  7. Sanchez, A.P.; Sharma, K. Transcription factors in the pathogenesis of diabetic nephropathy. Expert Rev. Mol. Med. 2009, 11, e13. [Google Scholar] [CrossRef]
  8. Zhu, Y.; Casado, M.; Vaulont, S.; Sharma, K. Role of upstream stimulatory factors in regulation of renal transforming growth factor-β1. Diabetes 2005, 54, 1976–1984. [Google Scholar] [CrossRef] [Green Version]
  9. Salem, E.S.B.; Grobe, N.; Elased, K.M. Insulin treatment attenuates renal ADAM17 and ACE2 shedding in diabetic Akita mice. AJP Ren. Physiol. 2014, 306, 629–639. [Google Scholar] [CrossRef] [Green Version]
  10. Chodavarapu, H.; Grobe, N.; Somineni, H.K.; Salem, E.S.B.; Madhu, M.; Elased, K.M. Rosiglitazone Treatment of Type 2 Diabetic db/db Mice Attenuates Urinary Albumin and Angiotensin Converting Enzyme 2 Excretion. PLoS ONE 2013, 8, e62833. [Google Scholar] [CrossRef]
  11. Riera, M.; Anguiano, L.; Clotet, S.; Roca-Ho, H.; Rebull, M.; Pascual, J.; Soler, M.J. Paricalcitol modulates ACE2 shedding and renal ADAM17 in NOD mice beyond proteinuria. Am. J. Physiol. Physiol. 2016, 310, 534–546. [Google Scholar] [CrossRef] [Green Version]
  12. Taniguchi, K.; Xia, L.; Goldberg, H.J.; Lee, K.W.K.; Shah, A.; Stavar, L.; Masson, E.A.Y.; Momen, A.; Shikatani, E.A.; John, R.; et al. Inhibition of src kinase blocks high glucose-induced EGFR transactivation and collagen synthesis in mesangial cells and prevents diabetic nephropathy in mice. Diabetes 2013, 62, 3874–3886. [Google Scholar] [CrossRef] [PubMed] [Green Version]
  13. Ford, B.M.; Eid, A.A.; Gooz, M.; Barnes, J.L.; Gorin, Y.C.; Abboud, H.E. ADAM17 mediates Nox4 expression and NADPH oxidase activity in the kidney cortex of OVE26 mice. AJP Ren. Physiol. 2013, 305, 323–332. [Google Scholar] [CrossRef] [PubMed] [Green Version]
  14. Lattenist, L.; Ochodnický, P.; Ahdi, M.; Claessen, N.; Leemans, J.C.; Satchell, S.C.; Florquin, S.; Gerdes, V.E.; Roelofs, J.J.T.H. Renal endothelial protein C receptor expression and shedding during diabetic nephropathy. J. Thromb. Haemost. 2016, 14, 1171–1182. [Google Scholar] [CrossRef] [PubMed] [Green Version]
  15. Gooz, M. ADAM-17: The enzyme that does it all. Crit. Rev. Biochem. Mol. Biol. 2010, 45, 146–169. [Google Scholar] [CrossRef] [PubMed] [Green Version]
  16. Kefaloyianni, E.; Muthu, M.L.; Kaeppler, J.; Sun, X.; Sabbisetti, V.; Chalaris, A.; Rose-John, S.; Wong, E.; Sagi, I.; Waikar, S.S.; et al. ADAM17 substrate release in proximal tubule drives kidney fibrosis. JCI Insight 2016, 1, e87023. [Google Scholar] [CrossRef] [Green Version]
  17. Shen, M.; Morton, J.; Davidge, S.T.; Kassiri, Z. Loss of smooth muscle cell disintegrin and metalloproteinase 17 transiently suppresses angiotensin II-induced hypertension and end-organ damage. J. Mol. Cell. Cardiol. 2017, 103, 11–21. [Google Scholar] [CrossRef]
  18. Melenhorst, W.B.; Visser, L.; Timmer, A.; van den Heuvel, M.C.; Stegeman, C.A.; van Goor, H. ADAM17 upregulation in human renal disease: A role in modulating TGF-α availability? Am. J. Physiol. Physiol. 2009, 297, 781–790. [Google Scholar] [CrossRef]
  19. Kanasaki, K.; Taduri, G.; Koya, D. Diabetic nephropathy: The role of inflammation in fibroblast activation and kidney fibrosis. Front. Endocrinol. 2013, 4, 1–15. [Google Scholar] [CrossRef] [Green Version]
  20. Giricz, O.; Calvo, V.; Peterson, E.A.; Abouzeid, C.M.; Kenny, P.A. TACE-dependent TGFα shedding drives triple-negative breast cancer cell invasion. Int. J. Cancer 2013, 133, 2587–2595. [Google Scholar] [CrossRef]
  21. Menghini, R.; Fiorentino, L.; Casagrande, V.; Lauro, R.; Federici, M. The role of ADAM17 in metabolic inflammation. Atherosclerosis 2013, 228, 12–17. [Google Scholar] [CrossRef] [PubMed] [Green Version]
  22. Zhang, Z.; Zhang, Y.; Ning, G.; Deb, D.K.; Kong, J.; Yan, C.L. Combination therapy with AT1 blocker and vitamin D analog markedly ameliorates diabetic nephropathy: Blockade of compensatory renin increase. Proc. Natl. Acad. Sci. USA 2008, 105, 15896–15901. [Google Scholar] [CrossRef] [PubMed] [Green Version]
  23. Clotet-Freixas, S.; Soler, M.J.; Palau, V.; Anguiano, L.; Gimeno, J.; Konvalinka, A.; Pascual, J.; Riera, M. Sex dimorphism in ANGII-mediated crosstalk between ACE2 and ACE in diabetic nephropathy. Lab. Investig. 2018, 98, 1237–1249. [Google Scholar] [CrossRef] [PubMed] [Green Version]
  24. Wong, D.W.; Oudit, G.Y.; Reich, H.; Kassiri, Z.; Zhou, J.; Liu, Q.C.; Backx, P.H.; Penninger, J.M.; Herzenberg, A.M.; Scholey, J.W. Loss of angiotensin-converting enzyme-2 (Ace2) accelerates diabetic kidney injury. Am. J. Pathol. 2007, 171, 438–451. [Google Scholar] [CrossRef] [PubMed] [Green Version]
  25. Oudit, G.Y.; Liu, G.C.; Zhong, J.C.; Basu, R.; Chow, F.L.; Zhou, J.; Loibner, H.; Janzek, E.; Schuster, M.; Penninger, J.M.; et al. Human recombinant ACE2 reduces the progression of diabetic nephropathy. Diabetes 2010, 59, 529–538. [Google Scholar] [CrossRef] [PubMed] [Green Version]
  26. Sassy-Prigent, C.; Heudes, D.; Mandet, C.; Bélair, M.F.; Michel, O.; Perdereau, B.; Bariéty, J.; Bruneval, P. Early glomerular macrophage recruitment in streptozotocin-induced diabetic rats. Diabetes 2000, 49, 466–475. [Google Scholar] [CrossRef] [Green Version]
  27. Guo, Y.; Song, Z.; Zhou, M.; Yang, Y.; Zhao, Y.; Liu, B.; Zhang, X. Infiltrating macrophages in diabetic nephropathy promote podocytes apoptosis via TNF-α-ROS-p38MAPK pathway. Oncotarget 2017, 8, 53276–53287. [Google Scholar] [CrossRef] [PubMed] [Green Version]
  28. Clotet, S.; Soler, M.J.; Rebull, M.; Gimeno, J.; Gurley, S.B.; Pascual, J.; Riera, M. Gonadectomy prevents the increase in blood pressure and glomerular injury in angiotensin-converting enzyme 2 knockout diabetic male mice. Effects on renin-angiotensin system. J. Hypertens. 2016, 34, 1752–1765. [Google Scholar] [CrossRef] [Green Version]
  29. Wang, W.; Jiang, S.; Tang, X.; Cai, L.; Epstein, P.N.; Cheng, Y.; Sun, W.; Xu, Z.; Tan, Y. Sex differences in progression of diabetic nephropathy in OVE26 type 1 diabetic mice. Biochim. Biophys. Acta Mol. Basis Dis. 2020, 1866, 165589. [Google Scholar] [CrossRef]
  30. Hasegawa, K.; Wakino, S.; Simic, P.; Sakamaki, Y.; Minakuchi, H.; Fujimura, K.; Hosoya, K.; Komatsu, M.; Kaneko, Y.; Kanda, T.; et al. Renal tubular sirt1 attenuates diabetic albuminuria by epigenetically suppressing claudin-1 overexpression in podocytes. Nat. Med. 2013, 19, 1496–1504. [Google Scholar] [CrossRef] [Green Version]
  31. Wysocki, J.; Ye, M.; Soler, M.J.; Gurley, S.B.; Xiao, H.D.; Bernstein, K.E.; Coffman, T.M.; Chen, S.; Batlle, D. ACE and ACE2 activity in diabetic mice. Diabetes 2006, 55, 2132–2139. [Google Scholar] [CrossRef] [Green Version]
  32. Yamaleyeva, L.M.; Gilliam-Davis, S.; Almeida, I.; Brosnihan, K.B.; Lindsey, S.H.; Chappell, M.C. Differential regulation of circulating and renal ACE2 and ACE in hypertensive mRen2.Lewis rats with early-onset diabetes. AJP Ren. Physiol. 2012, 302, 1374–1384. [Google Scholar] [CrossRef] [PubMed] [Green Version]
  33. Lambert, D.W.; Yarski, M.; Warner, F.J.; Thornhill, P.; Parkin, E.T.; Smith, A.I.; Hooper, N.M.; Turner, A.J. Tumor necrosis factor-α convertase (ADAM17) mediates regulated ectodomain shedding of the severe-acute respiratory syndrome-coronavirus (SARS-CoV) receptor, angiotensin-converting enzyme-2 (ACE2). J. Biol. Chem. 2005, 280, 30113–30119. [Google Scholar] [CrossRef] [PubMed] [Green Version]
  34. Omote, K.; Gohda, T.; Murakoshi, M.; Sasaki, Y.; Kazuno, S.; Fujimura, T.; Ishizaka, M.; Sonoda, Y.; Tomino, Y. Role of the TNF pathway in the progression of diabetic nephropathy in KK-Ay mice. Am. J. Physiol.-Ren. Physiol. 2014, 306, 1335–1347. [Google Scholar] [CrossRef] [Green Version]
  35. Kefaloyianni, E.; Raja, M.R.K.; Schumacher, J.; Muthu, M.L.; Krishnadoss, V.; Waikar, S.S.; Herrlich, A. Proximal tubule-derived amphiregulin amplifies and integrates profibrotic EGF receptor signals in kidney fibrosis. J. Am. Soc. Nephrol. 2019, 30, 2370–2383. [Google Scholar] [CrossRef]
  36. Chen, J.; Chen, J.K.; Harris, R.C. EGF receptor deletion in podocytes attenuates diabetic nephropathy. J. Am. Soc. Nephrol. 2015, 26, 1115–1125. [Google Scholar] [CrossRef] [Green Version]
  37. McLennan, S.V.; Fisher, E.; Martell, S.Y.; Death, A.K.; Williams, P.F.; Lyons, J.G.; Yue, D.K. Effects of glucose on matrix metalloproteinase and plasmin activities in mesangial cells: Possible role in diabetic nephropathy. Kidney Int. Suppl. 2000, 77, 81–87. [Google Scholar] [CrossRef] [Green Version]
  38. Wu, D.; Peng, F.; Zhang, B.; Ingram, A.J.; Kelly, D.J.; Gilbert, R.E.; Gao, B.; Krepinsky, J.C. PKC-1 Mediates Glucose-Induced Akt Activation and TGF- 1 Upregulation in Mesangial Cells. J. Am. Soc. Nephrol. 2009, 20, 554–566. [Google Scholar] [CrossRef] [Green Version]
  39. Overstreet, J.M.; Wang, Y.; Wang, X.; Niu, A.; Gewin, L.S.; Yao, B.; Harris, R.C.; Zhang, M.Z. Selective activation of epidermal growth factor receptor in renal proximal tubule induces tubulointerstitial fibrosis. FASEB J. 2017, 31, 4407–4421. [Google Scholar] [CrossRef] [Green Version]
  40. Wilson, C.L.; Gough, P.J.; Chang, C.A.; Chan, C.K.; Frey, J.M.; Liu, Y.; Braun, K.R.; Chin, M.T.; Wight, T.N.; Raines, E.W. Endothelial deletion of ADAM17 in mice results in defective remodeling of the semilunar valves and cardiac dysfunction in adults. Mech. Dev. 2013, 130, 272–289. [Google Scholar] [CrossRef] [PubMed]
  41. Claxton, S.; Kostourou, V.; Jadeja, S.; Chambon, P.; Hodivala-Dilke, K.; Fruttiger, M. Efficient, inducible cre-recombinase activation in vascular endothelium. Genesis 2008, 46, 74–80. [Google Scholar] [CrossRef] [PubMed]
  42. Rankin, E.B.; Tomaszewski, J.E.; Haase, V.H. Renal cyst development in mice with conditional inactivation of the von Hippel-Lindau tumor suppressor. Cancer Res. 2006, 66, 2576–2583. [Google Scholar] [CrossRef] [Green Version]
  43. Patel, Y.M.; Yun, J.S.; Liu, J.; McGrane, M.M.; Hanson, R.W. An analysis of regulatory elements in the phosphoenolpyruvate carboxykinase (GTP) gene which are responsible for its tissue-specific expression and metabolic control in transgenic mice. J. Biol. Chem. 1994, 269, 5619–5628. [Google Scholar] [CrossRef]
  44. Junqueira, L.C.U.; Bignolas, G.; Brentani, R.R. Picrosirius staining plus polarization microscopy, a specific method for collagen detection in tissue sections. Histochem. J. 1979, 11, 447–455. [Google Scholar] [CrossRef] [PubMed]
  45. Nugraha, B.; Mohr, M.A.; Ponti, A.; Emmert, M.Y.; Weibel, F.; Hoerstrup, S.P.; Moll, S.; Certa, U.; Prunotto, M.; Pantazis, P. Monitoring and manipulating cellular crosstalk during kidney fibrosis inside a 3D in vitro co-culture. Sci. Rep. 2017, 7, 14490. [Google Scholar] [CrossRef] [PubMed] [Green Version]
Figure 1. Glomerular tuft area, mesangial area, mesangial index and podocyte loss. (A) Glomerular tuft area from eAdam17 model. (B) Mesangial expansion from eAdam17 model. (C) Mesangial index from eAdam17 model. (D) Glomerular tuft area from tAdam17 model. (E) Mesangial expansion from tAdam17 model. (F) Mesangial index from tAdam17 model. (G) Representative images of the PAS staining for eAdam17 and tAdam17 mice. Original magnification, ×400. (H) Podocyte number is represented as the number of brown positive cells after WT-1 immunostaining in eAdam17 model. (I) Podocyte number is represented as the number of brown positive cells after WT-1 immunostaining in tAdam17 model. (J) Representative images of the WT-1 immunostaining for eAdam17 and tAdam17 mice. Original magnification, ×400. CONT, control; DB, diabetic; eAdam17, endothelial ADAM17; KO, knockout; tAdam17, proximal tubular ADAM17; WT, wild-type; WT-1, wilms tumor 1. * p < 0.05 DB vs. NoDB, $ p < 0.05 KO vs. WT; n = 6–9 in each group.
Ijms 22 05520 g001
Figure 2. Effect of diabetes and endothelial or proximal-tubular Adam17 deletion on the Renin Angiotensin System. (A) Circulating ACE2 activity from eAdam17 model. (B) Circulating ACE2 activity from tAdam17 model. (C) Renal ACE2 activity from eAdam17 model. (D) Renal ACE2 activity from tAdam17 model. (E) At1r gene expression from eAdam17 model. (F) At1r gene expression from tAdam17 model. (G) At2r gene expression from eAdam17 model. (H) At2r gene expression from tAdam17 model. ACE2, angiotensin converting enzyme 2; AT1R, angiotensin II receptor type 1; AT2R, angiotensin II receptor type 2; CONT, control; DB, diabetic; eAdam17, endothelial ADAM17; KO, knockout; tAdam17, proximal tubular ADAM17; WT, wild-type. * p < 0.05 DB vs. NoDB, $ p < 0.05 KO vs. WT; n = 6–8 in each group.
Ijms 22 05520 g002
Figure 3. Influence of diabetes and Adam17 deletion on circulating TNF-α, Tnfa, Tnfr1, and Ccl5 gene expression. (A) Circulating TNF-α from eAdam17 model. (B) Circulating TNF-α from tAdam17 model. (C) Tnfa gene expression from eAdam17 model. (D) Tnfa gene expression from tAdam17 model. (E) Tnfr1 gene expression from eAdam17 model. (F) Tnfr1 gene expression from tAdam17 model. (G) Ccl5 gene expression from eAdam17 model. (H) Ccl5 gene expression from tAdam17 model. CONT, control; DB, diabetic; eAdam17, endothelial ADAM17; KO, knockout; tAdam17, proximal tubular ADAM17; TNF-α, tumor necrosis factor α; WT, wild-type. * p < 0.05 DB vs. NoDB, $ p < 0.05 KO vs. WT; n = 6–8 in each group.
Ijms 22 05520 g003
Figure 4. Influence of diabetes and Adam17 deletion on F4/80 immunostaining. (A) F4/80 immunostaining from eAdam17 model. (B) F4/80 immunostaining from tAdam17 model. Original magnification, ×200. CONT, control; DB, diabetic; eAdam17, endothelial ADAM17; KO, knockout; tAdam17, proximal tubular ADAM17; TNF-α, tumor necrosis factor α; WT, wild-type. * p < 0.05 DB vs. NoDB, $ p < 0.05 KO vs. WT; n = 6–8 in each group.
Ijms 22 05520 g004
Figure 5. Influence of diabetes and Adam17 deletion on Tgfα, Tgfβ, and fibronectin gene expression and protein expression. (A) Tgfα gene expression from the eAdam17 model. (B) Tgfα gene expression from the tAdam17 model. (C) Tgfβ gene expression from the eAdam17 model. (D) Tgfβ gene expression from the tAdam17 model. (E) TGF-β protein expression from eAdam17 model. (F) TGF-β protein expression from tAdam17 model. (G) Fibronectin gene expression from the eAdam17 model. (H) Fibronectin gene expression from the tAdam17 model. CONT, control; DB, diabetic; eAdam17, endothelial ADAM17; FN, fibronectin; KO, knockout; tAdam17, proximal tubular ADAM17; TGF-α, transforming growth factor α, TGF-β, transforming growth factor β; WT, wild-type. * p < 0.05 DB vs. NoDB, $ p < 0.05 KO vs. WT; n = 6–8 in each group.
Ijms 22 05520 g005
Figure 6. Influence of diabetes and Adam17 deletion on α-SMA and collagen staining and pAkt/Akt ratio. (A) α-SMA immunostaining from eAdam17 model. (B) α-SMA immunostaining from tAdam17 model. (C) Representative images of α-SMA immunostaining from eAdam17 and tAdam17 models. Original magnification, ×100. (D) Collagen staining from eAdam17 model. (E) Collagen staining from tAdam17 model. (F) Representative images of Sirius Red staining from eAdam17 and tAdam17 models. Original magnification, ×100. (G) pAkt/Akt ratio from eAdam17 model. (H) pAkt/Akt ratio from tAdam17 model. CONT, control; DB, diabetic; eAdam17, endothelial ADAM17; KO, knockout; pAkt, phosphorylated protein kinase B; α-SMA, alpha smooth muscle actin; tAdam17, proximal tubular ADAM17; WT, wild-type. * p < 0.05 DB vs. NoDB, $ p < 0.05 KO vs. WT; n = 6–8 in each group.
Ijms 22 05520 g006
Figure 7. Influence of high glucose medium and Adam17 deletion on α-SMA and Collagen-IV immunofluorescence staining. (A) α-SMA immunofluorescence staining in HKC-8 spheroids. (B) Representative images of the α-SMA immunofluorescence staining. (C) Type IV collagen immunofluorescence staining in HKC-8 spheroids. (D) Representative images of the Type IV collagen immunofluorescence staining. LG, low glucose; HG, high glucose; M, mannitol. * p < 0.05 HG vs. LG, $ p < 0.05 KO vs. WT, # p < 0.05 M vs. HG; n = 15–21 spheroids per group. Scale bar 20 µm.
Ijms 22 05520 g007
Figure 8. Schematic figure summarizing the findings regarding the effects of Adam17 deletion in endothelial and proximal tubular cells under STZ-diabetic mice model.
Ijms 22 05520 g008
Table 1. Blood glucose, body weight, and KW/BW ratio were measured after 19 weeks of diabetes. Fasting blood glucose was determined during the follow-up and at the end of the study, body weight and KW/BW ratio were recorded in all experimental groups. Values are expressed as mean ± SD.
Endothelial ADAM17 Model
WT-CONTWT-DBKO-CONTKO-DB
Fasting blood glucose
(mg/dL)
175.44 ± 20.26430.29 ± 31.49 *185.30 ± 15.68485.9 ± 86.91 *
Body weight (g)34.61 ± 5.3726.35 ± 3.61 *33.09 ± 3.3424.16 ± 2.70 *
KW/BW0.97 ± 0.191.45 ± 0.31 *1.00 ± 0.111.41 ± 0.16 *
Proximal Tubular ADAM17 Model
WT-CONTWT-DBKO-CONTKO-DB
Fasting blood glucose
(mg/dL)
177.13 ± 6.45397.33 ± 17.89 *202.67 ± 5.92362.58 ± 27.54 *
Body weight (g)34.38 ± 4.4528.35 ± 3.27 *34.94 ± 4.4027.87 ± 2.15 *
KW/BW1.07 ± 0.171.35 ± 0.15 *1.00 ± 0.101.25 ± 0.20 *$
* p ≤ 0.05 DB vs NoDB; $ p ≤ 0.05 KO vs WT.
Publisher’s Note: MDPI stays neutral with regard to jurisdictional claims in published maps and institutional affiliations.

