
Separating the Wheat from the Chaff: The Use of Upstream Regulator Analysis to Identify True Differential Expression of Single Genes within Transcriptomic Datasets

 , , and
Abstract
:1. Introduction
2. Results
Pathway Analysis
3. Discussion
4. Materials and Methods
4.1. Animals and Treatments
4.2. Human Glioblastoma Cell Culture
4.3. Dataset Used and Ingenuity Pathway Analysis
4.4. Quantitative qRT-PCR
4.5. Statistical Analysis
5. Conclusions
Supplementary Materials
Author Contributions
Funding
Institutional Review Board Statement
Informed Consent Statement
Data Availability Statement
Acknowledgments
Conflicts of Interest
References
- Wakap, S.N.; Lambert, D.M.; Olry, A.; Rodwell, C.; Gueydan, C.; Lanneau, V.; Murphy, D.; Le Cam, Y.; Rath, A. Estimating cumulative point prevalence of rare diseases: Analysis of the Orphanet database. Eur. J. Hum. Genet. 2020, 28, 165–173. [Google Scholar] [CrossRef] [PubMed] [Green Version]
- Gonzaludo, N.; Belmont, J.W.; Gainullin, V.G.; Taft, R.J. Estimating the burden and economic impact of pediatric genetic disease. Genet. Med. 2019, 21, 1781–1789. [Google Scholar] [CrossRef] [PubMed] [Green Version]
- Walker, C.E.; Mahede, T.; Davis, G.; Miller, L.J.; Girschik, J.; Brameld, K.; Sun, W.; Rath, A.; Aymé, S.; Zubrick, S.R. The collective impact of rare diseases in Western Australia: An estimate using a population-based cohort. Genet. Med. 2017, 19, 546–552. [Google Scholar] [CrossRef] [PubMed] [Green Version]
- Mazzucato, M.; Dalla Pozza, L.V.; Manea, S.; Minichiello, C.; Facchin, P. A population-based registry as a source of health indicators for rare diseases: The ten-year experience of the Veneto Region’s rare diseases registry. Orphanet J. Rare Dis. 2014, 9, 37. [Google Scholar] [CrossRef] [PubMed] [Green Version]
- Chen, Z.; Farrell, A.P.; Matala, A.; Narum, S.R. Mechanisms of thermal adaptation and evolutionary potential of conspecific populations to changing environments. Mol. Ecol. 2018, 27, 659–674. [Google Scholar] [CrossRef]
- Goncalves, P.; Jones, D.B.; Thompson, E.L.; Parker, L.M.; Ross, P.M.; Raftos, D.A. Transcriptomic profiling of adaptive responses to ocean acidification. Mol. Ecol. 2017, 26, 5974–5988. [Google Scholar] [CrossRef]
- Suzuki, S.; Horinouchi, T.; Furusawa, C. Prediction of antibiotic resistance by gene expression profiles. Nat. Commun. 2014, 5, 5792. [Google Scholar] [CrossRef] [Green Version]
- Li, L.; Dai, X.; Wang, Y.; Yang, Y.; Zhao, X.; Wang, L.; Zeng, M. RNA-seq-based analysis of drug-resistant Salmonella enterica serovar Typhimurium selected in vivo and in vitro. PLoS ONE 2017, 12, e0175234. [Google Scholar] [CrossRef] [Green Version]
- Stathias, V.; Pastori, C.; Griffin, T.Z.; Komotar, R.; Clarke, J.; Zhang, M.; Ayad, N.G. Identifying glioblastoma gene networks based on hypergeometric test analysis. PLoS ONE 2014, 9, e115842. [Google Scholar] [CrossRef] [PubMed] [Green Version]
- Gagan, J.; Van Allen, E.M. Next-generation sequencing to guide cancer therapy. Genome Med. 2015, 7, 80. [Google Scholar] [CrossRef] [Green Version]
- Kremer, L.S.; Bader, D.M.; Mertes, C.; Kopajtich, R.; Pichler, G.; Iuso, A.; Haack, T.B.; Graf, E.; Schwarzmayr, T.; Terrile, C. Genetic diagnosis of Mendelian disorders via RNA sequencing. Nat. Commun. 2017, 8, 15824. [Google Scholar] [CrossRef]
- Hadwen, J.; Schock, S.; Mears, A.; Yang, R.; Charron, P.; Zhang, L.; Xi, H.S.; MacKenzie, A. Transcriptomic RNAseq drug screen in cerebrocortical cultures: Toward novel neurogenetic disease therapies. Hum. Mol. Genet. 2018, 27, 3206–3217. [Google Scholar] [CrossRef] [PubMed]
- Poirier, M.B.; Hadwen, J.; MacKenzie, A. Pharmacologic normalization of pathogenic dosage underlying genetic diseases: An overview of the literature and path forward. Emerg. Top. Life Sci. 2019, 3, 53–62. [Google Scholar] [PubMed]
- Conesa, A.; Madrigal, P.; Tarazona, S.; Gomez-Cabrero, D.; Cervera, A.; McPherson, A.; Szcześniak, M.W.; Gaffney, D.J.; Elo, L.L.; Zhang, X. A survey of best practices for RNA-seq data analysis. Genome Biol. 2016, 17, 13. [Google Scholar] [CrossRef] [PubMed] [Green Version]
- Williams, C.R.; Baccarella, A.; Parrish, J.Z.; Kim, C.C. Empirical assessment of analysis workflows for differential expression analysis of human samples using RNA-Seq. BMC Bioinform. 2017, 18, 38. [Google Scholar] [CrossRef] [Green Version]
- Noble, W.S. How does multiple testing correction work? Nat. Biotechnol. 2009, 27, 1135–1137. [Google Scholar] [CrossRef] [Green Version]
- Li, J.; Witten, D.M.; Johnstone, I.M.; Tibshirani, R. Normalization, testing, and false discovery rate estimation for RNA-sequencing data. Biostatistics 2012, 13, 523–538. [Google Scholar] [CrossRef]
- Kunkel, S.D.; Suneja, M.; Ebert, S.M.; Bongers, K.S.; Fox, D.K.; Malmberg, S.E.; Alipour, F.; Shields, R.K.; Adams, C.M. mRNA expression signatures of human skeletal muscle atrophy identify a natural compound that increases muscle mass. Cell Metab. 2011, 13, 627–638. [Google Scholar] [CrossRef] [Green Version]
- Lamb, J.; Crawford, E.D.; Peck, D.; Modell, J.W.; Blat, I.C.; Wrobel, M.J.; Lerner, J.; Brunet, J.-P.; Subramanian, A.; Ross, K.N. The Connectivity Map: Using gene-expression signatures to connect small molecules, genes, and disease. Science 2006, 313, 1929–1935. [Google Scholar] [CrossRef] [PubMed] [Green Version]
- Mears, A.; Schock, S.; Hadwen, J.; Putos, S.; Dyment, D.; Boycott, K.; MacKenzie, A. Mining the transcriptome for rare disease therapies: A comparison of the efficiencies of two data mining approaches and a targeted cell-based drug screen. NPJ Genom. Med. 2017, 2, 14. [Google Scholar] [CrossRef] [PubMed]
- Witherspoon, L.; O’Reilly, S.; Hadwen, J.; Tasnim, N.; MacKenzie, A.; Farooq, F. Sodium channel inhibitors reduce DMPK mRNA and protein. Clin. Transl. Sci. 2015, 8, 298–304. [Google Scholar] [CrossRef] [Green Version]
- Farooq, F.; Abadía-Molina, F.; MacKenzie, D.; Hadwen, J.; Shamim, F.; O’Reilly, S.; Holcik, M.; MacKenzie, A. Celecoxib increases SMN and survival in a severe spinal muscular atrophy mouse model via p38 pathway activation. Hum. Mol. Genet. 2013, 22, 3415–3424. [Google Scholar] [CrossRef] [PubMed] [Green Version]
- Hadwen, J.; MacKenzie, D.; Shamim, F.; Mongeon, K.; Holcik, M.; MacKenzie, A.; Farooq, F. VPAC2 receptor agonist BAY 55-9837 increases SMN protein levels and moderates disease phenotype in severe spinal muscular atrophy mouse models. Orphanet J. Rare Dis. 2014, 9, 4. [Google Scholar] [CrossRef] [Green Version]
- Huang, D.W.; Sherman, B.T.; Lempicki, R.A. Bioinformatics enrichment tools: Paths toward the comprehensive functional analysis of large gene lists. Nucleic Acids Res. 2009, 37, 1–13. [Google Scholar] [CrossRef] [Green Version]
- Krämer, A.; Green, J.; Pollard, J., Jr.; Tugendreich, S. Causal analysis approaches in ingenuity pathway analysis. Bioinformatics 2014, 30, 523–530. [Google Scholar] [CrossRef]
- Ahsan, S.; Drăghici, S. Identifying significantly impacted pathways and putative mechanisms with iPathwayGuide. Curr. Protoc. Bioinform. 2017, 57, 7–15. [Google Scholar] [CrossRef] [PubMed]
- Van Iersel, M.P.; Kelder, T.; Pico, A.R.; Hanspers, K.; Coort, S.; Conklin, B.R.; Evelo, C. Presenting and exploring biological pathways with PathVisio. BMC Bioinform. 2008, 9, 399. [Google Scholar] [CrossRef] [Green Version]
- Lv, Y.-W.; Wang, J.; Sun, L.; Zhang, J.-M.; Cao, L.; Ding, Y.-Y.; Chen, Y.; Dou, J.-J.; Huang, J.; Tang, Y.-F. Understanding the pathogenesis of Kawasaki disease by network and pathway analysis. Comput. Math. Methods Med. 2013, 2013, 989307. [Google Scholar] [CrossRef]
- Abatangelo, L.; Maglietta, R.; Distaso, A.; D’Addabbo, A.; Creanza, T.M.; Mukherjee, S.; Ancona, N. Comparative study of gene set enrichment methods. BMC Bioinform. 2009, 10, 275. [Google Scholar] [CrossRef] [PubMed] [Green Version]
- Huang, S.A. Physiology and pathophysiology of type 3 deiodinase in humans. Thyroid 2005, 15, 875–881. [Google Scholar] [CrossRef]
- Gil-Ibañez, P.; García-García, F.; Dopazo, J.; Bernal, J.; Morte, B. Global transcriptome analysis of primary cerebrocortical cells: Identification of genes regulated by triiodothyronine in specific cell types. Cereb. Cortex 2017, 27, 706–717. [Google Scholar] [CrossRef] [PubMed] [Green Version]
- Wierstra, I. The transcription factor FOXM1 (Forkhead box M1): Proliferation-specific expression, transcription factor function, target genes, mouse models, and normal biological roles. Adv. Cancer Res. 2013, 118, 97–398. [Google Scholar]
- Vermeer, H.; Hendriks-Stegeman, B.I.; van der Burg, B.; van Buul-Offers, S.C.; Jansen, M. Glucocorticoid-induced increase in lymphocytic FKBP51 messenger ribonucleic acid expression: A potential marker for glucocorticoid sensitivity, potency, and bioavailability. J. Clin. Endocrinol. Metab. 2003, 88, 277–284. [Google Scholar] [CrossRef] [PubMed]
- Frahm, K.A.; Peffer, M.E.; Zhang, J.Y.; Luthra, S.; Chakka, A.B.; Couger, M.B.; Chandran, U.R.; Monaghan, A.P.; DeFranco, D.B. Research resource: The dexamethasone transcriptome in hypothalamic embryonic neural stem cells. Mol. Endocrinol. 2016, 30, 144–154. [Google Scholar] [CrossRef] [PubMed]
- Stuart, J.M.; Segal, E.; Koller, D.; Kim, S.K. A gene-coexpression network for global discovery of conserved genetic modules. Science 2003, 302, 249–255. [Google Scholar] [CrossRef] [Green Version]
- Delahaye-Duriez, A.; Srivastava, P.; Shkura, K.; Langley, S.R.; Laaniste, L.; Moreno-Moral, A.; Danis, B.; Mazzuferi, M.; Foerch, P.; Gazina, E.V. Rare and common epilepsies converge on a shared gene regulatory network providing opportunities for novel antiepileptic drug discovery. Genome Biol. 2016, 17, 245. [Google Scholar] [CrossRef] [Green Version]
- Boycott, K.M.; Vanstone, M.R.; Bulman, D.E.; MacKenzie, A.E. Rare-disease genetics in the era of next-generation sequencing: Discovery to translation. Nat. Rev. Genet. 2013, 14, 681–691. [Google Scholar] [CrossRef]
- Boycott, K.M.; Rath, A.; Chong, J.X.; Hartley, T.; Alkuraya, F.S.; Baynam, G.; Brookes, A.J.; Brudno, M.; Carracedo, A.; den Dunnen, J.T. International cooperation to enable the diagnosis of all rare genetic diseases. Am. J. Hum. Genet. 2017, 100, 695–705. [Google Scholar] [CrossRef] [PubMed] [Green Version]
- Mirzaa, G.M.; Vitre, B.; Carpenter, G.; Abramowicz, I.; Gleeson, J.G.; Paciorkowski, A.R.; Cleveland, D.W.; Dobyns, W.B.; O’Driscoll, M. Mutations in CENPE define a novel kinetochore-centromeric mechanism for microcephalic primordial dwarfism. Hum. Genet. 2014, 133, 1023–1039. [Google Scholar] [CrossRef] [Green Version]
- Waters, A.M.; Asfahani, R.; Carroll, P.; Bicknell, L.; Lescai, F.; Bright, A.; Chanudet, E.; Brooks, A.; Christou-Savina, S.; Osman, G. The kinetochore protein, CENPF, is mutated in human ciliopathy and microcephaly phenotypes. J. Med Genet. 2015, 52, 147–156. [Google Scholar] [CrossRef] [Green Version]
- Gal, A.; Li, Y.; Thompson, D.A.; Weir, J.; Orth, U.; Jacobson, S.G.; Apfelstedt-Sylla, E.; Vollrath, D. Mutations in MERTK, the human orthologue of the RCS rat retinal dystrophy gene, cause retinitis pigmentosa. Nat. Genet. 2000, 26, 270–271. [Google Scholar] [CrossRef] [PubMed]
- Alakbarzade, V.; Hameed, A.; Quek, D.Q.; Chioza, B.A.; Baple, E.L.; Cazenave-Gassiot, A.; Nguyen, L.N.; Wenk, M.R.; Ahmad, A.Q.; Sreekantan-Nair, A. A partially inactivating mutation in the sodium-dependent lysophosphatidylcholine transporter MFSD2A causes a non-lethal microcephaly syndrome. Nat. Genet. 2015, 47, 814–817. [Google Scholar] [CrossRef]
- Sugimura, S.; Kobayashi, N.; Okae, H.; Yamanouchi, T.; Matsuda, H.; Kojima, T.; Yajima, A.; Hashiyada, Y.; Kaneda, M.; Sato, K. Transcriptomic signature of the follicular somatic compartment surrounding an oocyte with high developmental competence. Sci. Rep. 2017, 7, 6815. [Google Scholar] [CrossRef] [Green Version]
- Oghumu, S.; Nori, U.; Bracewell, A.; Zhang, J.; Bott, C.; Nadasdy, G.M.; Brodsky, S.V.; Pelletier, R.; Satoskar, A.R.; Nadasdy, T. Differential gene expression pattern in biopsies with renal allograft pyelonephritis and allograft rejection. Clin. Transplant. 2016, 30, 1115–1133. [Google Scholar] [CrossRef]
- Hurem, S.; Martín, L.M.; Brede, D.A.; Skjerve, E.; Nourizadeh-Lillabadi, R.; Lind, O.C.; Christensen, T.; Berg, V.; Teien, H.-C.; Salbu, B. Dose-dependent effects of gamma radiation on the early zebrafish development and gene expression. PLoS ONE 2017, 12, e0179259. [Google Scholar] [CrossRef] [Green Version]
- Boucher, J.G.; Gagné, R.; Rowan-Carroll, A.; Boudreau, A.; Yauk, C.L.; Atlas, E. Bisphenol A and bisphenol S induce distinct transcriptional profiles in differentiating human primary preadipocytes. PLoS ONE 2016, 11, e0163318. [Google Scholar] [CrossRef] [PubMed] [Green Version]
- Langfelder, P.; Horvath, S. WGCNA: An R package for weighted correlation network analysis. BMC Bioinform. 2008, 9, 559. [Google Scholar] [CrossRef] [PubMed] [Green Version]
- Benincasa, G.; de Candia, P.; Costa, D.; Faenza, M.; Mansueto, G.; Ambrosio, G.; Napoli, C. Network Medicine Approach in Prevention and Personalized Treatment of Dyslipidemias. Lipids 2020. [Google Scholar] [CrossRef]
- Luo, R.; Song, J.; Zhang, W.; Ran, L. Identification of MFI2-AS1, a Novel Pivotal lncRNA for Prognosis of Stage III/IV Colorectal Cancer. Dig. Dis. Sci. 2020, 65, 3538–3550. [Google Scholar] [CrossRef]
- Weng, W.; Zhang, Z.; Huang, W.; Xu, X.; Wu, B.; Ye, T.; Shan, Y.; Shi, K.; Lin, Z. Identification of a competing endogenous RNA network associated with prognosis of pancreatic adenocarcinoma. Cancer Cell Int. 2020, 20, 231. [Google Scholar] [CrossRef]
- Kopp, N.; Climer, S.; Dougherty, J.D. Moving from capstones toward cornerstones: Successes and challenges in applying systems biology to identify mechanisms of autism spectrum disorders. Front. Genet. 2015, 6, 301. [Google Scholar] [CrossRef] [PubMed] [Green Version]


| Drug Name | Upstream Regulator | Expression Fold Change | Predicted Activation State | Activation Z-Score | p-Value of Overlap | Number of Genes |
|---|---|---|---|---|---|---|
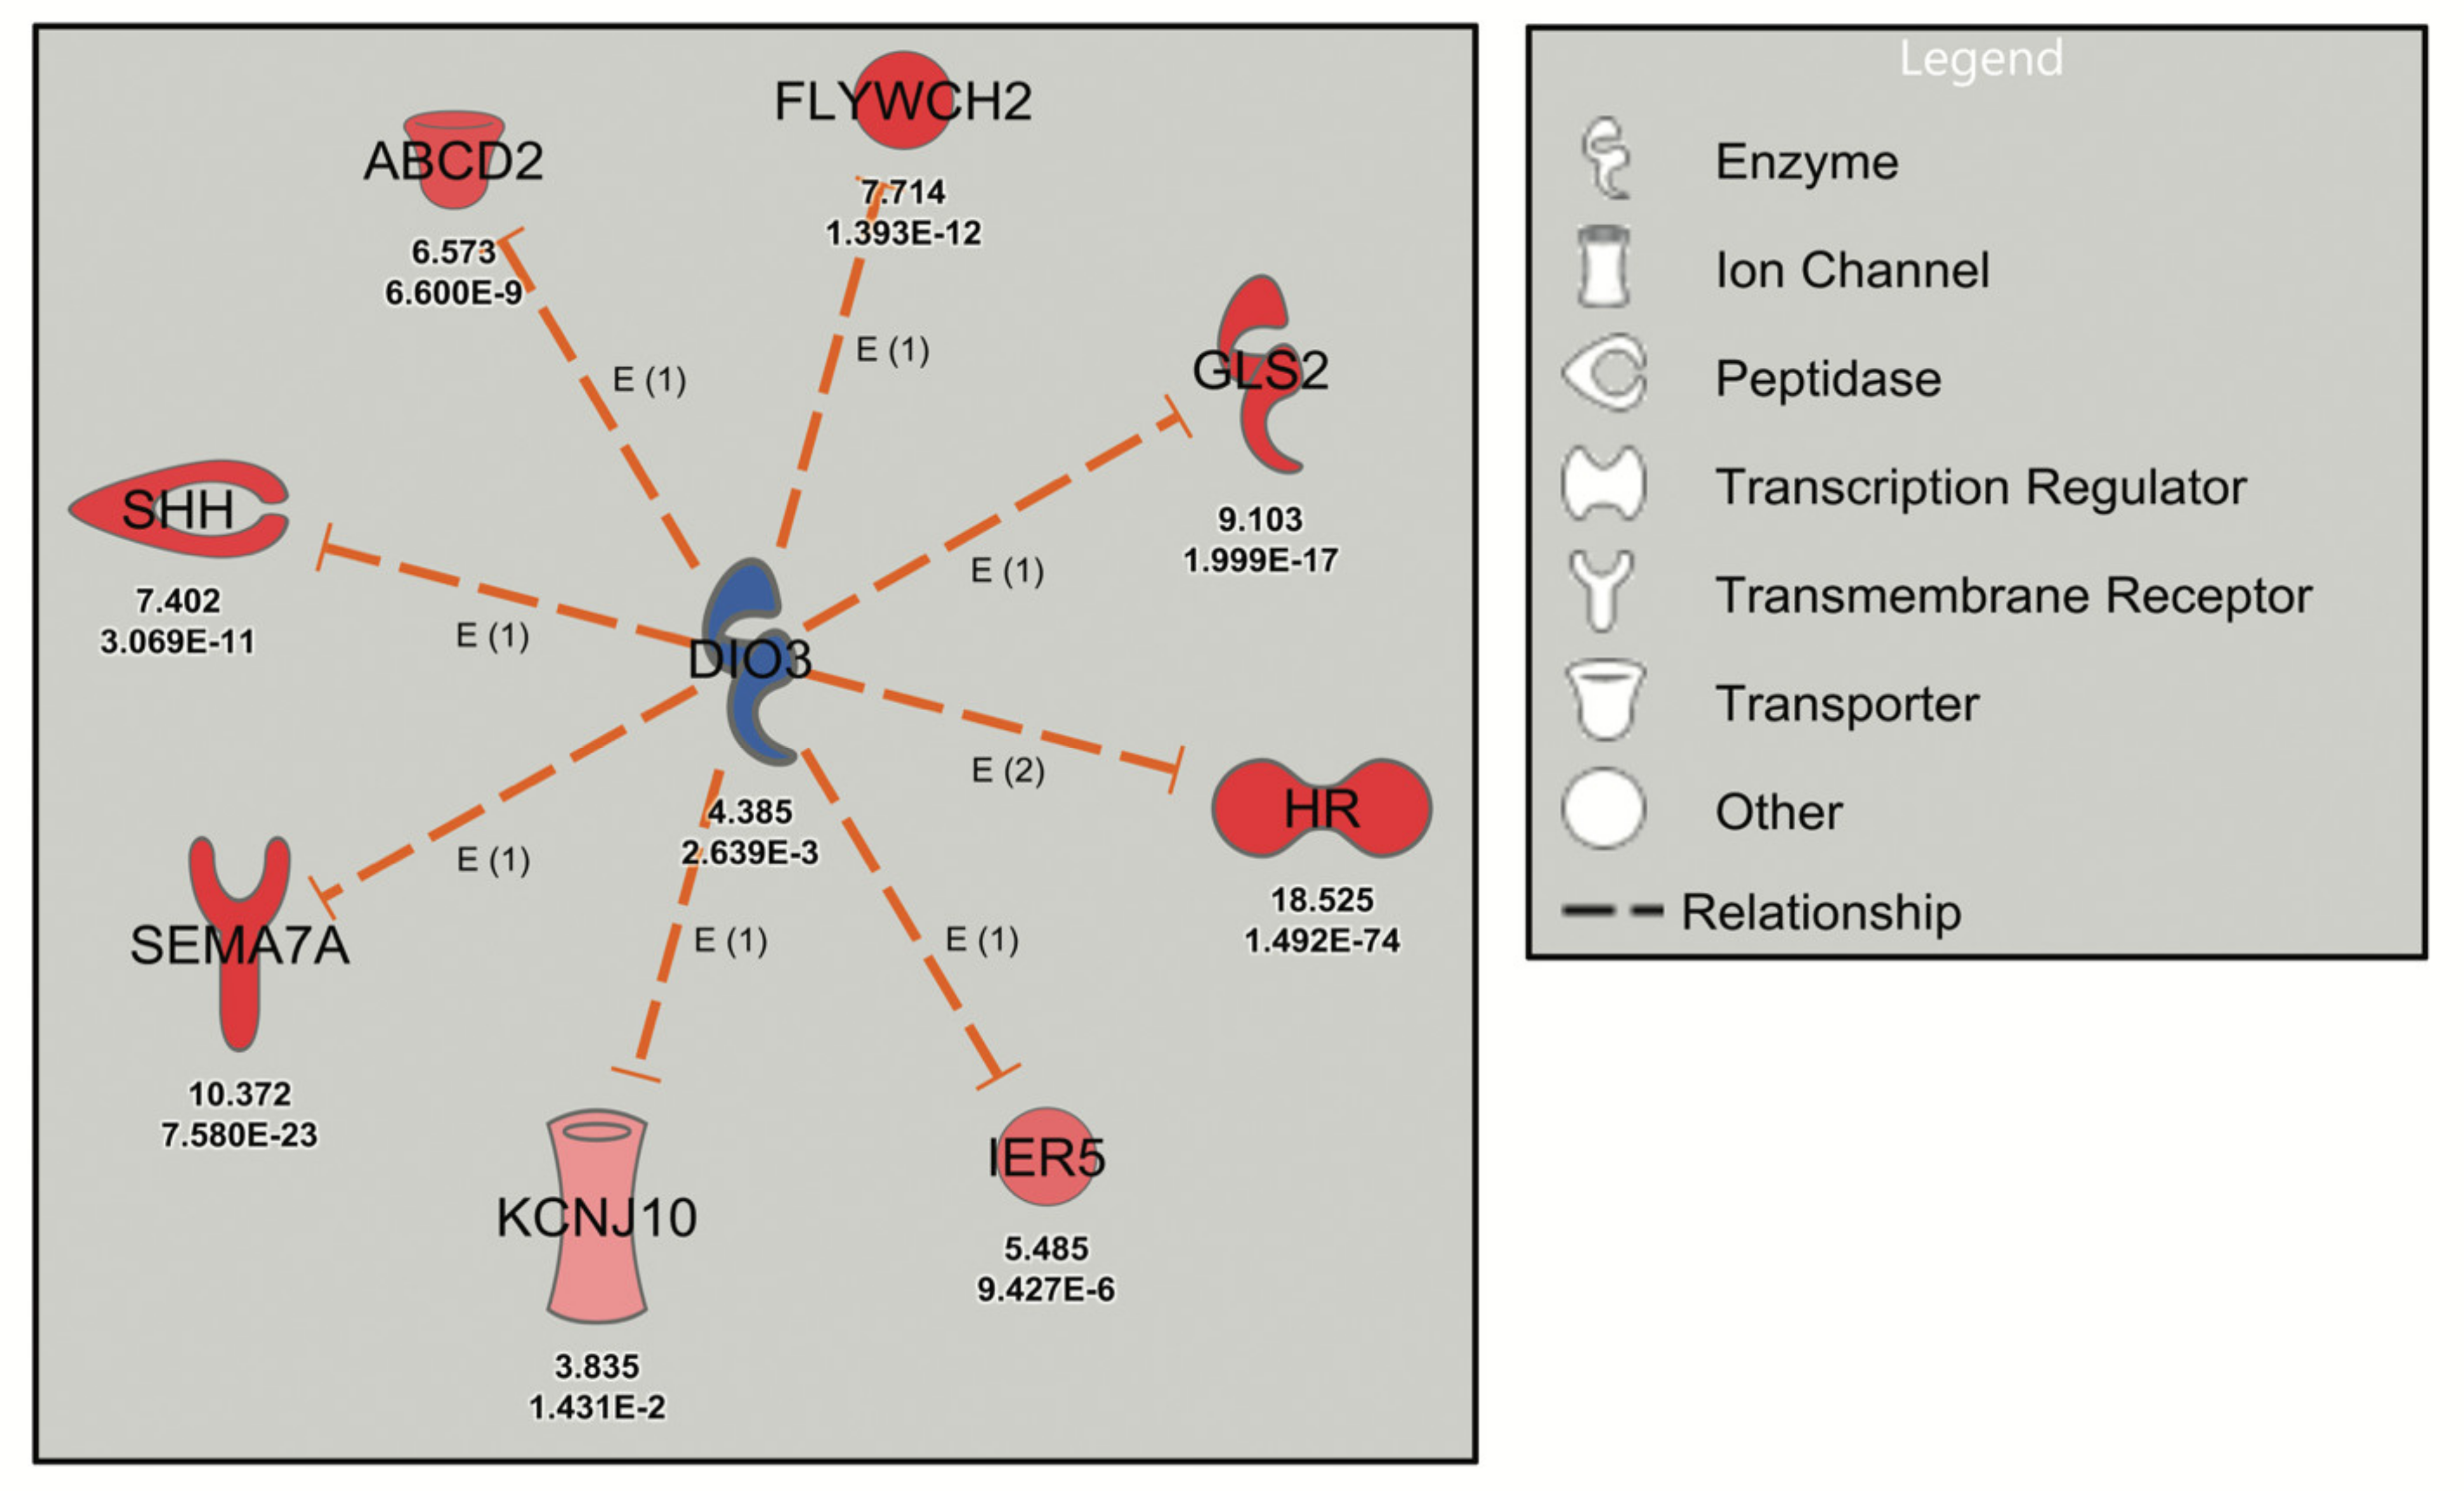
| Levothyroxine | DIO3 | 4.385 | Inhibited | −2.975 | 1.79 × 10⁻⁷ | 8 |
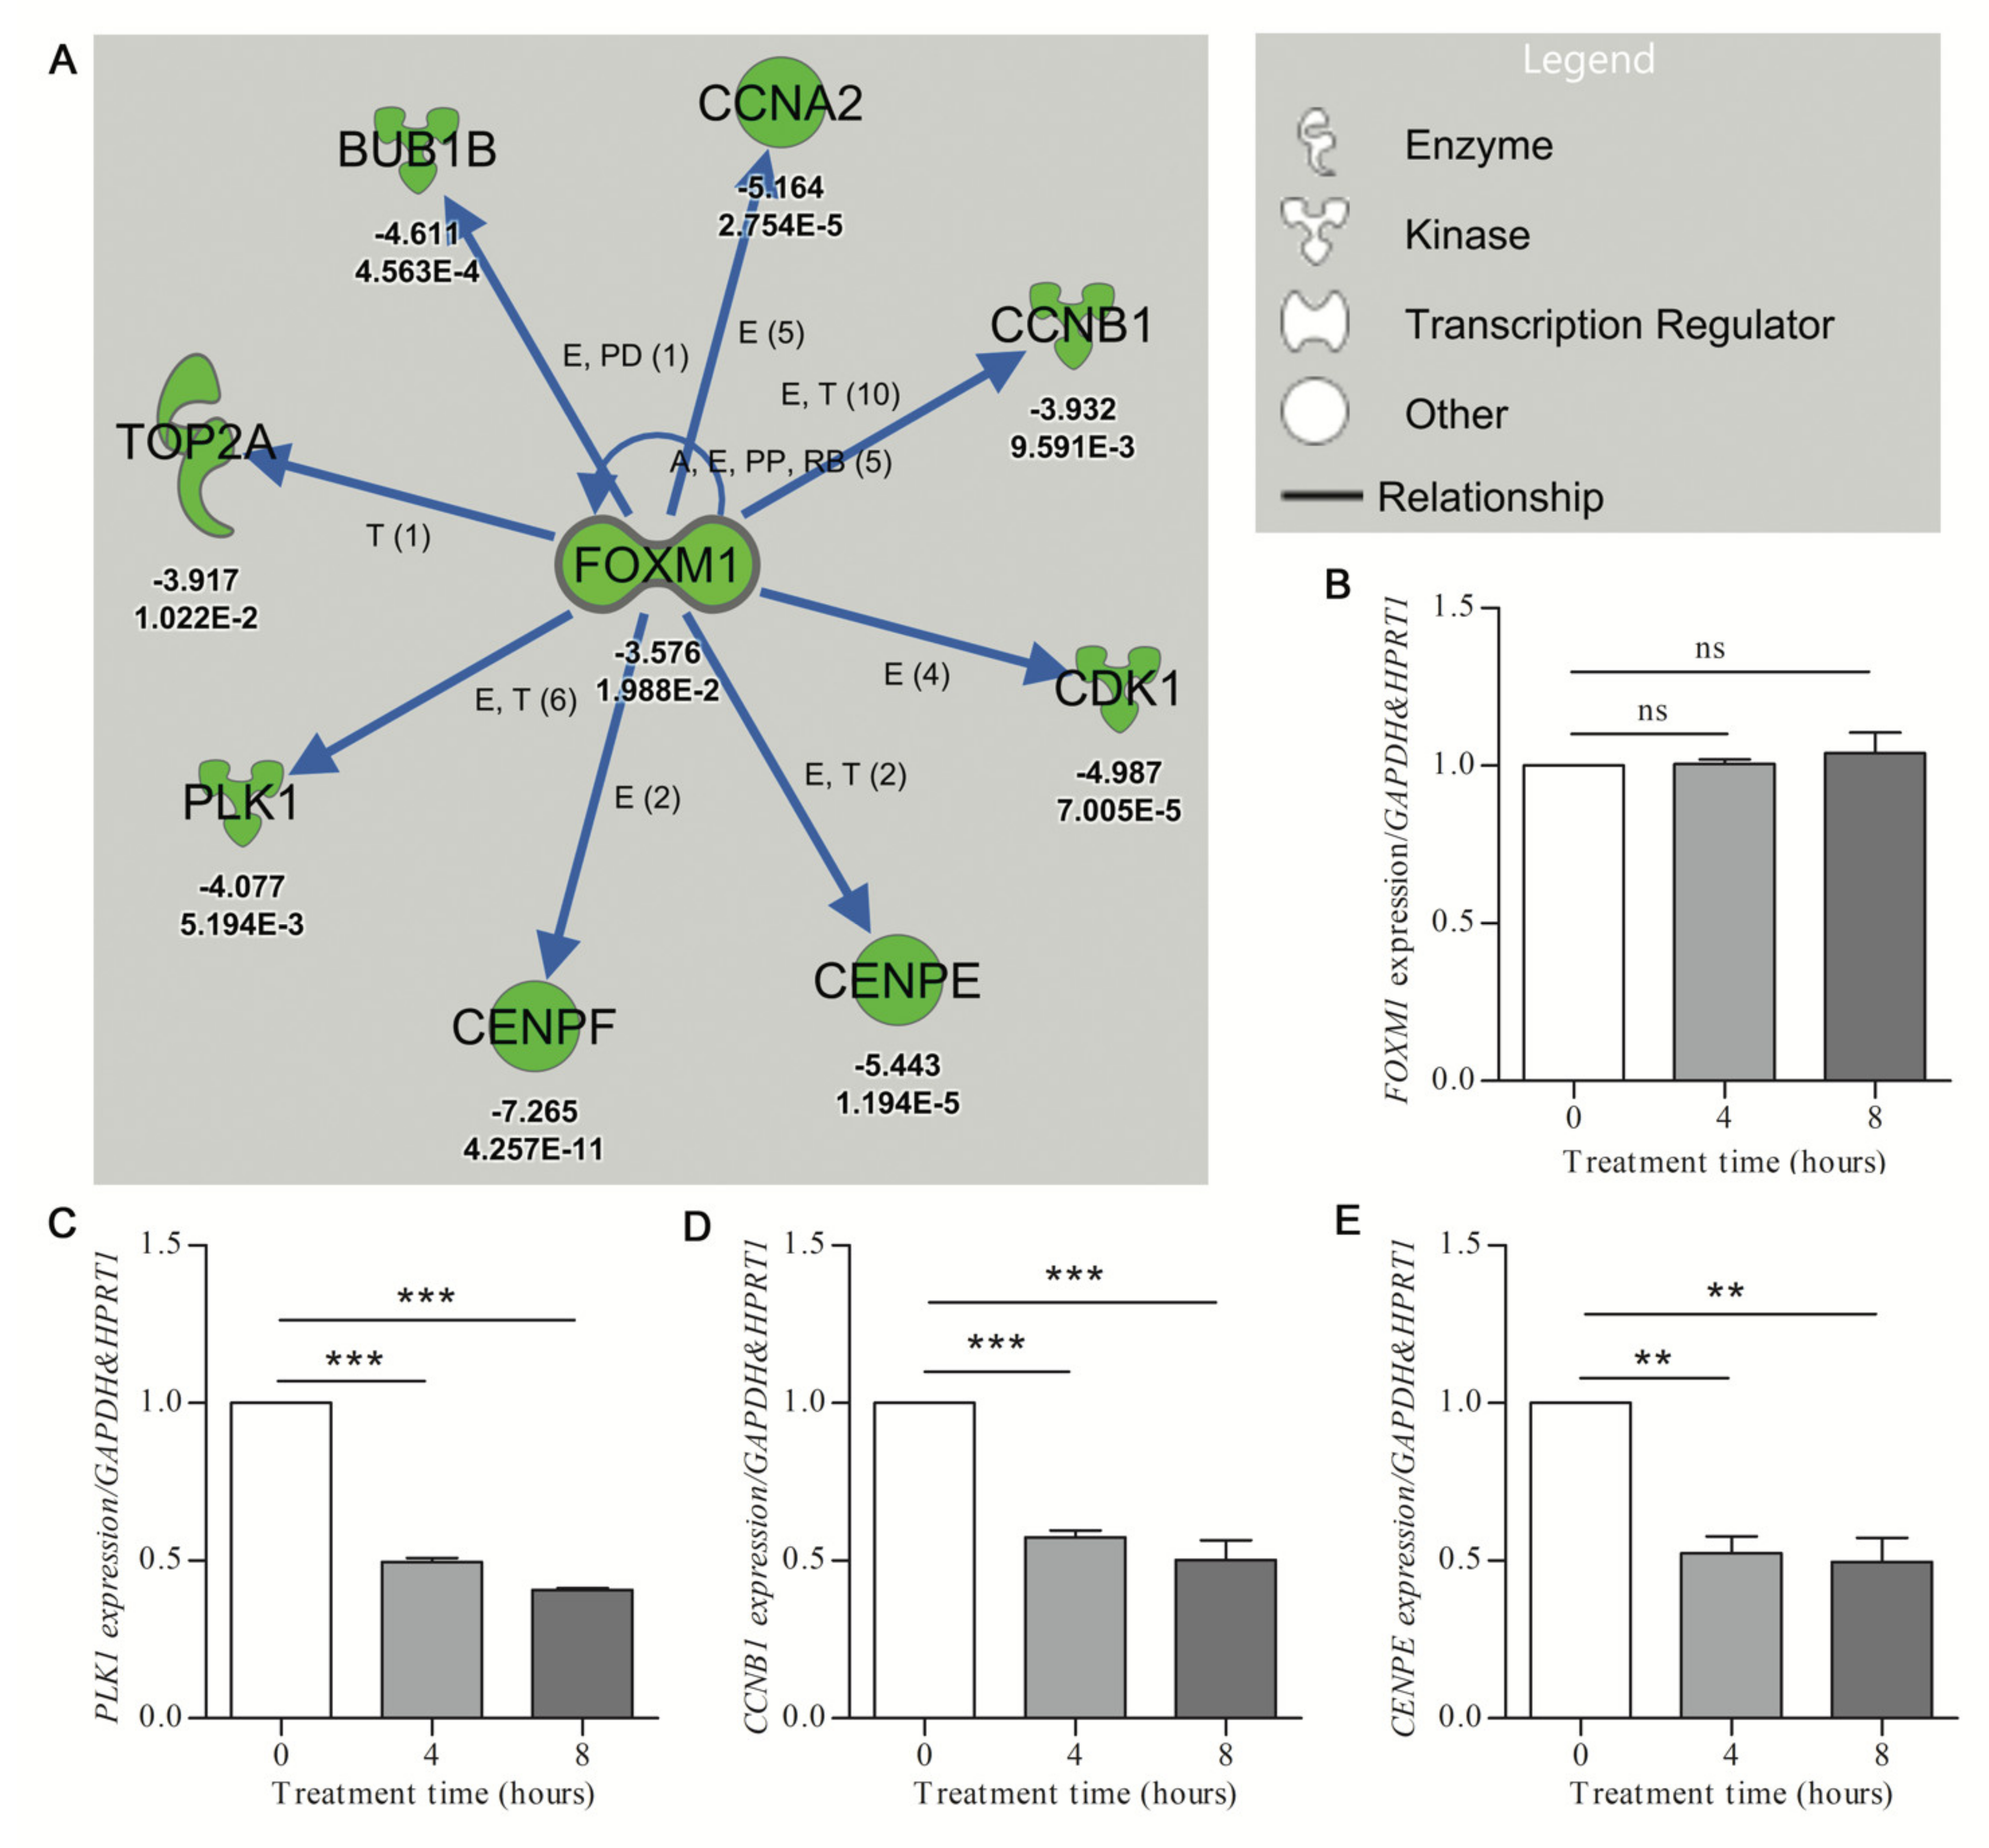
| Hydroxyurea | FOXM1 | −3.579 | Inhibited | −3.245 | 1.63 × 10⁻¹⁰ | 8 |
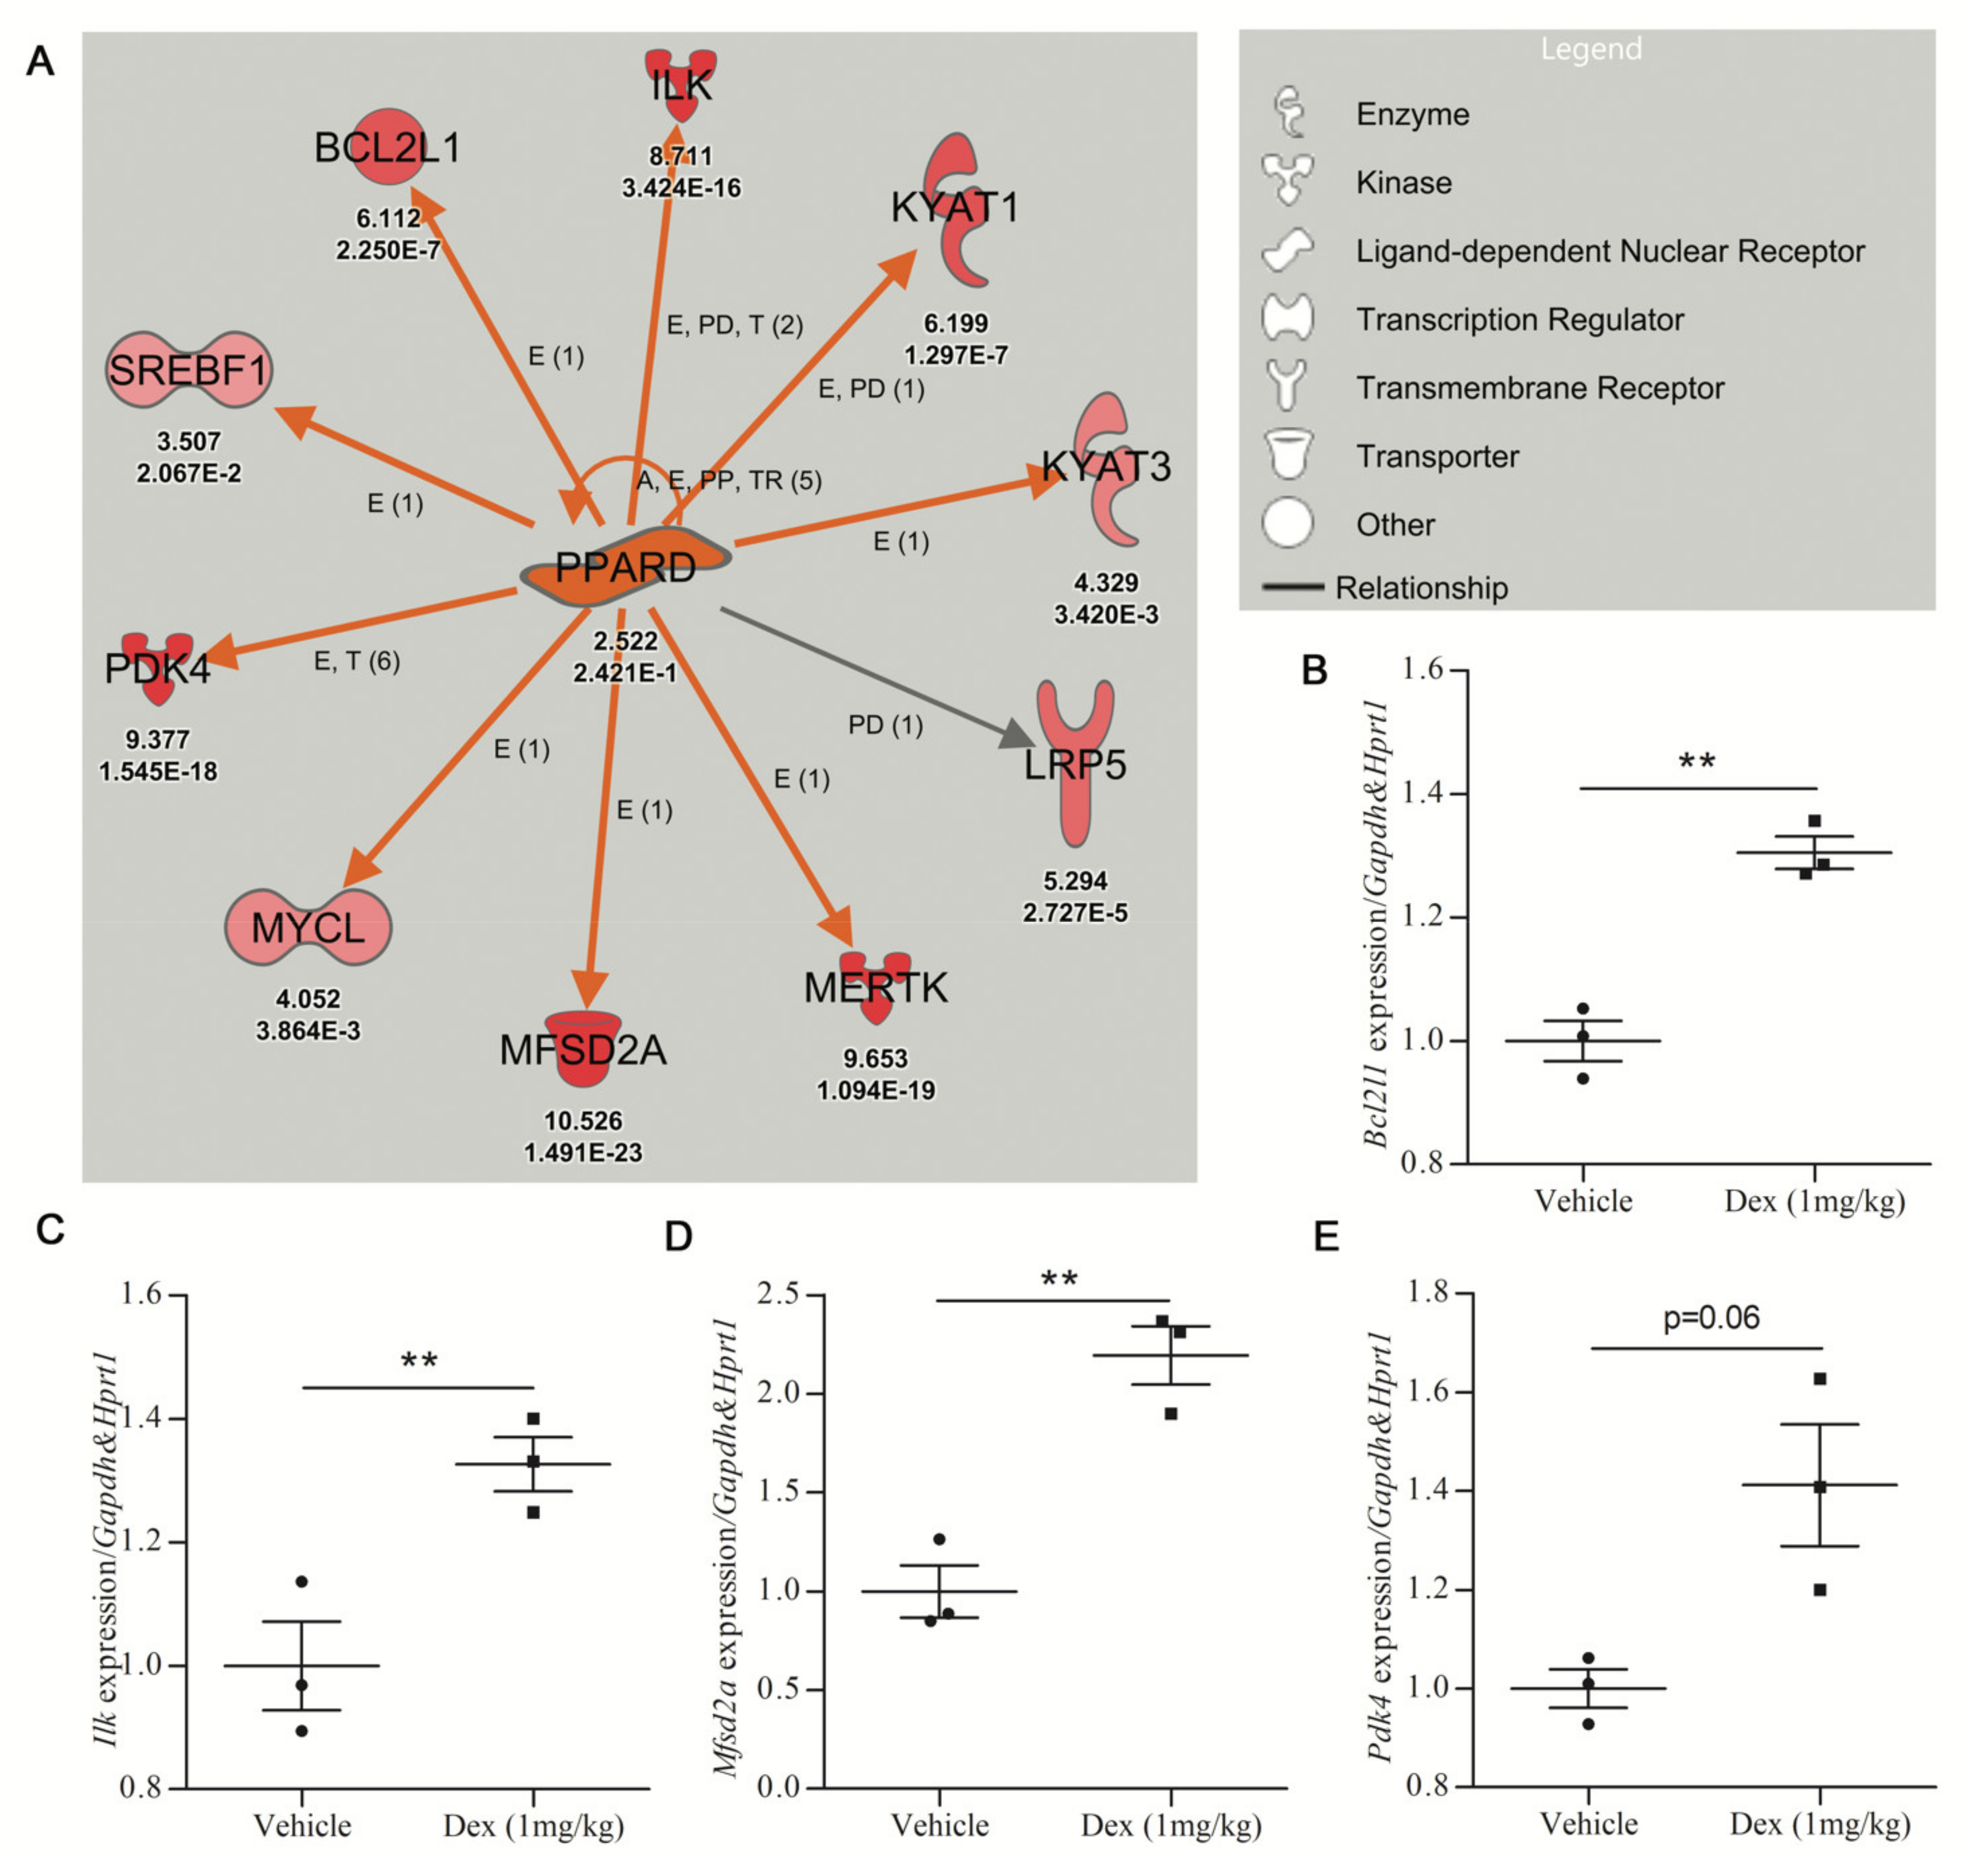
| Dexamethasone | PPARD | 2.522 | Activated | 3.126 | 4.58 × 10⁻² | 10 |
| Dexamethasone | STAT4 | NA | Activated | 2.933 | 7.36 × 10⁻⁴ | 12 |
| Vigabatrin | MKNK1 | 1.187 | Inhibited | −3 | 1.40 × 10⁻⁴ | 5 |
| Pregabalin | PGR | 1.013 | Activated | 3.376 | 7.77 × 10⁻⁹ | 13 |
Publisher’s Note: MDPI stays neutral with regard to jurisdictional claims in published maps and institutional affiliations. |
© 2021 by the authors. Licensee MDPI, Basel, Switzerland. This article is an open access article distributed under the terms and conditions of the Creative Commons Attribution (CC BY) license (https://creativecommons.org/licenses/by/4.0/).
Share and Cite
Hadwen, J.; Schock, S.; Farooq, F.; MacKenzie, A.; Plaza-Diaz, J. Separating the Wheat from the Chaff: The Use of Upstream Regulator Analysis to Identify True Differential Expression of Single Genes within Transcriptomic Datasets. Int. J. Mol. Sci. 2021, 22, 6295. https://doi.org/10.3390/ijms22126295
Hadwen J, Schock S, Farooq F, MacKenzie A, Plaza-Diaz J. Separating the Wheat from the Chaff: The Use of Upstream Regulator Analysis to Identify True Differential Expression of Single Genes within Transcriptomic Datasets. International Journal of Molecular Sciences. 2021; 22(12):6295. https://doi.org/10.3390/ijms22126295
Chicago/Turabian StyleHadwen, Jeremiah, Sarah Schock, Faraz Farooq, Alex MacKenzie, and Julio Plaza-Diaz. 2021. "Separating the Wheat from the Chaff: The Use of Upstream Regulator Analysis to Identify True Differential Expression of Single Genes within Transcriptomic Datasets" International Journal of Molecular Sciences 22, no. 12: 6295. https://doi.org/10.3390/ijms22126295