
The Deubiquitinase OTUB1 Is a Key Regulator of Energy Metabolism

 , , , , , and
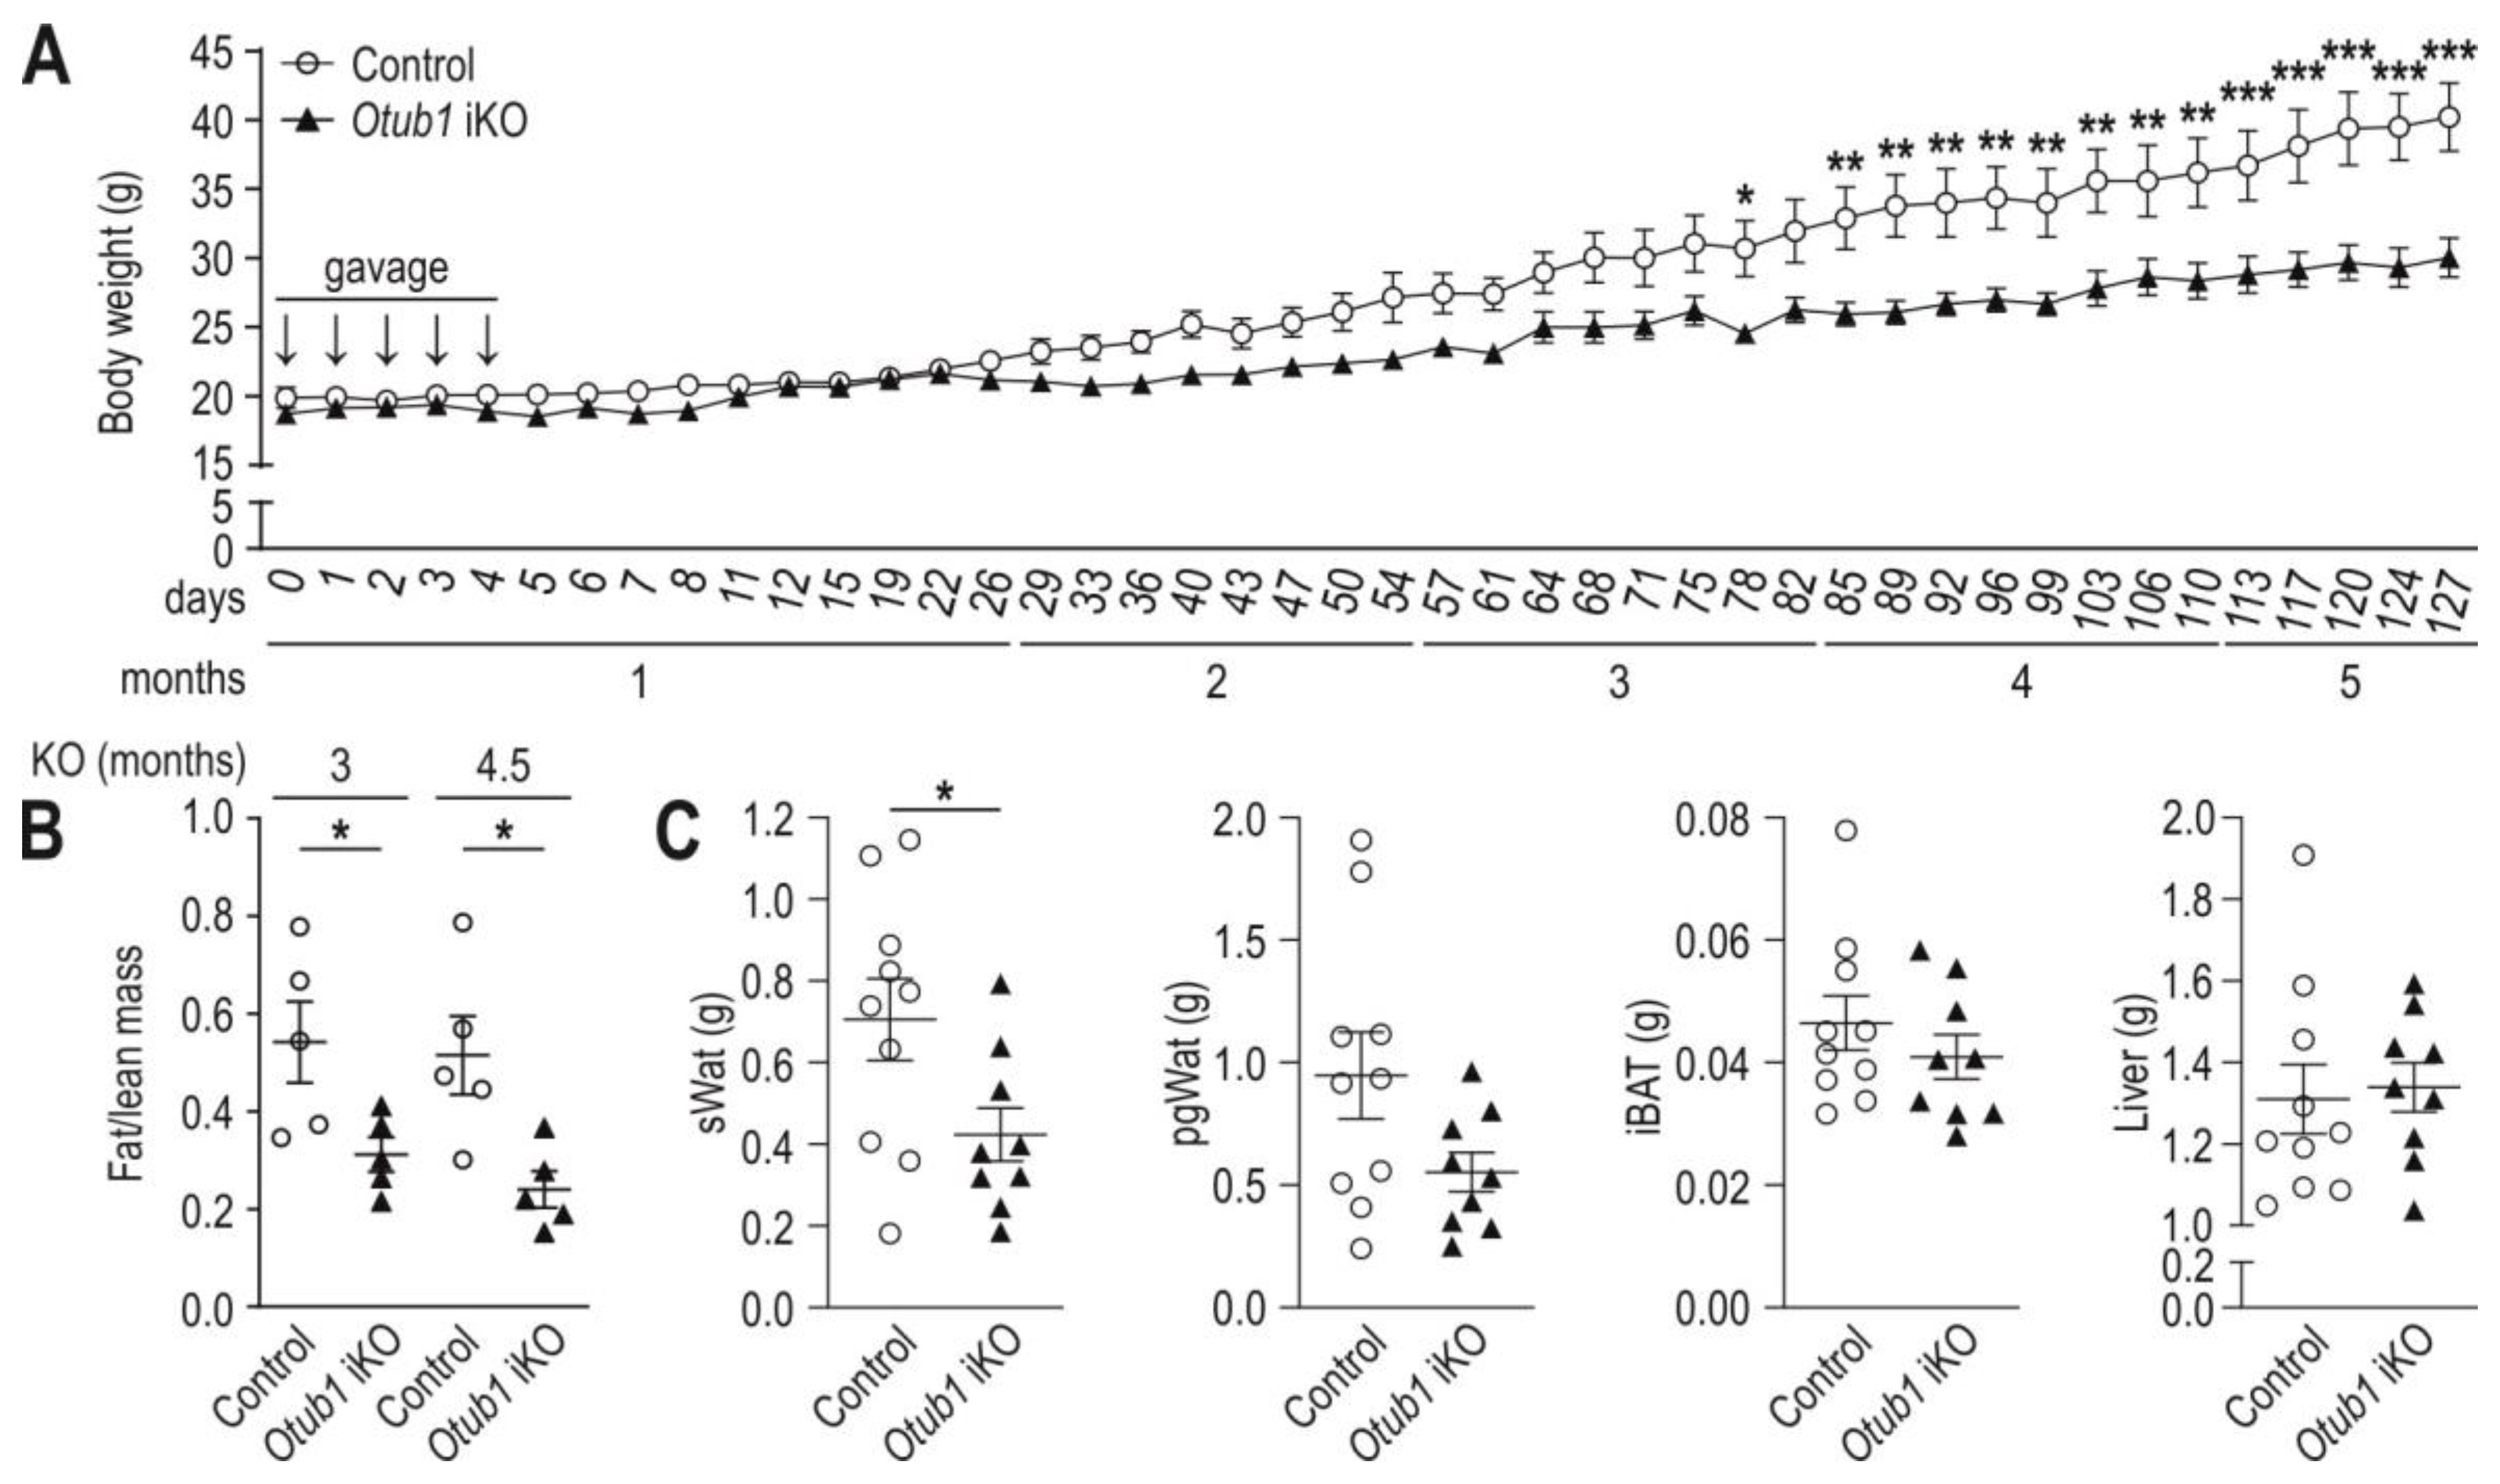
Abstract
:1. Introduction
2. Results
2.1. Induced Otub1 Ablation Decreases Weight Gain and Fat Mass in Mice
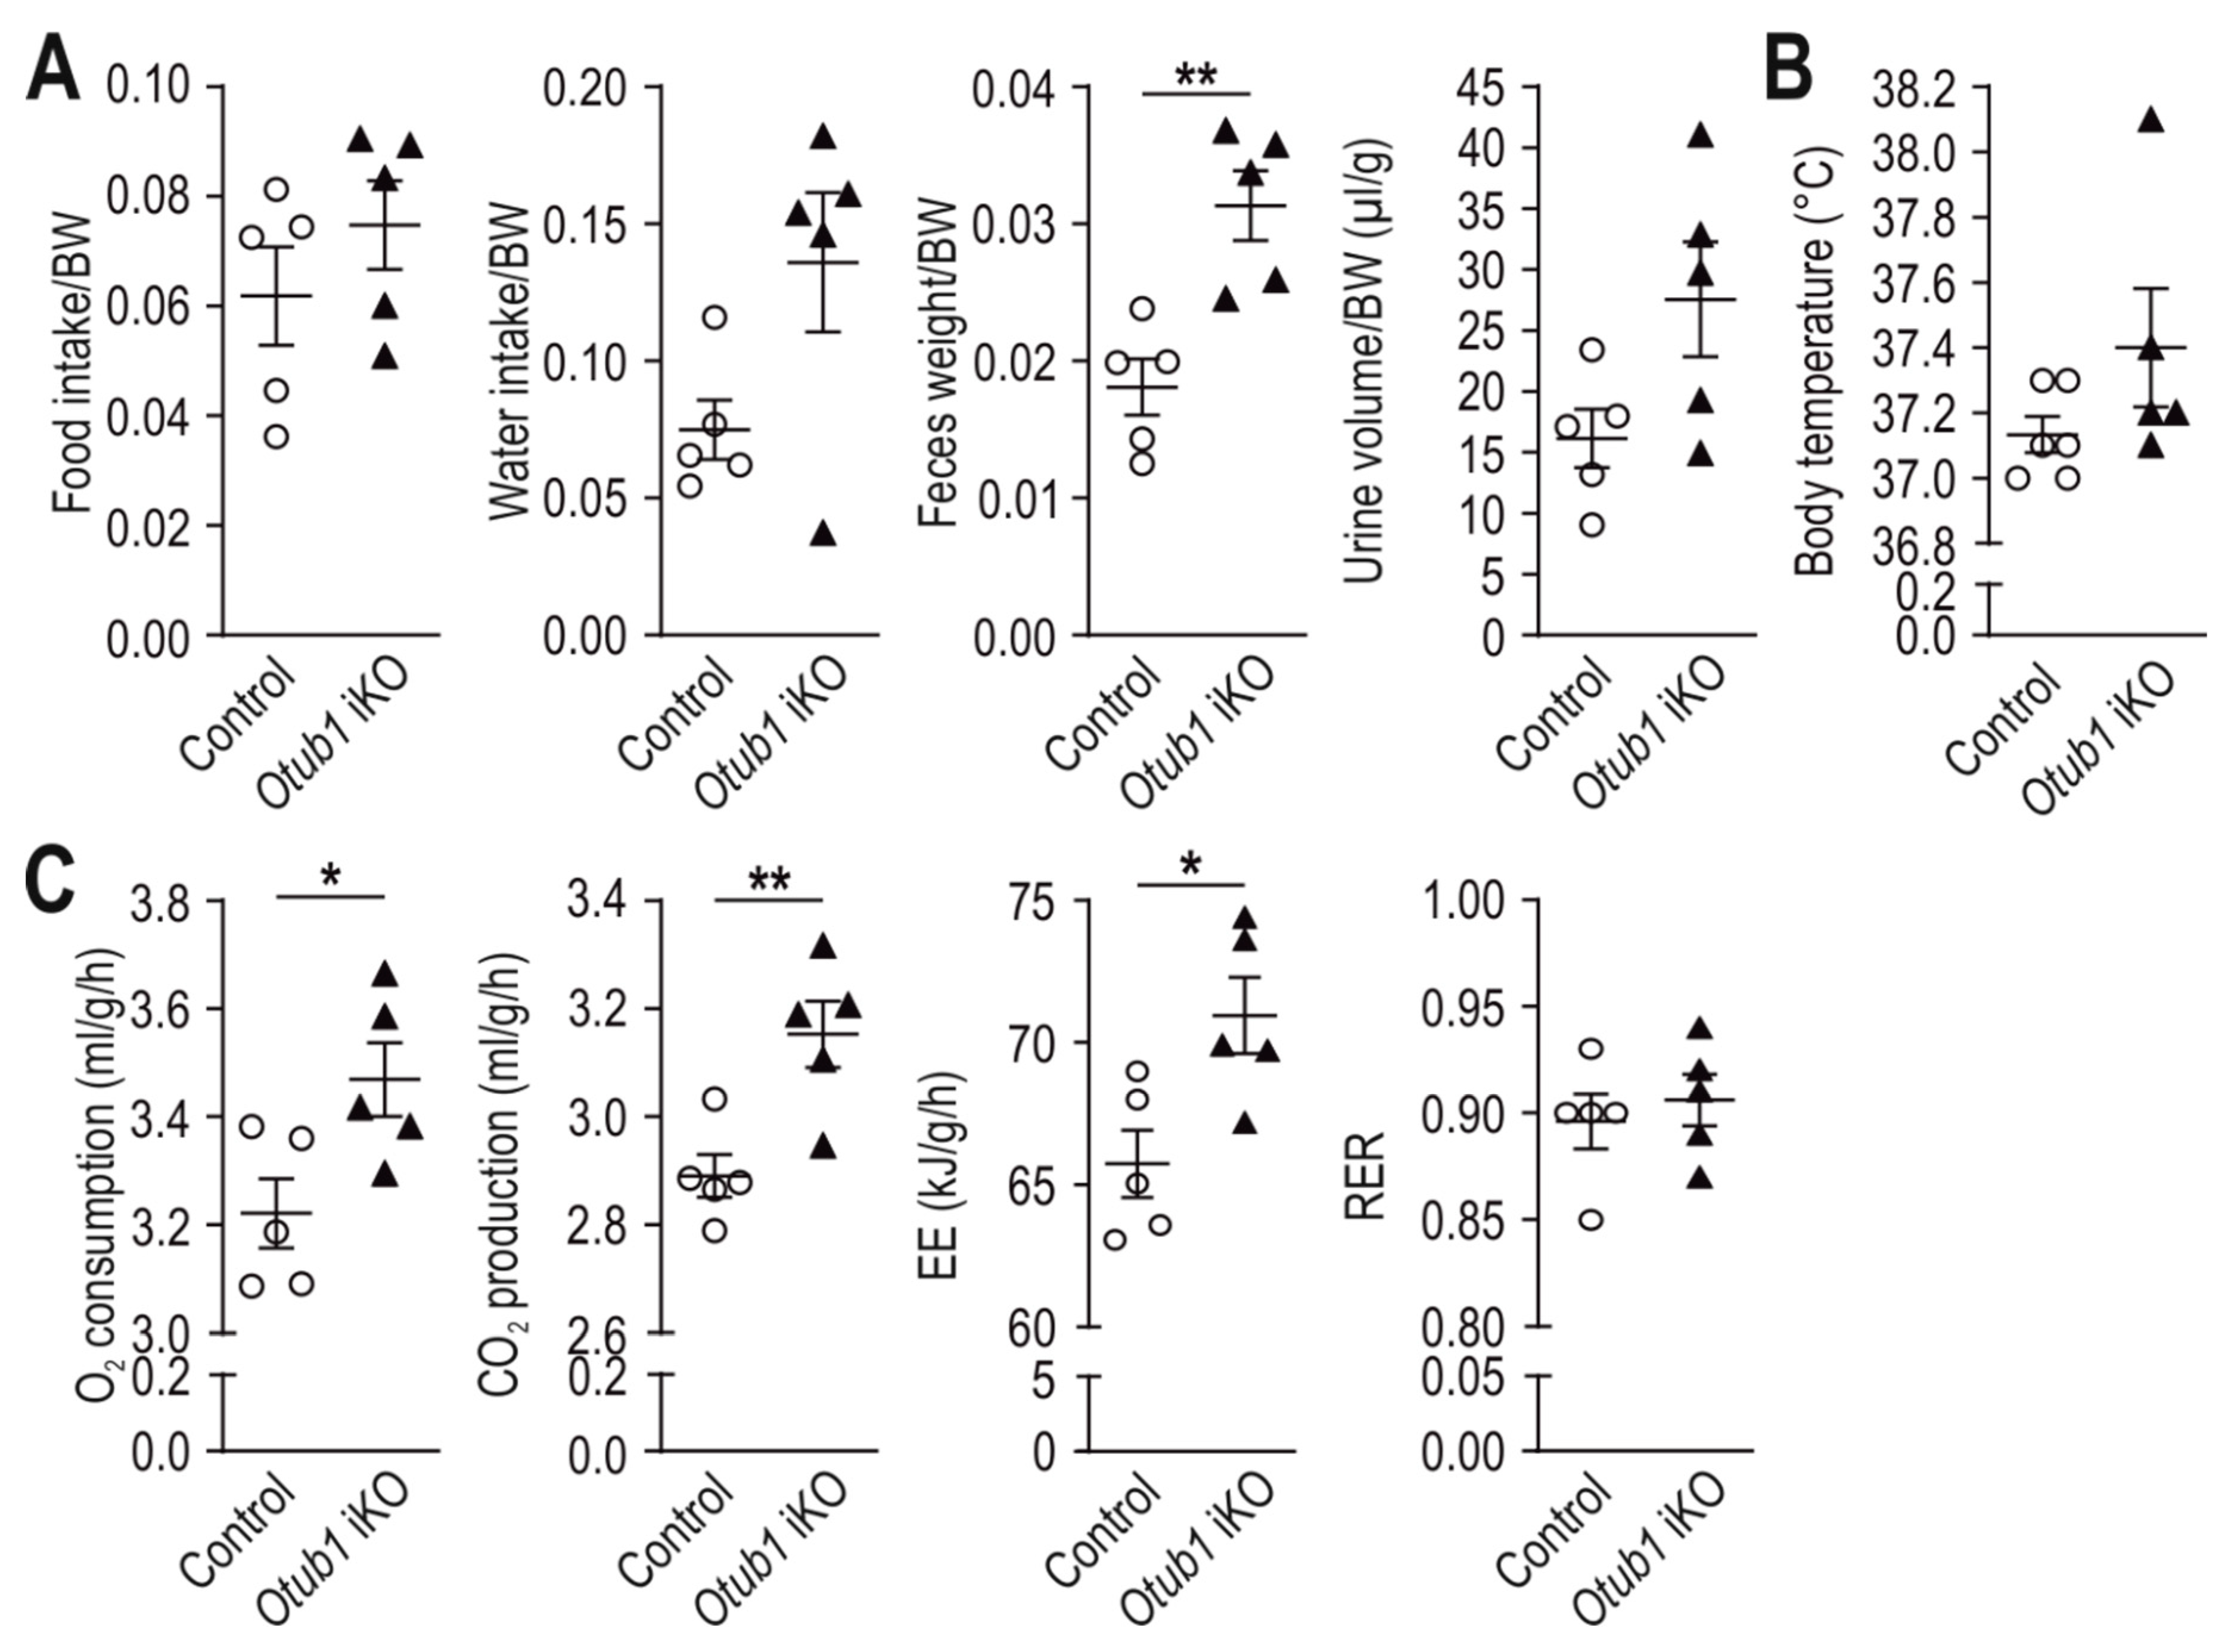
2.2. Loss of Otub1 Leads to a Hypermetabolic State In Vivo
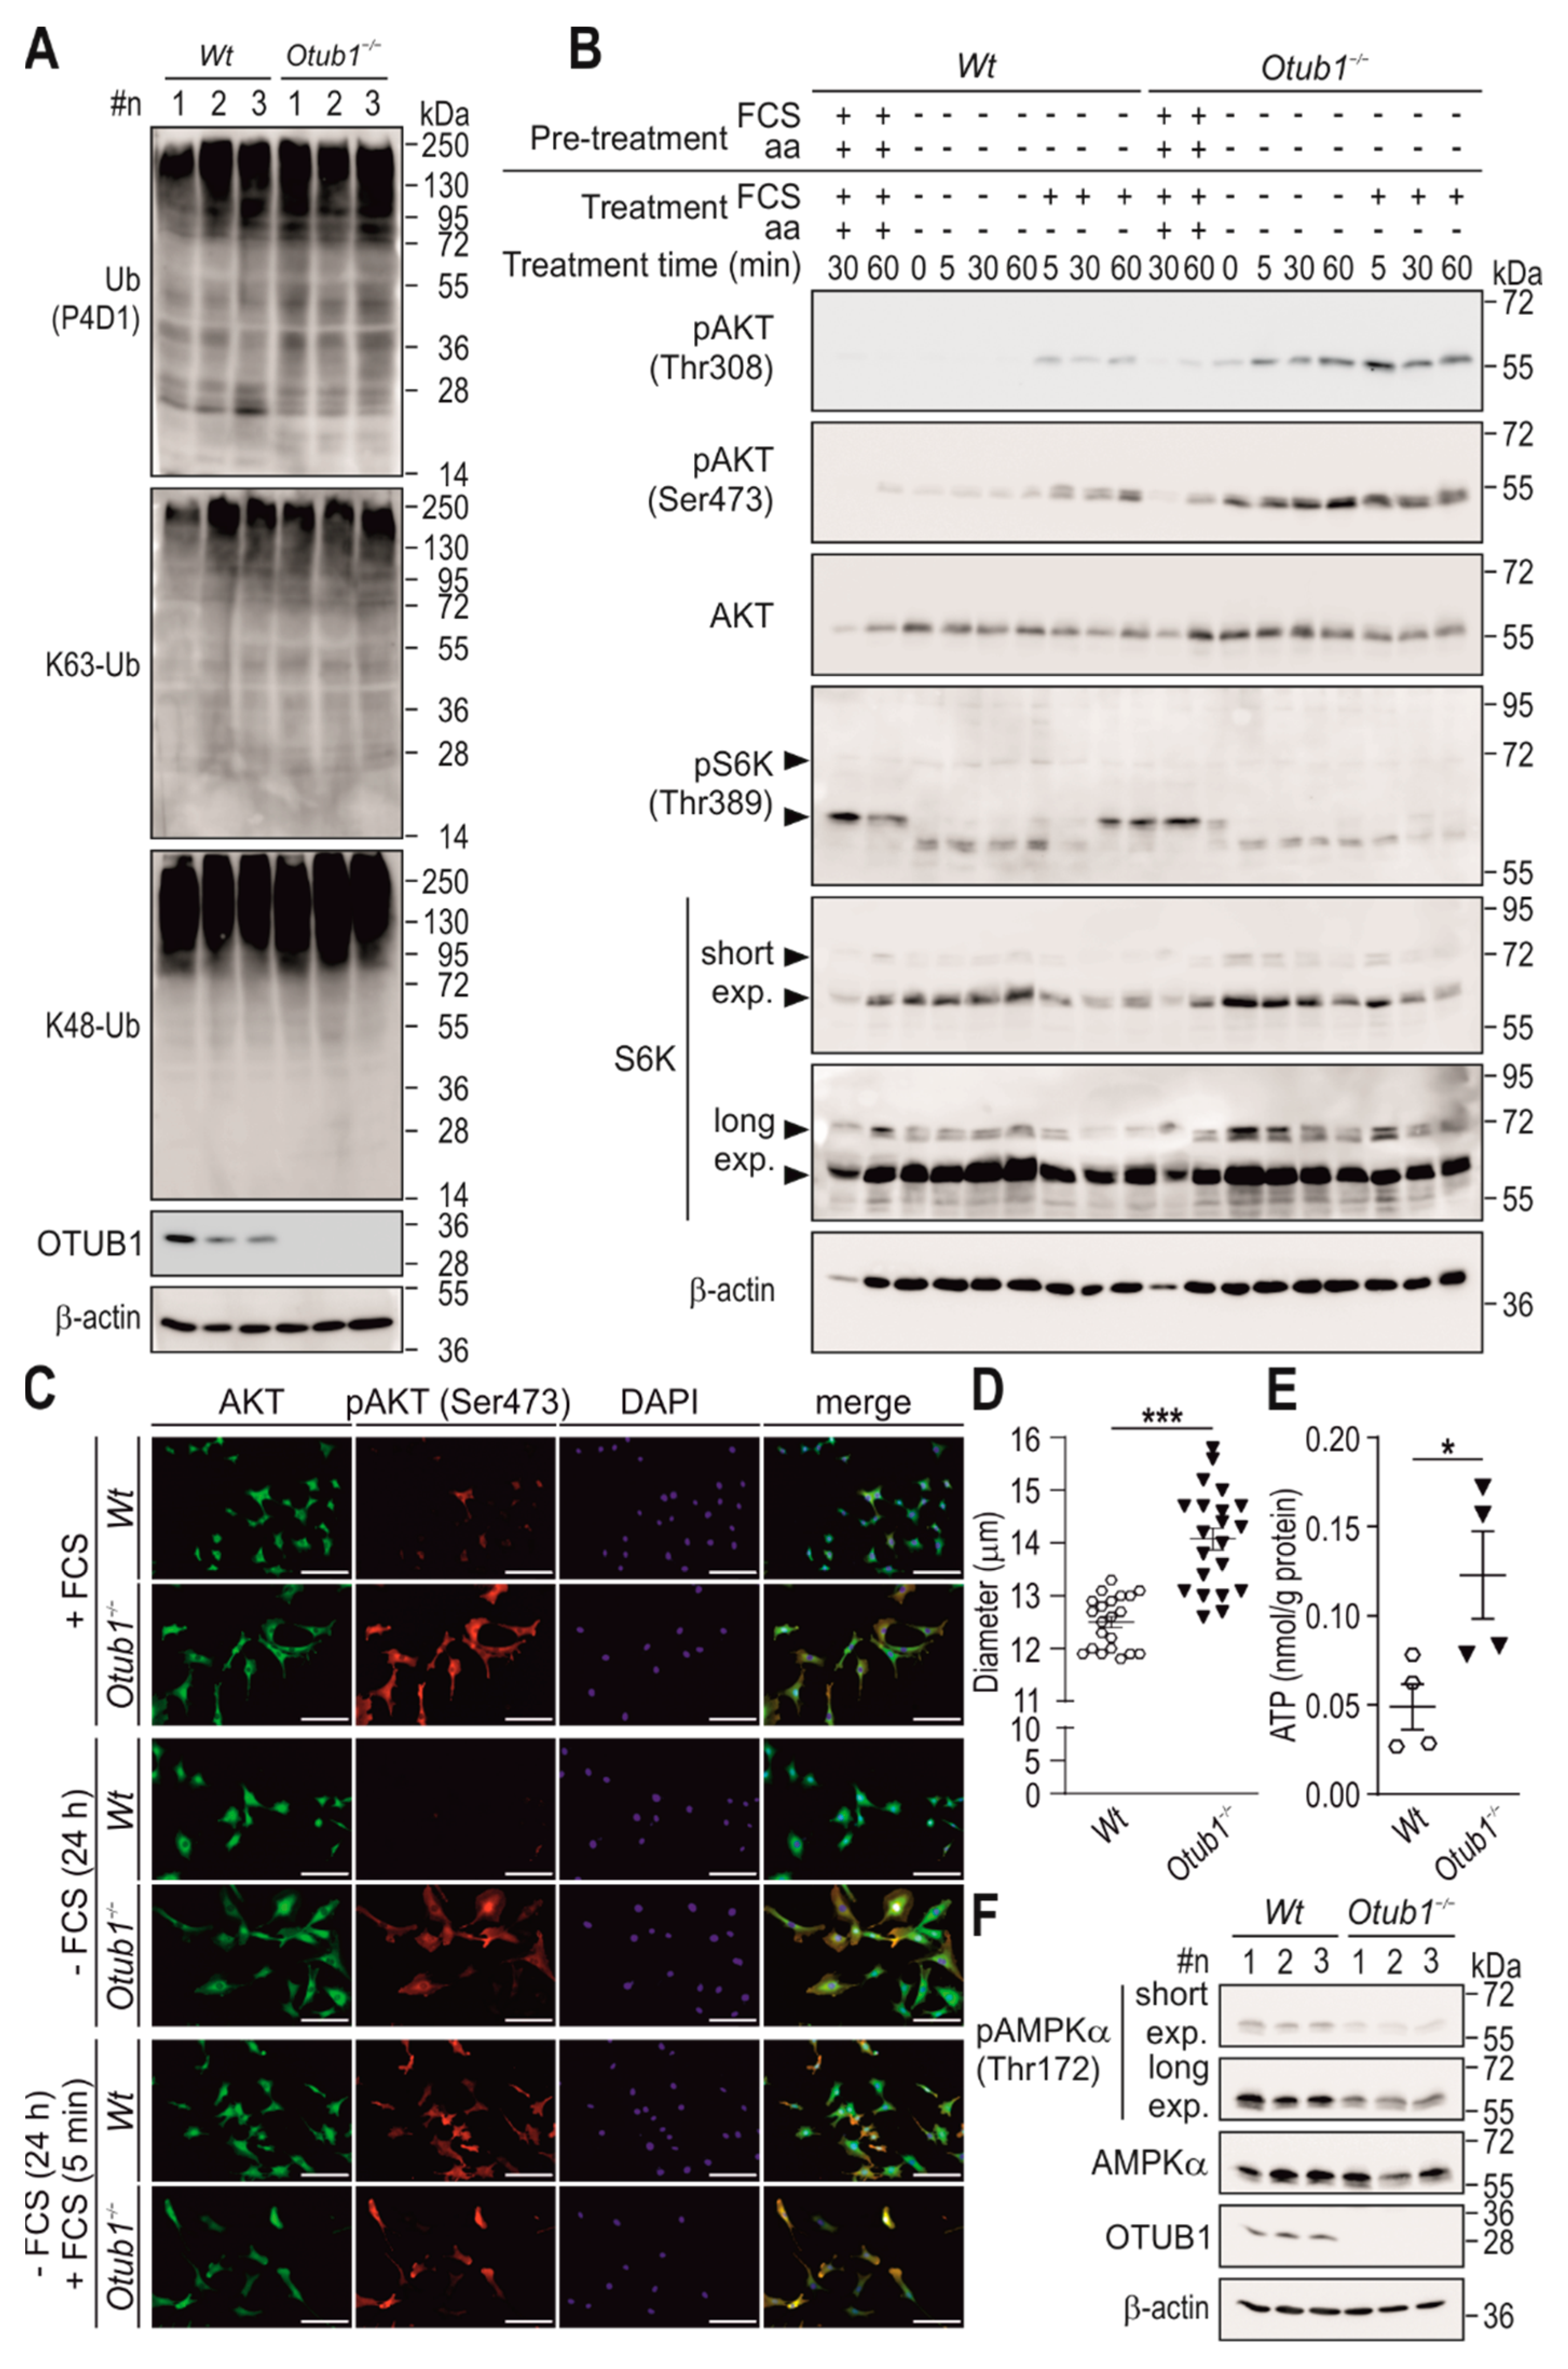
2.3. Otub1 Deletion Increases AKT-Dependent Signaling
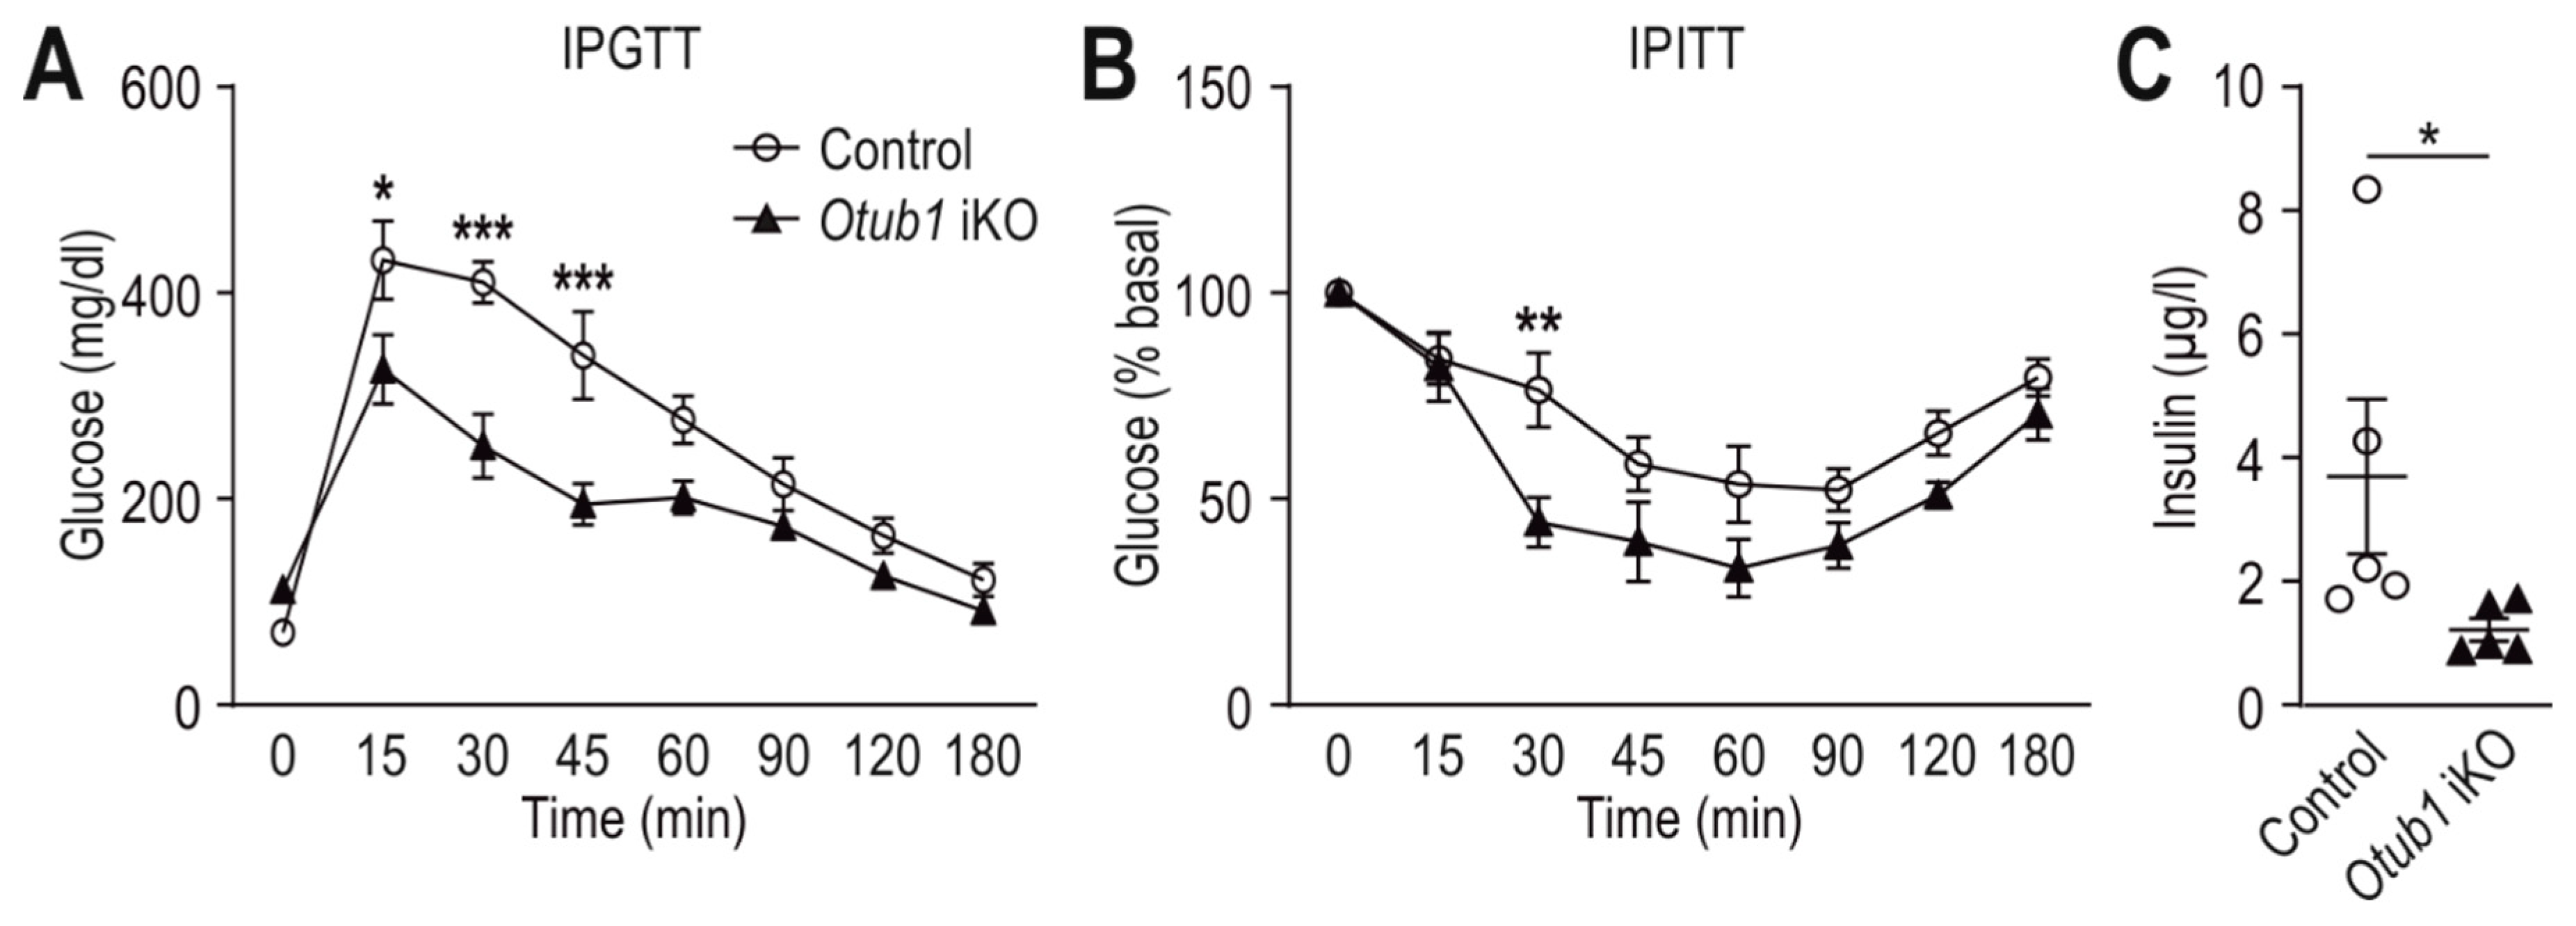
2.4. Otub1 Deletion Increases Insulin Sensitivity
2.5. Otub1 Deletion Increases Insulin-Dependent Signaling
3. Discussion
4. Materials and Methods
4.1. Mice
4.2. Cell Culture
4.3. Protein Extraction
4.4. ATP Assay
4.5. Immunoblot Analysis
4.6. Immunofluorescence
4.7. Liver Histology
4.8. Intraperitoneal Glucose and Insulin Tolerance Tests
4.9. ELISAs
4.10. Body Composition Analysis
4.11. Indirect Calorimetry
4.12. Food/Water Intake, Urine/Feces Production
4.13. Statistical Analysis
Supplementary Materials
Author Contributions
Funding
Institutional Review Board Statement
Data Availability Statement
Acknowledgments
Conflicts of Interest
References
- Guo, C.A.; Guo, S. Insulin receptor substrate signaling controls cardiac energy metabolism and heart failure. J. Endocrinol. 2017, 233, R131–R143. [Google Scholar] [CrossRef] [PubMed] [Green Version]
- DeBerardinis, R.J.; Thompson, C.B. Cellular metabolism and disease: What do metabolic outliers teach us? Cell 2012, 148, 1132–1144. [Google Scholar] [CrossRef] [PubMed] [Green Version]
- Clague, M.J.; Urbe, S.; Komander, D. Breaking the chains: Deubiquitylating enzyme specificity begets function. Nat. Rev. Mol. Cell Biol. 2019, 20, 338–352. [Google Scholar] [CrossRef] [PubMed]
- Günter, J.; Ruiz-Serrano, A.; Pickel, C.; Wenger, R.H.; Scholz, C.C. The functional interplay between the HIF pathway and the ubiquitin system—More than a one-way road. Exp. Cell Res. 2017, 356, 152–159. [Google Scholar] [CrossRef] [PubMed] [Green Version]
- Clague, M.J.; Heride, C.; Urbe, S. The demographics of the ubiquitin system. Trends Cell Biol. 2015, 25, 417–426. [Google Scholar] [CrossRef] [PubMed]
- Vandenabeele, P.; Bertrand, M.J. The role of the IAP E3 ubiquitin ligases in regulating pattern-recognition receptor signalling. Nat. Rev. Immunol. 2012, 12, 833–844. [Google Scholar] [CrossRef]
- Edelmann, M.J.; Iphofer, A.; Akutsu, M.; Altun, M.; di Gleria, K.; Kramer, H.B.; Fiebiger, E.; Dhe-Paganon, S.; Kessler, B.M. Structural basis and specificity of human otubain 1-mediated deubiquitination. Biochem. J. 2009, 418, 379–390. [Google Scholar] [CrossRef] [PubMed]
- Wang, T.; Yin, L.; Cooper, E.M.; Lai, M.Y.; Dickey, S.; Pickart, C.M.; Fushman, D.; Wilkinson, K.D.; Cohen, R.E.; Wolberger, C. Evidence for bidentate substrate binding as the basis for the K48 linkage specificity of otubain 1. J. Mol. Biol. 2009, 386, 1011–1023. [Google Scholar] [CrossRef] [Green Version]
- Nakada, S.; Tai, I.; Panier, S.; Al-Hakim, A.; Iemura, S.; Juang, Y.C.; O’Donnell, L.; Kumakubo, A.; Munro, M.; Sicheri, F.; et al. Non-canonical inhibition of DNA damage-dependent ubiquitination by OTUB1. Nature 2010, 466, 941–946. [Google Scholar] [CrossRef]
- Juang, Y.C.; Landry, M.C.; Sanches, M.; Vittal, V.; Leung, C.C.; Ceccarelli, D.F.; Mateo, A.R.; Pruneda, J.N.; Mao, D.Y.; Szilard, R.K.; et al. OTUB1 co-opts Lys48-linked ubiquitin recognition to suppress E2 enzyme function. Mol. Cell 2012, 45, 384–397. [Google Scholar] [CrossRef] [Green Version]
- Herhaus, L.; Al-Salihi, M.; Macartney, T.; Weidlich, S.; Sapkota, G.P. OTUB1 enhances TGFbeta signalling by inhibiting the ubiquitylation and degradation of active SMAD2/3. Nat. Commun. 2013, 4, 2519. [Google Scholar] [CrossRef] [PubMed] [Green Version]
- Wiener, R.; Zhang, X.; Wang, T.; Wolberger, C. The mechanism of OTUB1-mediated inhibition of ubiquitination. Nature 2012, 483, 618–622. [Google Scholar] [CrossRef] [PubMed] [Green Version]
- Que, L.T.; Morrow, M.E.; Wolberger, C. Comparison of Cross-Regulation by Different OTUB1:E2 Complexes. Biochemistry 2020, 59, 921–932. [Google Scholar] [CrossRef] [PubMed]
- Sato, Y.; Yamagata, A.; Goto-Ito, S.; Kubota, K.; Miyamoto, R.; Nakada, S.; Fukai, S. Molecular basis of Lys-63-linked polyubiquitination inhibition by the interaction between human deubiquitinating enzyme OTUB1 and ubiquitin-conjugating enzyme UBC13. J. Biol. Chem. 2012, 287, 25860–25868. [Google Scholar] [CrossRef] [Green Version]
- Sulser, P.; Pickel, C.; Günter, J.; Leissing, T.M.; Crean, D.; Schofield, C.J.; Wenger, R.H.; Scholz, C.C. HIF hydroxylase inhibitors decrease cellular oxygen consumption depending on their selectivity. FASEB J. 2020, 34, 2344–2358. [Google Scholar] [CrossRef] [Green Version]
- Pickel, C.; Günter, J.; Ruiz-Serrano, A.; Spielmann, P.; Fabrizio, J.A.; Wolski, W.; Peet, D.J.; Wenger, R.H.; Scholz, C.C. Oxygen-dependent bond formation with FIH regulates the activity of the client protein OTUB1. Redox Biol. 2019, 26, 101265. [Google Scholar] [CrossRef]
- Scholz, C.C.; Cavadas, M.A.; Tambuwala, M.M.; Hams, E.; Rodriguez, J.; von Kriegsheim, A.; Cotter, P.; Bruning, U.; Fallon, P.G.; Cheong, A.; et al. Regulation of IL-1beta-induced NF-kappaB by hydroxylases links key hypoxic and inflammatory signaling pathways. Proc. Natl. Acad. Sci. USA 2013, 110, 18490–18495. [Google Scholar] [CrossRef] [Green Version]
- Scholz, C.C.; Rodriguez, J.; Pickel, C.; Burr, S.; Fabrizio, J.A.; Nolan, K.A.; Spielmann, P.; Cavadas, M.A.; Crifo, B.; Halligan, D.N.; et al. FIH Regulates Cellular Metabolism through Hydroxylation of the Deubiquitinase OTUB1. PLoS Biol. 2016, 14, e1002347. [Google Scholar] [CrossRef] [Green Version]
- Zhang, N.; Fu, Z.; Linke, S.; Chicher, J.; Gorman, J.J.; Visk, D.; Haddad, G.G.; Poellinger, L.; Peet, D.J.; Powell, F.; et al. The asparaginyl hydroxylase factor inhibiting HIF-1alpha is an essential regulator of metabolism. Cell Metab. 2010, 11, 364–378. [Google Scholar] [CrossRef] [Green Version]
- Pasupala, N.; Morrow, M.E.; Que, L.T.; Malynn, B.A.; Ma, A.; Wolberger, C. OTUB1 non-catalytically stabilizes the E2 ubiquitin-conjugating enzyme UBE2E1 by preventing its autoubiquitination. J. Biol. Chem. 2018, 293, 18285–18295. [Google Scholar] [CrossRef] [Green Version]
- Wang, X.; Mulas, F.; Yi, W.; Brunn, A.; Nishanth, G.; Just, S.; Waisman, A.; Bruck, W.; Deckert, M.; Schluter, D. OTUB1 inhibits CNS autoimmunity by preventing IFN-gamma-induced hyperactivation of astrocytes. EMBO J. 2019, 38, e100947. [Google Scholar] [CrossRef] [PubMed]
- Ruiz-Serrano, A.; Monné Rodríguez, J.M.; Günter, J.; Sherman, S.P.M.; Jucht, A.E.; Fluechter, P.; Volkova, Y.L.; Pfundstein, S.; Pellegrini, G.; Wagner, C.A.; et al. OTUB1 regulates lung development, adult lung tissue homeostasis, and respiratory control. FASEB J. 2021, 35, e22039. [Google Scholar] [CrossRef] [PubMed]
- De Leo, S.; Lee, S.Y.; Braverman, L.E. Hyperthyroidism. Lancet 2016, 388, 906–918. [Google Scholar] [CrossRef] [Green Version]
- Zhou, X.; Yu, J.; Cheng, X.; Zhao, B.; Manyam, G.C.; Zhang, L.; Schluns, K.; Li, P.; Wang, J.; Sun, S.C. The deubiquitinase Otub1 controls the activation of CD8(+) T cells and NK cells by regulating IL-15-mediated priming. Nat. Immunol. 2019, 20, 879–889. [Google Scholar] [CrossRef] [PubMed]
- Zhao, L.; Wang, X.; Yu, Y.; Deng, L.; Chen, L.; Peng, X.; Jiao, C.; Gao, G.; Tan, X.; Pan, W.; et al. OTUB1 protein suppresses mTOR complex 1 (mTORC1) activity by deubiquitinating the mTORC1 inhibitor DEPTOR. J. Biol. Chem. 2018, 293, 4883–4892. [Google Scholar] [CrossRef] [PubMed] [Green Version]
- Saxton, R.A.; Sabatini, D.M. mTOR Signaling in Growth, Metabolism, and Disease. Cell 2017, 168, 960–976. [Google Scholar] [CrossRef] [PubMed] [Green Version]
- Manning, B.D.; Toker, A. AKT/PKB Signaling: Navigating the Network. Cell 2017, 169, 381–405. [Google Scholar] [CrossRef] [Green Version]
- Caron, A.; Briscoe, D.M.; Richard, D.; Laplante, M. DEPTOR at the Nexus of Cancer, Metabolism, and Immunity. Physiol. Rev. 2018, 98, 1765–1803. [Google Scholar] [CrossRef] [Green Version]
- Scanga, S.E.; Ruel, L.; Binari, R.C.; Snow, B.; Stambolic, V.; Bouchard, D.; Peters, M.; Calvieri, B.; Mak, T.W.; Woodgett, J.R.; et al. The conserved PI3′K/PTEN/Akt signaling pathway regulates both cell size and survival in Drosophila. Oncogene 2000, 19, 3971–3977. [Google Scholar] [CrossRef]
- Faridi, J.; Fawcett, J.; Wang, L.; Roth, R.A. Akt promotes increased mammalian cell size by stimulating protein synthesis and inhibiting protein degradation. Am. J. Physiol. Endocrinol Metab. 2003, 285, E964–E972. [Google Scholar] [CrossRef] [Green Version]
- Hahn-Windgassen, A.; Nogueira, V.; Chen, C.C.; Skeen, J.E.; Sonenberg, N.; Hay, N. Akt activates the mammalian target of rapamycin by regulating cellular ATP level and AMPK activity. J. Biol. Chem. 2005, 280, 32081–32089. [Google Scholar] [CrossRef] [PubMed] [Green Version]
- Haeusler, R.A.; McGraw, T.E.; Accili, D. Biochemical and cellular properties of insulin receptor signalling. Nat. Rev. Mol. Cell Biol. 2018, 19, 31–44. [Google Scholar] [CrossRef] [PubMed]
- Taniguchi, C.M.; Emanuelli, B.; Kahn, C.R. Critical nodes in signalling pathways: Insights into insulin action. Nat. Rev. Mol. Cell Biol. 2006, 7, 85–96. [Google Scholar] [CrossRef] [PubMed]
- Ceasrine, A.M.; Ruiz-Otero, N.; Lin, E.E.; Lumelsky, D.N.; Boehm, E.D.; Kuruvilla, R. Tamoxifen Improves Glucose Tolerance in a Delivery-, Sex-, and Strain-Dependent Manner in Mice. Endocrinology 2019, 160, 782–790. [Google Scholar] [CrossRef] [Green Version]
- Liu, L.; Zou, P.; Zheng, L.; Linarelli, L.E.; Amarell, S.; Passaro, A.; Liu, D.; Cheng, Z. Tamoxifen reduces fat mass by boosting reactive oxygen species. Cell Death Dis. 2015, 6, e1586. [Google Scholar] [CrossRef] [Green Version]
- Hesselbarth, N.; Pettinelli, C.; Gericke, M.; Berger, C.; Kunath, A.; Stumvoll, M.; Bluher, M.; Kloting, N. Tamoxifen affects glucose and lipid metabolism parameters, causes browning of subcutaneous adipose tissue and transient body composition changes in C57BL/6NTac mice. Biochem. Biophys. Res. Commun. 2015, 464, 724–729. [Google Scholar] [CrossRef]
- Akasaki, Y.; Ouchi, N.; Izumiya, Y.; Bernardo, B.L.; Lebrasseur, N.K.; Walsh, K. Glycolytic fast-twitch muscle fiber restoration counters adverse age-related changes in body composition and metabolism. Aging Cell 2014, 13, 80–91. [Google Scholar] [CrossRef] [Green Version]
- Chakraborty, A.; Koldobskiy, M.A.; Bello, N.T.; Maxwell, M.; Potter, J.J.; Juluri, K.R.; Maag, D.; Kim, S.; Huang, A.S.; Dailey, M.J.; et al. Inositol pyrophosphates inhibit Akt signaling, thereby regulating insulin sensitivity and weight gain. Cell 2010, 143, 897–910. [Google Scholar] [CrossRef] [Green Version]
- Cederquist, C.T.; Lentucci, C.; Martinez-Calejman, C.; Hayashi, V.; Orofino, J.; Guertin, D.; Fried, S.K.; Lee, M.J.; Cardamone, M.D.; Perissi, V. Systemic insulin sensitivity is regulated by GPS2 inhibition of AKT ubiquitination and activation in adipose tissue. Mol. Metab. 2017, 6, 125–137. [Google Scholar] [CrossRef]
- Chan, C.H.; Li, C.F.; Yang, W.L.; Gao, Y.; Lee, S.W.; Feng, Z.; Huang, H.Y.; Tsai, K.K.; Flores, L.G.; Shao, Y.; et al. The Skp2-SCF E3 ligase regulates Akt ubiquitination, glycolysis, herceptin sensitivity, and tumorigenesis. Cell 2012, 149, 1098–1111. [Google Scholar] [CrossRef] [Green Version]
- Guo, L.; Chen, W.; Tao, L.; Hu, B.; Qu, G.; Tu, B.; Yuan, H.; Ma, B.; Wang, Y.; Zhu, X.; et al. GWC1 is essential for high grain quality in rice. Plant. Sci. 2020, 296, 110497. [Google Scholar] [CrossRef] [PubMed]
- Huang, K.; Wang, D.; Duan, P.; Zhang, B.; Xu, R.; Li, N.; Li, Y. WIDE AND THICK GRAIN 1, which encodes an otubain-like protease with deubiquitination activity, influences grain size and shape in rice. Plant. J. 2017, 91, 849–860. [Google Scholar] [CrossRef] [Green Version]
- Wang, S.; Wu, K.; Qian, Q.; Liu, Q.; Li, Q.; Pan, Y.; Ye, Y.; Liu, X.; Wang, J.; Zhang, J.; et al. Non-canonical regulation of SPL transcription factors by a human OTUB1-like deubiquitinase defines a new plant type rice associated with higher grain yield. Cell Res. 2017, 27, 1142–1156. [Google Scholar] [CrossRef] [PubMed] [Green Version]
- Dickinson, M.E.; Flenniken, A.M.; Ji, X.; Teboul, L.; Wong, M.D.; White, J.K.; Meehan, T.F.; Weninger, W.J.; Westerberg, H.; Adissu, H.; et al. High-throughput discovery of novel developmental phenotypes. Nature 2016, 537, 508–514. [Google Scholar] [CrossRef] [PubMed]
- Emmerich, C.H.; Cohen, P. Optimising methods for the preservation, capture and identification of ubiquitin chains and ubiquitylated proteins by immunoblotting. Biochem. Biophys. Res. Commun. 2015, 466, 1–14. [Google Scholar] [CrossRef] [Green Version]
- Bradford, M.M. A rapid and sensitive method for the quantitation of microgram quantities of protein utilizing the principle of protein-dye binding. Anal. Biochem. 1976, 72, 248–254. [Google Scholar] [CrossRef]
- Gutsche, K.; Randi, E.B.; Blank, V.; Fink, D.; Wenger, R.H.; Leo, C.; Scholz, C.C. Intermittent hypoxia confers pro-metastatic gene expression selectively through NF-kappaB in inflammatory breast cancer cells. Free Radic. Biol. Med. 2016, 101, 129–142. [Google Scholar] [CrossRef] [Green Version]
- Weir, J.B. New methods for calculating metabolic rate with special reference to protein metabolism. J. Physiol. 1949, 109, 1–9. [Google Scholar] [CrossRef]
- Wielinga, P.Y.; Alder, B.; Lutz, T.A. The acute effect of amylin and salmon calcitonin on energy expenditure. Physiol. Behav. 2007, 91, 212–217. [Google Scholar] [CrossRef]


Publisher’s Note: MDPI stays neutral with regard to jurisdictional claims in published maps and institutional affiliations. |
© 2022 by the authors. Licensee MDPI, Basel, Switzerland. This article is an open access article distributed under the terms and conditions of the Creative Commons Attribution (CC BY) license (https://creativecommons.org/licenses/by/4.0/).
Share and Cite
Ruiz-Serrano, A.; Boyle, C.N.; Monné Rodríguez, J.M.; Günter, J.; Jucht, A.E.; Pfundstein, S.; Bapst, A.M.; Lutz, T.A.; Wenger, R.H.; Scholz, C.C. The Deubiquitinase OTUB1 Is a Key Regulator of Energy Metabolism. Int. J. Mol. Sci. 2022, 23, 1536. https://doi.org/10.3390/ijms23031536
Ruiz-Serrano A, Boyle CN, Monné Rodríguez JM, Günter J, Jucht AE, Pfundstein S, Bapst AM, Lutz TA, Wenger RH, Scholz CC. The Deubiquitinase OTUB1 Is a Key Regulator of Energy Metabolism. International Journal of Molecular Sciences. 2022; 23(3):1536. https://doi.org/10.3390/ijms23031536
Chicago/Turabian StyleRuiz-Serrano, Amalia, Christina N. Boyle, Josep M. Monné Rodríguez, Julia Günter, Agnieszka E. Jucht, Svende Pfundstein, Andreas M. Bapst, Thomas A. Lutz, Roland H. Wenger, and Carsten C. Scholz. 2022. "The Deubiquitinase OTUB1 Is a Key Regulator of Energy Metabolism" International Journal of Molecular Sciences 23, no. 3: 1536. https://doi.org/10.3390/ijms23031536