
The Mitochondrial Epigenome: An Unexplored Avenue to Explain Unexplained Myopathies?

 , , and
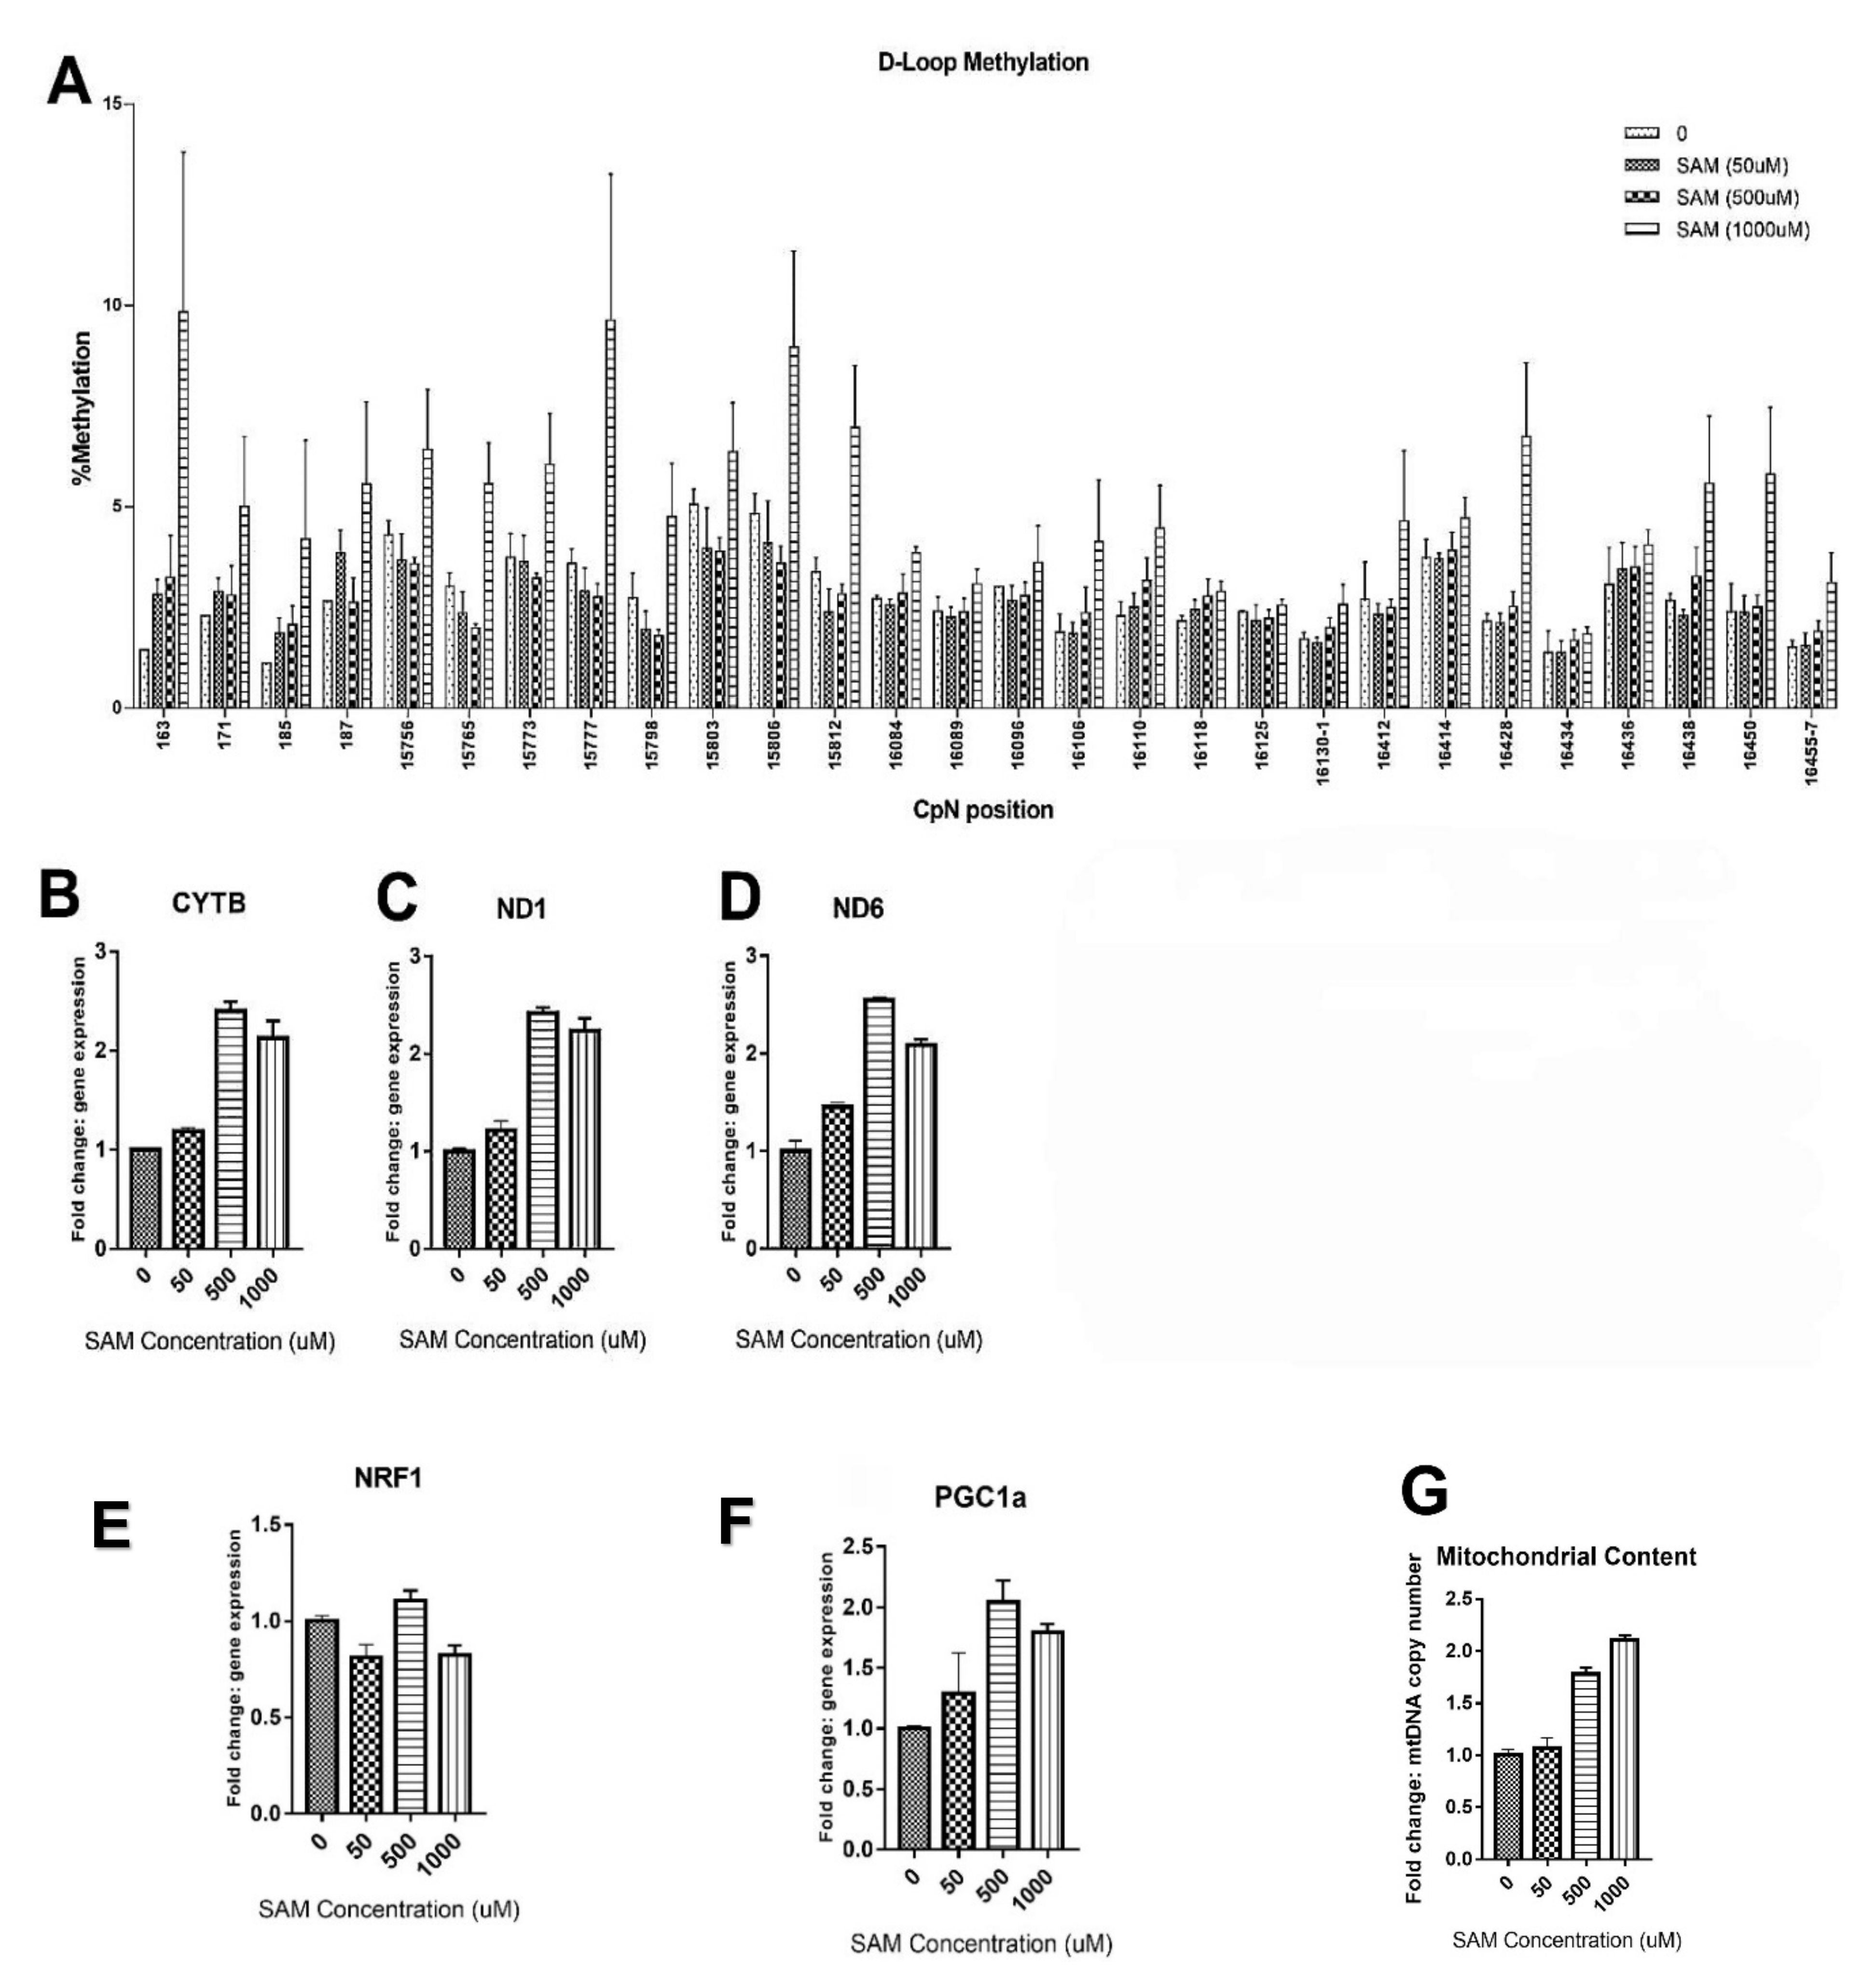
Abstract
:1. Introduction
2. Results
2.1. High SAM Concentrations Induced mtDNA Methylation
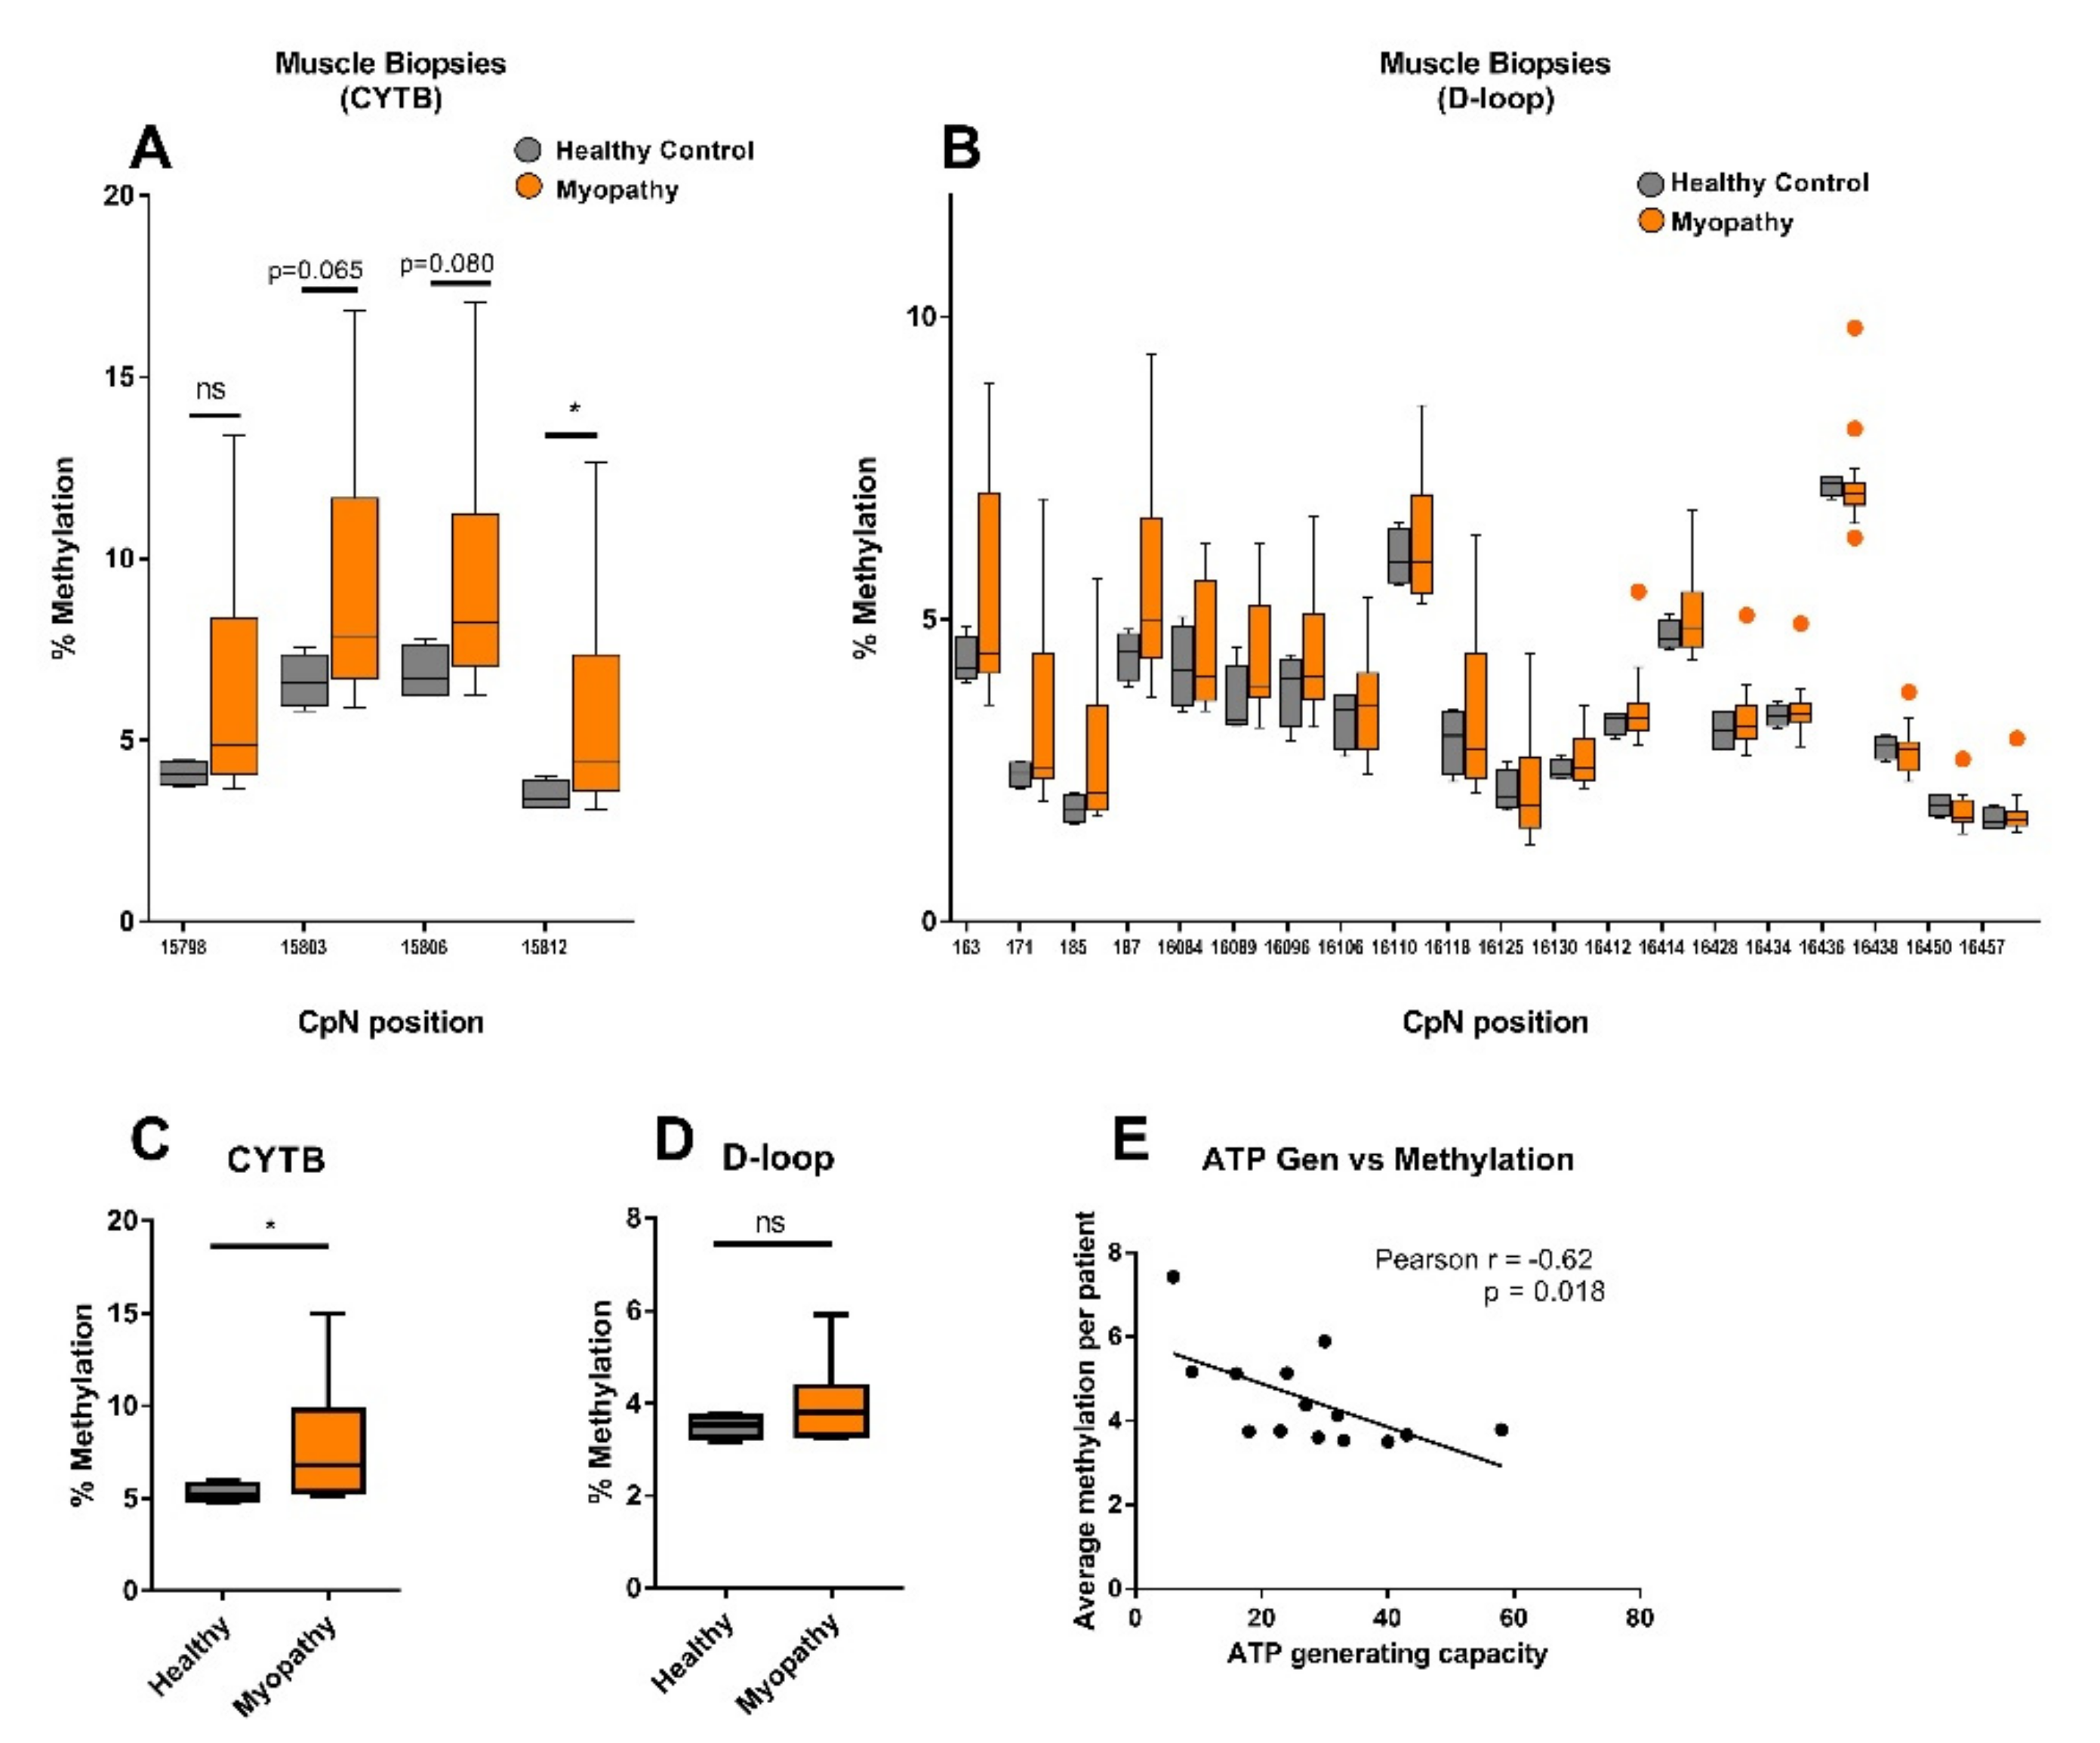
2.2. CYTB mtDNA Methylation Was Higher in Muscle Biopsies from Myopathy Patients Compared to Healthy Controls
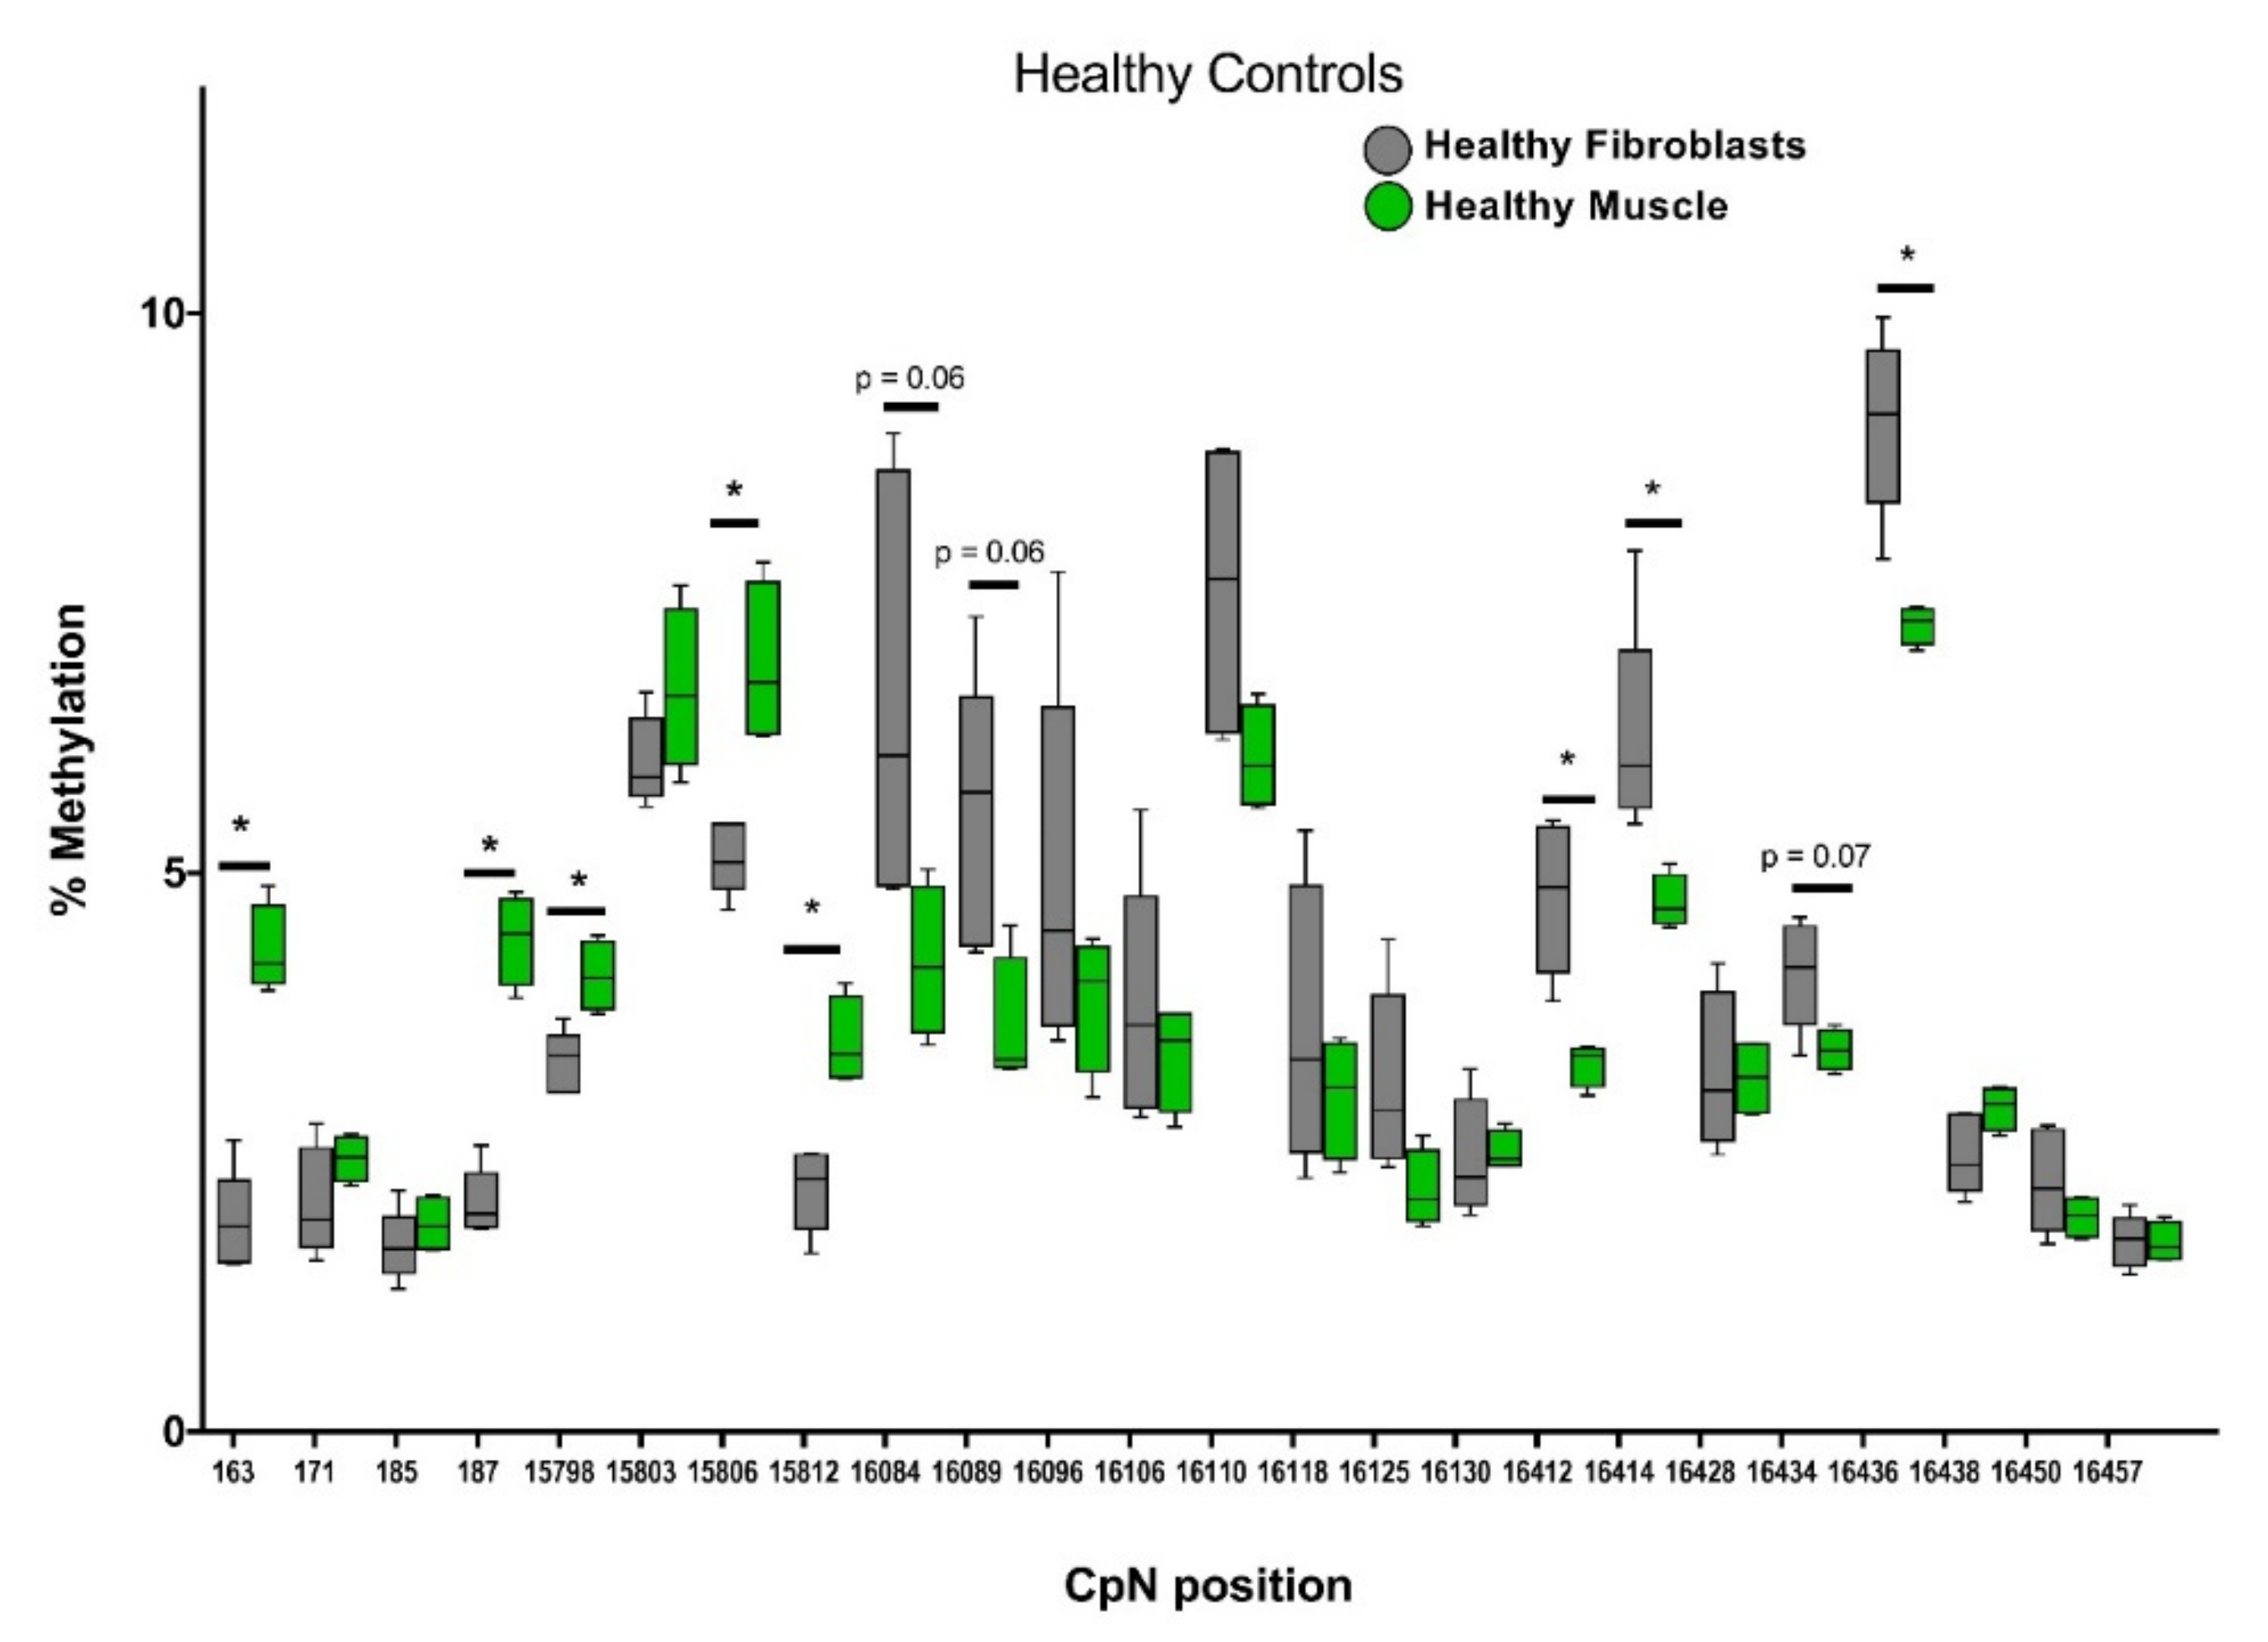
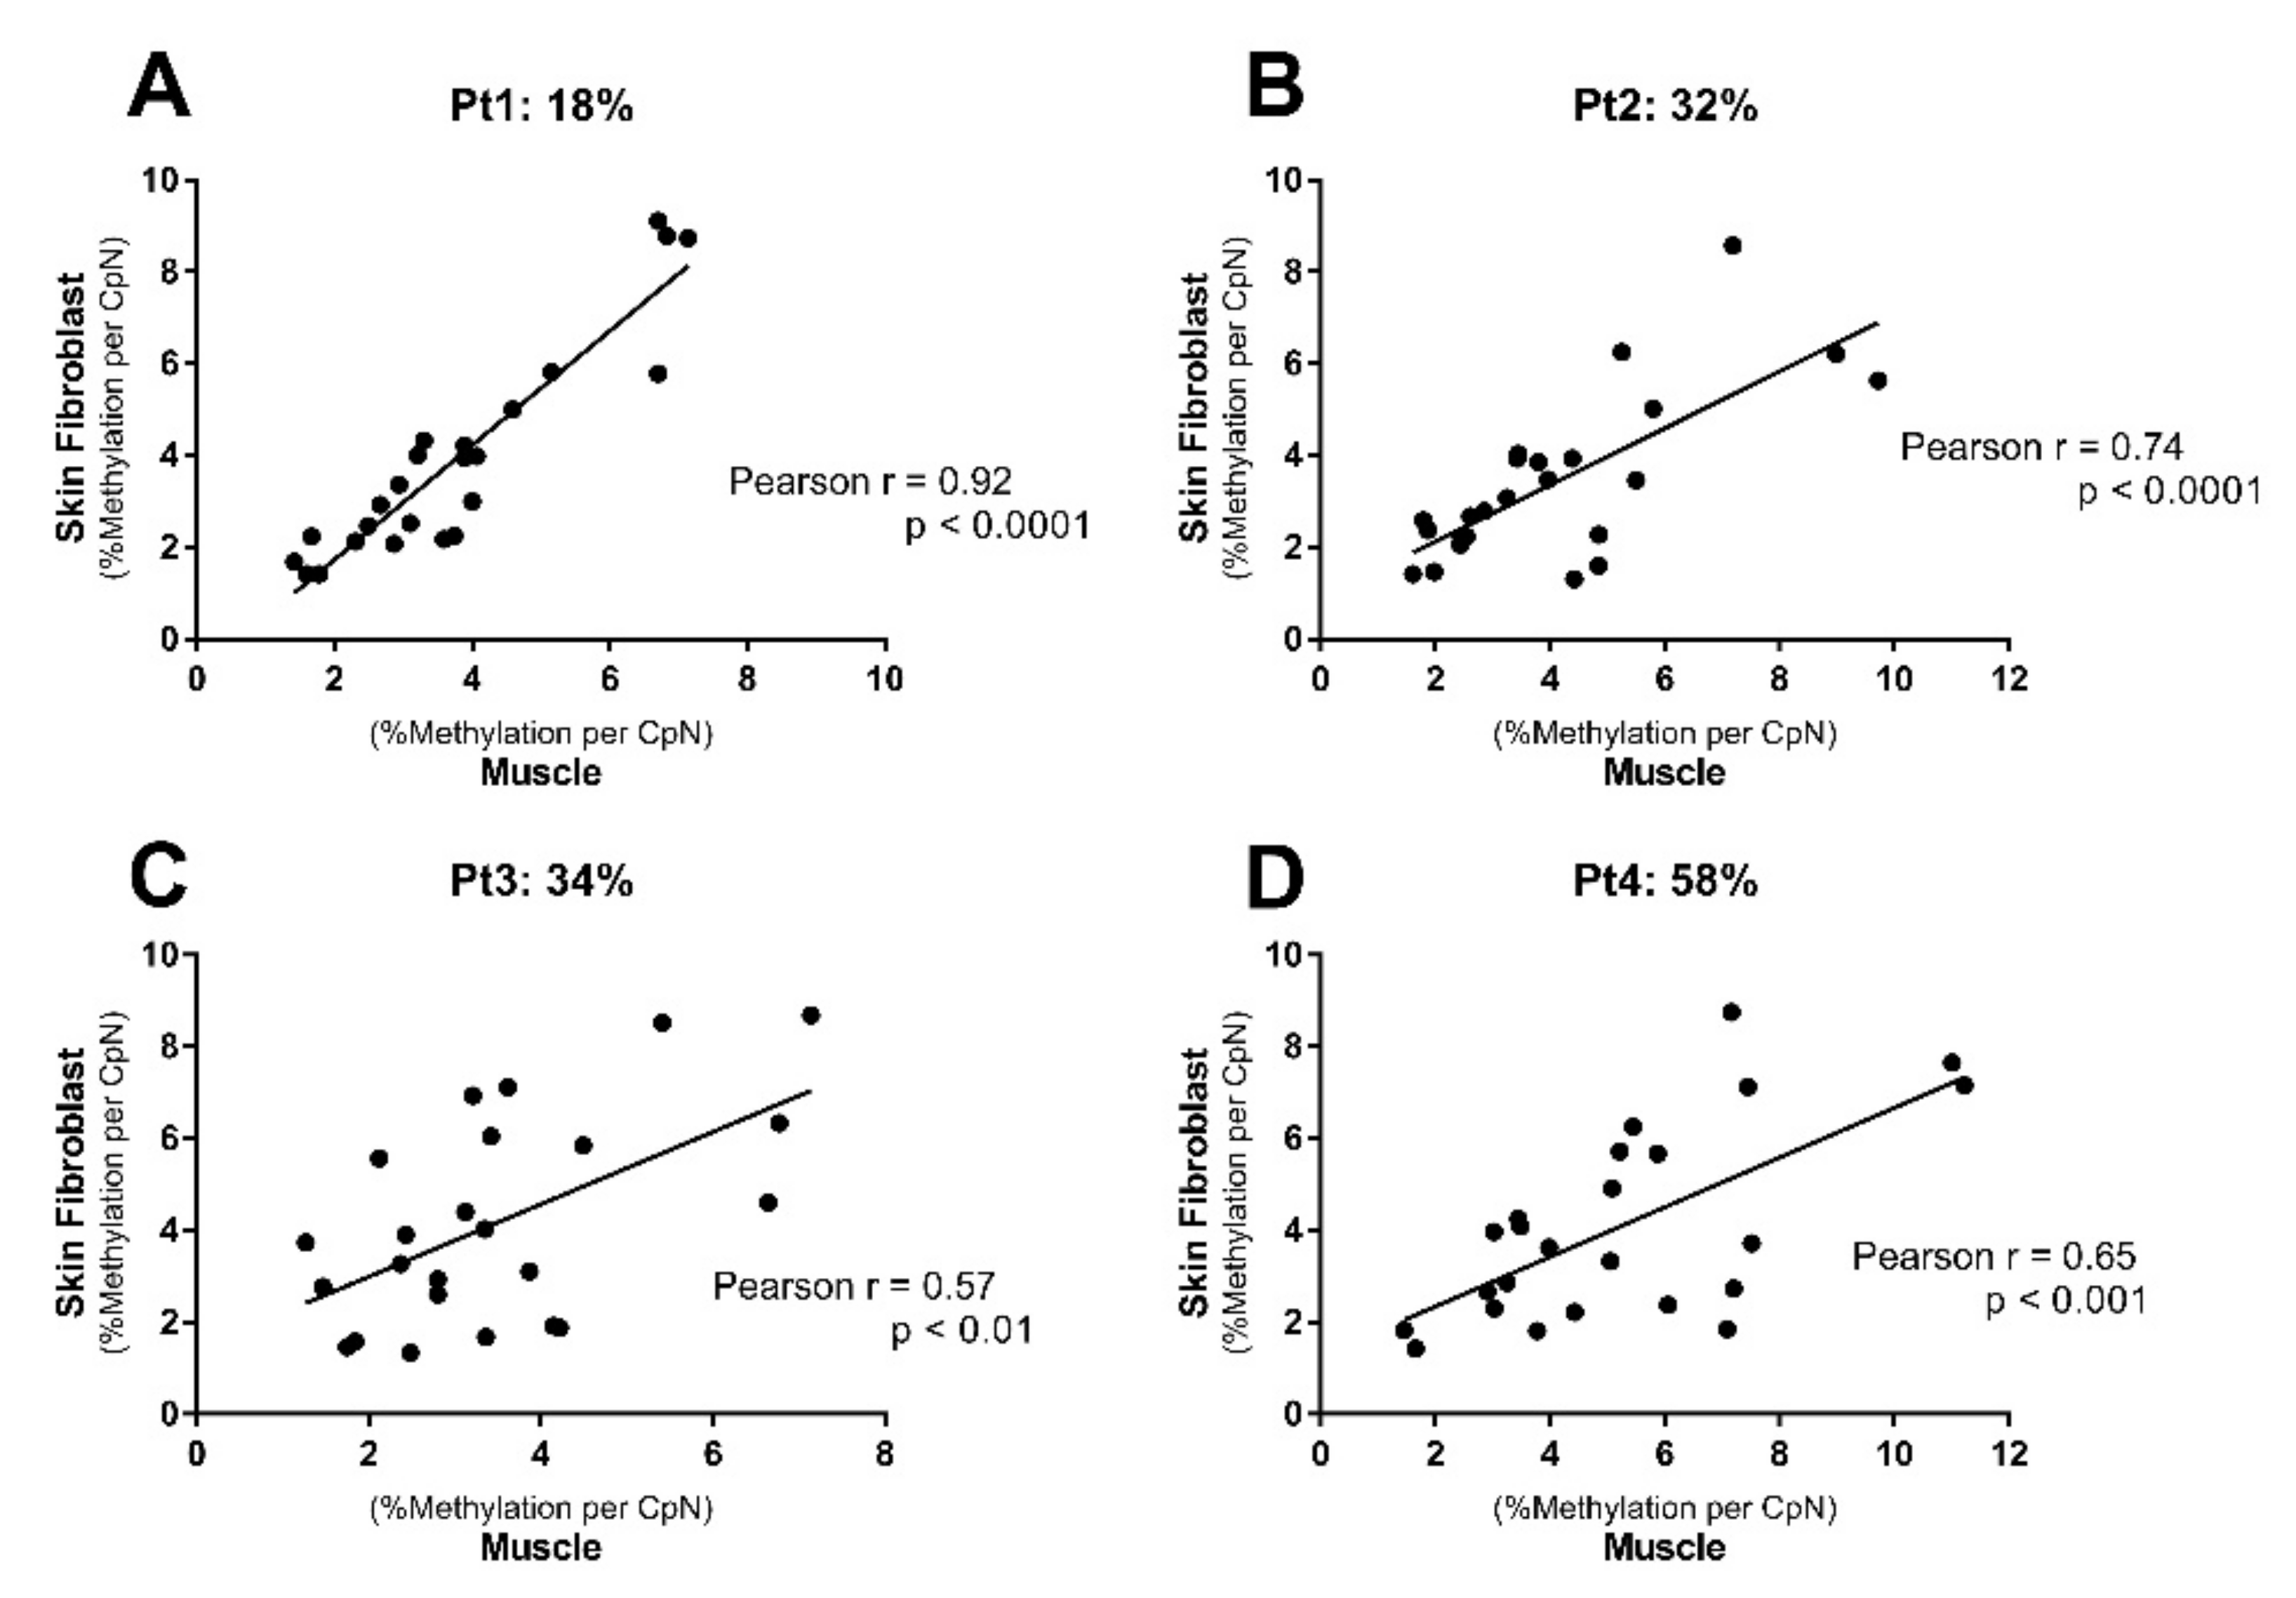
2.3. Distinct mtDNA Methylation Patterns in Muscle Tissue Versus Skin Fibroblasts
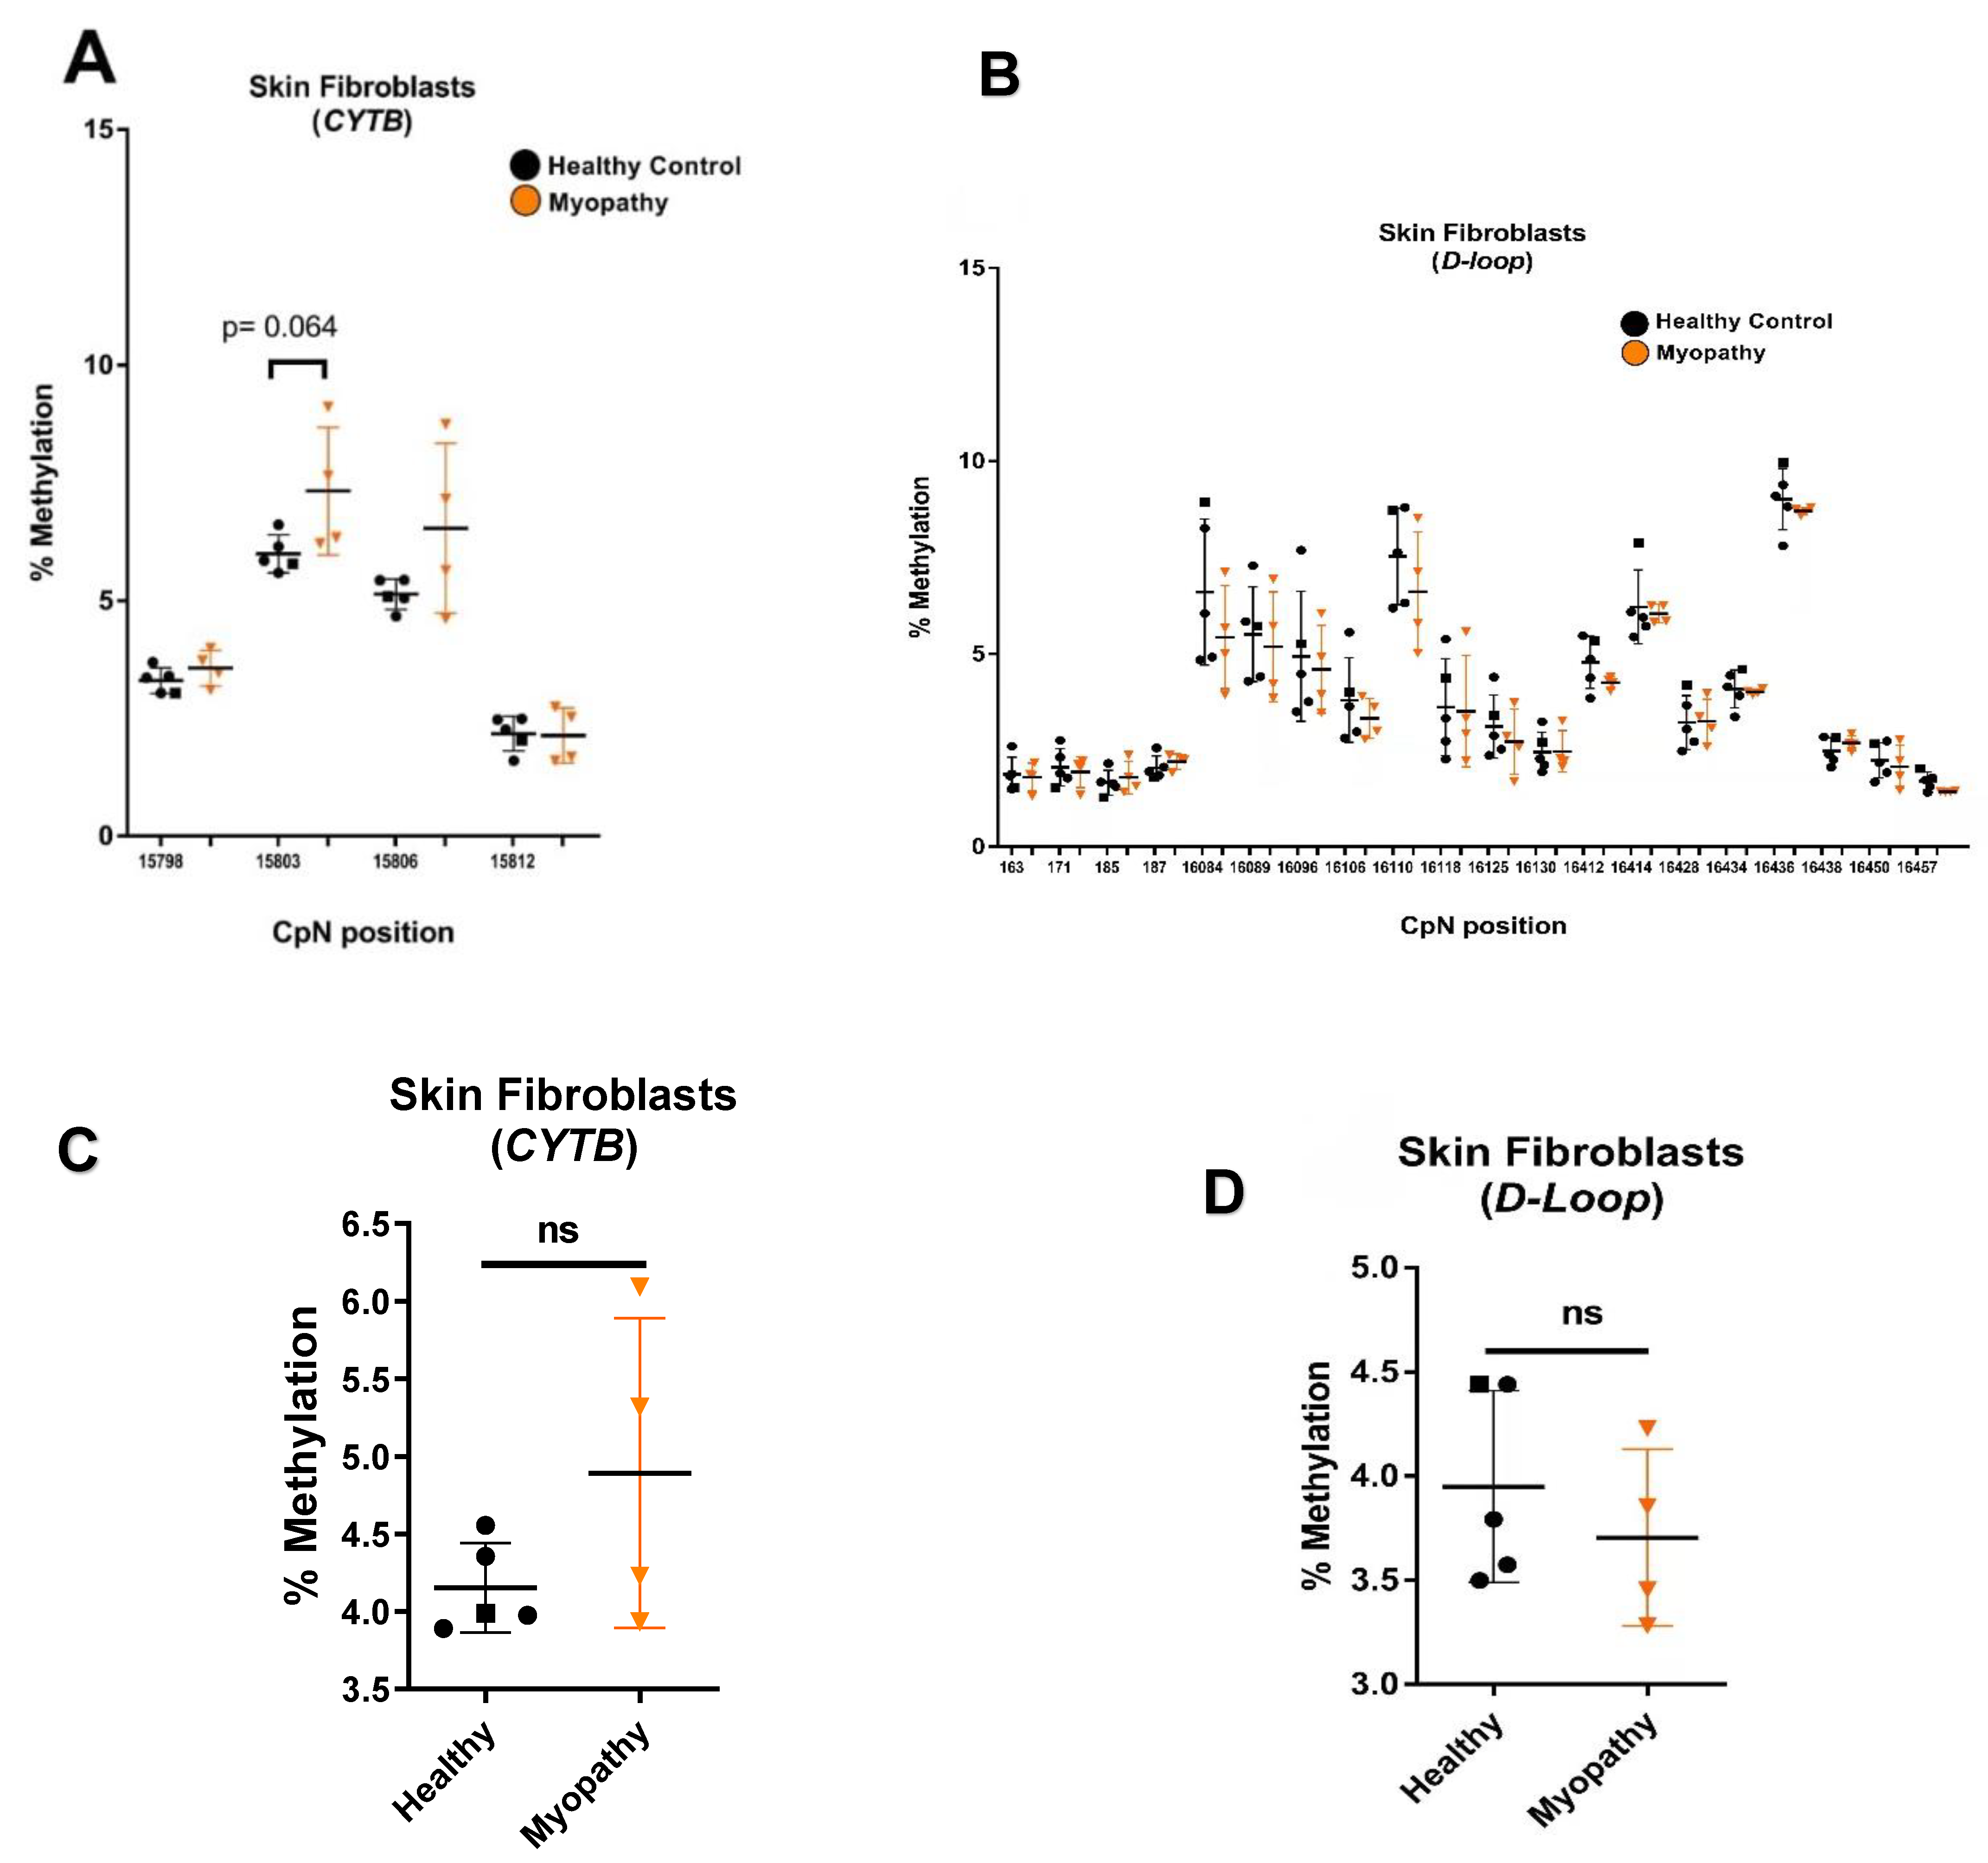
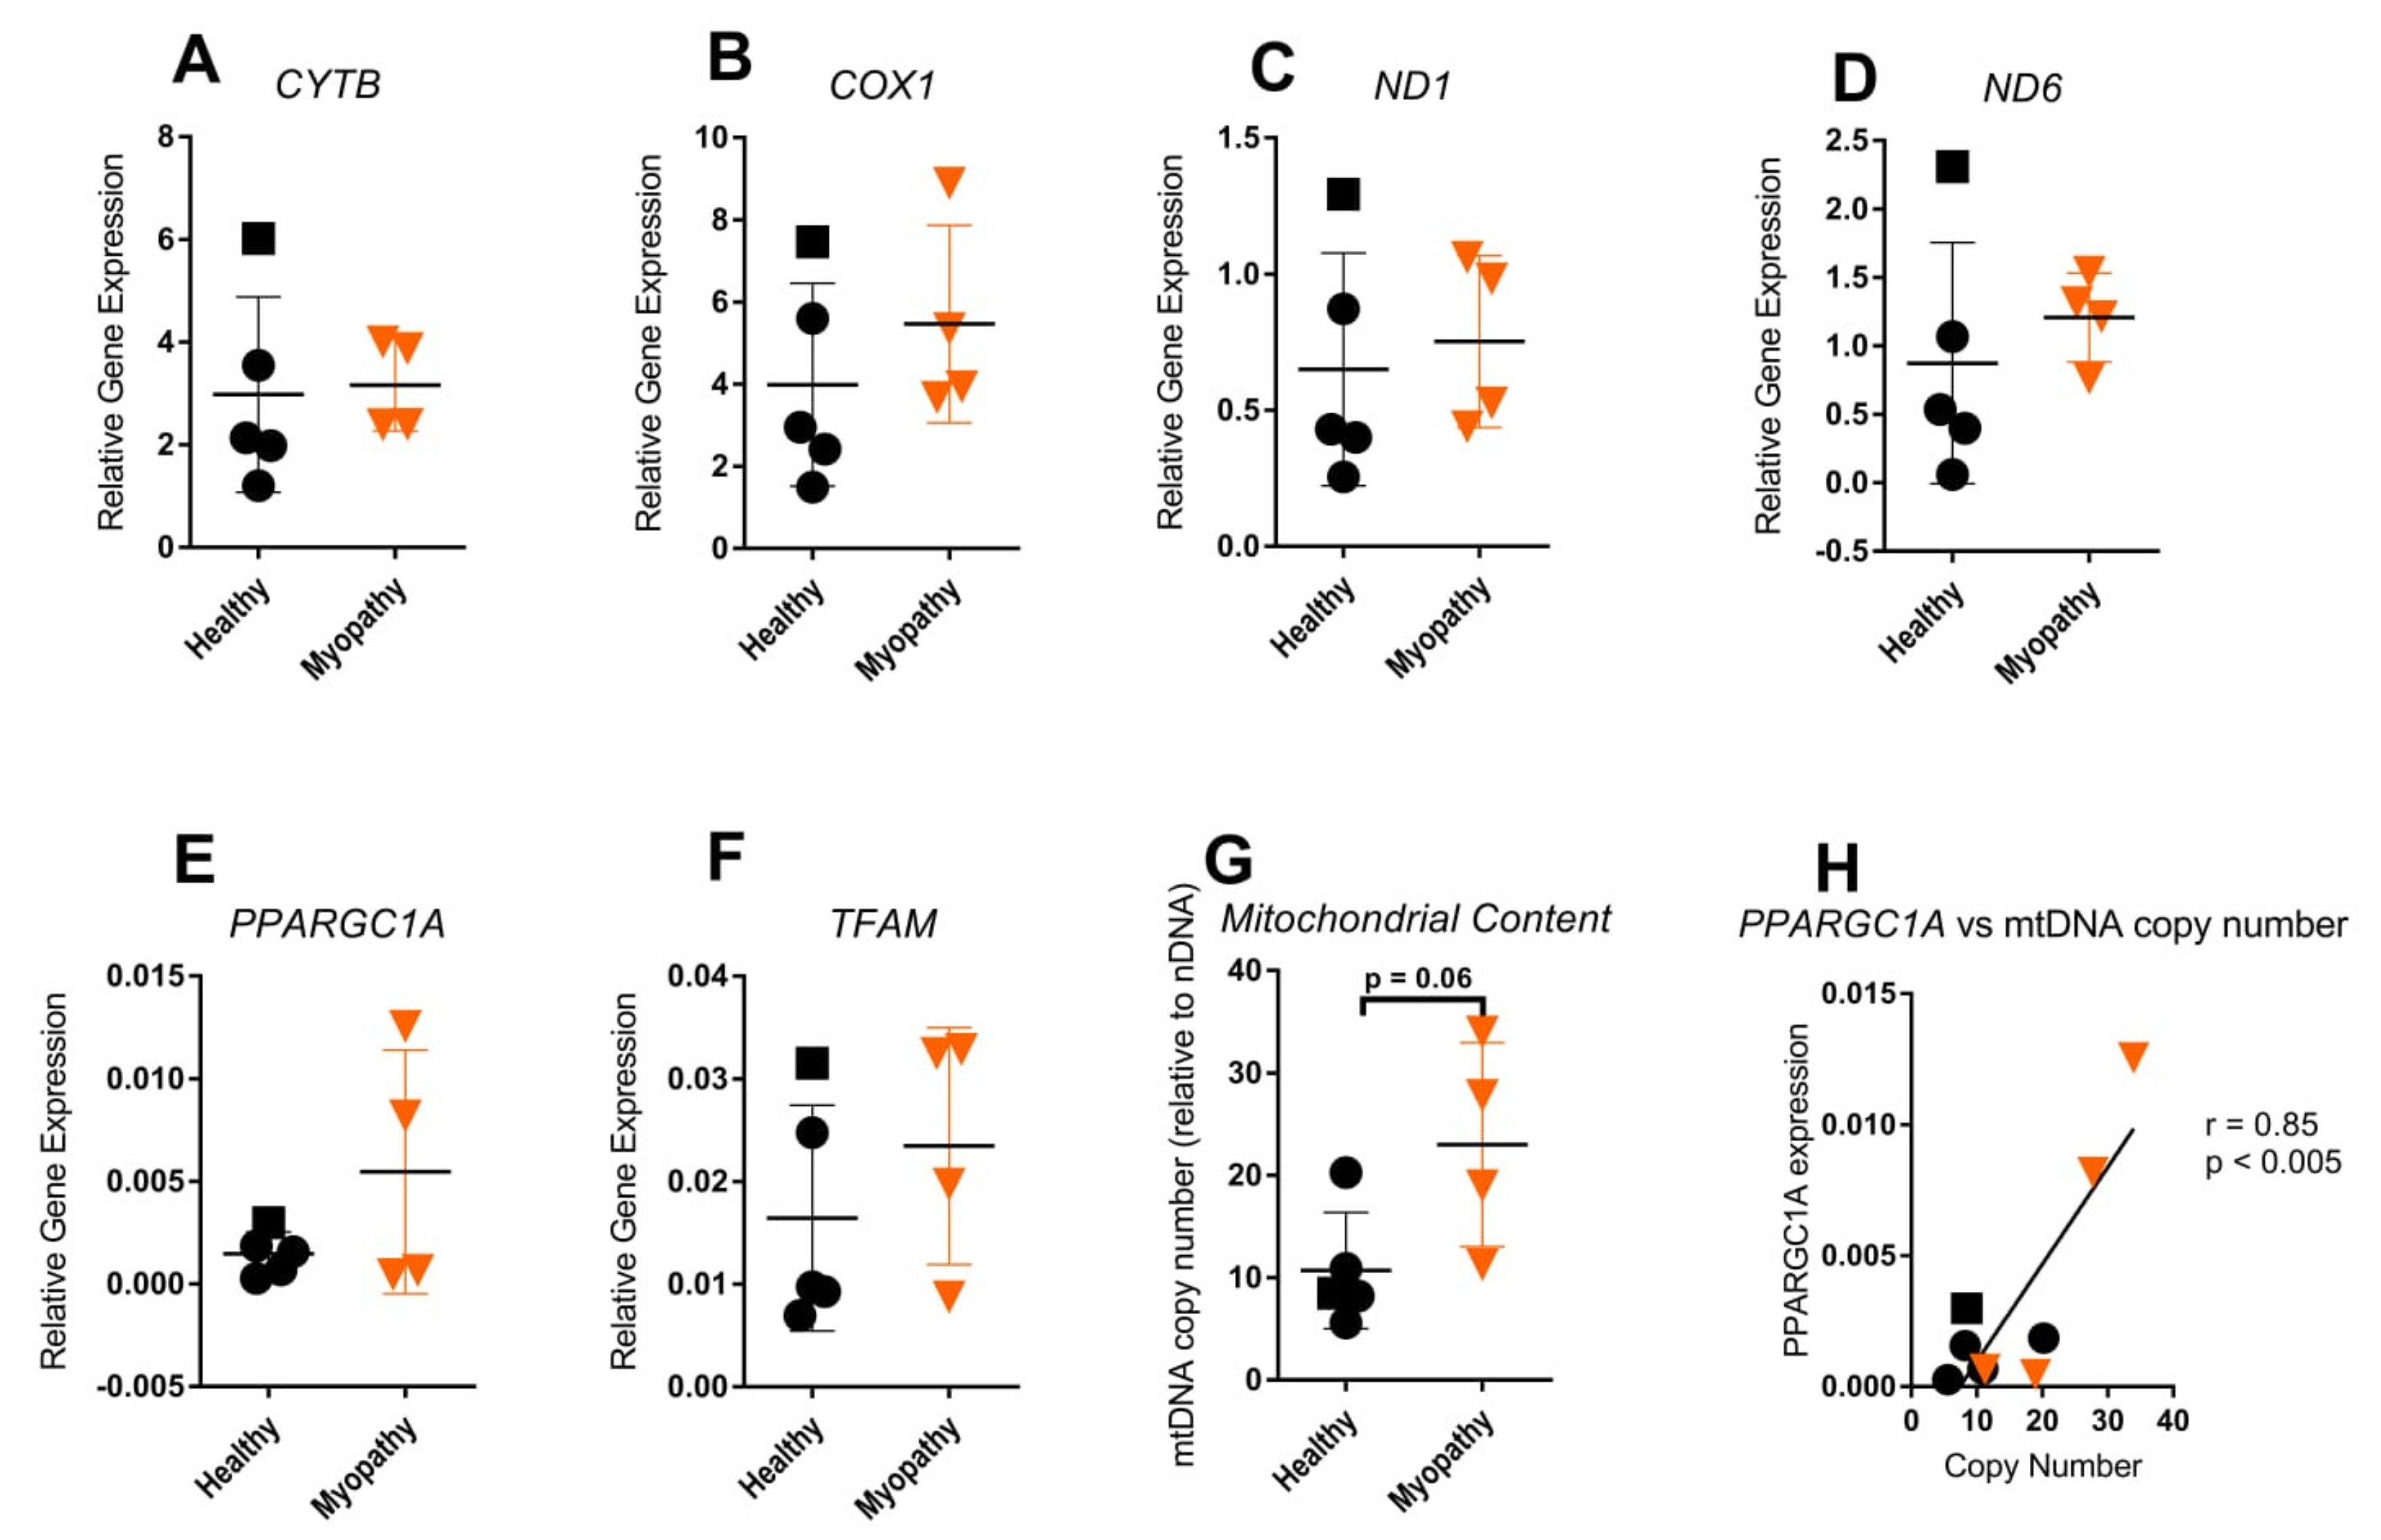
2.4. Mitochondrial Gene Expression Was Not Increased in Patient Skin Fibroblasts
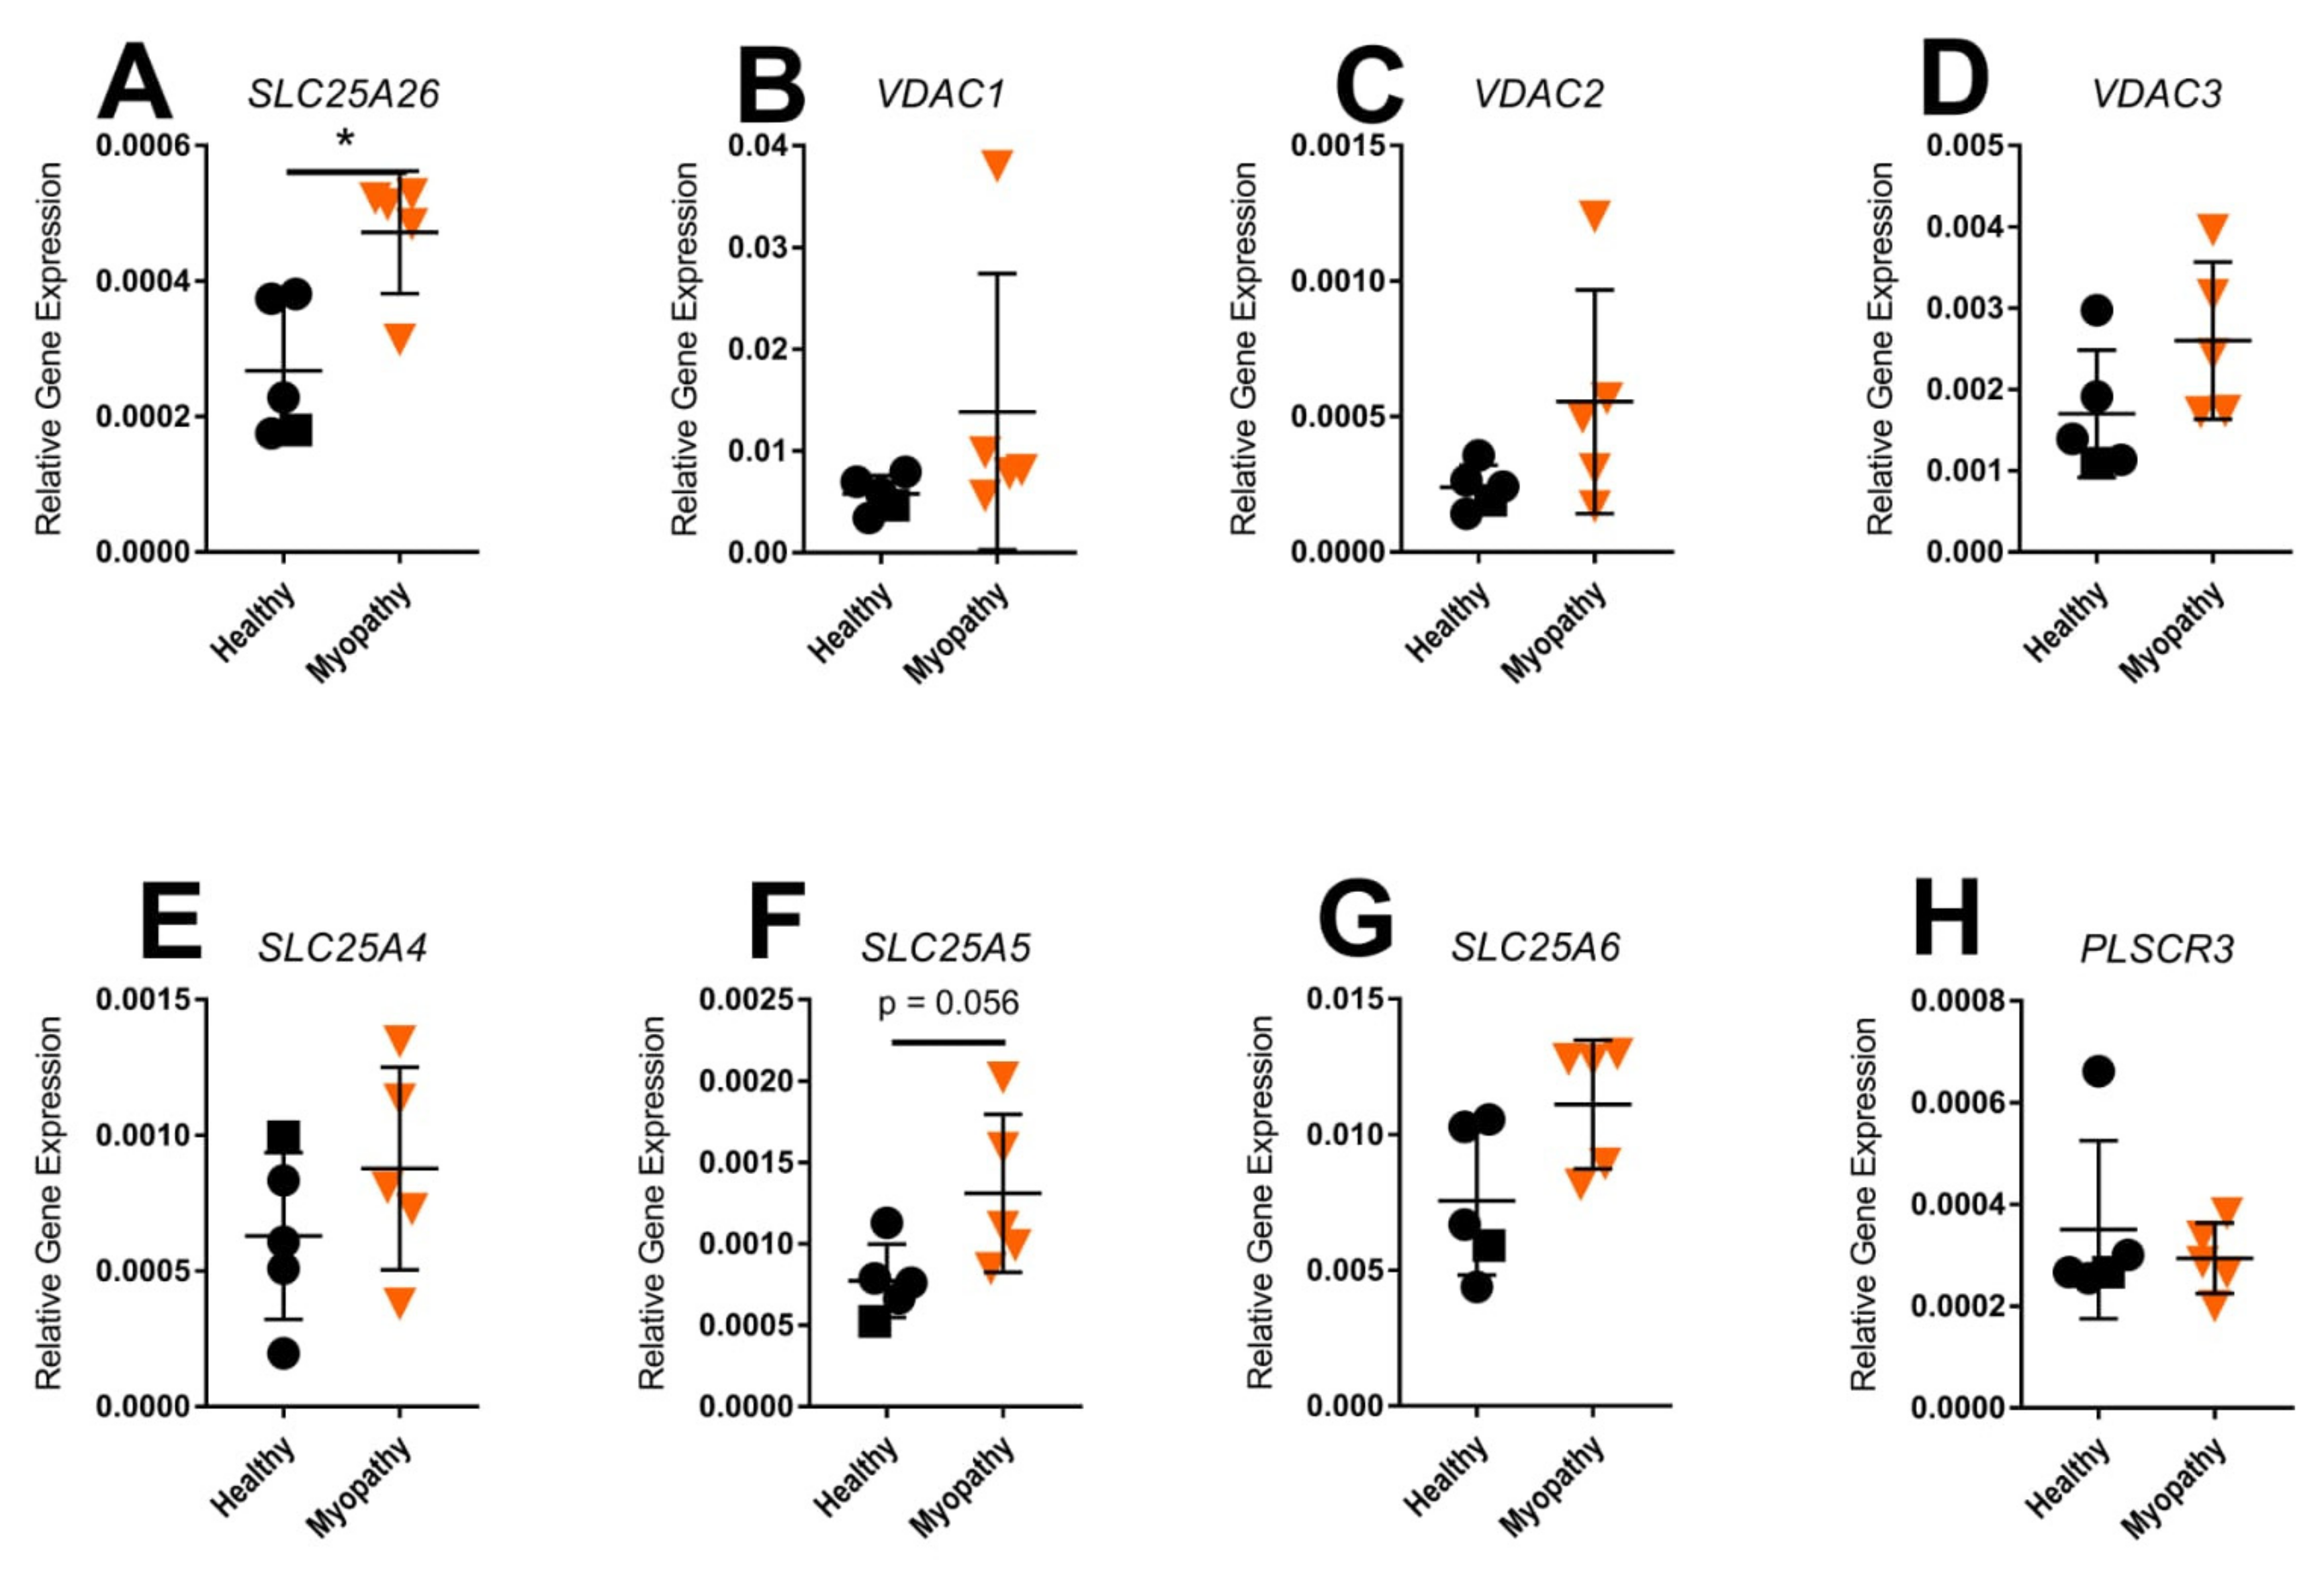
2.5. Gene Expression of Mitochondrial Transporters in Skin Fibroblasts
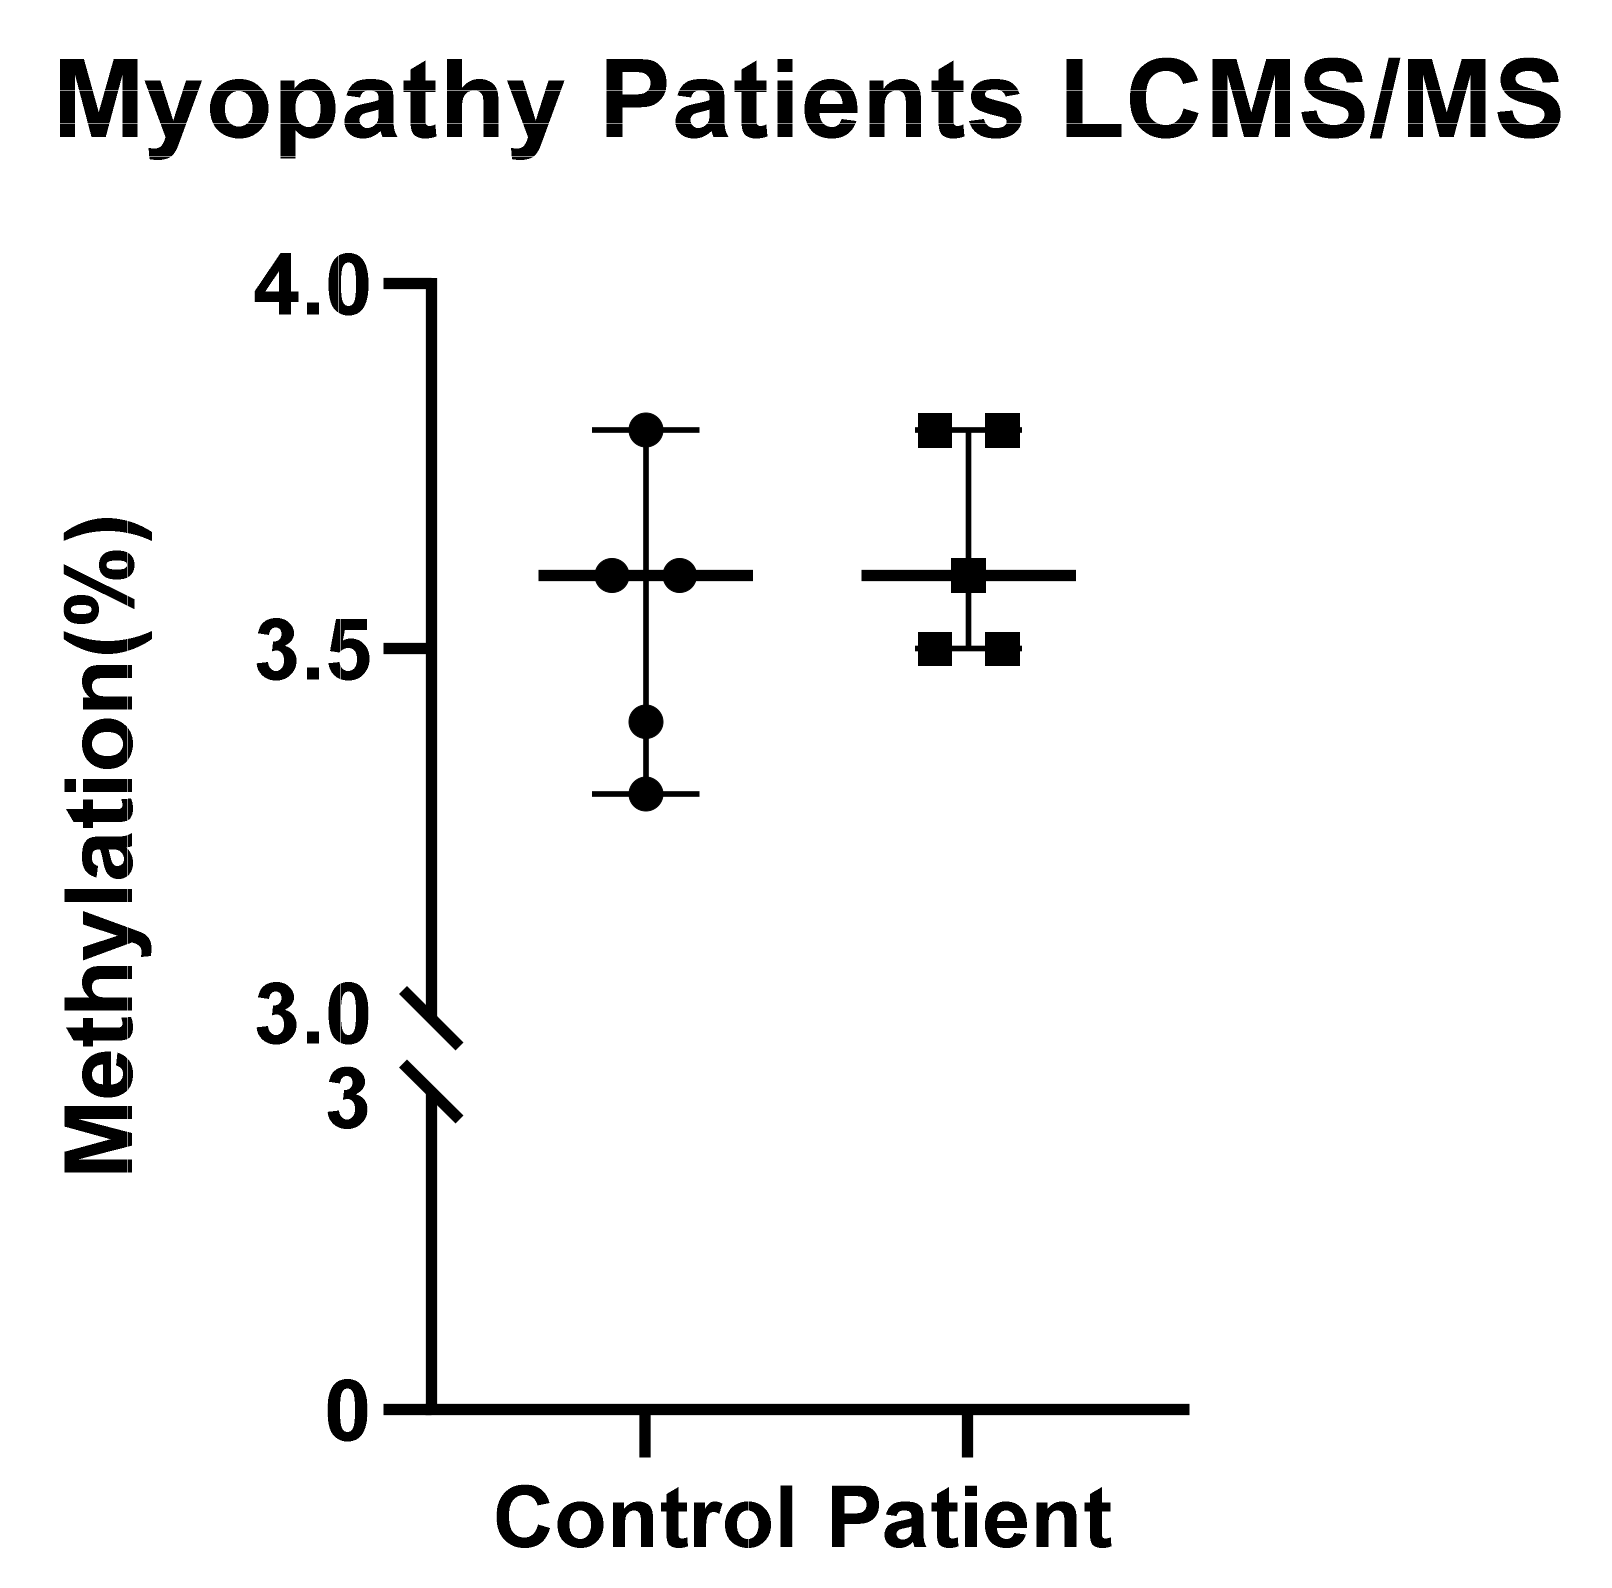
2.6. No Overall Difference in DNA Methylation as Detected by LC-MS/MS
3. Material and Methods
3.1. Patient Samples
3.2. Muscle Biopsy and ATP Measurement
3.3. Skin Biopsy and Fibroblast Culture
3.4. Human Skeletal Cell Line Culture and Treatment with S-Adenosyl Methionine (SAM)
3.5. MtDNA, Total DNA, and RNA Isolations
3.6. Pyrosequencing
3.7. Real-Time PCR (qRT-PCR)
3.8. Mitochondrial DNA Copy Number Measurement (q-PCR)
3.9. Mass Spectrometry
3.10. Statistical Analysis
4. Discussion
Supplementary Materials
Author Contributions
Funding
Institutional Review Board Statement
Informed Consent Statement
Data Availability Statement
Acknowledgments
Conflicts of Interest
References
- Ahuja, A.S. Understanding mitochondrial myopathies: A review. PeerJ 2018, 6, e4790. [Google Scholar] [CrossRef] [PubMed] [Green Version]
- Friedman, J.R.; Nunnari, J. Mitochondrial form and function. Nature 2014, 505, 335–343. [Google Scholar] [CrossRef] [Green Version]
- Rackham, O.; Shearwood, A.-M.J.; Mercer, T.R.; Davies, S.M.; Mattick, J.S.; Filipovska, A. Long noncoding RNAs are generated from the mitochondrial genome and regulated by nuclear-encoded proteins. RNA 2011, 17, 2085–2093. [Google Scholar] [CrossRef] [PubMed] [Green Version]
- Barchiesi, A.; Vascotto, C. Transcription, Processing, and Decay of Mitochondrial RNA in Health and Disease. Int. J. Mol. Sci. 2019, 20, 2221. [Google Scholar] [CrossRef] [Green Version]
- Basu, U.; Bostwick, A.M.; Das, K.; Dittenhafer-Reed, K.E.; Patel, S.S. Structure, mechanism, and regulation of mitochondrial DNA transcription initiation. J. Biol. Chem. 2020, 295, 18406–18425. [Google Scholar] [CrossRef] [PubMed]
- Rots, M.G.; Mposhi, A.; van der Wijst, M.G.; Faber, K.N. Regulation of mitochondrial gene expression the epigenetic enigma. Front. Biosci. 2017, 22, 1099–1113. [Google Scholar] [CrossRef] [PubMed] [Green Version]
- Powell, C.; Nicholls, T.; Minczuk, M. Nuclear-encoded factors involved in post-transcriptional processing and modification of mitochondrial tRNAs in human disease. Front. Genet. 2015, 6, 79. [Google Scholar] [CrossRef] [Green Version]
- Niyazov, D.M.; Kahler, S.G.; Frye, R.E. Primary Mitochondrial Disease and Secondary Mitochondrial Dysfunction: Importance of Distinction for Diagnosis and Treatment. Mol. Syndr. 2016, 7, 122–137. [Google Scholar] [CrossRef] [Green Version]
- Bai, Y.; Hu, P.; Park, J.S.; Deng, J.-H.; Song, X.; Chomyn, A.; Yagi, T.; Attardi, G. Genetic and Functional Analysis of Mitochondrial DNA-Encoded Complex I Genes. Ann. New York Acad. Sci. 2004, 1011, 272–283. [Google Scholar] [CrossRef]
- Gu, F.; Chauhan, V.; Kaur, K.; Brown, W.T.; LaFauci, G.; Wegiel, J.; Chauhan, A. Alterations in mitochondrial DNA copy number and the activities of electron transport chain complexes and pyruvate dehydrogenase in the frontal cortex from subjects with autism. Transl. Psychiatry 2013, 3, e299. [Google Scholar] [CrossRef] [Green Version]
- Emmanuele, V.; Sotiriou, E.; Rios, P.G.; Ganesh, J.; Ichord, R.; Foley, A.R.; Akman, H.O.; DiMauro, S. A Novel Mutation in the Mitochondrial DNA CytochromebGene (MTCYB)in a Patient With Mitochondrial Encephalomyopathy, Lactic Acidosis, and Strokelike Episodes Syndrome. J. Child Neurol. 2012, 28, 236–242. [Google Scholar] [CrossRef] [PubMed] [Green Version]
- Massie, R.; Wong, L.-J.C.; Milone, M. Exercise intolerance due to cytochromebmutation. Muscle Nerve 2010, 42, 136–140. [Google Scholar] [CrossRef]
- Bachmann, C.; Noreen, F.; Voermans, N.C.; Schär, P.L.; Vissing, J.; Fock, J.M.; Bulk, S.; Kusters, B.; Moore, S.; Beggs, A.H.; et al. Aberrant regulation of epigenetic modifiers contributes to the pathogenesis in patients with selenoprotein N-related myopathies. Hum. Mutat. 2019, 40, 962–974. [Google Scholar] [CrossRef] [PubMed]
- Veeranki, S.; Tyagi, S.C. Mechanisms of Hyperhomocysteinemia Induced Skeletal Muscle Myopathy after Ischemia in the CBS−/+ Mouse Model. Int. J. Mol. Sci. 2015, 16, 1252–1265. [Google Scholar] [CrossRef] [PubMed] [Green Version]
- Stoccoro, A.; Coppedè, F. Mitochondrial DNA Methylation and Human Diseases. Int. J. Mol. Sci. 2021, 22, 4594. [Google Scholar] [CrossRef] [PubMed]
- Pirola, C.J.; Gianotti, T.F.; Burgueño, A.L.; Rey-Funes, M.; Loidl, C.F.; Mallardi, P.; Martino, J.S.; Castaño, G.O.; Sookoian, S. Epigenetic modification of liver mitochondrial DNA is associated with histological severity of nonalcoholic fatty liver disease. Gut 2012, 62, 1356–1363. [Google Scholar] [CrossRef]
- Menga, A.; Palmieri, E.M.; Cianciulli, A.; Infantino, V.; Mazzone, M.; Scilimati, A.; Palmieri, F.; Castegna, A.; Iacobazzi, V. SLC25A26overexpression impairs cell function via mtDNAhypermethylation and rewiring of methyl metabolism. FEBS J. 2017, 284, 967–984. [Google Scholar] [CrossRef] [Green Version]
- van der Wijst, M.; Rots, M.G. Mitochondrial epigenetics: An overlooked layer of regulation? Trends Genet. 2015, 31, 353–356. [Google Scholar] [CrossRef]
- Montier, L.L.C.; Deng, J.J.; Bai, Y. Number matters: Control of mammalian mitochondrial DNA copy number. J. Genet. Genom. 2009, 36, 125–131. [Google Scholar] [CrossRef] [Green Version]
- Nicholls, T.J.; Minczuk, M. In D-loop: 40 years of mitochondrial 7S DNA. Exp. Gerontol. 2014, 56, 175–181. [Google Scholar] [CrossRef]
- Lunnon, K.; Keohane, A.; Pidsley, R.; Newhouse, S.; Riddoch-Contreras, J.; Thubron, E.B.; Devall, M.; Soininen, H.; Kłoszewska, I.; Mecocci, P.; et al. Mitochondrial genes are altered in blood early in Alzheimer’s disease. Neurobiol. Aging 2017, 53, 36–47. [Google Scholar] [CrossRef] [Green Version]
- Van Der Wijst, M.G.P.; Van Tilburg, A.Y.; Ruiters, M.H.J.; Rots, M.G. Experimental mitochondria-targeted DNA methylation identifies GpC methylation, not CpG methylation, as potential regulator of mitochondrial gene expression. Sci. Rep. 2017, 7, 1–15. [Google Scholar] [CrossRef] [Green Version]
- Gao, J.; Wen, S.; Zhou, H.; Feng, S. De-methylation of displacement loop of mitochondrial DNA is associated with increased mitochondrial copy number and nicotinamide adenine dinucleotide subunit 2 expression in colorectal cancer. Mol. Med. Rep. 2015, 12, 7033–7038. [Google Scholar] [CrossRef] [Green Version]
- Devall, M.; Smith, R.G.; Jeffries, A.; Hannon, E.; Davies, M.N.; Schalkwyk, L.; Mill, J.; Weedon, M.; Lunnon, K. Regional differences in mitochondrial DNA methylation in human post-mortem brain tissue. Clin. Epigenetics 2017, 9, 1–15. [Google Scholar] [CrossRef] [Green Version]
- Owa, C.; Poulin, M.; Yan, L.; Shioda, T. Technical adequacy of bisulfite sequencing and pyrosequencing for detection of mitochondrial DNA methylation: Sources and avoidance of false-positive detection. PLoS ONE 2018, 13, e0192722. [Google Scholar] [CrossRef] [Green Version]
- Mechta, M.; Ingerslev, L.R.; Fabre, O.; Picard, M.; Barrès, R. Evidence Suggesting Absence of Mitochondrial DNA Methylation. Front. Genet. 2017, 8, 166. [Google Scholar] [CrossRef] [Green Version]
- Dou, X.; Boyd-Kirkup, J.D.; McDermott, J.; Zhang, X.; Li, F.; Rong, B.; Zhang, R.; Miao, B.; Chen, P.; Cheng, H.; et al. The strand-biased mitochondrial DNA methylome and its regulation by DNMT3A. Genome Res. 2019, 29, 1622–1634. [Google Scholar] [CrossRef]
- Patil, V.; Cuenin, C.; Chung, F.; Rodríguez-Aguilera, J.R.; Fernandez-Jimenez, N.; Romero-Garmendia, I.; Bilbao, J.R.; Cahais, V.; Rothwell, J.; Herceg, Z. Human mitochondrial DNA is extensively methylated in a non-CpG context. Nucleic Acids Res. 2019, 47, 10072–10085. [Google Scholar] [CrossRef] [Green Version]
- Matsuda, S.; Yasukawa, T.; Sakaguchi, Y.; Ichiyanagi, K.; Unoki, M.; Gotoh, K.; Fukuda, K.; Sasaki, H.; Suzuki, T.; Kang, D. Accurate estimation of 5-methylcytosine in mammalian mitochondrial DNA. Sci. Rep. 2018, 8, 5801. [Google Scholar] [CrossRef]
- Goldsmith, C.; Rodríguez-Aguilera, J.R.; El-Rifai, I.; Jarretier-Yuste, A.; Hervieu, V.; Raineteau, O.; Saintigny, P.; de Sánchez, V.C.; Dante, R.; Ichim, G.; et al. Low biological fluctuation of mitochondrial CpG and non-CpG methylation at the single-molecule level. Sci. Rep. 2021, 11, 1–17. [Google Scholar] [CrossRef]
- Lüth, T.; Wasner, K.; Klein, C.; Schaake, S.; Tse, R.; Pereira, S.L.; Laß, J.; Sinkkonen, L.; Grünewald, A.; Trinh, J. Nanopore Single-Molecule Sequencing for Mitochondrial DNA Methylation Analysis: Investigating Parkin-Associated Parkinsonism as a Proof of Concept. Front. Aging Neurosci. 2021, 13, 84. [Google Scholar] [CrossRef]
- Bicci, I.; Calabrese, C.; Golder, Z.J.; Gomez-Duran, A.; Chinnery, P.F. Single-molecule mitochondrial DNA sequencing shows no evidence of CpG methylation in human cells and tissues. Nucleic Acids Res. 2021. [Google Scholar] [CrossRef] [PubMed]
- Janssen, A.J.; Trijbels, F.J.; Sengers, R.C.; Wintjes, L.T.; Ruitenbeek, W.; Smeitink, J.A.; Morava, E.; Van Engelen, B.G.; Heuvel, L.P.V.D.; Rodenburg, R.J. Measurement of the Energy-Generating Capacity of Human Muscle Mitochondria: Diagnostic Procedure and Application to Human Pathology. Clin. Chem. 2006, 52, 860–871. [Google Scholar] [CrossRef] [PubMed]
- Rodenburg, R.J.T. Biochemical diagnosis of mitochondrial disorders. J. Inherit. Metab. Dis. 2010, 34, 283–292. [Google Scholar] [CrossRef] [PubMed] [Green Version]
- Livak, K.J.; Schmittgen, T.D. Analysis of Relative Gene Expression Data Using Real-Time Quantitative PCR and the 2−ΔΔCT Method. Methods 2001, 25, 402–408. [Google Scholar] [CrossRef] [PubMed]
- Zhou, G.; Pang, H.; Tang, Y.; Yao, X.; Ding, Y.; Zhu, S.; Guo, S.; Qian, D.; Shen, J.; Qian, Y.; et al. Hydrophilic interaction ultra-performance liquid chromatography coupled with triple-quadrupole tandem mass spectrometry (HILIC-UPLC–TQ-MS/MS) in multiple-reaction monitoring (MRM) for the determination of nucleobases and nucleosides in ginkgo seeds. Food Chem. 2013, 150, 260–266. [Google Scholar] [CrossRef] [PubMed]
- Legros, F.; Chatzoglou, E.; Frachon, P.; De Baulny, H.O.; Laforêt, P.; Jardel, C.; Godinot, C.; Lombès, A. Functional characterization of novel mutations in the human cytochrome b gene. Eur. J. Hum. Genet. 2001, 9, 510–518. [Google Scholar] [CrossRef]
- Yang, H.; Feng, S.; Xiong, L.; Ji, Z.; Cheng, W. Correlation between increased ND2 expression and demethylated displacement loop of mtDNA in colorectal cancer. Mol. Med. Rep. 2012, 6, 125–130. [Google Scholar] [CrossRef] [Green Version]
- Stoccoro, A.; Mosca, L.; Carnicelli, V.; Cavallari, U.; Lunetta, C.; Marocchi, A.; Migliore, L.; Coppedè, F. Mitochondrial DNA copy number and D-loop region methylation in carriers of amyotrophic lateral sclerosis gene mutations. Epigenomics 2018, 10, 1431–1443. [Google Scholar] [CrossRef]
- Zheng, L.D.; Linarelli, L.E.; Liu, L.; Wall, S.S.; Greenawald, M.H.; Seidel, R.W.; Estabrooks, P.A.; Almeida, F.A.; Cheng, Z. Insulin resistance is associated with epigenetic and genetic regulation of mitochondrial DNA in obese humans. Clin. Epigenetics 2015, 7, 1–9. [Google Scholar] [CrossRef] [Green Version]
- Baccarelli, A.A.; Byun, H.-M. Platelet mitochondrial DNA methylation: A potential new marker of cardiovascular disease. Clin. Epigenet. 2015, 7, 1–9. [Google Scholar] [CrossRef] [Green Version]
- Infantino, V.; Castegna, A.; Iacobazzi, F.; Spera, I.; Scala, I.; Andria, G.; Iacobazzi, V. Impairment of methyl cycle affects mitochondrial methyl availability and glutathione level in Down’s syndrome. Mol. Genet. Metab. 2011, 102, 378–382. [Google Scholar] [CrossRef]
- de Laat, P.; Koene, S.; van den Heuvel, L.P.; Rodenburg, R.J.T.; Janssen, M.C.H.; Smeitink, J.A.M. Clinical features and heteroplasmy in blood, urine and saliva in 34 Dutch families carrying the m.3243A > G mutation. J. Inherit. Metab. Dis. 2012, 35, 1059–1069. [Google Scholar] [CrossRef] [Green Version]
- Reis, R.J.S.; Goldstein, S. Mitochondrial DNA in mortal and immortal human cells. Genome number, integrity, and methylation. J. Biol. Chem. 1983, 258, 9078–9085. [Google Scholar] [CrossRef]
- Bai, R.-K.; Wong, L.-J.C. Simultaneous Detection and Quantification of Mitochondrial DNA Deletion(s), Depletion, and over-Replication in Patients with Mitochondrial Disease. J. Mol. Diagn. 2005, 7, 613–622. [Google Scholar] [CrossRef] [Green Version]
- Vattemi, G.; Mirabella, M.; Guglielmi, V.; Lucchini, M.; Tomelleri, G.; Ghirardello, A.; Doria, A. Muscle biopsy features of idiopathic inflammatory myopathies and differential diagnosis. Autoimmun. Highlights 2014, 5, 77–85. [Google Scholar] [CrossRef]
- Filograna, R.; Koolmeister, C.; Upadhyay, M.; Pajak, A.; Clemente, P.; Wibom, R.; Simard, M.L.; Wredenberg, A.; Freyer, C.; Stewart, J.B.; et al. Modulation of mtDNA copy number ameliorates the pathological consequences of a heteroplasmic mtDNA mutation in the mouse. Sci. Adv. 2019, 5, eaav9824. [Google Scholar] [CrossRef] [Green Version]
- Wredenberg, A.; Wibom, R.; Wilhelmsson, H.; Graff, C.; Wiener, H.H.; Burden, S.J.; Oldfors, A.; Westerblad, H.; Larsson, N.-G. Increased mitochondrial mass in mitochondrial myopathy mice. Proc. Natl. Acad. Sci. USA 2002, 99, 15066–15071. [Google Scholar] [CrossRef] [Green Version]
- Jin, C.J.; Park, H.K.; Cho, Y.M.; Pak, Y.; Lee, K.-U.; Kim, M.S.; Friso, S.; Choi, S.-W.; Park, K.S.; Lee, H.K. S-adenosyl-L-methionine increases skeletal muscle mitochondrial DNA density and whole body insulin sensitivity in OLETF rats. J. Nutr. 2007, 137, 339–344. [Google Scholar] [CrossRef] [Green Version]
- Barres, R.; Osler, M.E.; Yan, J.; Rune, A.; Fritz, T.; Caidahl, K.; Krook, A.; Zierath, J.R. Non-CpG Methylation of the PGC-1α Promoter through DNMT3B Controls Mitochondrial Density. Cell Metab. 2009, 10, 189–198. [Google Scholar] [CrossRef] [Green Version]
- Dorman, C.; Dorman, M. DNA supercoiling is a fundamental regulatory principle in the control of bacterial gene expression. Biophys. Rev. 2016, 8, 209–220. [Google Scholar] [CrossRef] [Green Version]
- Ngo, H.B.; Lovely, G.A.; Phillips, R.; Chan, D.C. Distinct structural features of TFAM drive mitochondrial DNA packaging versus transcriptional activation. Nat. Commun. 2014, 5, 3077. [Google Scholar] [CrossRef] [Green Version]
- Rebelo, A.P.; Williams, S.L.; Moraes, C.T. In vivo methylation of mtDNA reveals the dynamics of protein–mtDNA interactions. Nucleic Acids Res. 2009, 37, 6701–6715. [Google Scholar] [CrossRef] [Green Version]
- Dostal, V.; Churchill, M.E. Cytosine methylation of mitochondrial DNA at CpG sequences impacts transcription factor A DNA binding and transcription. Biochim. Biophys. Acta 2019, 1862, 598–607. [Google Scholar] [CrossRef]
- Liu, B.; Du, Q.; Chen, L.; Fu, G.; Li, S.; Fu, L.; Zhang, X.; Ma, C.; Bin, C. CpG methylation patterns of human mitochondrial DNA. Sci. Rep. 2016, 6, 23421. [Google Scholar] [CrossRef] [Green Version]
- Hao, Z.; Wu, T.; Cui, X.; Zhu, P.; Tan, C.; Dou, X.; Hsu, K.-W.; Lin, Y.-T.; Peng, P.-H.; Zhang, L.-S.; et al. N6-Deoxyadenosine Methylation in Mammalian Mitochondrial DNA. Mol. Cell 2020, 78, 382–395. [Google Scholar] [CrossRef]
- Lin, X.-C.; Zhang, T.; Liu, L.; Tang, H.; Yu, R.-Q.; Jiang, J.-H. Mass Spectrometry Based Ultrasensitive DNA Methylation Profiling Using Target Fragmentation Assay. Anal. Chem. 2016, 88, 1083–1087. [Google Scholar] [CrossRef] [Green Version]
- Gammage, P.A.; Rorbach, J.; Vincent, A.I.; Rebar, E.J.; Minczuk, M. Mitochondrially targeted ZFN s for selective degradation of pathogenic mitochondrial genomes bearing large-scale deletions or point mutations. EMBO Mol. Med. 2014, 6, 458–466. [Google Scholar] [CrossRef]
- Yahata, N.; Boda, H.; Hata, R. Elimination of Mutant mtDNA by an Optimized mpTALEN Restores Differentiation Capacities of Heteroplasmic MELAS-iPSCs. Mol. Ther.-Methods Clin. Dev. 2021, 20, 54–68. [Google Scholar] [CrossRef]
- Nakamura, M.; Gao, Y.; Dominguez, A.A.; Qi, L.S. CRISPR technologies for precise epigenome editing. Nat. Cell Biol. 2021, 23, 11–22. [Google Scholar] [CrossRef]


Publisher’s Note: MDPI stays neutral with regard to jurisdictional claims in published maps and institutional affiliations. |
© 2022 by the authors. Licensee MDPI, Basel, Switzerland. This article is an open access article distributed under the terms and conditions of the Creative Commons Attribution (CC BY) license (https://creativecommons.org/licenses/by/4.0/).
Share and Cite
Mposhi, A.; Liang, L.; Mennega, K.P.; Yildiz, D.; Kampert, C.; Hof, I.H.; Jellema, P.G.; de Koning, T.J.; Faber, K.N.; Ruiters, M.H.J.; et al. The Mitochondrial Epigenome: An Unexplored Avenue to Explain Unexplained Myopathies? Int. J. Mol. Sci. 2022, 23, 2197. https://doi.org/10.3390/ijms23042197
Mposhi A, Liang L, Mennega KP, Yildiz D, Kampert C, Hof IH, Jellema PG, de Koning TJ, Faber KN, Ruiters MHJ, et al. The Mitochondrial Epigenome: An Unexplored Avenue to Explain Unexplained Myopathies? International Journal of Molecular Sciences. 2022; 23(4):2197. https://doi.org/10.3390/ijms23042197
Chicago/Turabian StyleMposhi, Archibold, Lin Liang, Kevin P. Mennega, Dilemin Yildiz, Crista Kampert, Ingrid H. Hof, Pytrick G. Jellema, Tom J. de Koning, Klaas Nico Faber, Marcel H. J. Ruiters, and et al. 2022. "The Mitochondrial Epigenome: An Unexplored Avenue to Explain Unexplained Myopathies?" International Journal of Molecular Sciences 23, no. 4: 2197. https://doi.org/10.3390/ijms23042197