Article

Adipsin Serum Concentrations and Adipose Tissue Expression in People with Obesity and Type 2 Diabetes

1
Medical Department III—Endocrinology, Nephrology, Rheumatology, University of Leipzig Medical Center, 04103 Leipzig, Germany
2
Clinic for Visceral, Transplantation and Thorax and Vascular Surgery, University Hospital Leipzig, 04103 Leipzig, Germany
3
Helmholtz Institute for Metabolic, Obesity and Vascular Research (HI-MAG) of the Helmholtz Zentrum München at the University of Leipzig and University Hospital Leipzig, 04103 Leipzig, Germany
4
Department of General, Abdominal and Pediatric Surgery, Municipal Hospital, 07548 Gera, Germany
5
Städtisches Klinikum Karlsruhe, Clinic of Visceral Surgery, 76133 Karlsruhe, Germany
6
Municipal Clinic Dresden-Neustadt, 01129 Dresden, Germany
7
Deutsches Zentrum für Diabetesforschung e.V., 85764 Oberschleißheim, Germany
*
Authors to whom correspondence should be addressed.
Int. J. Mol. Sci. 2022, 23(4), 2222; https://doi.org/10.3390/ijms23042222
Submission received: 21 January 2022 / Revised: 2 February 2022 / Accepted: 7 February 2022 / Published: 17 February 2022
(This article belongs to the Special Issue Mechanisms of Insulin Resistance and Adipose Tissue Dysfunction)

Abstract

:
(1) Adipsin is an adipokine that may link increased fat mass and adipose tissue dysfunction to obesity-related cardiometabolic diseases. Here, we investigated whether adipsin serum concentrations and adipose tissue (AT) adipsin mRNA expression are related to parameters of AT function, obesity and type 2 diabetes (T2D). (2) Methods: A cohort of 637 individuals with a wide range of age and body weight (Age: 18–85 years; BMI: 19–70 kg/m2) with (n = 237) or without (n = 400) T2D was analyzed for serum adipsin concentrations by ELISA and visceral (VAT) and subcutaneous (SAT) adipsin mRNA expression by RT-PCR. (3) Results: Adipsin serum concentrations were significantly higher in patients with T2D compared to normoglycemic individuals. We found significant positive univariate relationships of adipsin serum concentrations with age (r = 0.282, p < 0.001), body weight (r = 0.264, p < 0.001), fasting plasma glucose (r = 0.136, p = 0.006) and leptin serum concentrations (r = 0.362, p < 0.001). Neither VAT nor SAT adipsin mRNA expression correlated with adipsin serum concentrations after adjusting for age, sex and BMI. Independent of T2D status, we found significantly higher adipsin expression in SAT compared to VAT (4) Conclusions: Our data suggest that adipsin serum concentrations are strongly related to obesity and age. However, neither circulating adipsin nor adipsin AT expression reflects parameters of impaired glucose or lipid metabolism in patients with obesity with or without T2D.

1. Introduction

Obesity can be considered a slow motion pandemic, as its prevalence has been tripled worldwide since 1975 [1,2,3]. Obesity increases the risk of cardiovascular, metabolic and multiple other comorbidities [4,5], but the individual risk for these diseases may vary and is at least partly related to distinct alterations in adipose tissue (AT), including its endocrine function [6,7]. In genetically susceptible people, increased energy intake results in AT accumulation and is often accompanied by adipocyte hypertrophy [8,9], AT inflammation and heterogeneous body fat distribution [6,10]. Altered secretion of adipokines and changes in AT metabolites release may link obesity to AT dysfunction and obesity-related cardiometabolic diseases [4,6,7,11,12]. In the past two decades, hundreds of adipokines have been discovered [13]. For many of these adipokines, we only have an incomplete understanding about their mechanism of action, regulation of expression and clinical relevance [14].
Adipsin is an adipokine that represents one of the major proteins expressed by adipocytes [15]. First reported in 1987, adipsin has been identified as complement factor D, an integral part of the complement system [16,17,18], which induces amplification of the alternative complement pathway [18,19]. In this process, adipsin is integrated into an enzymatic cascade that releases the C5–C9 membrane attack complex and anaphylatoxins like C3a and C5a [20]. Adipsin is predominantly synthesized by AT cells [17] and associations between circulating adipsin and parameters of obesity and glucose metabolism have been found recently [21,22,23]. Adipsin catalyzes the release of complement factor C3a, which has been shown to stimulate insulin production in pancreatic ß-cells [20]. Adipsin serum concentrations are reduced in patients with type 2 diabetes (T2D) and ß-cell failure [20]. Furthermore, adipsin facilitates glucose uptake and increases triglyceride synthesis in adipocytes [24]. Mice with a genetic ablation of adipsin are characterized by impaired glucose homeostasis in response to diet-induced obesity [18,20]. The model revealed an important role of adipsin in the regulation of normal insulin secretion. Taken together, these recent findings propose adipsin as an important AT-secreted factor that may link obesity and adipocyte dysfunction to impaired β-cell function and cardiometabolic diseases.
We therefore tested the hypothesis that adipsin gene expression in human AT and its serum concentrations are related to obesity, fat distribution and parameters of AT function and glucose metabolism. We sought to determine whether AT adipsin mRNA is differentially expressed in subcutaneous and visceral fat depots and whether it correlates to adipsin serum concentrations in patients with obesity with or without T2D.

2. Results

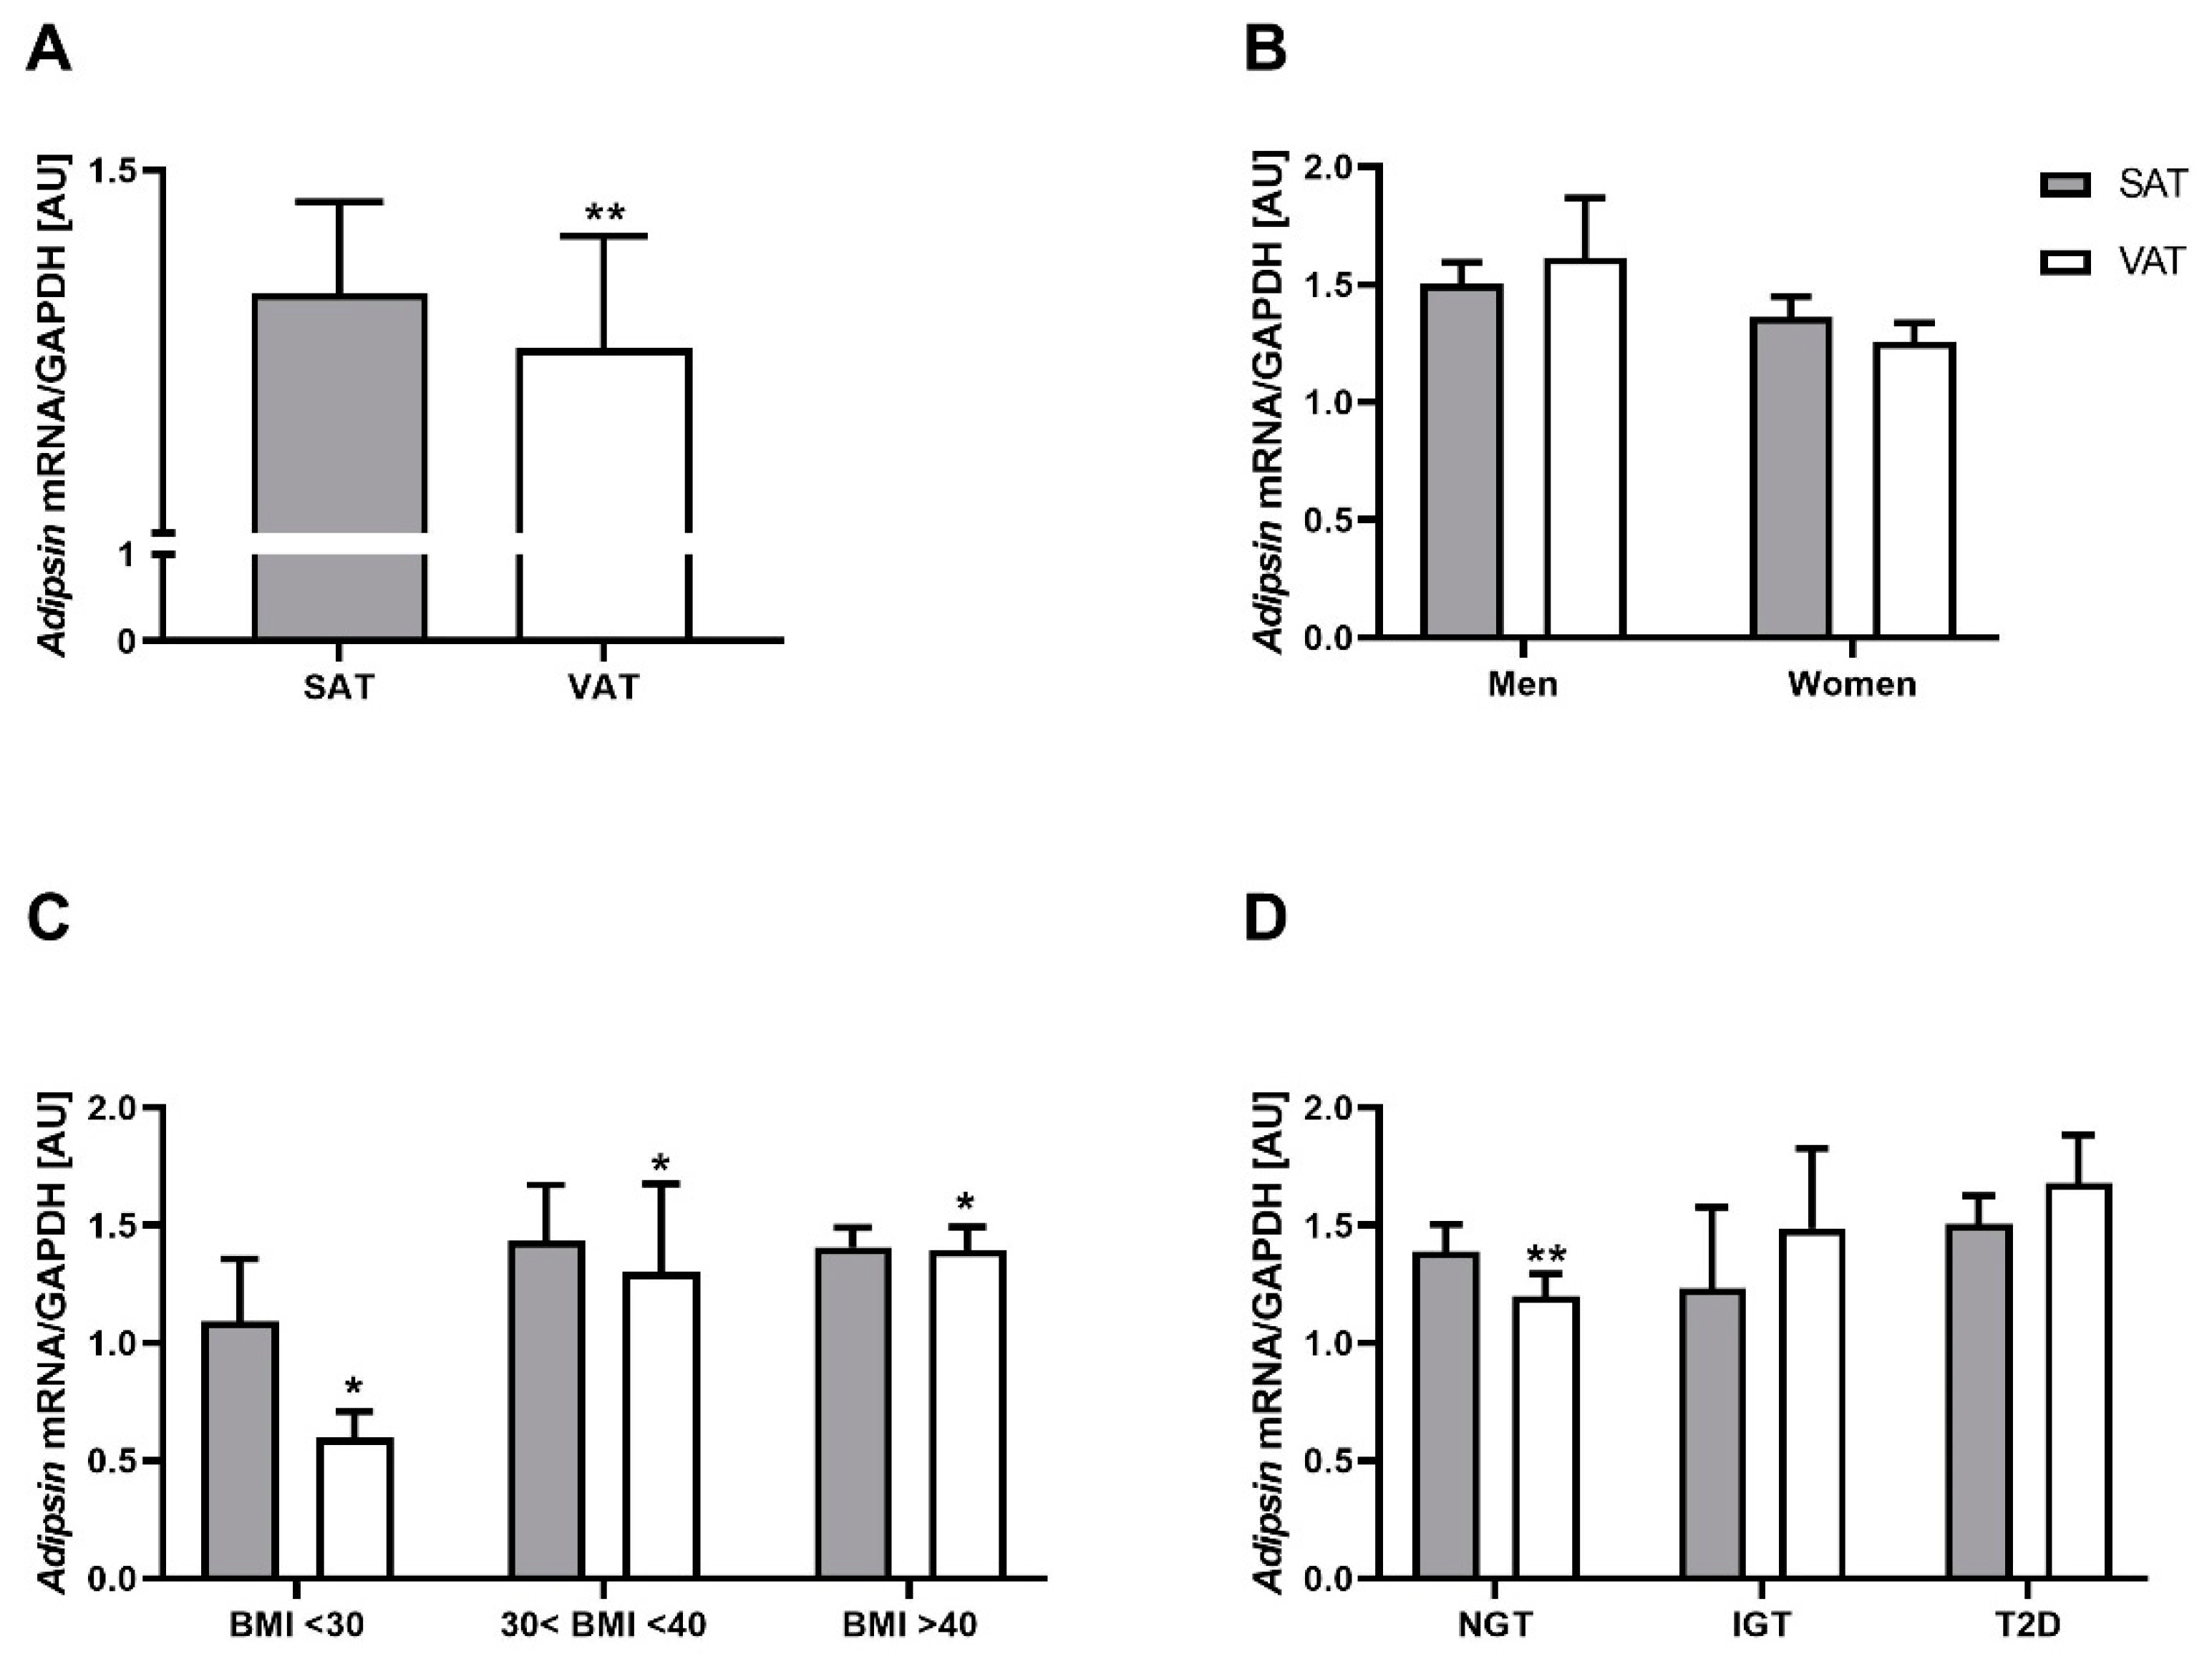
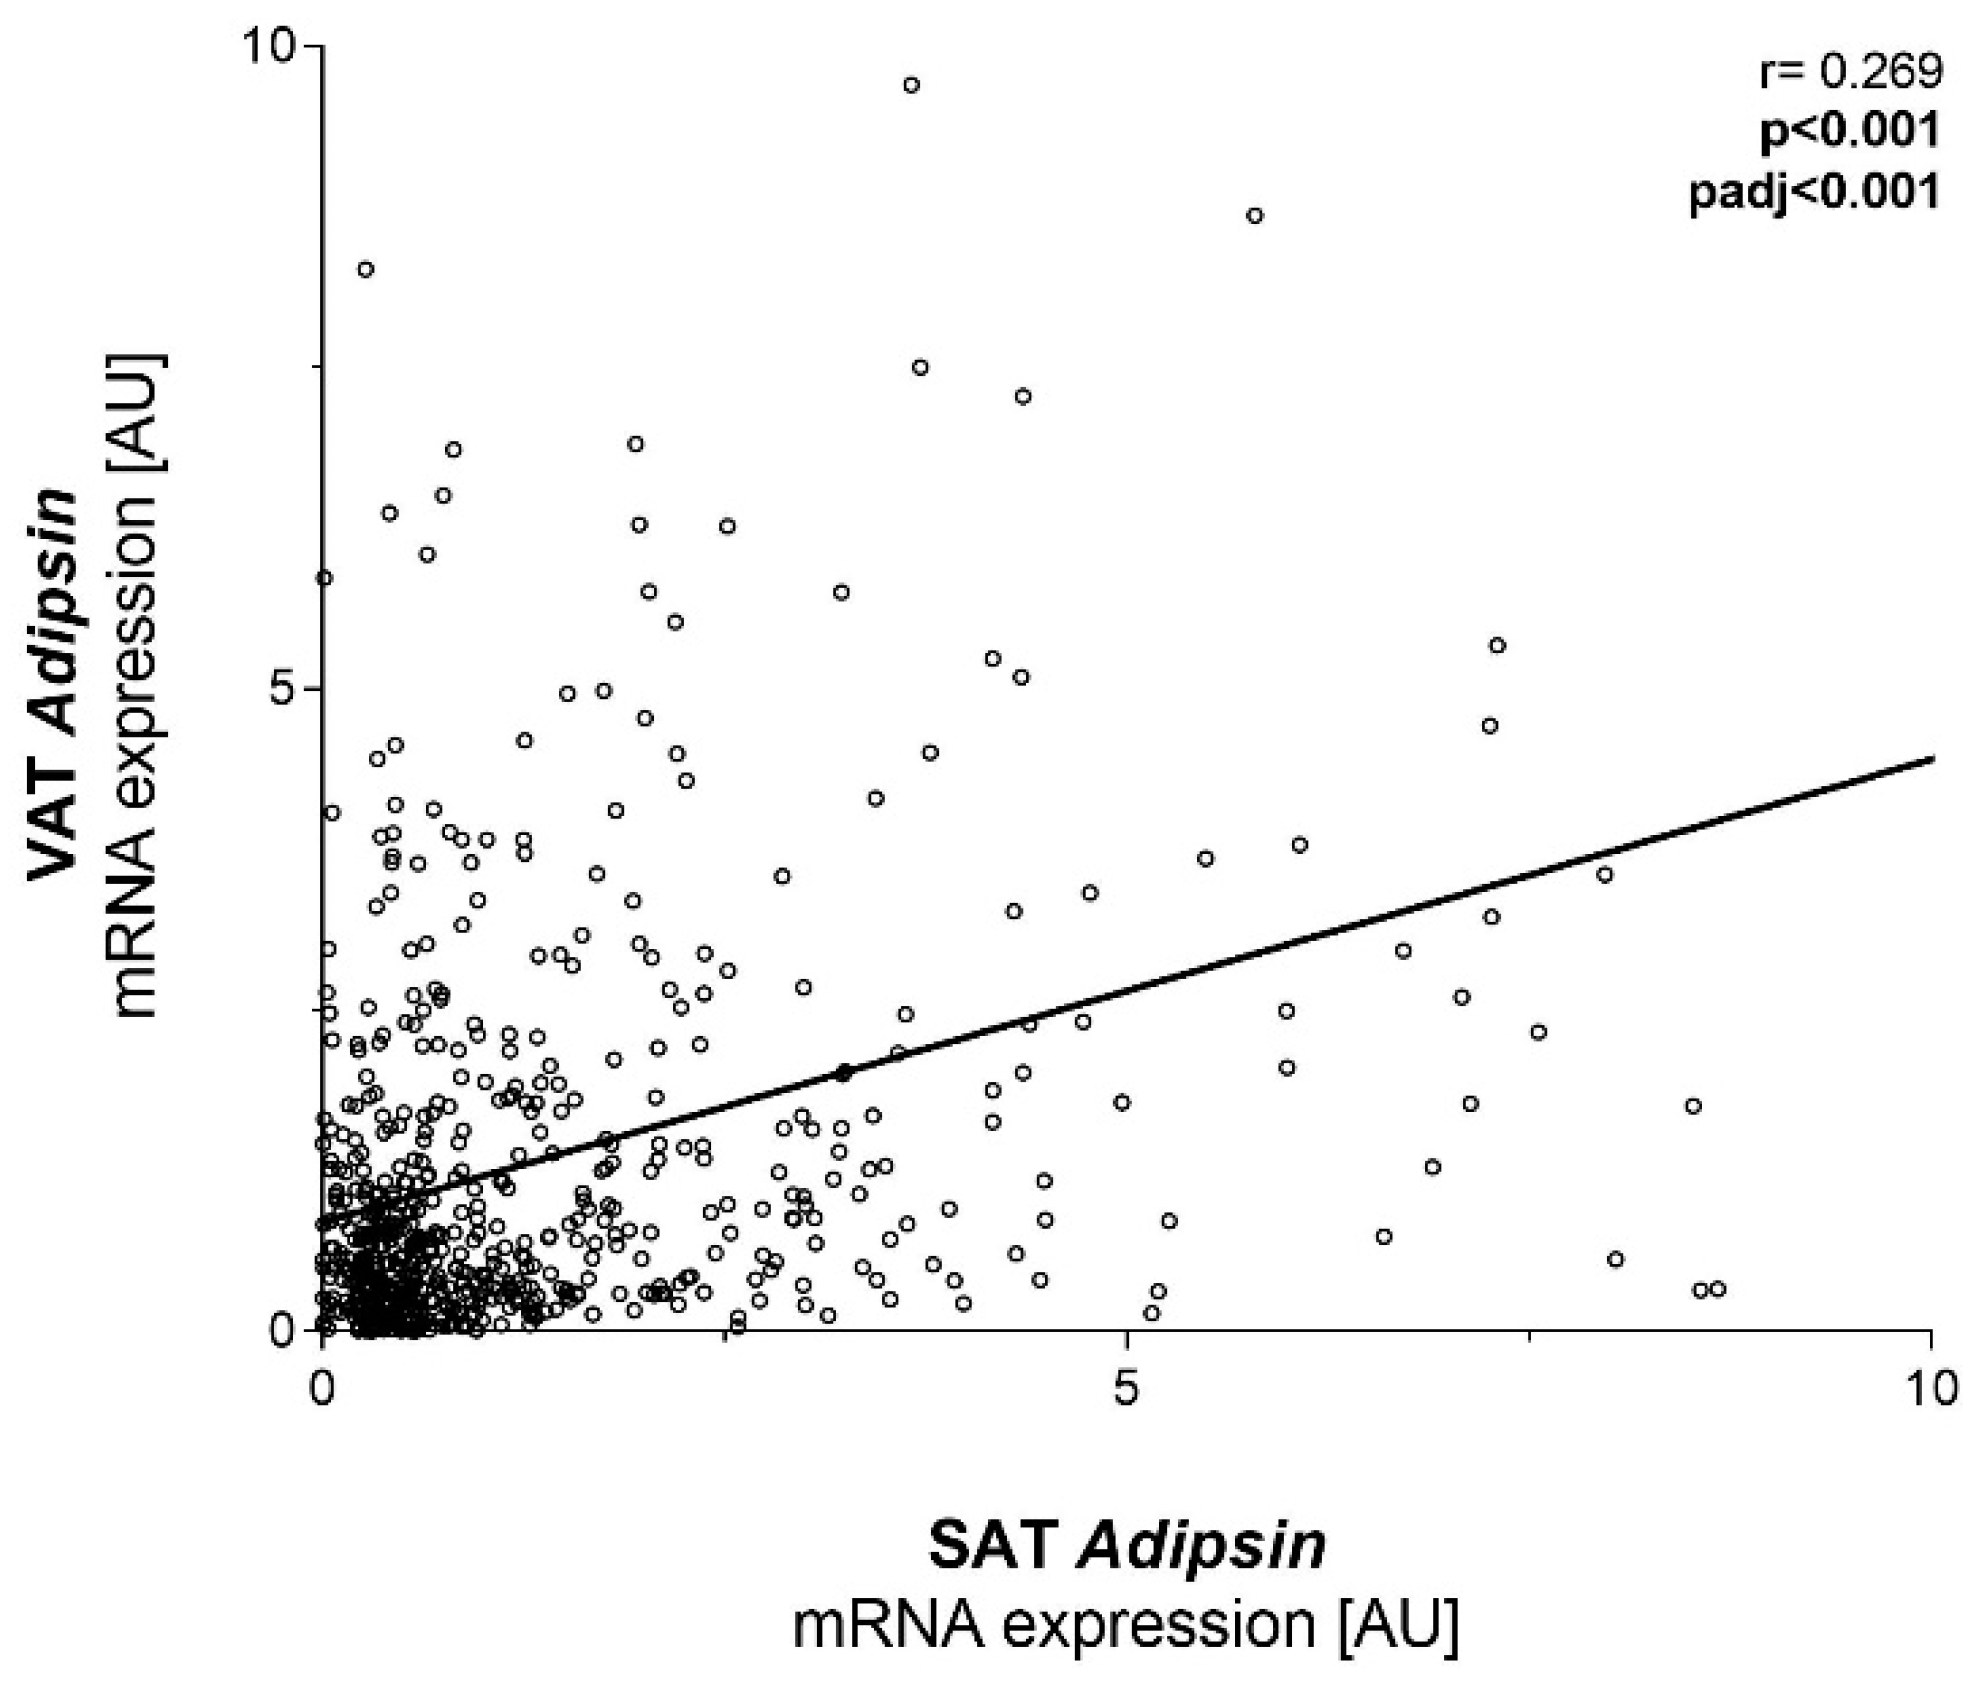
2.1. Adipsin mRNA Is Higher in SAT Compared to VAT but Not Related to Obesity and T2D

Analysis of 607 paired AT samples showed significantly higher adipsin mRNA expression in SAT compared to VAT (Figure 1A), regardless of the degree of obesity or T2D status (Figure 1). The results showed a trend towards increased expression of VAT adipsin mRNA according to the degree of obesity (Figure 1C) and to the diabetes status (Figure 1D). There was no significant difference between women and men in adipsin gene expression in both fat depots (Figure 1B).
We performed additional analyses in subgroups of individuals with a BMI < 30 kg/m2 (n = 21), individuals with a BMI between 30 and 40 kg/m2 (n = 48) and patients with a BMI > 40 kg/m2 (n = 538). SAT and VAT adipsin mRNA expressions were not significantly different between these BMI subgroups (Figure 1C).
We further stratified study participants according to glucose tolerance and T2D status. SAT and VAT adipsin mRNA expressions were not significantly different across participants with normal or impaired glucose tolerance and T2D (Figure 1D). Linear regression analysis revealed a significant positive relationship between SAT and VAT adipsin mRNA expression, even after adjustment for BMI, sex and age (Figure 2). SAT adipsin mRNA expression significantly correlated with the waist-to-hip ratio (WHR) and remained significant even after respective adjustment. VAT adipsin mRNA expression significantly correlated with serum leptin concentrations adjusted for age, sex and BMI (Table 1). VAT adipsin mRNA expression significantly correlated with circulating adipsin levels in the univariate regression analysis, but this association did not withstand adjustment for age, sex and BMI (Figure 3). Moreover, we did not observe a significant association between SAT adipsin expression and serum adipsin concentrations (Figure 3).

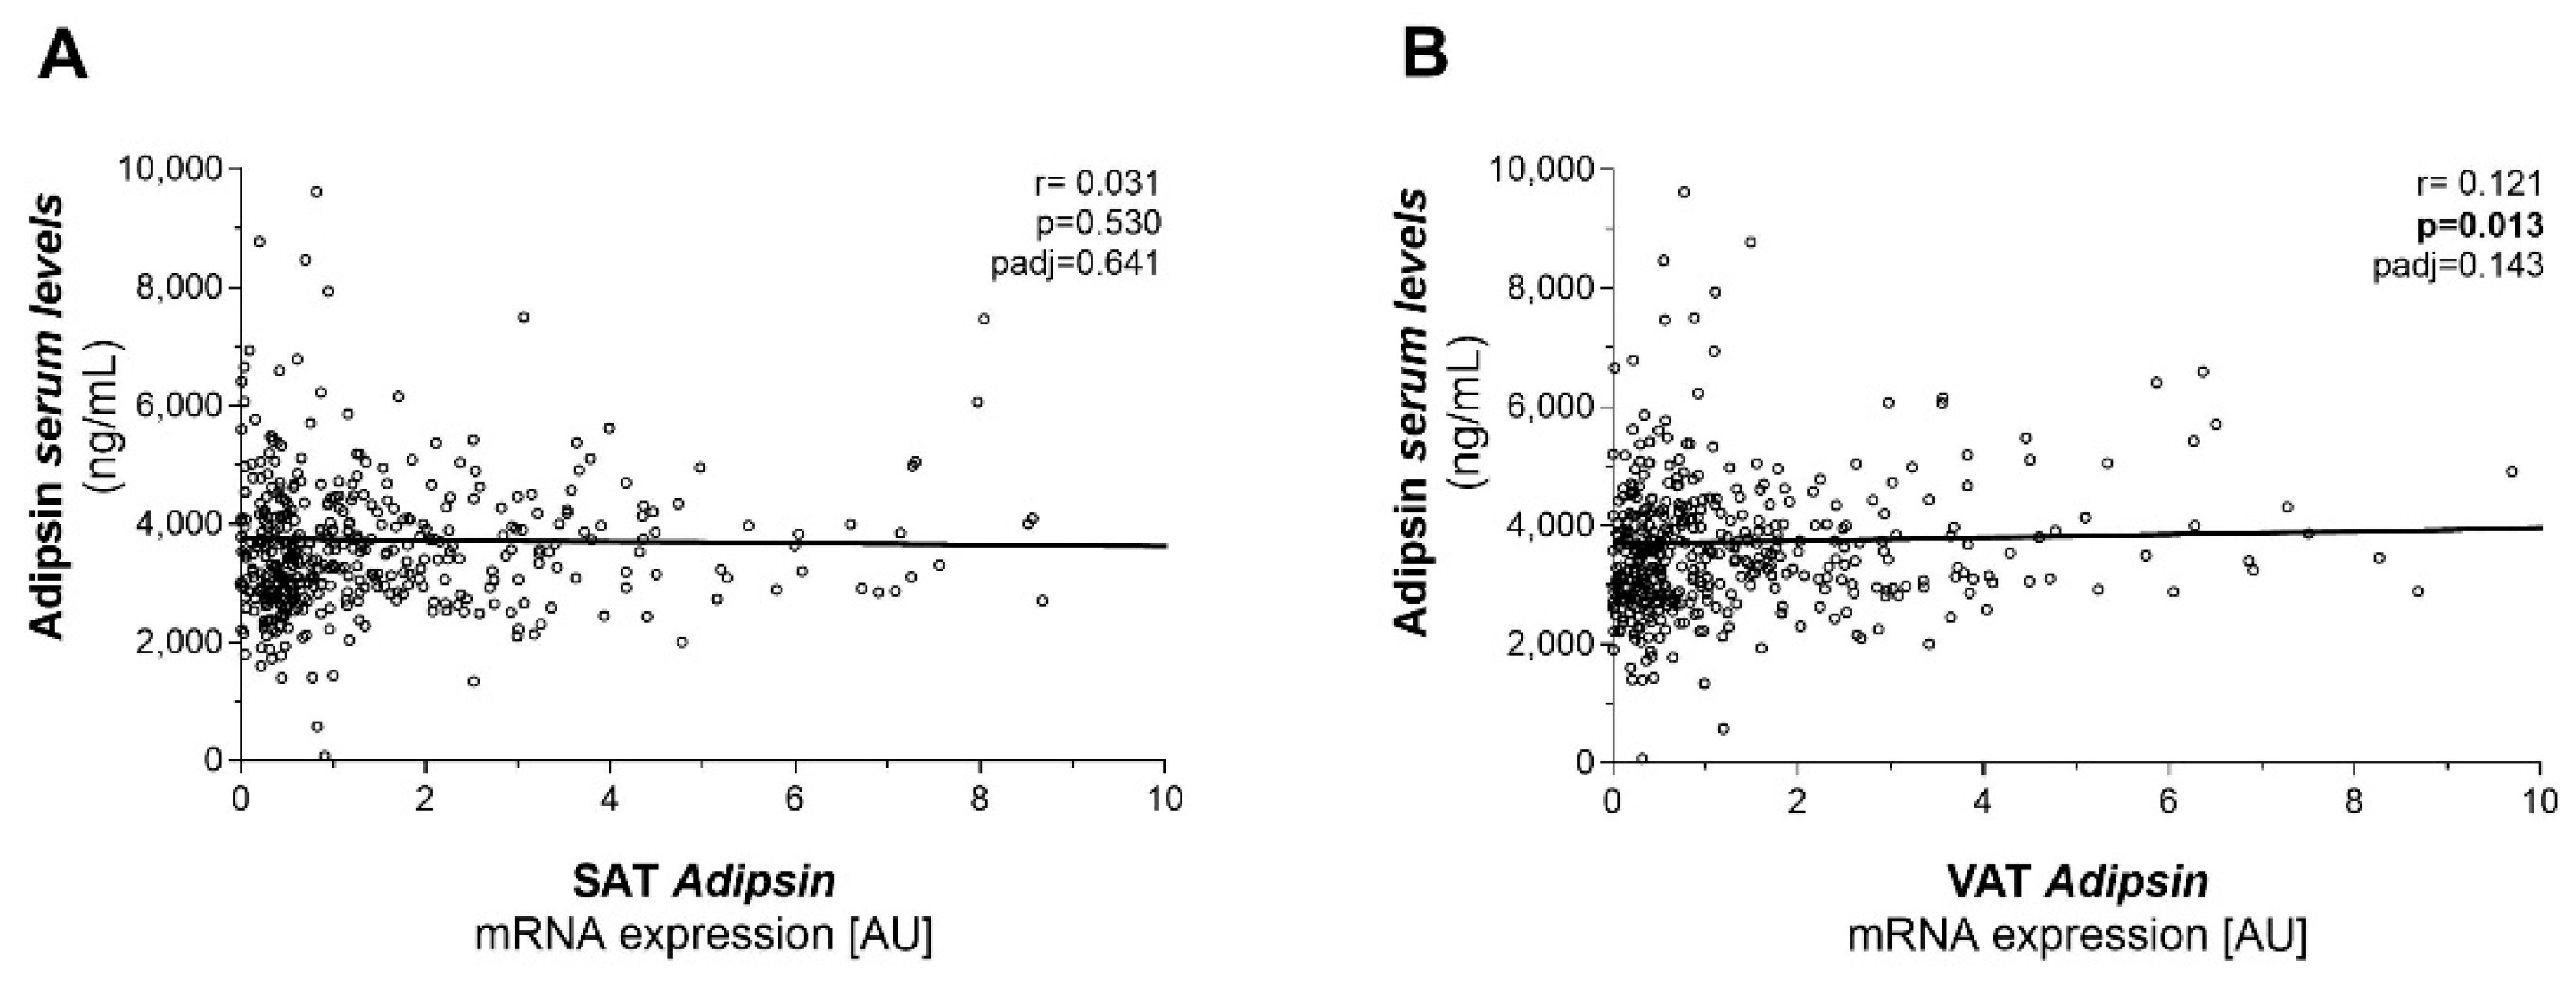
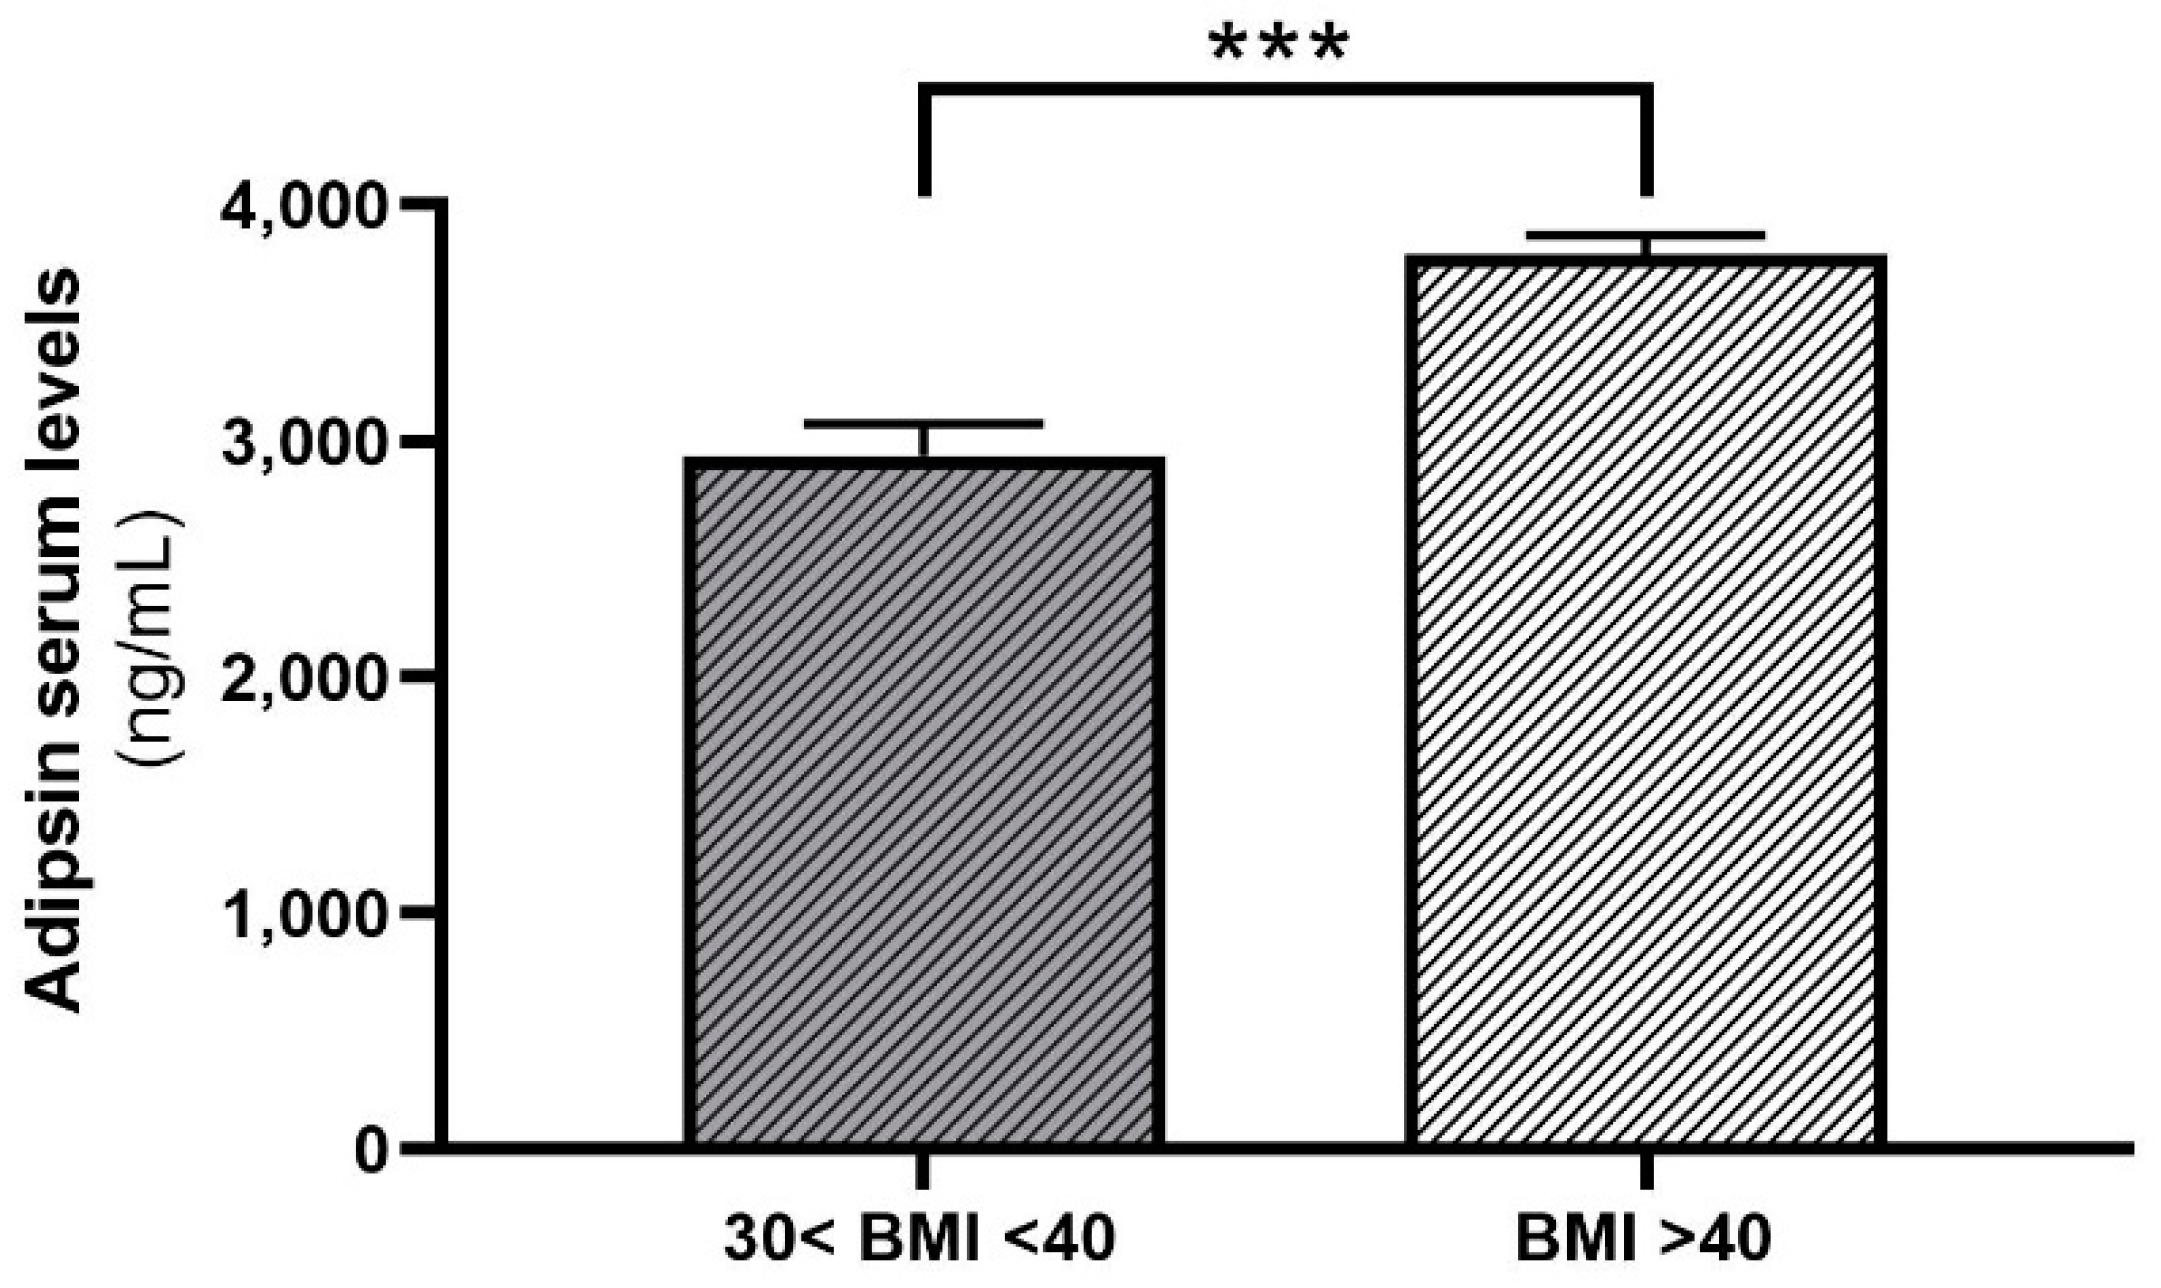
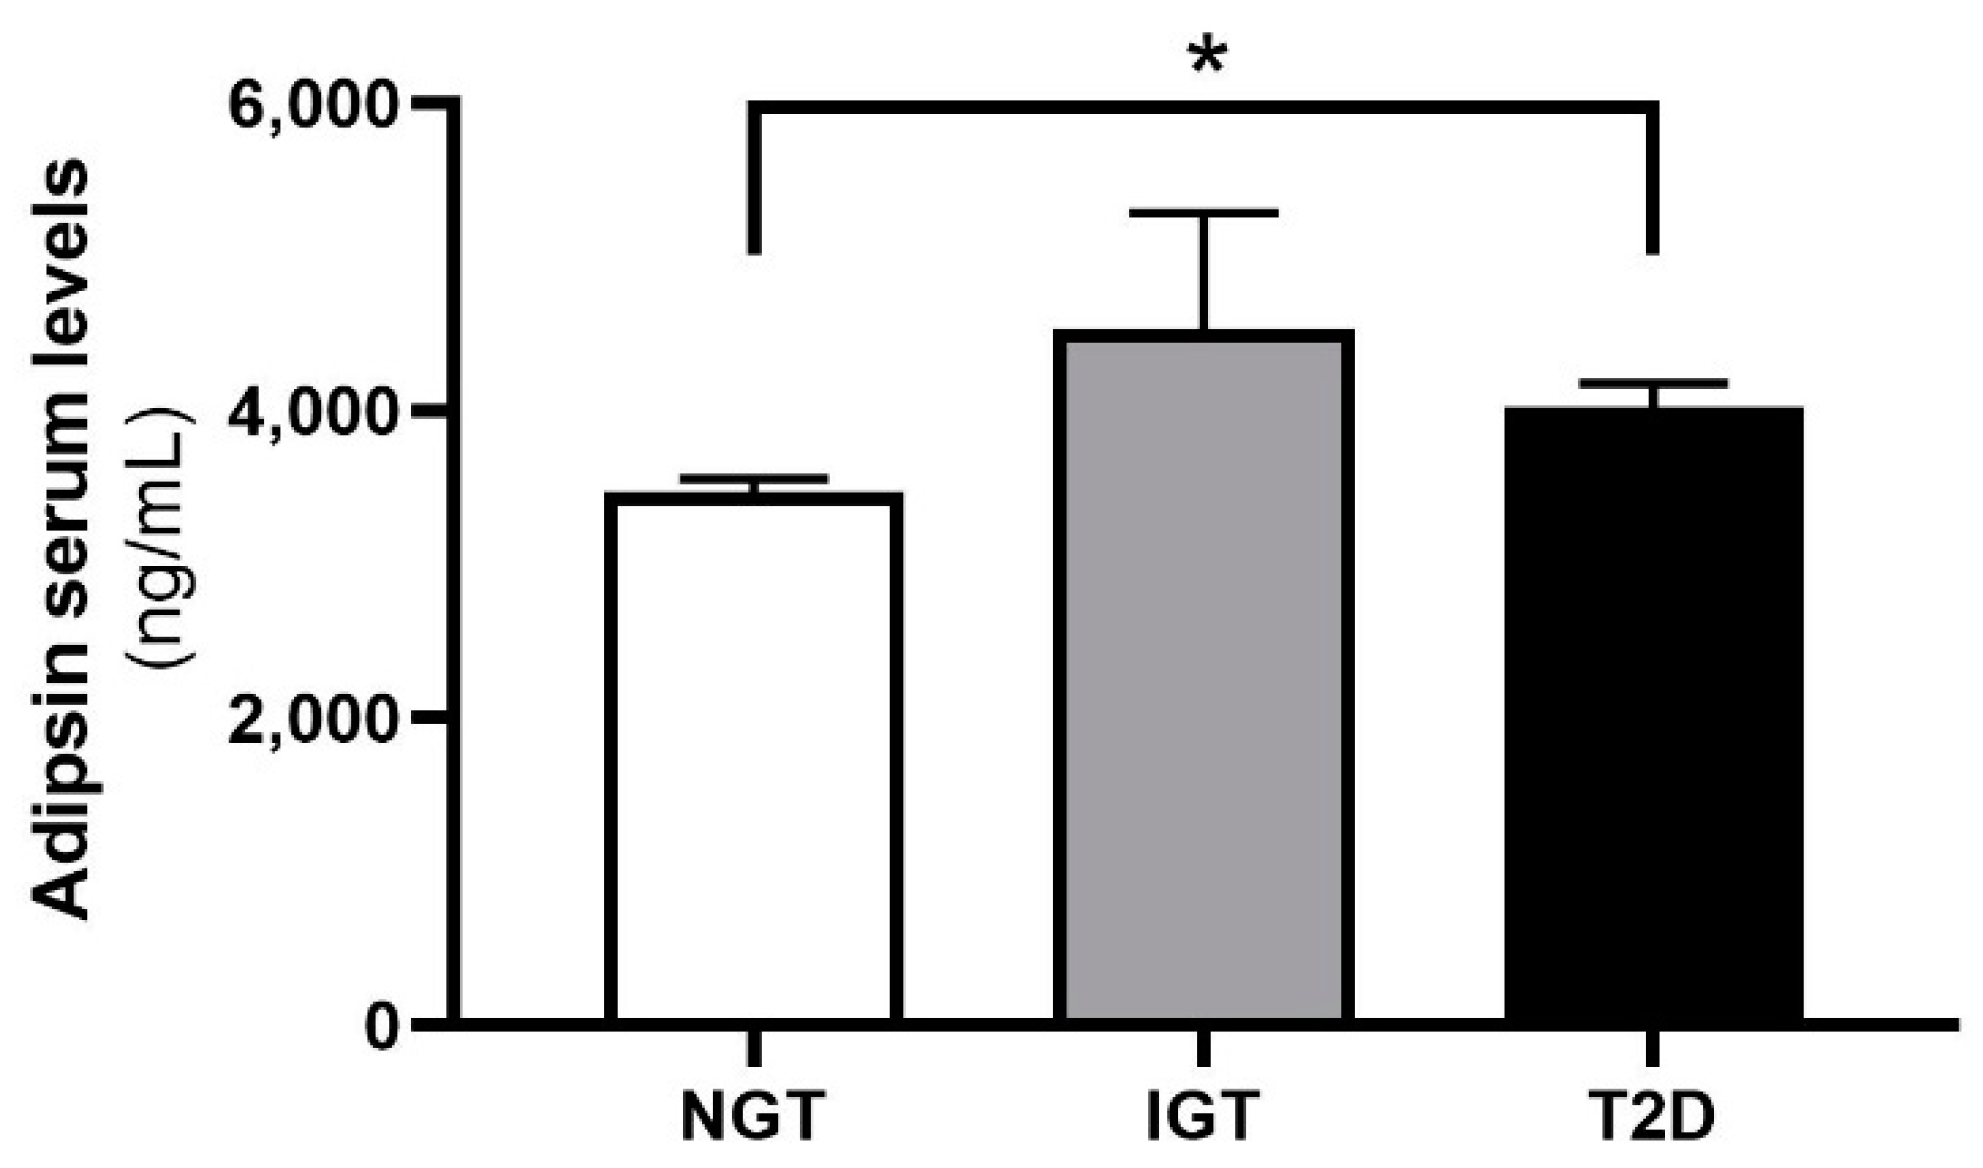
2.2. Adipsin Serum Concentrations Are Higher in Patients with Obesity and T2D

Adipsin serum concentrations were not different between women and men (p = 0.549). Patients with a BMI > 40 kg/m2 had significantly higher adipsin serum concentrations compared to patients in the BMI range between 30 and 40 kg/m2 (Figure 4). Importantly, we found significant positive relationships between adipsin serum concentrations, body weight, BMI and leptin serum concentrations (Table 1).
Adipsin serum concentration was significantly higher in patients with T2D compared to normoglycemic controls (Figure 5). There was no significant difference in circulating adipsin levels between patients with T2D and impaired glucose tolerance (Figure 5). Furthermore, we stratified patients with T2D for whom we had information on their diabetic complications, such as nephropathy and retinopathy, among others, according to the presence of one or more diabetic complications (Subjects with T2D but without diabetic complications, n = 75; subjects with T2D and one or more diabetic complications, n = 57). However, adipsin serum concentrations were not statistically different between groups of T2D patients with or without diabetic complications (p = 0.965). Furthermore, adipsin serum levels significantly correlated with age and fasting plasma glucose (FPG) (Table 1). However, the correlation of serum adipsin with FPG did not remain significant after adjustment for sex, age and BMI (Table 1).

3. Discussion

Adipsin has been suggested to play a role in the development of obesity and its comorbidities [17,21,22,23]. Circulating adipsin has been shown to decline in several animal models for obesity and diabetes [25]. Moreover, rodent studies demonstrated that adipsin treatment has beneficial effects on insulin secretion and glucose parameters [20,21]. Circulating adipsin has been proposed to predict ß-cell failure in a subgroup of patients with T2D [20]. On the other hand, human studies found positive correlations between adipsin serum concentrations and BMI [21,26]. Interestingly, increased adipsin serum concentrations seem to be associated with acquired syndromic partial lipodystrophy [27].
A mechanistic role of adipsin in the development of obesity and T2D could be related to its function in regulating factors of the complement system, most importantly C3 [28,29,30]. C3a, which is part of the complement system, is released by the upstream catalytic action of adipsin and may then stimulate insulin synthesis in pancreatic ß-cells under hyperglycemic conditions [20]. Indeed, deficiency or antagonism of the C3a receptor 1 protects mice against obesity, reduces AT inflammation and improves systemic insulin sensitivity [29,30]. In this context, obesity-associated AT inflammation could be aggravated by complement activation and subsequent infiltration of immune cells into AT [31]. Consequently, adipsin may play a role in the pathogenesis of human obesity and its comorbidities including T2D. We therefore tested the hypothesis that AT adipsin mRNA expression and adipsin serum concentrations are related to parameters of obesity, glucose metabolism and AT distribution.
In the context of a cross-sectional study including 637 individuals with a wide range of body weight and metabolic parameters, we analyzed relationships between adipsin serum concentrations and/or adipsin mRNA expression in visceral and subcutaneous AT with body weight, anthropometric and metabolic traits. Our approach extends previous human adipsin studies [15,17,20,21,22] by providing parallel data on circulating adipsin and adipsin gene expression from two abdominal fat depots.
As main findings, our analyses revealed that adipsin serum concentrations were significantly higher in patients with T2D compared to normoglycemic individuals and that adipsin serum concentrations significantly correlated with age, body weight, BMI, fasting plasma glucose and leptin serum concentrations. AT adipsin mRNA expression did not correlate with adipsin serum concentrations after adjustment for age, sex and BMI. Independent of T2D status, we found significantly higher adipsin expression in SAT compared to VAT. The observed fat depot differences in adipsin expression are in accordance with data from the Genotype-Tissue Expression (GTEx) repository [32] and from a study of 16 men and 16 women with a BMI between 20 and 54 kg/m2 [33]. Given that VAT and SAT adipsin gene expressions are significantly correlated, fat-depot specific differences in the regulation of adipsin expression may be related to intrinsic differences between these depots, including cellular composition rather than a depot-specific regulation of expression. Our findings indicate that adipsin may not be exclusively produced by AT and that, to some extent, it is released from other tissues. GTEx data show increased adipsin expression levels, of course, in SAT and VAT, but also in coronary arteries, tibial nerve and the female breast and vagina in human subjects [32]. Further studies are required to define the contribution of tissues other than AT to circulating adipsin levels.
Higher adipsin gene expression in SAT may reflect lower AT stressors and lower AT immune cell infiltration compared to visceral fat depots [34,35,36] suggesting that adipsin may predict “healthier AT”. In accordance with another study [33], we found a trend towards increased expressions of VAT adipsin mRNA with increasing BMI and T2D. It has been suggested that adipsin may reflect obesity subphenotypes, including metabolically healthy obesity [20]. On the other hand, SAT adipsin gene expression significantly negatively correlated with WHR, suggesting that adipsin expression either reflects fat distribution or may contribute to the regulation of regional body fat accumulation. Supporting this hypothesis and recent data from other groups [37,38,39], we also found that patients with obesity and T2D have significantly higher circulating adipsin compared to normoglycemic individuals in the same BMI range. However, these differences were not reflected in differences in adipsin AT expression among patients with obesity discordant for the T2D status. Studies that excluded patients with morbid obesity (including only BMI < 40 kg/m2) did not find differences in circulating adipsin between patients with T2D and controls [40,41].
We found a positive correlation between adipsin serum concentrations and VAT adipsin expression. However, this correlation did not remain significant after adjustment for potential confounding factors age, sex and BMI. Although visceral fat depot is characterized by lower adipsin expression compared to SAT, it could contribute to higher adipsin serum concentrations observed in patients with T2D, thereby further linking visceral fat distribution to metabolic alterations of obesity. Our study design did not allow drawing conclusions about a mechanistic role of adipsin in the link between obesity, VAT dysfunction and the development of impaired glucose metabolism. Future studies are needed to gain further knowledge about the role of adipsin in the development of obesity and T2D.
Linear regression analyses further revealed a positive relationship between serum adipsin levels and age, which remained significant after adjustment for sex and BMI. Our results are in contrast to data from a Chinese study that did not find associations between age and circulating adipsin [40]. However, we confirm data from other studies [37,42,43] that adipsin serum levels are not significantly different between men and women. In addition, our results showed that adipsin in SAT and VAT was not differently expressed in women and men.
Our data confirm previous studies in smaller cohorts [21,25,26,44,45,46] that adipsin serum concentration positively correlates with body weight and BMI. The association between adipsin and BMI has been attributed to effects of increased fat mass [45], however, univariate regression analyses did not identify body fat mass as a significant correlate of circulating adipsin. On the other hand, leptin—another correlate of body fat mass—positively correlated with adipsin, suggesting that our analyses of body fat associations may lack statistical power due to a lower number of individuals for whom body composition measurements were available.
Our results are also consistent with the assumptions by Lo et al., who found increased adipsin levels in the early stages of the metabolic syndrome, which are attributed to the increased amount of AT in obesity to compensate for the decreased adipsin synthesis per AT unit [20]. Furthermore, we found a significantly positive relationship between adipsin serum levels and fasting plasma glucose, at least in unadjusted univariate correlation analyses. The fact that statistical significance of the relationship between adipsin and FPG was lost after adjusting for age and BMI suggests that these confounding factors are stronger determinants of adipsin serum concentrations. Previously reported inverse correlations between adipsin and FPG [21,40,41] may be explained by differences between these cohorts and ours with regard to the duration of hyperglycemia and other indices of the metabolic status [20]. Lo et al. suggest that higher adipsin synthesis reflects early stages of T2D and plays a compensatory role in the organisms attempt to normalize glucose and lipid metabolism [20]. During T2D progression, adipsin levels might decrease in the context of AT dysfunction and, eventually, ß-cell failure may develop [20]. In this context, Lo et al. found decreased circulating adipsin levels in patients with T2D and ß-cell failure compared to patients with T2D and preserved ß-cell function [20]. Our findings do not support previous reports suggesting that adipsin serum concentrations are lower in animal models for diabetes and people with T2D [20,21,40,47,48]. Low circulating adipsin seems to be particularly associated with ß-cell failure in patients with T2D [20,21,40]. We found higher adipsin serum concentrations in patients with impaired glucose tolerance (IGT), a prediabetic state. These data suggest that patients with T2D included into our analyses may be characterized by a preserved or at least better ß-cell function compared to the patients with T2D included into previous studies [20,21,40]. Indeed, higher adipsin serum concentrations in people with IGT support the hypothesis that increased circulating adipsin may reflect an intrinsic mechanism of the organism to compensate for impaired insulin secretion. Longitudinal studies over the entire range from prediabetes to advanced T2D stages are required to test this hypothesis in the future. Taken altogether, adipsin might become clinically relevant as a future target to improve ß-cell function in patients with T2D. The manipulation of adipsin as a molecular switch to improve insulin secretion has been suggested to further study in the context of treating ß-cell failure in T2D [20].
In our study, we included T2D patients with concomitant medication including metformin, DPP-4 and SGLT-2 inhibitors or GLP-1 receptor agonists. We can, therefore, not exclude that specific anti-diabetic medication may affect adipsin serum concentrations. In this context, Taşdemir et al. reported that diabetic rats treated with metformin have increased plasma adipsin levels compared to untreated diabetic rats [49]. Moreover, we investigated whether adipsin serum concentrations reflect T2D complications such as cardiovascular disease, retinopathy or nephropathy. In this context and against the hypothesis that circulating adipsin may decline with more advanced stages of T2D, we did not find differences in circulating adipsin between subgroups of T2D patients with or without secondary diabetes complications.
Our study has some limitations. First, we predominantly included patients undergoing bariatric surgery with a BMI > 40 kg/m2. This high body weight bias needs to be acknowledged. Therefore, our results may not reflect associations between adipsin and metabolic traits in the lower BMI range. In addition, we cannot exclude effects of concomitant medications such as antidiabetic, antihypertensive medications, statins or pain killers, although there was no statistical evidence for an interference between adipsin measurements and specific pharmacotherapies. Although serum samples were taken immediately prior to surgery, the pre-operative fasting period may differentially influence adipsin AT expression and adipsin serum concentrations. Moreover, despite adipsin being released from AT and thereforeis considered an adipokine, its role as complement factor D and alternative pathway convertase cofactor in the cleavage of C3 is functionally relevant [16,18]. Therefore, data on complement levels such as total C3 levels would have further extended our general view on presented data. Since we are not able to provide data on complement factor serum concentrations, we have to acknowledge the lack of data on the complement factor status of our study participants as a limitation.
In conclusion, our data suggest that adipsin serum concentrations are strongly related to obesity and age. However, neither circulating adipsin nor adipsin AT expression reflects the parameters of impaired glucose or lipid metabolism in patients with obesity with or without T2D.

4. Materials and Methods

4.1. Subjects

We included 637 metabolically well-characterized participants of the Leipzig Obesity BioBank recruited at four bariatric surgery centers in Leipzig, Karlsruhe, Dresden and Gera (all in Germany) (Table 2). All subjects underwent clinical phenotyping as described previously [7,50,51]. All subjects had a stable weight, defined as no fluctuations of > 2% of body weight for at least 3 months before surgery. According to American Diabetes Association (ADA) criteria [52], 248 study participants (~39%) were diagnosed with T2D. We defined the following exclusion criteria: (i) thyroid dysfunction, (ii) alcohol or drug abuse, (iii) pregnancy and (iv) treatment with thiazolidinediones. The study was approved by the ethics committee of the University of Leipzig (Approval numbers: 159-12-21052012 and 017-12-23012012). The study design follows the Declaration of Helsinki and all participants gave written informed consent prior to participation.

4.2. Measurement of Adipsin Serum Concentrations

Adipsin serum concentrations were analyzed in duplicate using enzyme-linked immunosorbent assay (ELISA) according to the manufacturer’s instructions (Quantikine® ELISA Human Complement Factor D, R&D Systems, Minneapolis, MN, USA) in 455 patients. The age from these subjects ranged from 18 to 76 years and body mass index (BMI) from 30 to 70 kg/m2. Adipsin assay sensitivity was 0.025 pg/mL and inter-assay and intra-assay coefficients of variation were less than 9% and 6.4%, respectively.

4.3. Adipsin mRNA Expression Analysis in AT

Paired samples of abdominal omental AT (visceral, VAT) and subcutaneous AT (SAT) were obtained from 607 Caucasian men (n = 163) and women (n = 444) (Table 2), who underwent open abdominal surgery as described previously [50,51]. The age ranged from 18 to 85 years and body mass index (BMI) from 19 to 70 kg/m2 (Table 2). AT was immediately frozen in liquid nitrogen and stored at −80 °C. RNA was extracted from AT by using the RNeasy Lipid Tissue Mini Kit (Qiagen, Hilden, Germany), and qPCR was performed as described elsewhere [53,54]. Real-time quantitative PCR was performed with the TaqMan Assay predesigned by Applied Biosystems (Foster City, CA, USA) for the detection of human adipsin (Hs00157263_m1) and glyceraldehyde 3-phosphate dehydrogenase (GAPDH) (Hs 02786624_g1) mRNA expression in AT. All reactions were carried out in 96-well plates using the QuantStudio (TM) 6 Flex System Fast Real-Time PCR system. Adipsin mRNA expression was calculated relative to GAPDH mRNA expression.

4.4. Statistical Analyses

Prior to statistical analysis, non-normally distributed parameters were logarithmically (ln) transformed to approximate a normal distribution. Results are expressed as mean ± SD (standard deviation). Multivariate linear relationships between adipsin mRNA expression and phenotypic traits were assessed by generalized linear regression models. Differences in adipsin mRNA expression between visceral and subcutaneous AT were assessed using the paired Student’s t-test or one-way ANOVA. Statistical analyses were performed using SPSS/PC+ for Windows statistical package (Version 25.0; SPSS, Chicago, IL, USA).

Author Contributions

Conceptualization, E.G.-J. and M.B.; methodology, M.M. and E.G.-J.; investigation, M.M., Y.M., M.K., C.S., A.D., M.R.S., D.G., T.L., M.D. and E.G.-J.; formal analysis, M.M. and E.G.-J.; resources, Y.M., C.S., A.D., M.R.S., D.G., T.L., M.D., M.S. and M.B.; writing—original draft preparation, M.M., M.B. and E.G.-J.; writing—review and editing, M.M., Y.M., M.K., C.S., A.D., M.R.S., D.G., T.L., M.D., P.K., M.S., M.B. and E.G.-J.; supervision, M.B. and E.G.-J.; funding acquisition, M.B. All authors have read and agreed to the published version of the manuscript.

Funding

This work was funded by the Deutsche Forschungsgemeinschaft: Collaborative Research Center SFB1052, project B1 (to M.B.), B3 (to P.K.), and the German Center for Diabetes Research (DZD), (Grant: 82DZD00601).

Institutional Review Board Statement

The study was conducted in accordance with the Declaration of Helsinki, and approved by the Institutional Review Board (or Ethics Committee) of the University of Leipzig (Approval numbers: 159-12-21052012 (May 2012) and 017-12-23012012 (January 2012)).

Informed Consent Statement

Informed consent was obtained from all subjects involved in the study. Written informed consent has been obtained from the patient(s) to publish this paper.

Data Availability Statement

Not applicable.

Acknowledgments

The authors would like to thank all study participants, Daniela Kern and Susan Berthold for technical assistance.

Conflicts of Interest

M.B. received honoraria as a consultant and speaker from Amgen, AstraZeneca, Bayer, Boehringer-Ingelheim, Lilly, Novo Nordisk, Novartis and Sanofi. All other authors declare no conflict of interest.

References

  1. World Health Organization. Obesity and Overweight. Available online: https://www.who.int/news-room/fact-sheets/detail/obesity-and-overweight (accessed on 15 June 2021).
  2. Blüher, M. Obesity: Global epidemiology and pathogenesis. Nat. Rev. Endocrinol. 2019, 15, 288–298. [Google Scholar] [CrossRef] [PubMed]
  3. NCD Risk Factor Collaboration (NCD-RisC). Worldwide trends in body-mass index, underweight, overweight, and obesity from 1975 to 2016: A pooled analysis of 2416 population-based measurement studies in 128·9 million children, adolescents, and adults. Lancet 2017, 390, 2627–2642. [Google Scholar] [CrossRef] [Green Version]
  4. van Gaal, L.F.; Mertens, I.L.; de Block, C.E. Mechanisms linking obesity with cardiovascular disease. Nature 2006, 444, 875–880. [Google Scholar] [CrossRef] [PubMed]
  5. Afshin, A.; Forouzanfar, M.H.; Reitsma, M.B.; Sur, P.; Estep, K.; Lee, A.; Marczak, L.; Mokdad, A.H.; Moradi-Lakeh, M.; Naghavi, M.; et al. Health Effects of Overweight and Obesity in 195 Countries over 25 Years. N. Engl. J. Med. 2017, 377, 13–27. [Google Scholar] [CrossRef] [PubMed]
  6. Klöting, N.; Blüher, M. Adipocyte dysfunction, inflammation and metabolic syndrome. Rev. Endocr. Metab. Disord. 2014, 15, 277–287. [Google Scholar] [CrossRef] [PubMed]
  7. Klöting, N.; Fasshauer, M.; Dietrich, A.; Kovacs, P.; Schön, M.R.; Kern, M.; Stumvoll, M.; Blüher, M. Insulin-sensitive obesity. Am. J. Physiol. Endocrinol. Metab. 2010, 299, E506–E515. [Google Scholar] [CrossRef]
  8. Ye, R.Z.; Richard, G.; Gévry, N.; Tchernof, A.; Carpentier, A.C. Fat Cell Size: Measurement Methods, Pathophysiological Origins, and Relationships with Metabolic Dysregulations. Endocr. Rev. 2021, 43, 35–60. [Google Scholar] [CrossRef]
  9. Rutkowski, J.M.; Stern, J.H.; Scherer, P.E. The cell biology of fat expansion. J. Cell Biol. 2015, 208, 501–512. [Google Scholar] [CrossRef] [Green Version]
  10. Schleinitz, D.; Böttcher, Y.; Blüher, M.; Kovacs, P. The genetics of fat distribution. Diabetologia 2014, 57, 1276–1286. [Google Scholar] [CrossRef]
  11. Zhao, S.; Kusminski, C.M.; Scherer, P.E. Adiponectin, Leptin and Cardiovascular Disorders. Circ. Res. 2021, 128, 136–149. [Google Scholar] [CrossRef]
  12. Scherer, P.E. The many secret lives of adipocytes: Implications for diabetes. Diabetologia 2019, 62, 223–232. [Google Scholar] [CrossRef] [PubMed] [Green Version]
  13. Dahlman, I.; Elsen, M.; Tennagels, N.; Korn, M.; Brockmann, B.; Sell, H.; Eckel, J.; Arner, P. Functional annotation of the human fat cell secretome. Arch. Physiol. Biochem. 2012, 118, 84–91. [Google Scholar] [CrossRef] [PubMed]
  14. Blüher, M. Adipokines-removing road blocks to obesity and diabetes therapy. Mol. Metab. 2014, 3, 230–240. [Google Scholar] [CrossRef] [PubMed]
  15. Cook, K.S.; Min, H.Y.; Johnson, D.; Chaplinsky, R.J.; Flier, J.S.; Hunt, C.R.; Spiegelman, B.M. Adipsin: A circulating serine protease homolog secreted by adipose tissue and sciatic nerve. Science 1987, 237, 402–405. [Google Scholar] [CrossRef] [PubMed]
  16. Rosen, B.S.; Cook, K.S.; Yaglom, J.; Groves, D.L.; Volanakis, J.E.; Damm, D.; White, T.; Spiegelman, B.M. Adipsin and complement factor D activity: An immune-related defect in obesity. Science 1989, 244, 1483–1487. [Google Scholar] [CrossRef]
  17. White, R.T.; Damm, D.; Hancock, N.; Rosen, B.S.; Lowell, B.B.; Usher, P.; Flier, J.S.; Spiegelman, B.M. Human adipsin is identical to complement factor D and is expressed at high levels in adipose tissue. J. Biol. Chem. 1992, 267, 9210–9213. [Google Scholar] [CrossRef]
  18. Xu, Y.; Ma, M.; Ippolito, G.C.; Schroeder, H.W.; Carroll, M.C.; Volanakis, J.E. Complement activation in factor D-deficient mice. Proc. Natl. Acad. Sci. USA 2001, 98, 14577–14582. [Google Scholar] [CrossRef] [Green Version]
  19. Ansorge, S.; Täger, M. Immunologie. In Löffler/Petrides Biochemie und Pathobiochemie; Heinrich, P.C., Müller, M., Graeve, L., Eds.; Springer: Berlin/Heidelberg, Germany, 2014; pp. 893–930. ISBN 978-3-642-17971-6. [Google Scholar]
  20. Lo, J.C.; Ljubicic, S.; Leibiger, B.; Kern, M.; Leibiger, I.B.; Moede, T.; Kelly, M.E.; Chatterjee Bhowmick, D.; Murano, I.; Cohen, P.; et al. Adipsin is an adipokine that improves β cell function in diabetes. Cell 2014, 158, 41–53. [Google Scholar] [CrossRef] [Green Version]
  21. Gómez-Banoy, N.; Guseh, J.S.; Li, G.; Rubio-Navarro, A.; Chen, T.; Poirier, B.; Putzel, G.; Rosselot, C.; Pabón, M.A.; Camporez, J.P.; et al. Adipsin preserves beta cells in diabetic mice and associates with protection from type 2 diabetes in humans. Nat. Med. 2019, 25, 1739–1747. [Google Scholar] [CrossRef]
  22. Napolitano, A.; Lowell, B.B.; Damm, D.; Leibel, R.L.; Ravussin, E.; Jimerson, D.C.; Lesem, M.D.; van Dyke, D.C.; Daly, P.A.; Chatis, P. Concentrations of adipsin in blood and rates of adipsin secretion by adipose tissue in humans with normal, elevated and diminished adipose tissue mass. Int. J. Obes. Relat. Metab. Disord. 1994, 18, 213–218. [Google Scholar]
  23. Pomeroy, C.; Mitchell, J.; Eckert, E.; Raymond, N.; Crosby, R.; Dalmasso, A.P. Effect of body weight and caloric restriction on serum complement proteins, including Factor D/adipsin: Studies in anorexia nervosa and obesity. Clin. Exp. Immunol. 1997, 108, 507–515. [Google Scholar] [CrossRef] [PubMed]
  24. Litvinova, L.S.; Vasilenko, M.A.; Zatolokin, P.A.; Aksenova, N.N.; Fattakhov, N.S.; Vaysbeyn, I.Z.; Mironyuk, N.I.; Kirienkova, E.V. Adipokines in metabolic processes regulating during obesity treatment. Diabetes Mellit. 2014, 17, 51–59. [Google Scholar] [CrossRef] [Green Version]
  25. Flier, J.S.; Cook, K.S.; Usher, P.; Spiegelman, B.M. Severely impaired adipsin expression in genetic and acquired obesity. Science 1987, 237, 405–408. [Google Scholar] [CrossRef] [PubMed]
  26. Vasilenko, M.A.; Kirienkova, E.V.; Skuratovskaia, D.A.; Zatolokin, P.A.; Mironyuk, N.I.; Litvinova, L.S. The role of production of adipsin and leptin in the development of insulin resistance in patients with abdominal obesity. Dokl. Biochem. Biophys. 2017, 475, 271–276. [Google Scholar] [CrossRef] [PubMed]
  27. Corvillo, F.; González-Sánchez, L.; López-Lera, A.; Arjona, E.; Ceccarini, G.; Santini, F.; Araújo-Vilar, D.; Brown, R.J.; Villarroya, J.; Villarroya, F.; et al. Complement Factor D (adipsin) Levels Are Elevated in Acquired Partial Lipodystrophy (Barraquer-Simons syndrome). Int. J. Mol. Sci. 2021, 22, 6608. [Google Scholar] [CrossRef] [PubMed]
  28. Ricklin, D.; Hajishengallis, G.; Yang, K.; Lambris, J.D. Complement: A key system for immune surveillance and homeostasis. Nat. Immunol. 2010, 11, 785–797. [Google Scholar] [CrossRef] [Green Version]
  29. Lim, J.; Iyer, A.; Suen, J.Y.; Seow, V.; Reid, R.C.; Brown, L.; Fairlie, D.P. C5aR and C3aR antagonists each inhibit diet-induced obesity, metabolic dysfunction, and adipocyte and macrophage signaling. FASEB J. 2013, 27, 822–831. [Google Scholar] [CrossRef]
  30. Mamane, Y.; Chung Chan, C.; Lavallee, G.; Morin, N.; Xu, L.-J.; Huang, J.; Gordon, R.; Thomas, W.; Lamb, J.; Schadt, E.E.; et al. The C3a anaphylatoxin receptor is a key mediator of insulin resistance and functions by modulating adipose tissue macrophage infiltration and activation. Diabetes 2009, 58, 2006–2017. [Google Scholar] [CrossRef] [Green Version]
  31. Vlaicu, S.I.; Tatomir, A.; Boodhoo, D.; Vesa, S.; Mircea, P.A.; Rus, H. The role of complement system in adipose tissue-related inflammation. Immunol. Res. 2016, 64, 653–664. [Google Scholar] [CrossRef]
  32. GTEx Analysis Release V8. Gene Expression for CFD. Available online: https://www.gtexportal.org/home/gene/CFD (accessed on 27 April 2021).
  33. Xia, Z.; Cianflone, K. Acylation-stimulating protein precursor proteins in adipose tissue in human obesity. Metab. Clin. Exp. 2003, 52, 1360–1366. [Google Scholar] [CrossRef]
  34. Haim, Y.; Blüher, M.; Konrad, D.; Goldstein, N.; Klöting, N.; Harman-Boehm, I.; Kirshtein, B.; Ginsberg, D.; Tarnovscki, T.; Gepner, Y.; et al. ASK1 (MAP3K5) is transcriptionally upregulated by E2F1 in adipose tissue in obesity, molecularly defining a human dys-metabolic obese phenotype. Mol. Metab. 2017, 6, 725–736. [Google Scholar] [CrossRef] [PubMed]
  35. Blüher, M.; Bashan, N.; Shai, I.; Harman-Boehm, I.; Tarnovscki, T.; Avinaoch, E.; Stumvoll, M.; Dietrich, A.; Klöting, N.; Rudich, A. Activated Ask1-MKK4-p38MAPK/JNK stress signaling pathway in human omental fat tissue may link macrophage infiltration to whole-body Insulin sensitivity. J. Clin. Endocrinol. Metab. 2009, 94, 2507–2515. [Google Scholar] [CrossRef] [PubMed] [Green Version]
  36. Bashan, N.; Dorfman, K.; Tarnovscki, T.; Harman-Boehm, I.; Liberty, I.F.; Blüher, M.; Ovadia, S.; Maymon-Zilberstein, T.; Potashnik, R.; Stumvoll, M.; et al. Mitogen-activated protein kinases, inhibitory-kappaB kinase, and insulin signaling in human omental versus subcutaneous adipose tissue in obesity. Endocrinology 2007, 148, 2955–2962. [Google Scholar] [CrossRef] [PubMed] [Green Version]
  37. Klimontov, V.V.; Bulumbaeva, D.M.; Fazullina, O.N.; Lykov, A.P.; Bgatova, N.P.; Orlov, N.B.; Konenkov, V.I.; Pfeiffer, A.F.H.; Pivovarova-Ramich, O.; Rudovich, N. Circulating Wnt1-inducible signaling pathway protein-1 (WISP-1/CCN4) is a novel biomarker of adiposity in subjects with type 2 diabetes. J. Cell Commun. Signal. 2020, 14, 101–109. [Google Scholar] [CrossRef] [PubMed]
  38. Klimontov, V.V.; Bulumbaeva, D.M.; Bgatova, N.P.; Taskaeva, I.S.; Orlov, N.B.; Fazullina, O.N.; Soluyanov, M.Y.; Savchenko, S.V.; Konenkov, V.I. Serum adipokine concentrations in patients with type 2 diabetes: The relationships with distribution, hypertrophy and vascularization of subcutaneous adipose tissue. Diabetes Mellit. 2019, 22, 336–347. [Google Scholar] [CrossRef] [Green Version]
  39. Cox, A.J.; Zhang, P.; Bowden, D.W.; Devereaux, B.; Davoren, P.M.; Cripps, A.W.; West, N.P. Enteroendocrine and adipokine associations with type 2 diabetes: Phenotypic risk scoring approaches. J. Gastroenterol. Hepatol. 2018, 33, 1357–1364. [Google Scholar] [CrossRef] [Green Version]
  40. Zhou, Q.; Ge, Q.; Ding, Y.; Qu, H.; Wei, H.; Wu, R.; Yao, L.; Wei, Q.; Feng, Z.; Long, J.; et al. Relationship between serum adipsin and the first phase of glucose-stimulated insulin secretion in individuals with different glucose tolerance. J. Diabetes Investig. 2018, 9, 1128–1134. [Google Scholar] [CrossRef] [Green Version]
  41. Karajibani, M.; Montazerifar, F.; Sadeghi, M.B.; Keikhaie, M.A.; Dashipour, A. Serum Fetuin-A and Adipsin Levels in Type II Diabetes Patients. Int. J. High Risk Behav. Addict. 2019, 8, e91963. [Google Scholar] [CrossRef] [Green Version]
  42. Labruna, G.; Pasanisi, F.; Nardelli, C.; Caso, R.; Vitale, D.F.; Contaldo, F.; Sacchetti, L. High leptin/adiponectin ratio and serum triglycerides are associated with an “at-risk” phenotype in young severely obese patients. Obes. Silver Spring 2011, 19, 1492–1496. [Google Scholar] [CrossRef] [Green Version]
  43. Martínez-García, M.Á.; Moncayo, S.; Insenser, M.; Álvarez-Blasco, F.; Luque-Ramírez, M.; Escobar-Morreale, H.F. Metabolic Cytokines at Fasting and During Macronutrient Challenges: Influence of Obesity, Female Androgen Excess and Sex. Nutrients 2019, 11, 2566. [Google Scholar] [CrossRef] [Green Version]
  44. Derosa, G.; Fogari, E.; D’Angelo, A.; Bianchi, L.; Bonaventura, A.; Romano, D.; Maffioli, P. Adipocytokine levels in obese and non-obese subjects: An observational study. Inflammation 2013, 36, 914–920. [Google Scholar] [CrossRef] [PubMed]
  45. Wu, X.; Hutson, I.; Akk, A.M.; Mascharak, S.; Pham, C.T.N.; Hourcade, D.E.; Brown, R.; Atkinson, J.P.; Harris, C.A. Contribution of Adipose-Derived Factor D/Adipsin to Complement Alternative Pathway Activation: Lessons from Lipodystrophy. J. Immunol. 2018, 200, 2786–2797. [Google Scholar] [CrossRef] [PubMed] [Green Version]
  46. Gursoy Calan, O.; Calan, M.; Yesil Senses, P.; Unal Kocabas, G.; Ozden, E.; Sari, K.R.; Kocar, M.; Imamoglu, C.; Senses, Y.M.; Bozkaya, G.; et al. Increased adipsin is associated with carotid intima media thickness and metabolic disturbances in polycystic ovary syndrome. Clin. Endocrinol. Oxf. 2016, 85, 910–917. [Google Scholar] [CrossRef] [PubMed]
  47. Wang, J.-S.; Lee, W.-J.; Lee, I.-T.; Lin, S.-Y.; Lee, W.-L.; Liang, K.-W.; Sheu, W.H.-H. Association Between Serum Adipsin Levels and Insulin Resistance in Subjects With Various Degrees of Glucose Intolerance. J. Endocr. Soc. 2019, 3, 403–410. [Google Scholar] [CrossRef] [PubMed]
  48. Tafere, G.G.; Wondafrash, D.Z.; Zewdie, K.A.; Assefa, B.T.; Ayza, M.A. Plasma Adipsin as a Biomarker and Its Implication in Type 2 Diabetes Mellitus. Diabetes Metab. Syndr. Obes. 2020, 13, 1855–1861. [Google Scholar] [CrossRef]
  49. Taşdemir, E. The Relationship of Plasma Adipsin, Adiponectin, Vaspin, Visfatin and Leptin Levels with Glucose Metabolism and Diabetes Parameters. Haydarpasa Numune Med. J. 2019, 59, 95–103. [Google Scholar] [CrossRef]
  50. Langhardt, J.; Flehmig, G.; Klöting, N.; Lehmann, S.; Ebert, T.; Kern, M.; Schön, M.R.; Gärtner, D.; Lohmann, T.; Dressler, M.; et al. Effects of Weight Loss on Glutathione Peroxidase 3 Serum Concentrations and Adipose Tissue Expression in Human Obesity. Obes. Facts 2018, 11, 475–490. [Google Scholar] [CrossRef]
  51. Rolle-Kampczyk, U.; Gebauer, S.; Haange, S.-B.; Schubert, K.; Kern, M.; Moulla, Y.; Dietrich, A.; Schön, M.R.; Klöting, N.; von Bergen, M.; et al. Accumulation of distinct persistent organic pollutants is associated with adipose tissue inflammation. Sci. Total Environ. 2020, 748, 142458. [Google Scholar] [CrossRef]
  52. American Diabetes Association. Diagnosis and classification of diabetes mellitus. Diabetes Care 2014, 37 (Suppl. S1), S81–S90. [Google Scholar] [CrossRef] [Green Version]
  53. Mardinoglu, A.; Heiker, J.T.; Gärtner, D.; Björnson, E.; Schön, M.R.; Flehmig, G.; Klöting, N.; Krohn, K.; Fasshauer, M.; Stumvoll, M.; et al. Extensive weight loss reveals distinct gene expression changes in human subcutaneous and visceral adipose tissue. Sci. Rep. 2015, 5, 14841. [Google Scholar] [CrossRef]
  54. Gesta, S.; Blüher, M.; Yamamoto, Y.; Norris, A.W.; Berndt, J.; Kralisch, S.; Boucher, J.; Lewis, C.; Kahn, C.R. Evidence for a role of developmental genes in the origin of obesity and body fat distribution. Proc. Natl. Acad. Sci. USA 2006, 103, 6676–6681. [Google Scholar] [CrossRef] [PubMed] [Green Version]
Figure 1. Adipsin mRNA expression in visceral (VAT) and subcutaneous (SAT) adipose tissue in control individuals and patients with obesity and/or type 2 diabetes (T2D). Adipsin gene expression in (A) the entire study population (n = 607); (B) men (n = 163) and women (n = 444); (C) subgroups of controls (BMI < 30 kg/m2, n = 21), patients with moderate obesity (30 kg/m2 < BMI < 40 kg/m2, n = 48) or morbid obesity (BMI > 40 kg/m2, n = 538); (D) subjects with normal glucose tolerance (NGT, n = 274), impaired glucose tolerance (IGT, n = 14) or T2D (n = 232). Statistical significance at * p < 0.05 and ** p < 0.01 when comparing adipsin mRNA expression between both adipose tissues. Data are given as means ± SEM.
Ijms 23 02222 g001
Figure 2. Linear regression of visceral and subcutaneous adipsin mRNA expression. Adjusted p-values were calculated in linear regression after adjusting for age, sex and BMI. VAT, visceral adipose tissue; SAT, subcutaneous adipose tissue.
Ijms 23 02222 g002
Figure 3. Linear regression of adipsin serum concentrations with (A) subcutaneous adipose tissue (SAT) and (B) visceral (VAT) adipsin mRNA expression. Adjusted p-values were calculated in linear regression after adjusting for age, sex and BMI.
Ijms 23 02222 g003
Figure 4. Adipsin serum concentrations in subgroups of moderately obese (30 kg/m2 < BMI < 40 kg/m2, n = 38) and morbidly obese patients (BMI > 40 kg/m2, n = 414). Statistical significance at *** p < 0.001. Data are given as means ± SEM.
Ijms 23 02222 g004
Figure 5. Adipsin serum concentrations in subgroups of subjects with normal glucose tolerance (NGT, n = 197), impaired glucose tolerance (IGT, n = 15) or T2D (n = 168). Statistical significance at * p < 0.05. Data are given as means ± SEM.
Ijms 23 02222 g005
Table 1. Correlation analyses of visceral and subcutaneous adipsin mRNA expression and adipsin serum levels with anthropometric and metabolic parameters (n = 637).
SAT Adipsin mRNA
r (p-Value; p-Value adj)
VAT Adipsin mRNA
r (p-Value; p-Value adj)
Adipsin Serum Levels
r (p-Value; p-Value adj)
Age (years)0.078 (0.057; 0.064)0.074 (0.071; 0.025)0.282 (<0.001; <0.001)
Body weight (kg)−0.018 (0.664; 0.219)0.058 (0.165; 0.460)0.264 (<0.001; <0.001)
Height (m)−0.058 (0.166; 0.137)−0.017 (0.687; 0.623)0.037 (0.444; 0.534)
BMI (kg/m2)0.008 (0.849; 0.482)0.077 (0.060; 0.170)0.359 (<0.001; <0.001)
Waist circumference (cm)−0.234 (0.080; 0.576)0.089 (0.504; 0.670)0.137 (0.439; 0.398)
Hip circumference (cm)0.039 (0.803; 0.971)0.175 (0.262; 0.051)0.099 (0.66; 0.45)
WHR−0.49 (0.001; <0.001)0.03 (0.849; 0.666)−0.108 (0.633; 0.170)
Body fat (%)0.048 (0.569; 0.290)0.081 (0.330; 0.561)0.073 (0.423; 0.101)
FPG (mmol/L)0.025 (0.576; 0.338)0.022 (0.624; 0.748)0.136 (0.006; 0.948)
FPI (pmol/L)−0.048 (0.588; 0.911)−0.100 (0.256; 0.875)0.126 (0.176; 0.53)
HbA1c (%)0.018 (0.770; 0.272)0.036 (0.547; 0.727)0.044 (0.470; 0.095)
HOMA-IR−0.074 (0.402; 0.777)−0.100 (0.253; 0.574)0.076 (0.410; 0.794)
Total Cholesterol (mmol/L)0.003 (0.955; 1.00)0.019 (0.751; 0.278)−0.067 (0.326; 0.896)
HDL-C (mmol/L)0.042 (0.476; 0.462)−0.050 (0.401; 0.615)−0.012 (0.858; 0.486)
LDL-C (mmol/L)0.012 (0.842; 0.907)−0.025 (0.681; 0.455)0.007 (0.919; 0.508)
Triglycerides (mmol/L)0.018 (0.753; 0.671)0.033 (0.571; 0.753)−0.068 (0.313; 0.694)
CrP (mg/L)−0.065 (0.115; 0.158) −0.049 (0.238; 0.297)0.039 (0.411; 0.825)
Leptin serum levels (ng/mL)0.008 (0.875; 0.44)0.135 (0.001; 0.021)0.362 (<0.001; <0.001)
BMI, body max index; FPG, fasting plasma glucose; FPI, fasting plasma insulin; HDL-C, high density lipoprotein cholesterol; LDL-C, low density lipoprotein cholesterol; r, Pearson correlation coefficient; SAT, subcutaneous adipose tissue; TG, triglycerides; VAT, visceral adipose tissue; WHR, waist to hip ratio. Non-normally distributed parameters were logarithmically transformed to approximate a normal distribution. p-values adj were calculated in linear regression after adjusting for age, sex and BMI, except for weight and % body fat, which were adjusted only for age and sex. Significant correlations (p < 0.05) are highlighted in bold.
Table 2. Anthropometric and metabolic characterization of the cohort.
BMI < 30 kg/m2
(n = 21)
BMI 30–40 kg/m2
(n = 52)
BMI > 40 kg/m2
(n = 564)
Age (years)66.13 ± 10.5648.41 ± 11.34 ***46.60 ± 11.93 ***
Men/Women (n)14/714/38148/416
T2D (n)422211
Body weight (kg)75.90 ± 12.28107.41 ± 14.19 ***142.81 ± 26.36 ***,###
Height (m)1.74 ± 0.971.70 ± 0.0841.70 ± 0.098
BMI (kg/m2)25.05 ± 2.3336.70 ± 2.84 ***49.52 ± 7.21 ***,###
Body fat (%)22.91 ± 5.0142.97 ± 9.40 ***48.42 ± 10.09 ***
Waist circumference (cm)96.39 ± 14.95122.50 ± 9.20 *143.667 ± 14.22 ***
Hip circumference (cm)97.11 ± 10.64124 ± 11.32 *149.42 ± 14.50 ***,#
WHR0.99 ± 0.110.99 ± 0.170.99 ± 0.09
FPG (mmol/L)5.72 ± 0.666.12 ± 1.966.40 ± 2.43
FPI (pmol/L)47.33 ± 29.99115.78 ± 88.57145.47 ± 104.87
HbA1c (%)5.73 ± 0.456.25 ± 1.465.99 ± 1.139
HOMA-Index1.67 ± 1,085.00 ± 4.165.90 ± 6.00
Total Cholesterol (mmol/L)5.40 ± 1.255.30 ± 1.275.99 ± 1.139
HDL-Cholesterol (mmol/L)1.25 ± 0.251.26 ± 0.301.16 ± 0.61
LDL-Cholesterol (mmol/L)3.31 ± 0.983.46 ± 1.153.09 ± 0.93
Triglycerides (mmol/L)1.26 ± 0.571.98 ± 1.222.06 ± 2.24
CrP (mg/L)9.75 ± 11.777.00 ± 10.4812.57 ± 17.58
AT adipsin mRNA (n)2148538
Adipsin serum levels (n)438414
Parallel adipsin mRNA and serum levels data (n)432388
Data are given as means ± SD. Statistical significance at *** p < 0.001 and at * p < 0.05 when compared with BMI < 30 kg/m2 group. Statistical significance at ### p < 0.001 and at # p < 0.05 when compared with BMI 30–40 kg/m2 group. AT, adipose tissue; BMI, body max index; FPG, fasting plasma glucose; FPI, fasting plasma insulin; HDL-C, high density lipoprotein cholesterol; LDL-C, low density lipoprotein cholesterol; SAT, subcutaneous adipose tissue; VAT, visceral adipose tissue; WHR, waist to hip ratio.
Publisher’s Note: MDPI stays neutral with regard to jurisdictional claims in published maps and institutional affiliations.

