
Hypoxia Differently Affects TGF-β2-Induced Epithelial Mesenchymal Transitions in the 2D and 3D Culture of the Human Retinal Pigment Epithelium Cells


 , , , , , and
Abstract
:1. Introduction
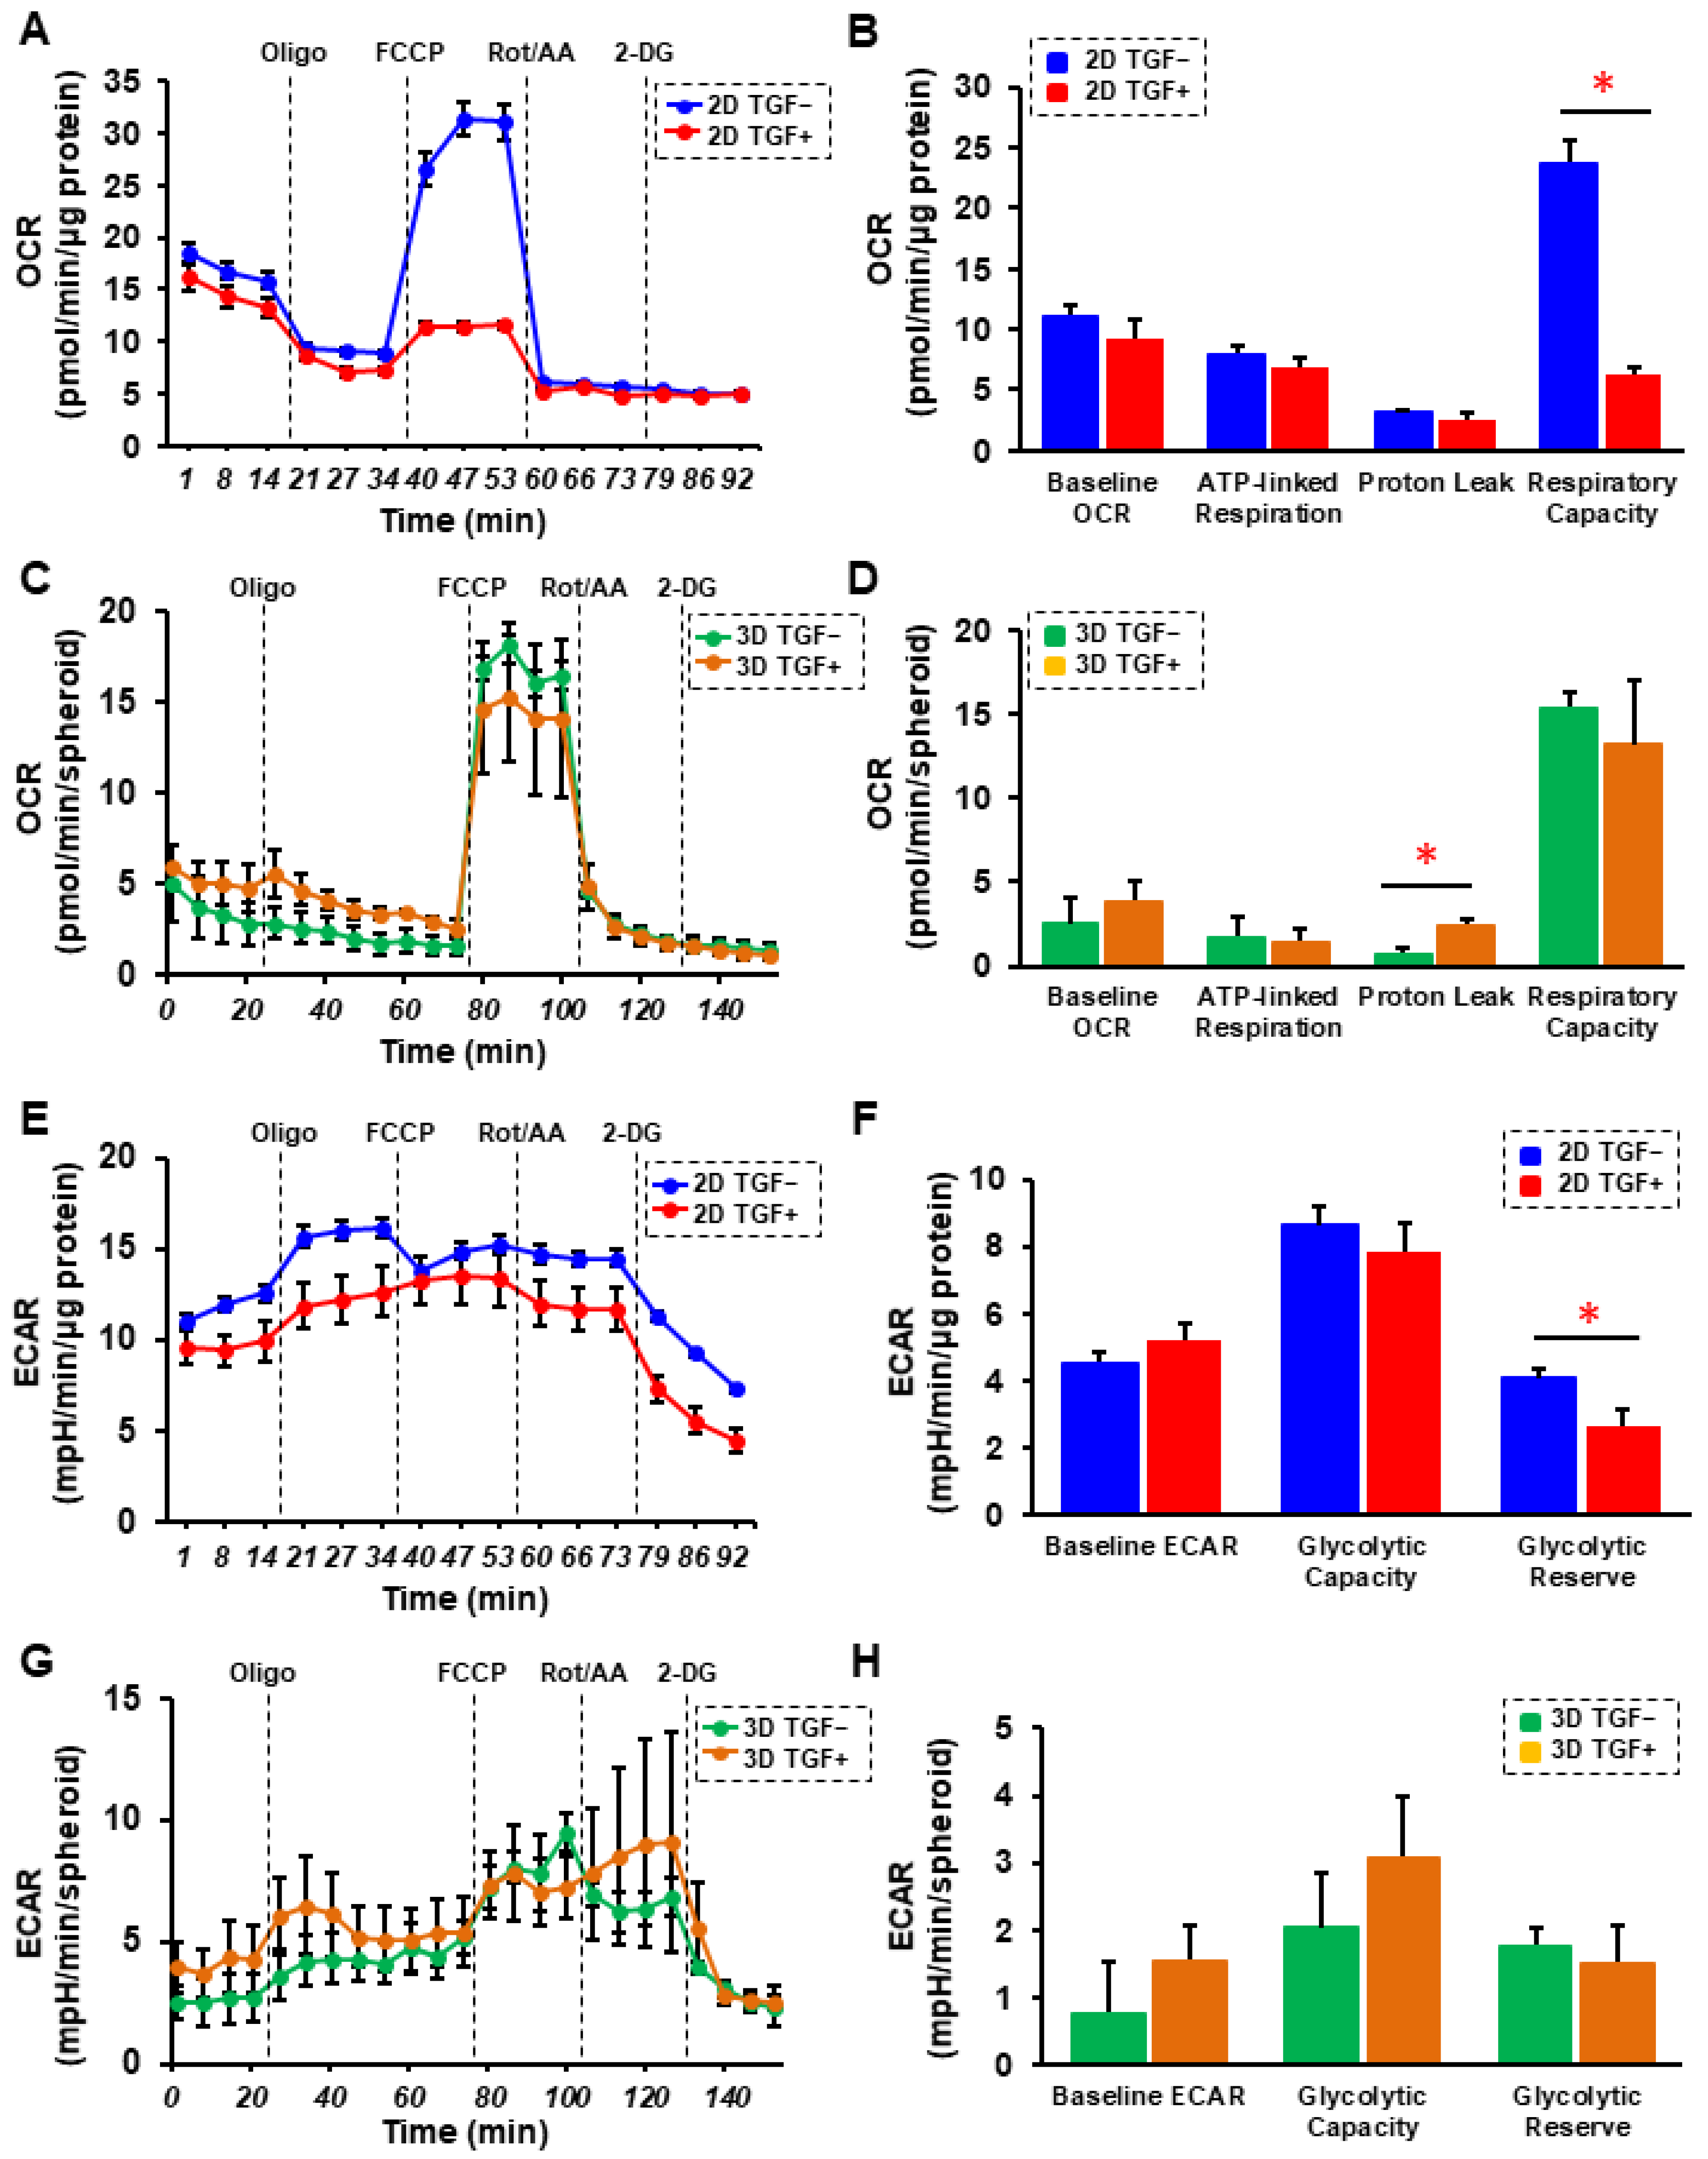
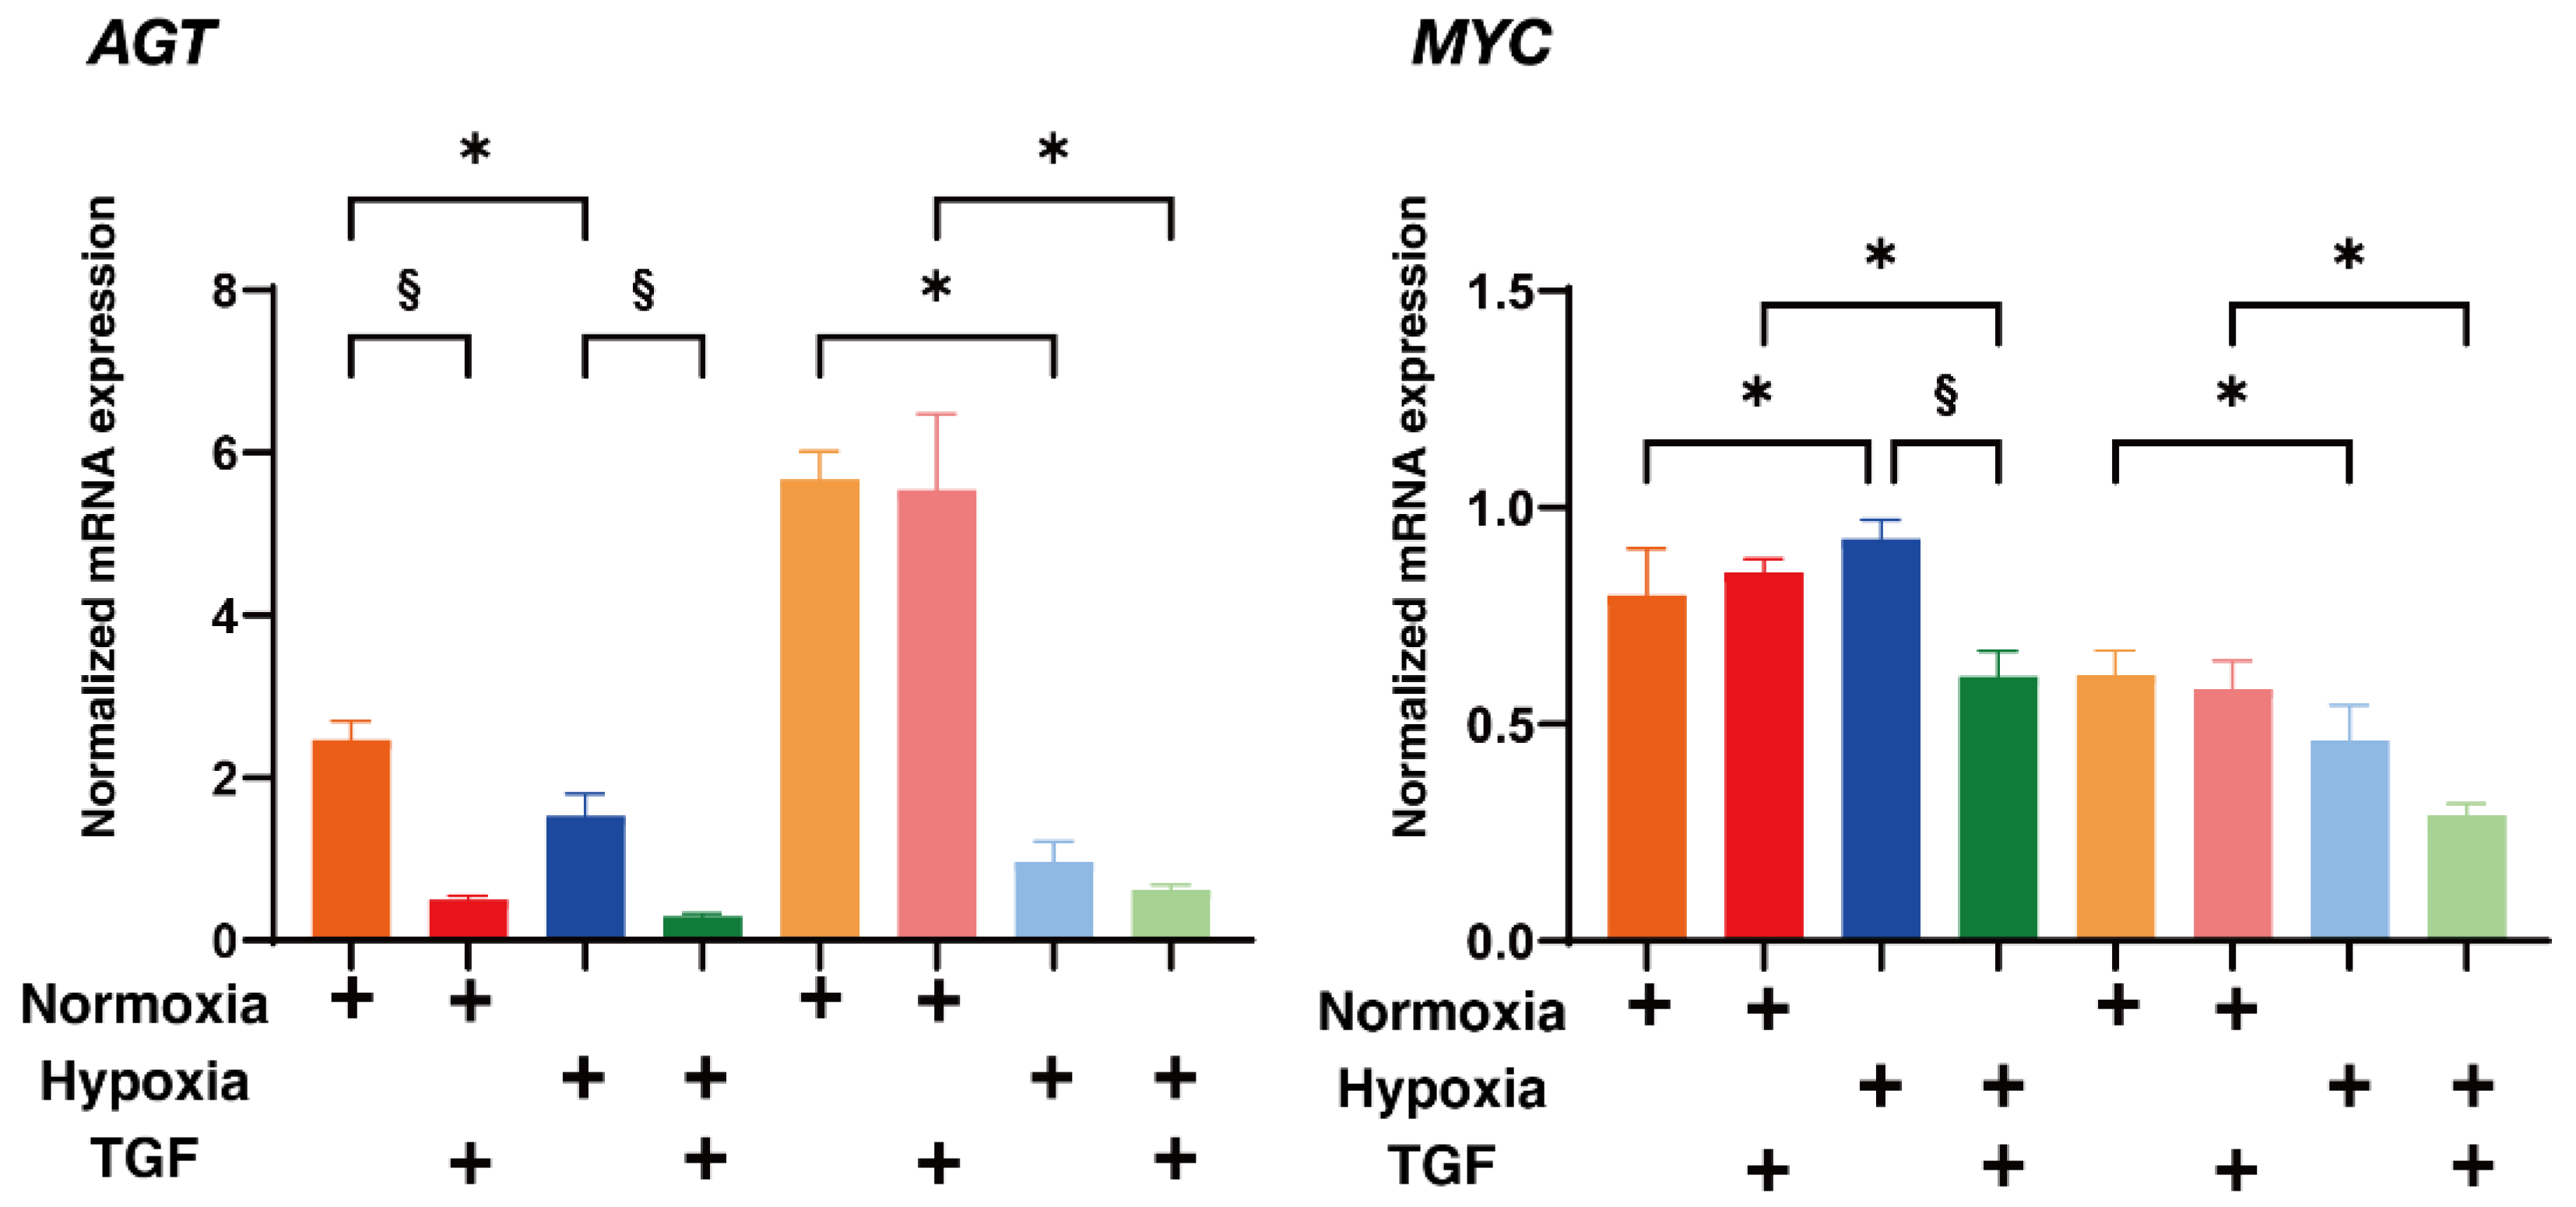
2. Results
3. Discussion
4. Methods
4.1. Two-Dimensional and Three-Dimensional Cultures of Human Retinal Pigment Epithelium (HRPE) Cells
4.2. Measurement of the Size and Solidity of 3D HRPE Spheroids
4.3. Immunocytochemistry of 2D and 3D Cultured HRPE Cells
4.4. Measurement of Real-Time Cellular Metabolic Functions
4.5. Other Analytical Methods
Supplementary Materials
Author Contributions
Funding
Institutional Review Board Statement
Informed Consent Statement
Data Availability Statement
Conflicts of Interest
References
- Adamis, A.P.; Shima, D.T.; Yeo, K.T.; Yeo, T.K.; Brown, L.F.; Berse, B.; Amore, P.A.D.; Folkman, J. Synthesis and secretion of vascular permeability factor/vascular endothelial growth factor by human retinal pigment epithelial cells. Biochem. Biophys. Res. Commun. 1993, 193, 631–638. [Google Scholar] [CrossRef] [PubMed]
- Shu, D.Y.; Butcher, E.; Saint-Geniez, M. EMT and EndMT: Emerging Roles in Age-Related Macular Degeneration. Int. J. Mol. Sci. 2020, 21, 4271. [Google Scholar] [CrossRef] [PubMed]
- Connor, T.B.; Roberts, A.B.; Sporn, M.B.; Danielpour, D.; Dart, L.L.; Michels, R.G.; de Bustros, S.; Enger, C.; Kato, H.; Lansing, M.; et al. Correlation of fibrosis and transforming growth factor-beta type 2 levels in the eye. J. Clin. Investig. 1989, 83, 1661–1666. [Google Scholar] [CrossRef] [PubMed]
- Esser, P.; Heimann, K.; Bartz-schmidt, K.U.; Fontana, A.; Schraermeyer, U.; Thumann, G.; Weller, M. Apoptosis in proliferative vitreoretinal disorders: Possible involvement of TGF-beta-induced RPE cell apoptosis. Exp. Eye Res. 1997, 65, 365–378. [Google Scholar] [CrossRef] [PubMed]
- Kon, C.H.; Occleston, N.L.; Aylward, G.W.; Khaw, P.T. Expression of vitreous cytokines in proliferative vitreoretinopathy: A prospective study. Investig. Ophthalmol. Vis. Sci. 1999, 40, 705–712. [Google Scholar]
- González-Avila, G.; Lozano, D.; Manjarrez, M.E.; Ruiz, V.M.; Terán, L.; Vadillo-Ortega, F.; Selman, M. Influence on collagen metabolism of vitreous from eyes with proliferative vitreoretinopathy. Ophthalmology 1995, 102, 1400–1405. [Google Scholar] [CrossRef]
- Bochaton-Piallat, M.L.; Kapetanios, A.D.; Donati, G.; Redard, M.; Gabbiani, G.; Pournaras, C.J. TGF-beta1, TGF-beta receptor II and ED-A fibronectin expression in myofibroblast of vitreoretinopathy. Investig. Ophthalmol. Vis. Sci. 2000, 41, 2336–2342. [Google Scholar]
- Hoerster, R.; Muether, P.S.; Vierkotten, S.; Hermann, M.M.; Kirchhof, B.; Fauser, S. Upregulation of TGF-ß1 in experimental proliferative vitreoretinopathy is accompanied by epithelial to mesenchymal transition. Graefe's Arch. Clin. Exp. Ophthalmol. = Albrecht Von Graefes Arch. Fur Klin. Und Exp. Ophthalmol. 2014, 252, 11–16. [Google Scholar] [CrossRef]
- Parapuram, S.K.; Chang, B.; Li, L.; Hartung, R.A.; Chalam, K.V.; Nair-Menon, J.U.; Hunt, D.M.; Hunt, R.C. Differential effects of TGFbeta and vitreous on the transformation of retinal pigment epithelial cells. Investig. Ophthalmol. Vis. Sci. 2009, 50, 5965–5974. [Google Scholar] [CrossRef] [Green Version]
- Campochiaro, P.A. Retinal and choroidal neovascularization. J. Cell. Physiol. 2000, 184, 301–310. [Google Scholar] [CrossRef]
- Yang, X.M.; Wang, Y.S.; Zhang, J.; Li, Y.; Xu, J.F.; Zhu, J.; Zhao, W.; Chu, D.K.; Wiedemann, P. Role of PI3K/Akt and MEK/ERK in mediating hypoxia-induced expression of HIF-1alpha and VEGF in laser-induced rat choroidal neovascularization. Investig. Ophthalmol. Vis. Sci. 2009, 50, 1873–1879. [Google Scholar] [CrossRef] [PubMed]
- Arjamaa, O.; Nikinmaa, M. Oxygen-dependent diseases in the retina: Role of hypoxia-inducible factors. Exp. Eye Res. 2006, 83, 473–483. [Google Scholar] [CrossRef] [PubMed]
- Aiello, L.P.; Avery, R.L.; Arrigg, P.G.; Keyt, B.A.; Jampel, H.D.; Shah, S.T.; Pasquale, L.R.; Thieme, H.; Iwamoto, M.A.; Park, J.E.; et al. Vascular endothelial growth factor in ocular fluid of patients with diabetic retinopathy and other retinal disorders. N. Engl. J. Med. 1994, 331, 1480–1487. [Google Scholar] [CrossRef] [PubMed]
- Bressler, S.B. Introduction: Understanding the role of angiogenesis and antiangiogenic agents in age-related macular degeneration. Ophthalmology 2009, 116 (Suppl. S10), S1–S7. [Google Scholar] [CrossRef] [PubMed]
- Tirpe, A.A.; Gulei, D.; Ciortea, S.M.; Crivii, C.; Berindan-Neagoe, I. Hypoxia: Overview on Hypoxia-Mediated Mechanisms with a Focus on the Role of HIF Genes. Int. J. Mol. Sci. 2019, 20, 6140. [Google Scholar] [CrossRef] [PubMed] [Green Version]
- Shu, D.Y.; Butcher, E.R.; Saint-Geniez, M. Suppression of PGC-1α Drives Metabolic Dysfunction in TGFβ2-Induced EMT of Retinal Pigment Epithelial Cells. Int. J. Mol. Sci. 2021, 22, 4701. [Google Scholar] [CrossRef]
- Siemerink, M.J.; Augustin, A.J.; Schlingemann, R.O. Mechanisms of ocular angiogenesis and its molecular mediators. Dev. Ophthalmol. 2010, 46, 4–20. [Google Scholar]
- Grossniklaus, H.E.; Green, W.R. Histopathologic and ultrastructural findings of surgically excised choroidal neovascularization. Submacular Surgery Trials Research Group. Arch. Ophthalmol. 1998, 116, 745–749. [Google Scholar] [CrossRef]
- Lopez, P.F.; Sippy, B.D.; Lambert, H.M.; Thach, A.B.; Hinton, D.R. Transdifferentiated retinal pigment epithelial cells are immunoreactive for vascular endothelial growth factor in surgically excised age-related macular degeneration-related choroidal neovascular membranes. Investig. Ophthalmol Vis. Sci. 1996, 37, 855–868. [Google Scholar]
- Grossniklaus, H.E.; Hutchinson, A.K.; Capone, A.; Woolfson, J.; Lambert, H.M. Clinicopathologic features of surgically excised choroidal neovascular membranes. Ophthalmology 1994, 101, 1099–1111. [Google Scholar] [CrossRef]
- Radeke, M.J.; Radeke, C.M.; Shih, Y.H.; Hu, J.; Bok, D.; Johnson, L.V.; Coffey, P.J. Restoration of mesenchymal retinal pigmented epithelial cells by TGFβ pathway inhibitors: Implications for age-related macular degeneration. Genome Med. 2015, 7, 58. [Google Scholar] [CrossRef] [PubMed] [Green Version]
- Sarks, J.P.; Sarks, S.H.; Killingsworth, M.C. Evolution of geographic atrophy of the retinal pigment epithelium. Eye (Lond.) 1988, 2 Pt 5, 552–577. [Google Scholar] [CrossRef]
- Guidry, C.; Medeiros, N.E.; Curcio, C.A. Phenotypic variation of retinal pigment epithelium in age-related macular degeneration. Investig. Ophthalmol Vis. Sci. 2002, 43, 267–273. [Google Scholar]
- Zanzottera, E.C.; Messinger, J.D.; Ach, T.; Smith, R.T.; Curcio, C.A. Subducted and melanotic cells in advanced age-related macular degeneration are derived from retinal pigment epithelium. Investig. Ophthalmol. Vis. Sci. 2015, 56, 3269–3278. [Google Scholar] [CrossRef] [PubMed] [Green Version]
- Wieleba, I.; Wojas-Krawczyk, K.; Krawczyk, P.; Milanowski, J. Clinical Application Perspectives of Lung Cancers 3D Tumor Microenvironment Models for In Vitro Cultures. Int. J. Mol. Sci. 2022, 23, 2261. [Google Scholar] [CrossRef] [PubMed]
- Godet, I.; Doctorman, S.; Wu, F.; Gilkes, D.M. Detection of Hypoxia in Cancer Models: Significance, Challenges, and Advances. Cells 2022, 11, 686. [Google Scholar] [CrossRef] [PubMed]
- Atat, O.E.; Farzaneh, Z.; Pourhamzeh, M.; Taki, F.; Abi-Habib, R.; Vosough, M.; El-Sibai, M. 3D modeling in cancer studies. Hum. Cell 2022, 35, 23–36. [Google Scholar] [CrossRef]
- Jensen, C.; Shay, C.; Teng, Y. The New Frontier of Three-Dimensional Culture Models to Scale-Up Cancer Research. Methods Mol. Biol. 2022, 2343, 3–18. [Google Scholar]
- Hikage, F.; Atkins, S.; Kahana, A.; Smith, T.J.; Chun, T.H. HIF2A-LOX Pathway Promotes Fibrotic Tissue Remodeling in Thyroid-Associated Orbitopathy. Endocrinology 2019, 160, 20–35. [Google Scholar] [CrossRef] [Green Version]
- Ida, Y.; Hikage, F.; Itoh, K.; Ida, H.; Ohguro, H. Prostaglandin F2α agonist-induced suppression of 3T3-L1 cell adipogenesis affects spatial formation of extra-cellular matrix. Sci. Rep. 2020, 10, 7958. [Google Scholar] [CrossRef]
- Ota, C.; Ida, Y.; Ohguro, H.; Hikage, F. ROCK inhibitors beneficially alter the spatial configuration of TGFβ2-treated 3D organoids from a human trabecular meshwork (HTM). Sci. Rep. 2020, 10, 20292. [Google Scholar] [CrossRef]
- Oouchi, Y.; Watanabe, M.; Ida, Y.; Ohguro, H.; Hikage, F. Rosiglitasone and ROCK Inhibitors Modulate Fibrogenetic Changes in TGF-β2 Treated Human Conjunctival Fibroblasts (HconF) in Different Manners. Int. J. Mol. Sci. 2021, 22, 7335. [Google Scholar] [CrossRef]
- Watanabe, M.; Ida, Y.; Ohguro, H.; Ota, C.; Hikage, F. Establishment of appropriate glaucoma models using dexamethasone or TGFβ2 treated three-dimension (3D) cultured human trabecular meshwork (HTM) cells. Sci. Rep. 2021, 11, 19369. [Google Scholar] [CrossRef]
- Itoh, K.; Hikage, F.; Ida, Y.; Ohguro, H. Prostaglandin F2α Agonists Negatively Modulate the Size of 3D Organoids from Primary Human Orbital Fibroblasts. Investig. Ophthalmol. Vis. Sci. 2020, 61, 13. [Google Scholar] [CrossRef]
- Itoh, K.; Ida, Y.; Ohguro, H.; Hikage, F. Prostaglandin F2α agonists induced enhancement in collagen1 expression is involved in the pathogenesis of the deepening of upper eyelid sulcus. Sci. Rep. 2021, 11, 9002. [Google Scholar] [CrossRef]
- Ohguro, H.; Ida, Y.; Hikage, F.; Umetsu, A.; Ichioka, H.; Watanabe, M.; Furuhashi, M. STAT3 Is the Master Regulator for the Forming of 3D Spheroids of 3T3-L1 Preadipocytes. Cells 2022, 11, 300. [Google Scholar] [CrossRef]
- Tormos, K.V.; Chandel, N.S. Inter-connection between mitochondria and HIFs. J. Cell Mol. Med. 2010, 14, 795–804. [Google Scholar] [CrossRef]
- Dongre, A.; Weinberg, R.A. New insights into the mechanisms of epithelial-mesenchymal transition and implications for cancer. Nat. Rev. Mol. Cell Biol. 2019, 20, 69–84. [Google Scholar] [CrossRef]
- Kalluri, R.; Weinberg, R.A. The basics of epithelial-mesenchymal transition. J. Clin. Investig. 2009, 119, 1420–1428. [Google Scholar] [CrossRef] [Green Version]
- Semenza, G.L. Life with oxygen. Sci. (New York N.Y.) 2007, 318, 62–64. [Google Scholar] [CrossRef]
- Bunn, H.F.; Poyton, R.O. Oxygen sensing and molecular adaptation to hypoxia. Physiol. Rev. 1996, 76, 839–885. [Google Scholar] [CrossRef]
- Harris, A.L. Hypoxia—A key regulatory factor in tumour growth. Nat. Rev. Cancer 2002, 2, 38–47. [Google Scholar] [CrossRef]
- Semenza, G.L.; Wang, G.L. A nuclear factor induced by hypoxia via de novo protein synthesis binds to the human erythropoietin gene enhancer at a site required for transcriptional activation. Mol. Cell. Biol. 1992, 12, 5447–5454. [Google Scholar]
- Wang, G.L.; Semenza, G.L. Purification and characterization of hypoxia-inducible factor 1. J. Biol. Chem. 1995, 270, 1230–1237. [Google Scholar] [CrossRef] [Green Version]
- Tian, H.; McKnight, S.L.; Russell, D.W. Endothelial PAS domain protein 1 (EPAS1), a transcription factor selectively expressed in endothelial cells. Genes Dev. 1997, 11, 72–82. [Google Scholar] [CrossRef] [Green Version]
- Gu, Y.Z.; Moran, S.M.; Hogenesch, J.B.; Wartman, L.; Bradfield, C.A. Molecular characterization and chromosomal localization of a third alpha-class hypoxia inducible factor subunit, HIF3alpha. Gene Expr. 1998, 7, 205–213. [Google Scholar]
- Lin, M.; Hu, Y.; Chen, Y.; Zhou, K.K.; Jin, J.; Zhu, M.; Le, Y.Z.; Ge, J.; Ma, J.X. Impacts of hypoxia-inducible factor-1 knockout in the retinal pigment epithelium on choroidal neovascularization. Investig. Ophthalmol. Vis. Sci. 2012, 53, 6197–6206. [Google Scholar] [CrossRef]
- Lazzara, F.; Trotta, M.C.; Platania, C.B.M.; D'Amico, M.; Petrillo, F.; Galdiero, M.; Gesualdo, C.; Rossi, S.; Drago, F.; Bucolo, C. Stabilization of HIF-1α in Human Retinal Endothelial Cells Modulates Expression of miRNAs and Proangiogenic Growth Factors. Front. Pharm. 2020, 11, 1063. [Google Scholar] [CrossRef]
- Bonfiglio, V.; Platania, C.B.M.; Lazzara, F.; Conti, F.; Pizzo, C.; Reibaldi, M.; Russo, A.; Fallico, M.; Ortisi, E.; Pignatelli, F.; et al. TGF-β Serum Levels in Diabetic Retinopathy Patients and the Role of Anti-VEGF Therapy. Int. J. Mol. Sci. 2020, 21, 9558. [Google Scholar] [CrossRef]
- Platania, C.B.M.; Leggio, G.M.; Drago, F.; Salomone, S.; Bucolo, C. Computational systems biology approach to identify novel pharmacological targets for diabetic retinopathy. Biochem. Pharm. 2018, 158, 13–26. [Google Scholar] [CrossRef]
- Nahomi, R.B.; Nagaraj, R.H. The role of HIF-1α in the TGF-β2-mediated epithelial-to-mesenchymal transition of human lens epithelial cells. J. Cell Biochem. 2018, 119, 6814–6827. [Google Scholar] [CrossRef]
- Lai, K.; Luo, C.; Zhang, X.; Ye, P.; Zhang, Y.; He, J.; Yao, K. Regulation of angiogenin expression and epithelial-mesenchymal transition by HIF-1α signaling in hypoxic retinal pigment epithelial cells. Biochim. Biophys Acta 2016, 1862, 1594–1607. [Google Scholar] [CrossRef] [Green Version]
- Kaneko, Y.; Ohta, M.; Inoue, T.; Mizuno, K.; Isobe, T.; Tanabe, S.; Tanihara, H. Effects of K-115 (Ripasudil), a novel ROCK inhibitor, on trabecular meshwork and Schlemm's canal endothelial cells. Sci. Rep. 2016, 6, 19640. [Google Scholar] [CrossRef]


Publisher’s Note: MDPI stays neutral with regard to jurisdictional claims in published maps and institutional affiliations. |
© 2022 by the authors. Licensee MDPI, Basel, Switzerland. This article is an open access article distributed under the terms and conditions of the Creative Commons Attribution (CC BY) license (https://creativecommons.org/licenses/by/4.0/).
Share and Cite
Suzuki, S.; Sato, T.; Watanabe, M.; Higashide, M.; Tsugeno, Y.; Umetsu, A.; Furuhashi, M.; Ida, Y.; Hikage, F.; Ohguro, H. Hypoxia Differently Affects TGF-β2-Induced Epithelial Mesenchymal Transitions in the 2D and 3D Culture of the Human Retinal Pigment Epithelium Cells. Int. J. Mol. Sci. 2022, 23, 5473. https://doi.org/10.3390/ijms23105473
Suzuki S, Sato T, Watanabe M, Higashide M, Tsugeno Y, Umetsu A, Furuhashi M, Ida Y, Hikage F, Ohguro H. Hypoxia Differently Affects TGF-β2-Induced Epithelial Mesenchymal Transitions in the 2D and 3D Culture of the Human Retinal Pigment Epithelium Cells. International Journal of Molecular Sciences. 2022; 23(10):5473. https://doi.org/10.3390/ijms23105473
Chicago/Turabian StyleSuzuki, Soma, Tatsuya Sato, Megumi Watanabe, Megumi Higashide, Yuri Tsugeno, Araya Umetsu, Masato Furuhashi, Yosuke Ida, Fumihito Hikage, and Hiroshi Ohguro. 2022. "Hypoxia Differently Affects TGF-β2-Induced Epithelial Mesenchymal Transitions in the 2D and 3D Culture of the Human Retinal Pigment Epithelium Cells" International Journal of Molecular Sciences 23, no. 10: 5473. https://doi.org/10.3390/ijms23105473