
Differential Responses to Sigma-1 or Sigma-2 Receptor Ablation in Adiposity, Fat Oxidation, and Sexual Dimorphism
 , ,
, ,  and
and 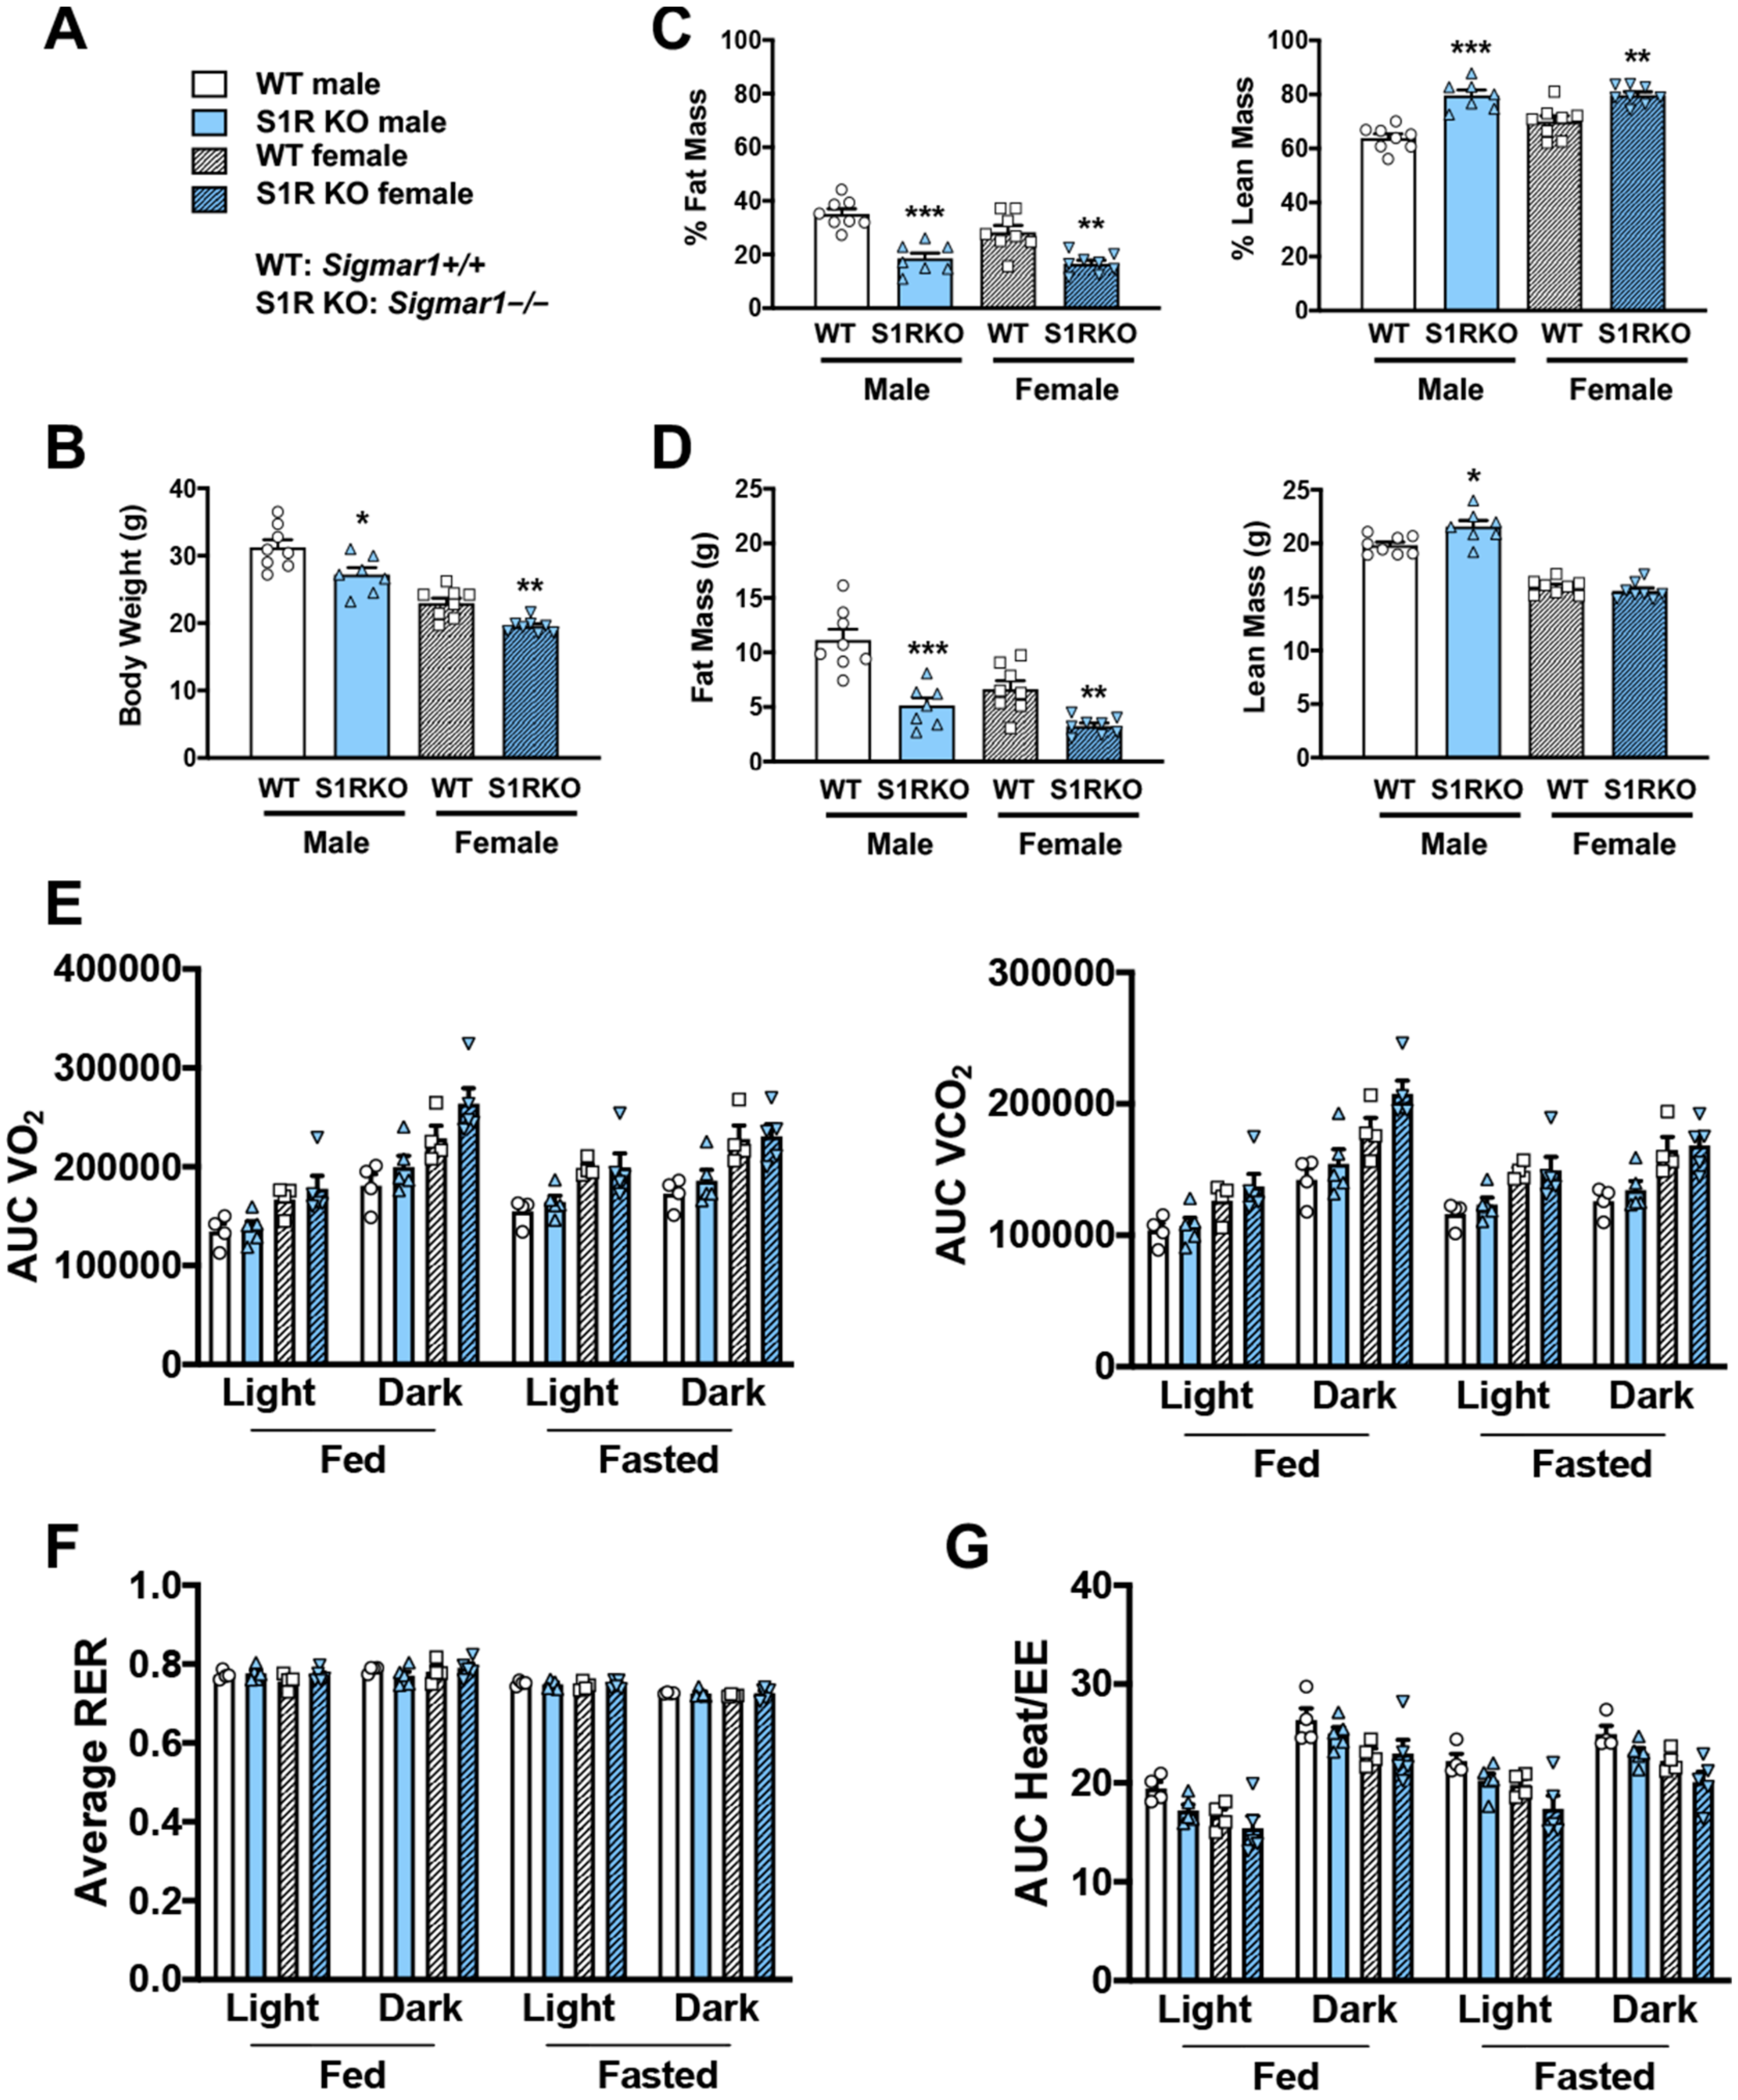
Abstract
:1. Introduction
2. Results
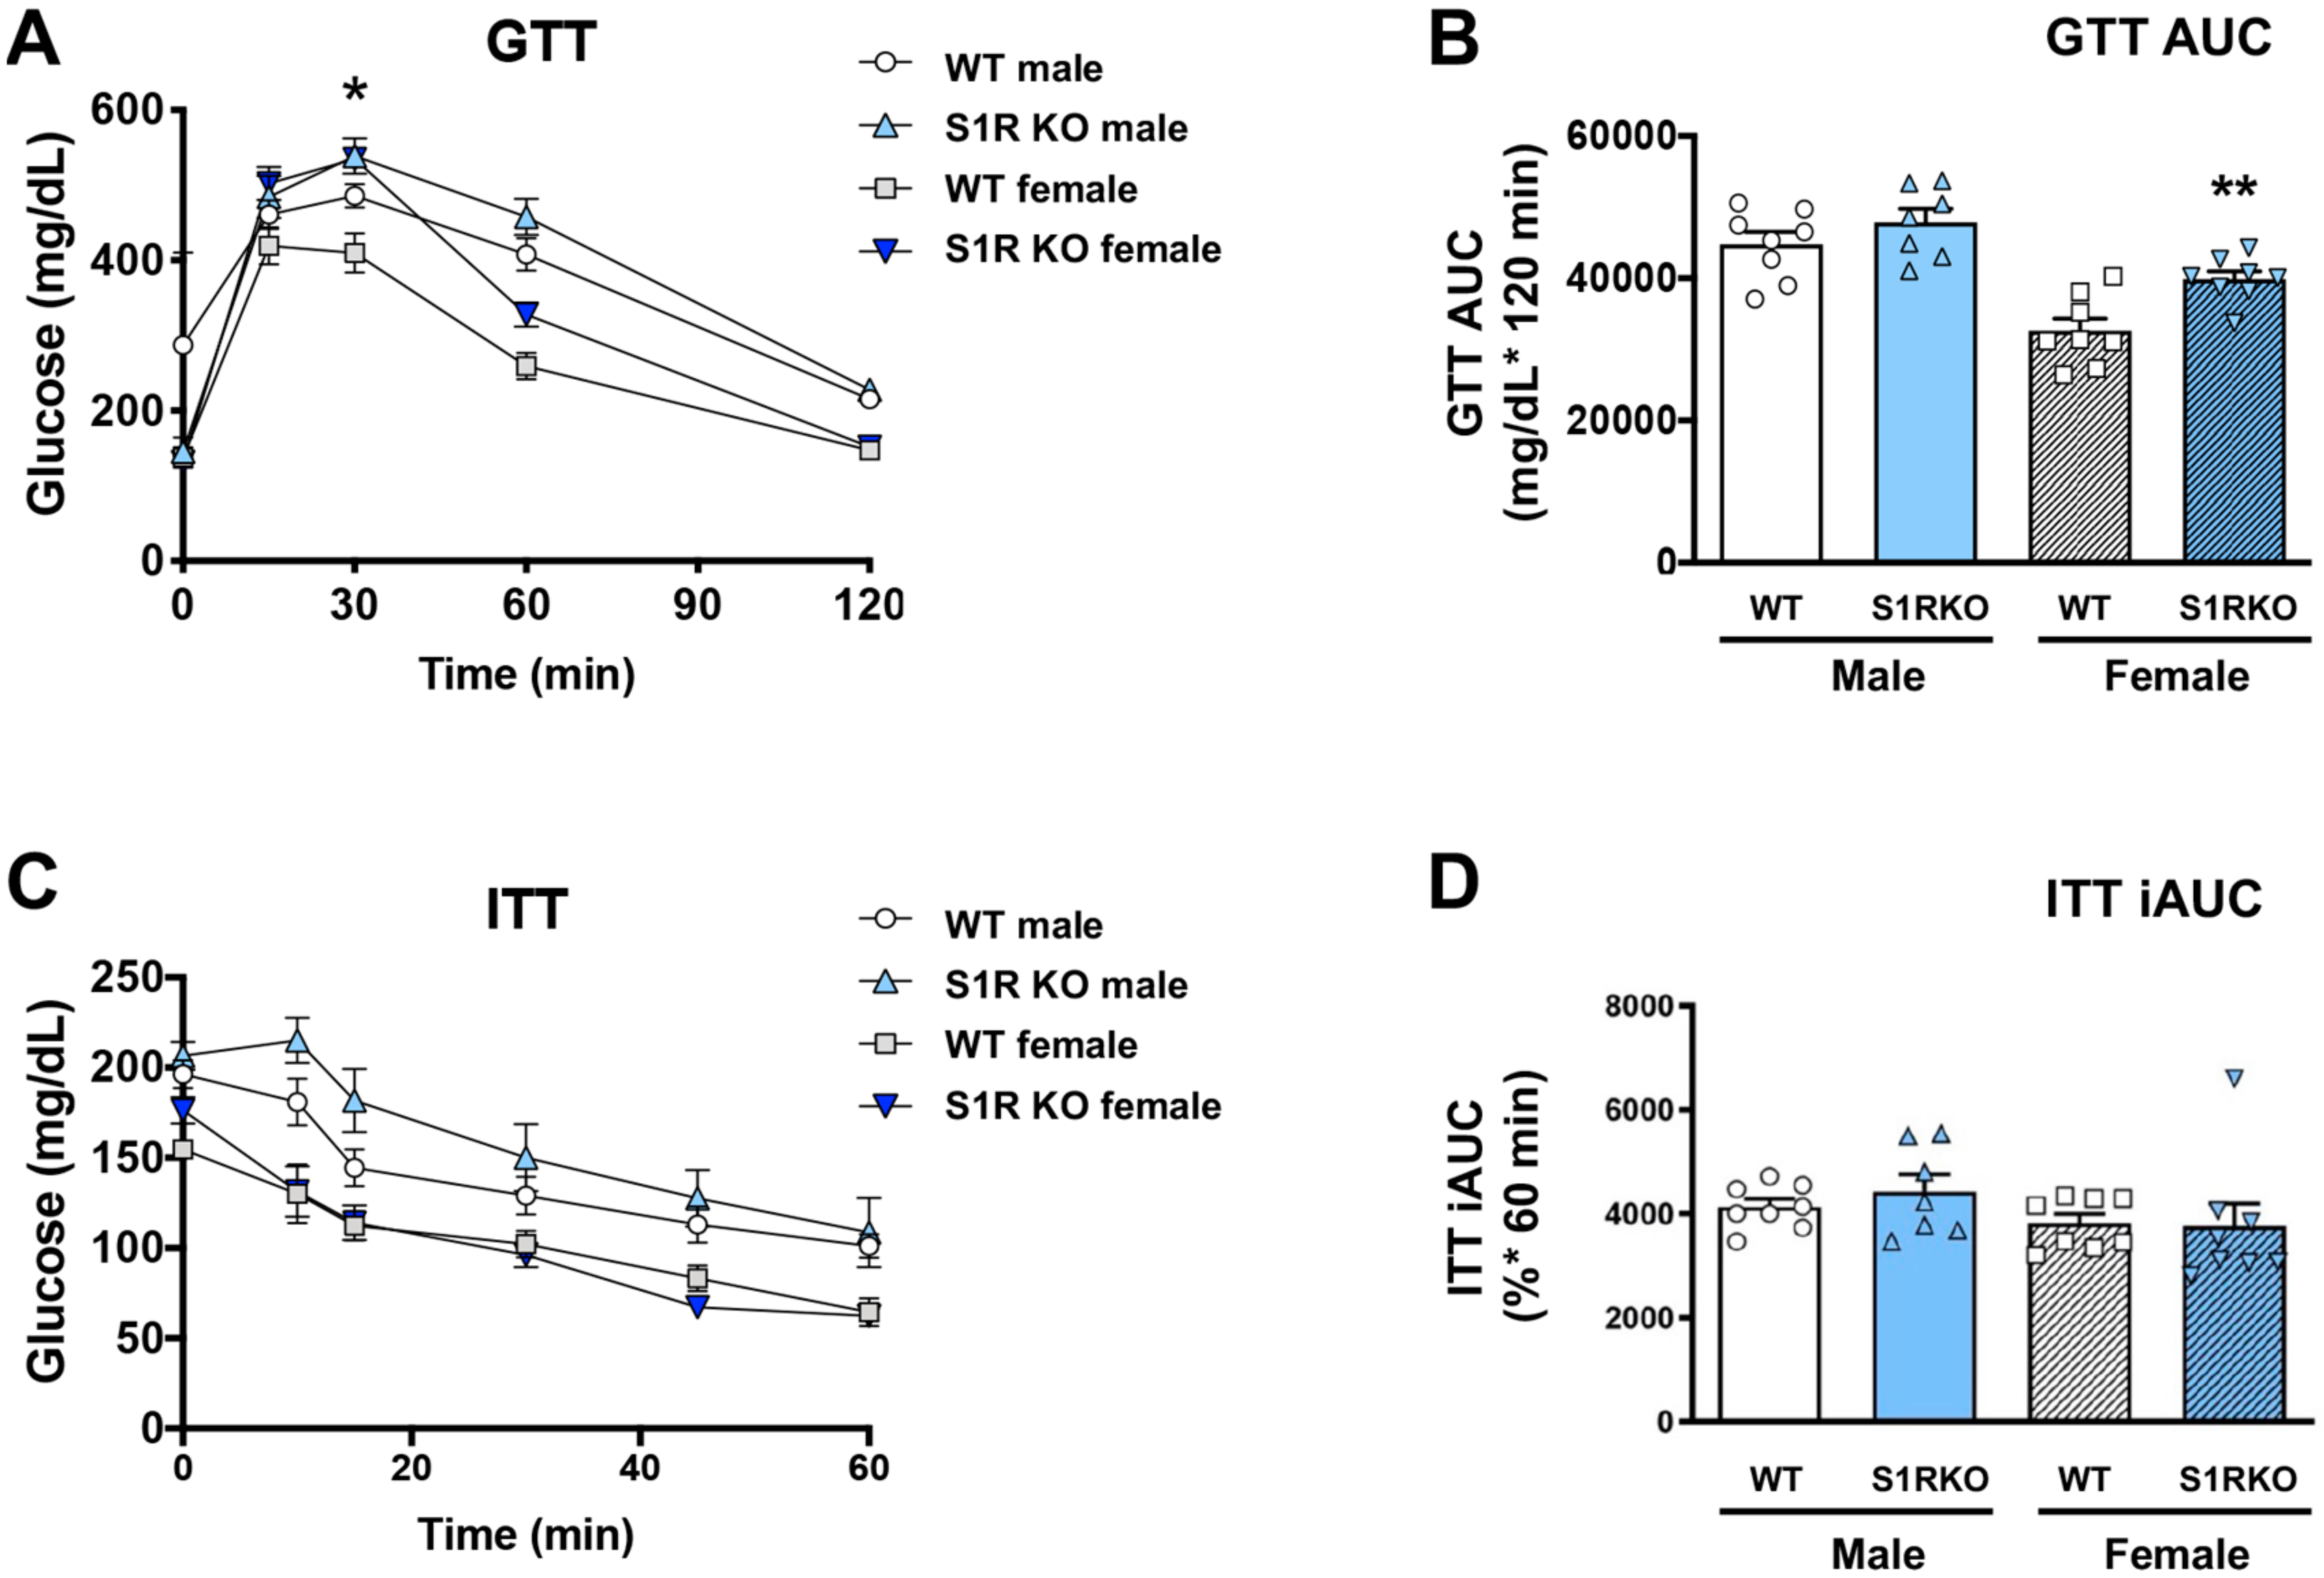
2.1. S1R Ablation Protects against Adiposity in Male and Female Mice Fed on HFD
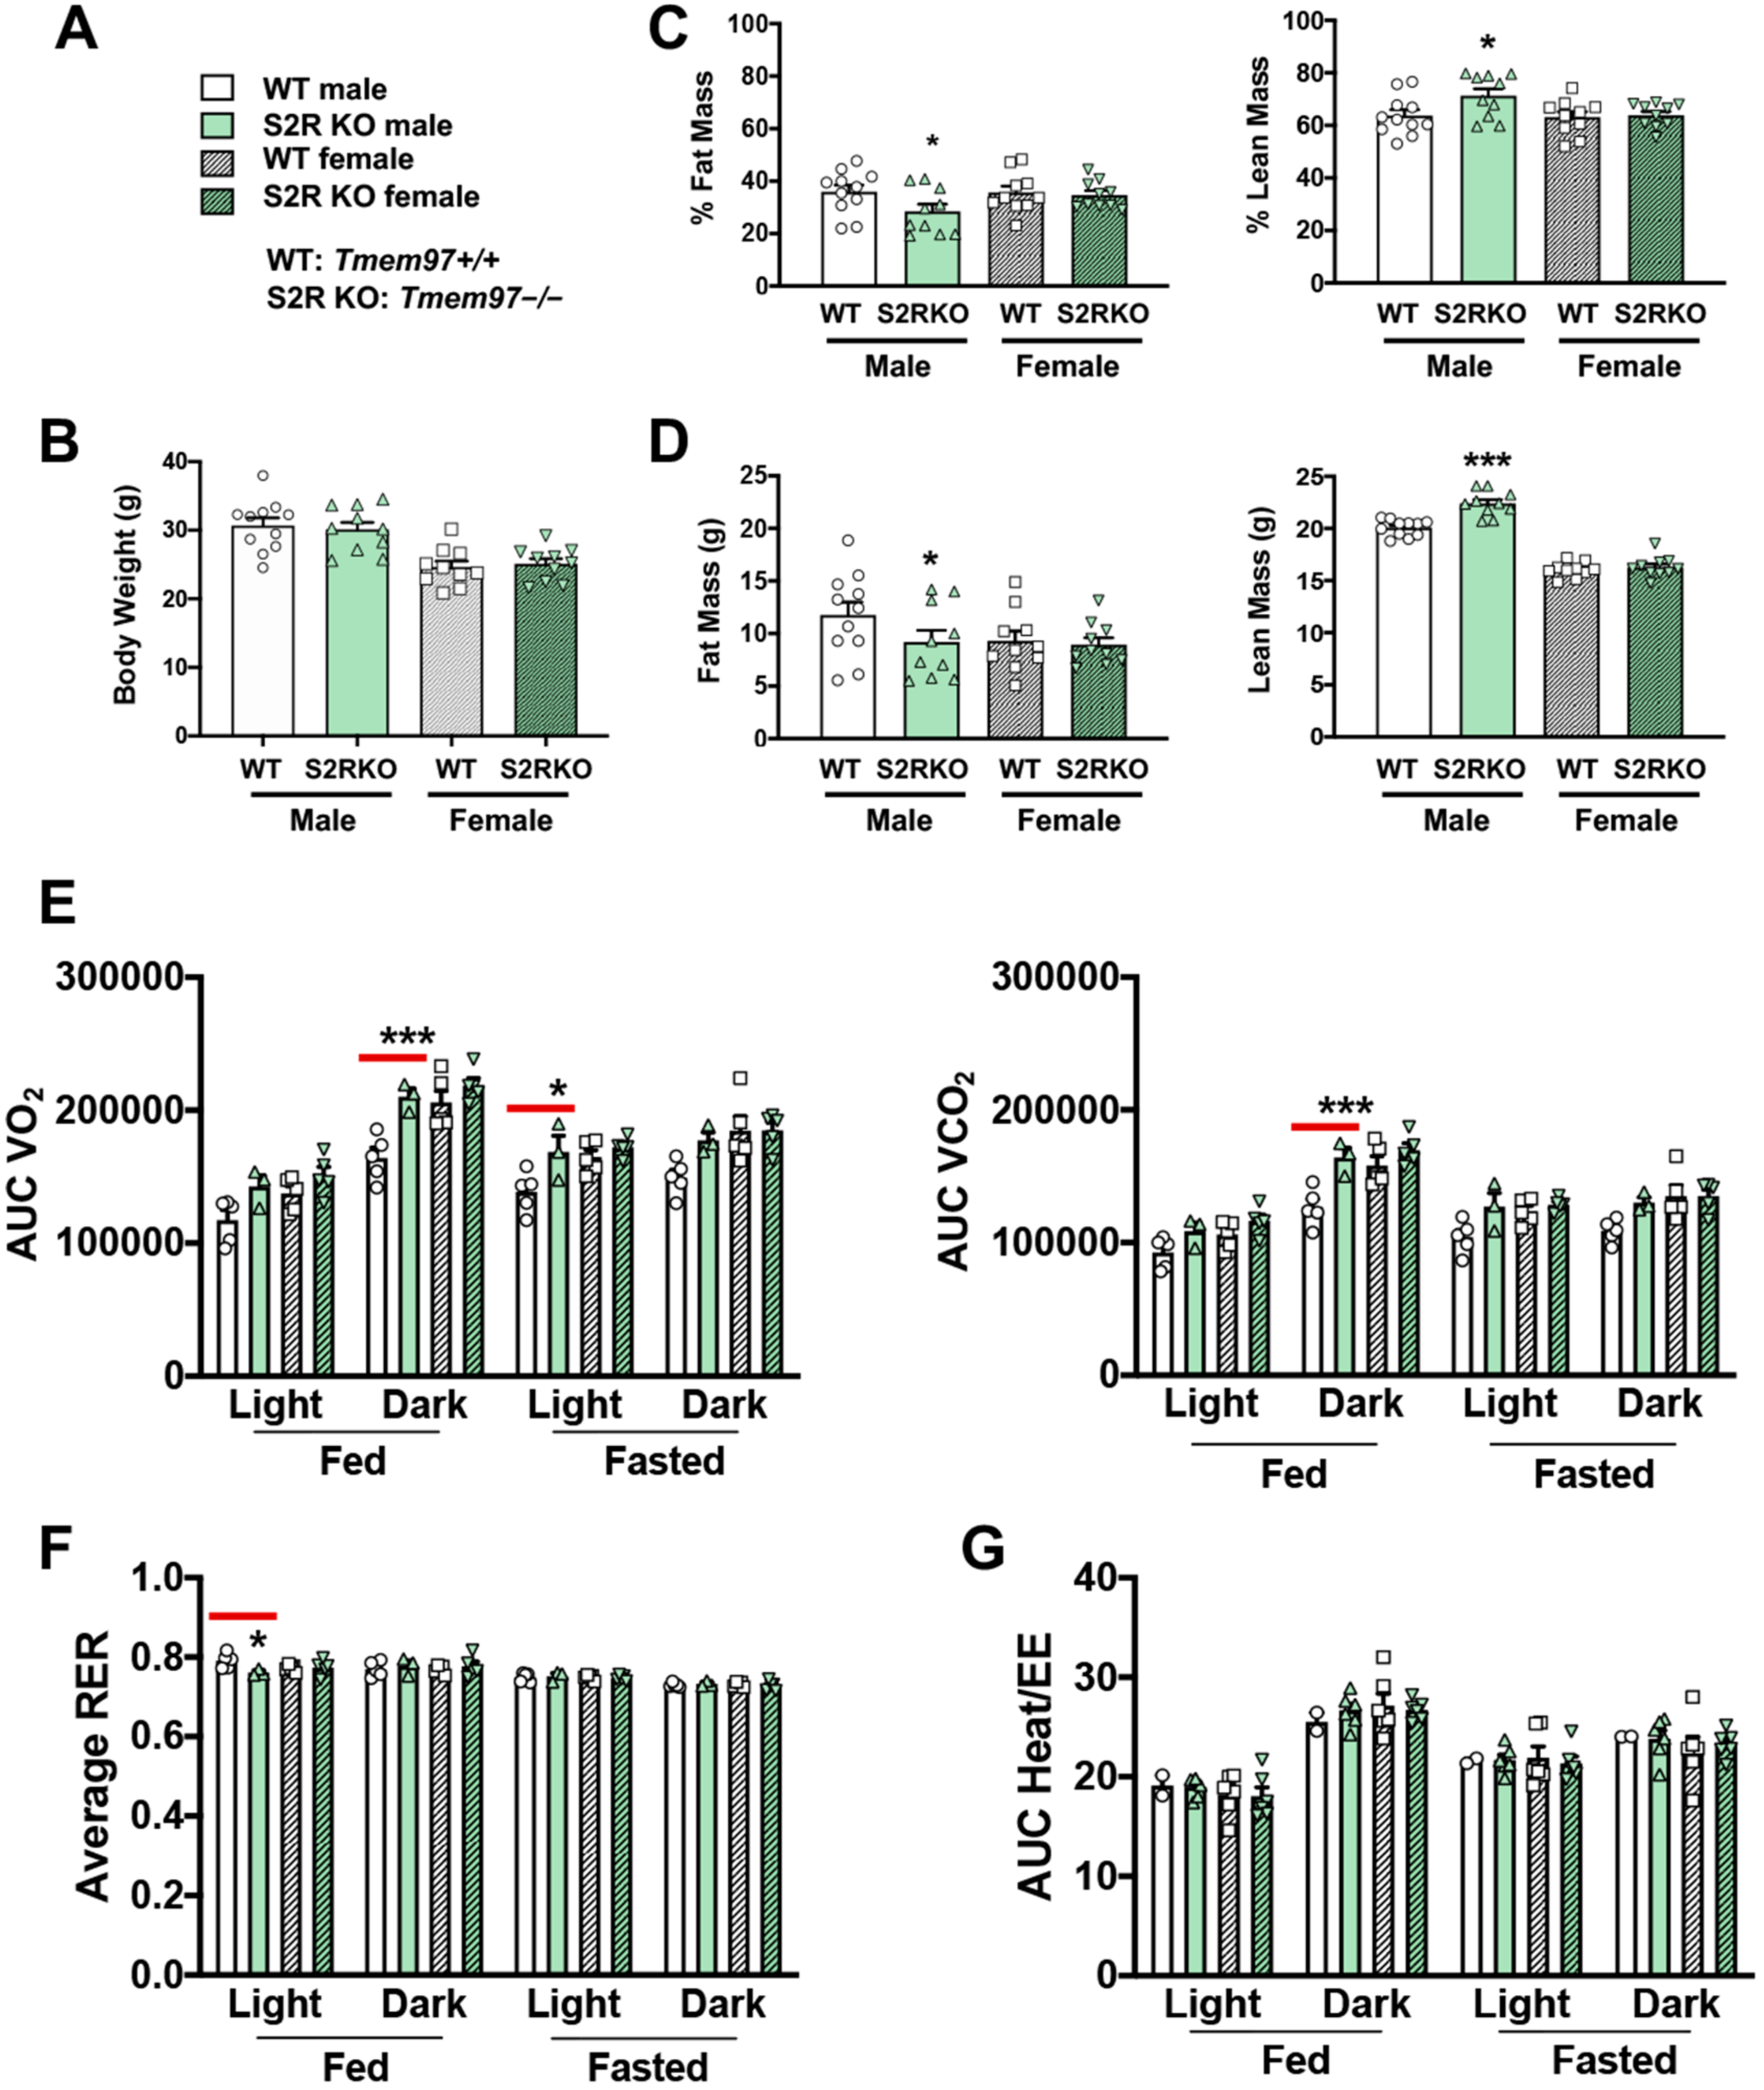
2.2. S2R Deletion Reduces Adiposity and Increases Fatty-Acid Oxidation in Male, but Not Female, Mice Fed on HFD
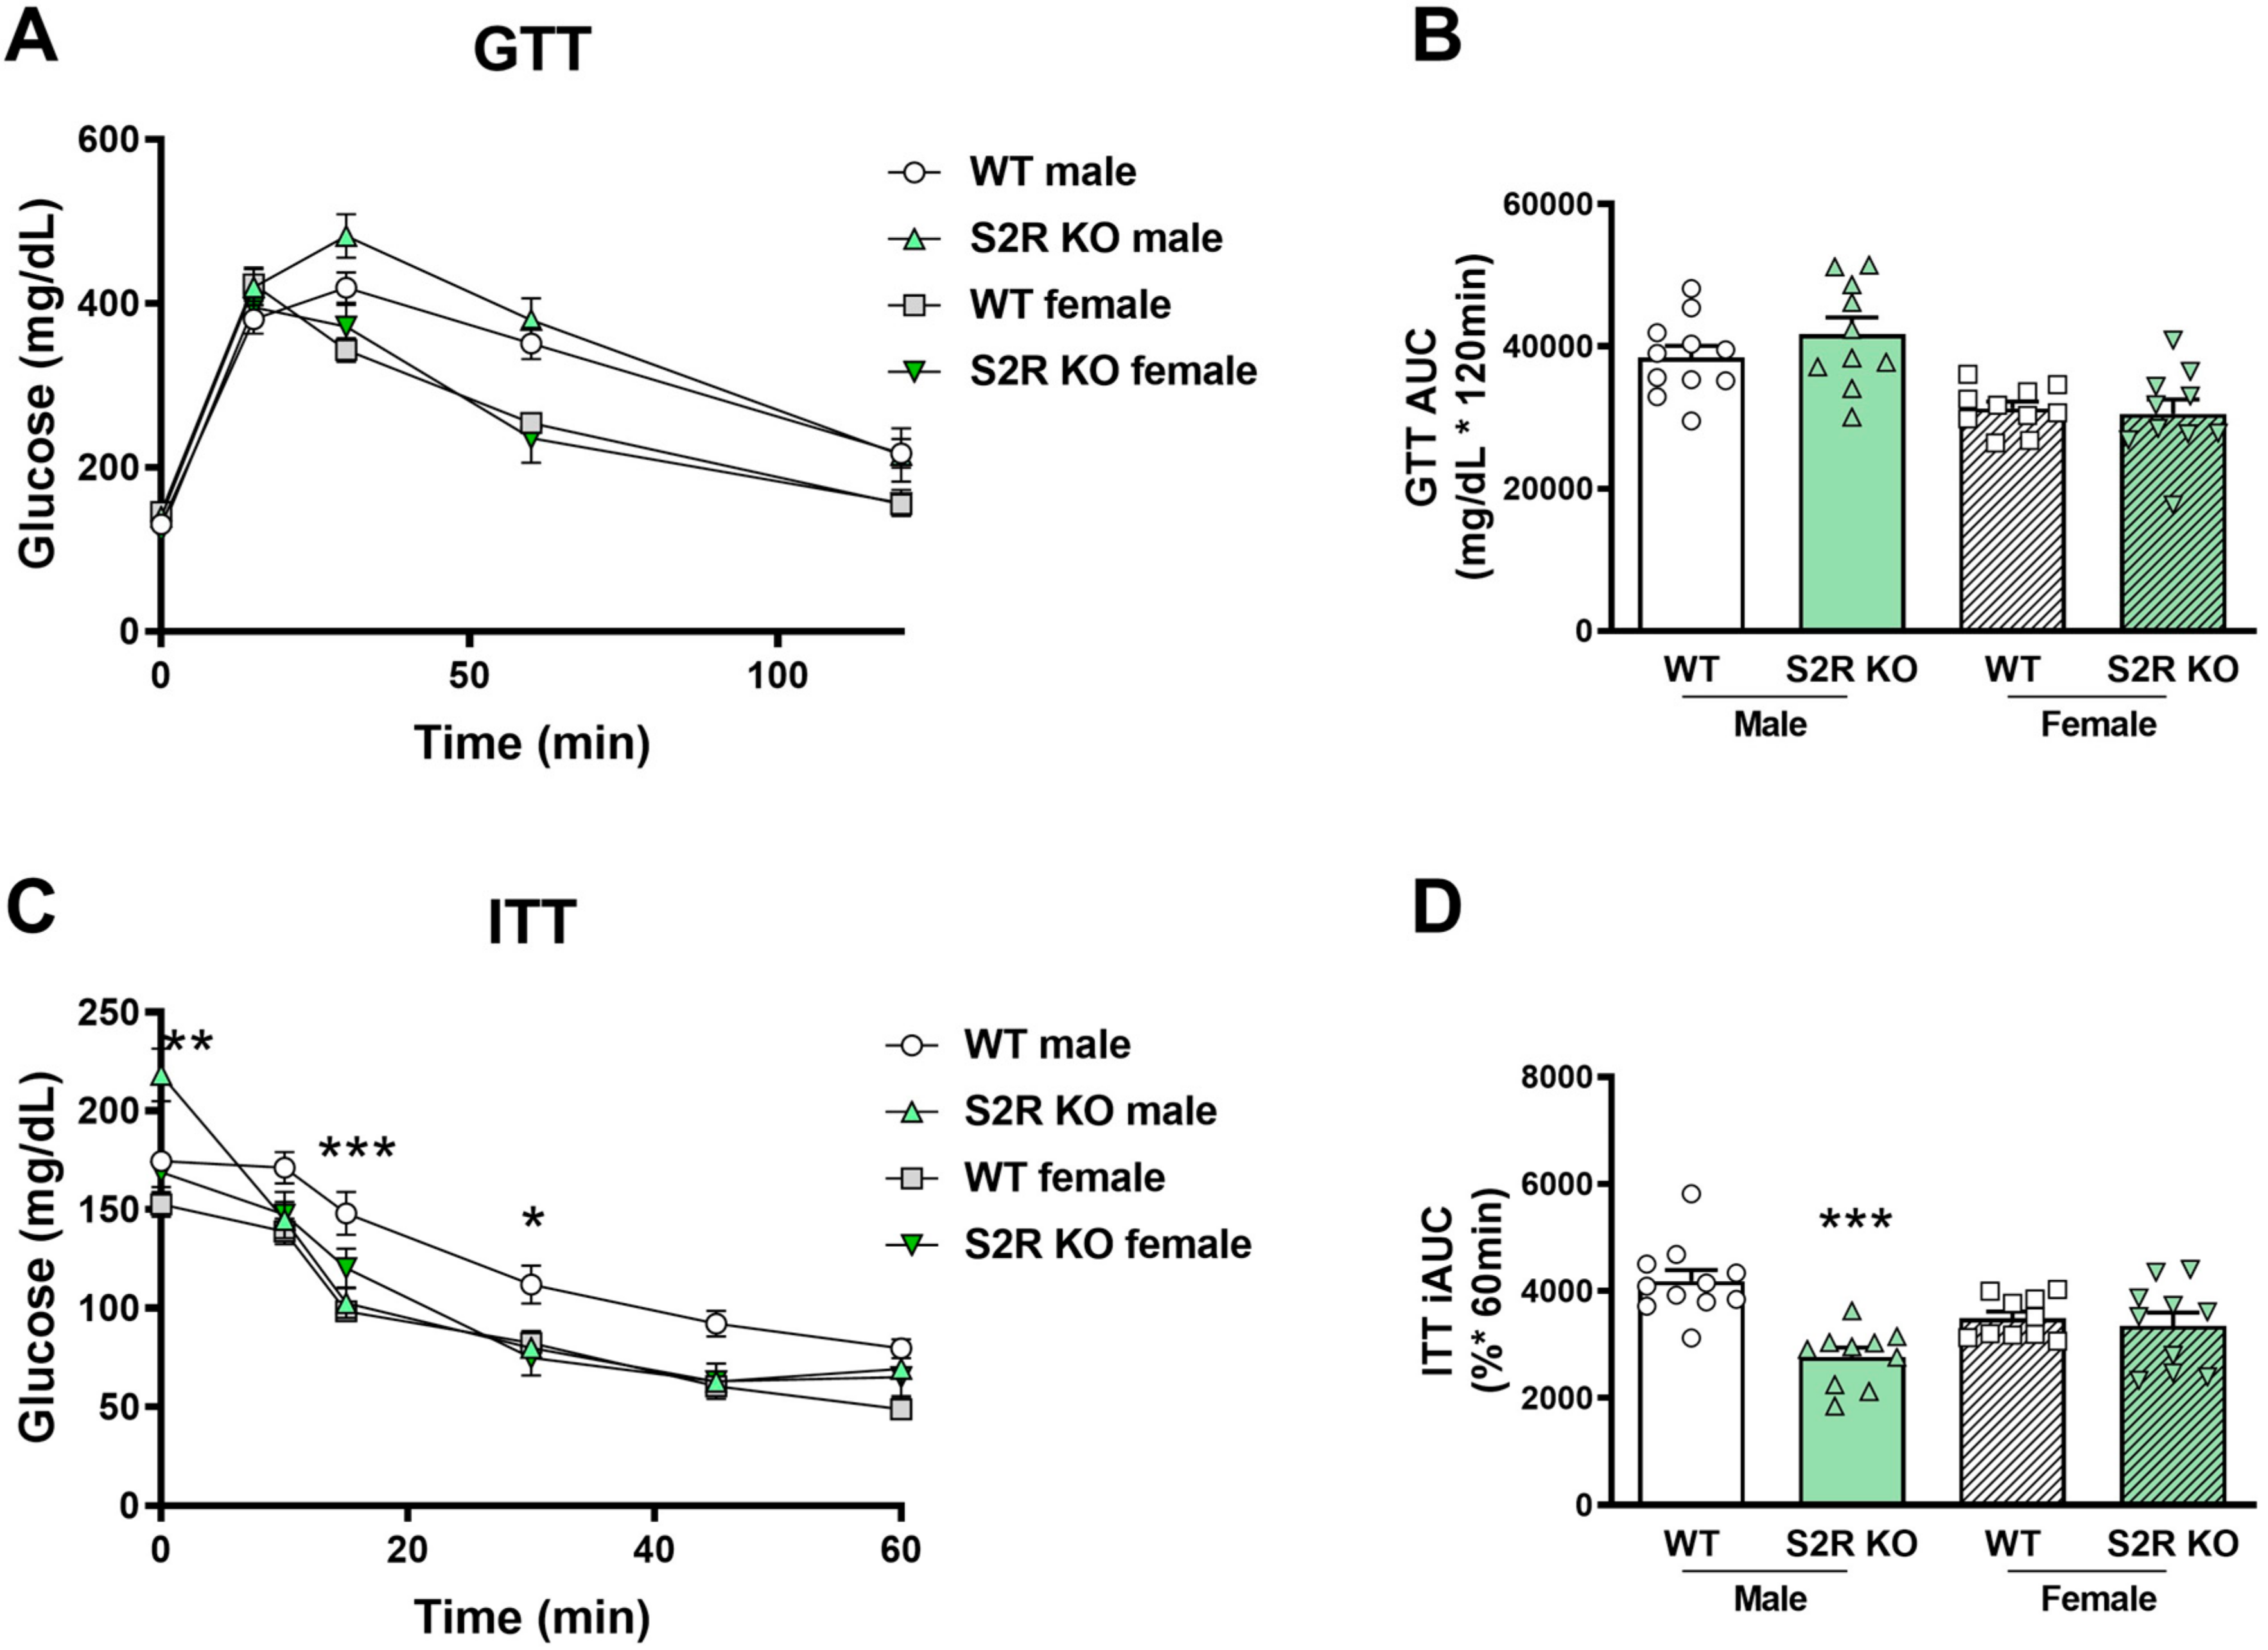
2.3. S2R Ablation in Male Mice Improves Insulin Tolerance
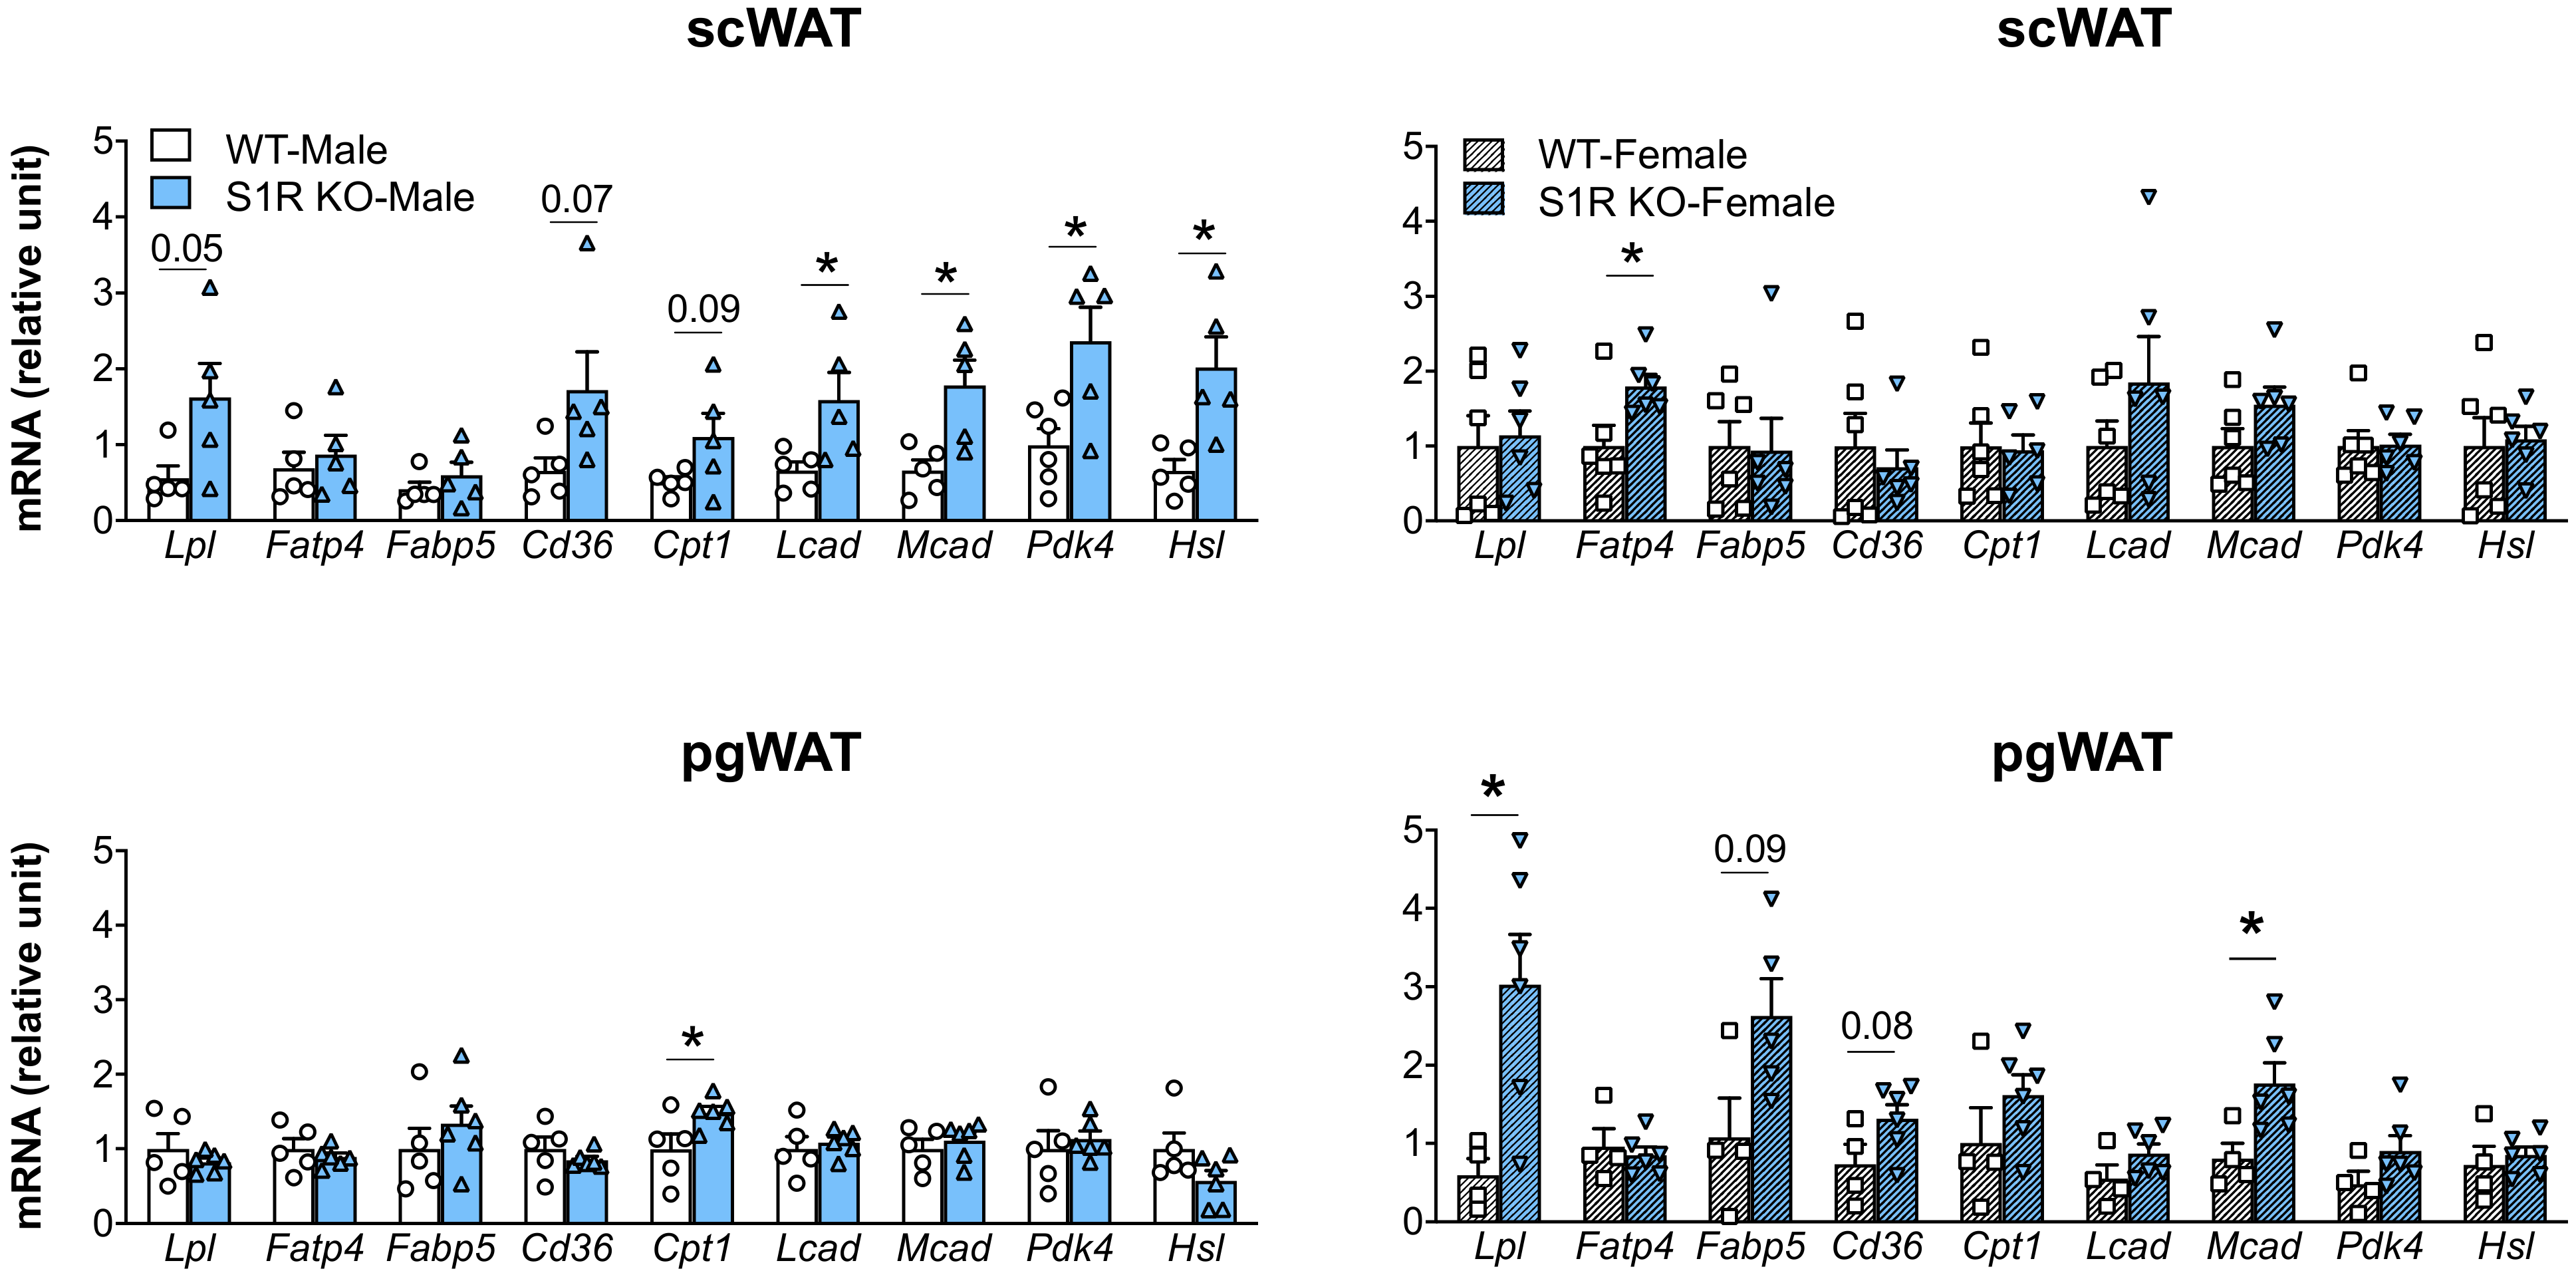
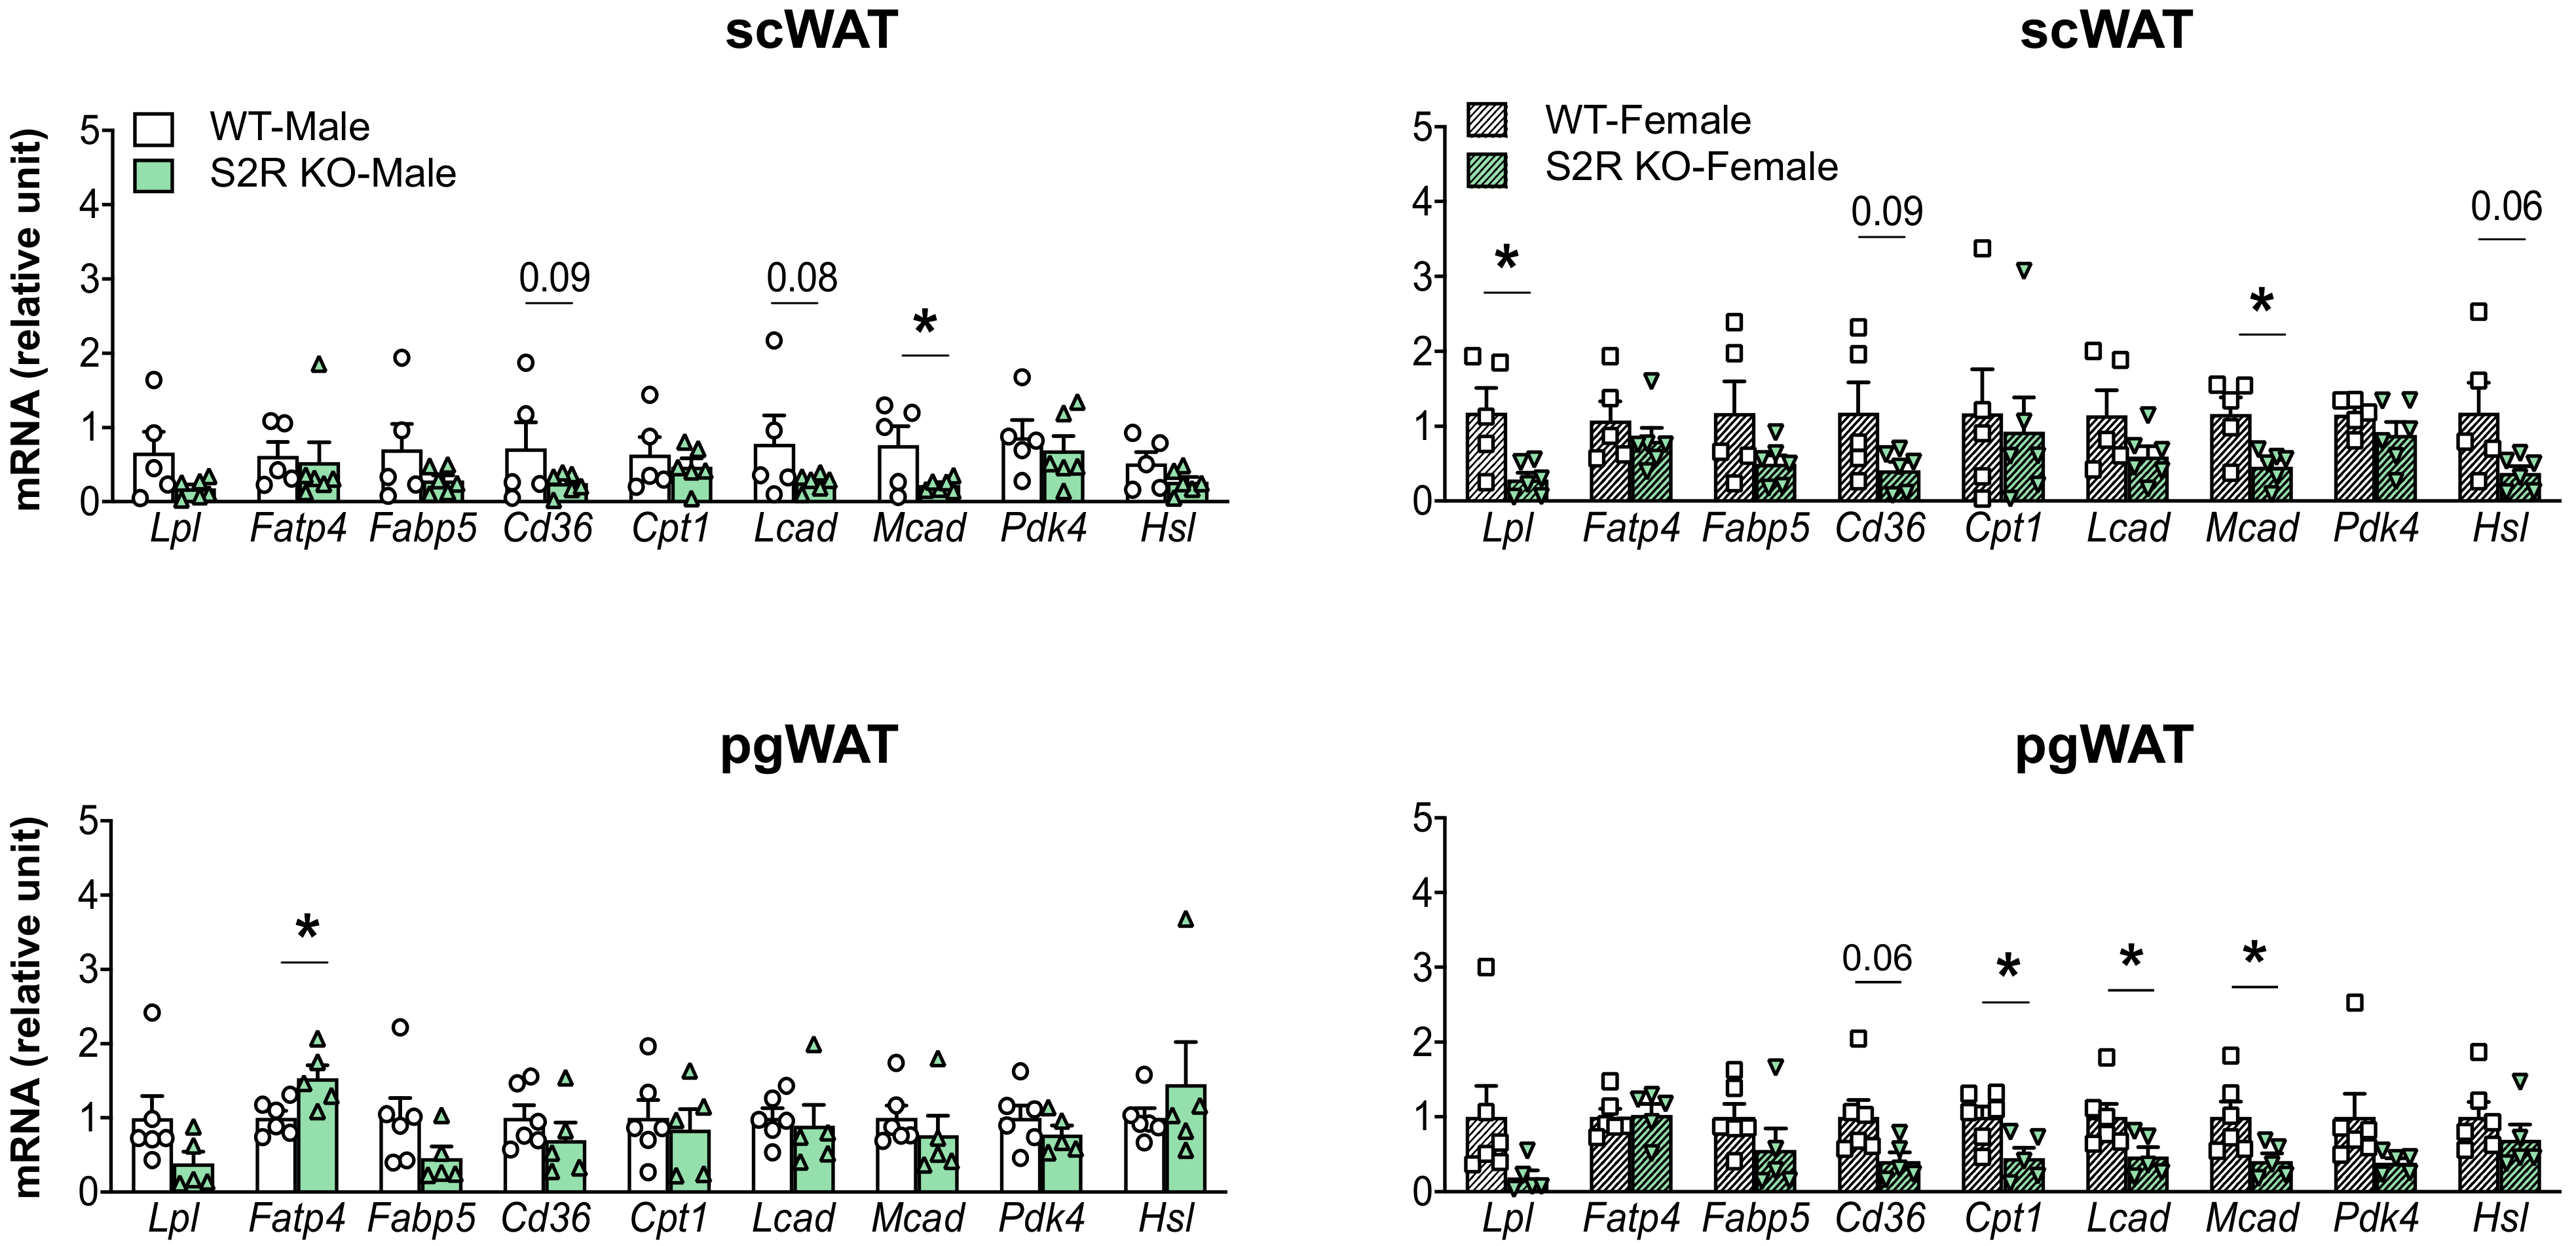
2.4. Sigma-Receptor Ablation Alters the Expression of Genes Involved in Lipolysis and Fatty-Acid Oxidation
3. Discussion
4. Materials and Methods
4.1. Animals
4.2. Sigmar1−/− and Sigmar1+/+ Mice
4.3. Tmem97−/− and Tmem97+/+ Mice
4.4. High-Fat-Diet Feeding
4.5. Assessments of Live Animal Body Composition
4.6. Measurements of Whole-Body Metabolism
4.7. Biochemical Methods
4.8. Glucose-Tolerance and Insulin-Tolerance Tests
4.9. Statistical Analysis
5. Conclusions
Supplementary Materials
Author Contributions
Funding
Institutional Review Board Statement
Informed Consent Statement
Conflicts of Interest
References
- Scherer, P.E.; Hill, J.A. Obesity, Diabetes, and Cardiovascular Diseases: A Compendium. Circ. Res. 2016, 118, 1703–1705. [Google Scholar] [CrossRef]
- Su, T.P.; Hayashi, T.; Maurice, T.; Buch, S.; Ruoho, A.E. The sigma-1 receptor chaperone as an inter-organelle signaling modulator. Trends Pharmacol. Sci. 2010, 31, 557–566. [Google Scholar] [CrossRef] [PubMed]
- Schmidt, H.R.; Kruse, A.C. The Molecular Function of sigma Receptors: Past, Present, and Future. Trends Pharmacol. Sci. 2019, 40, 636–654. [Google Scholar] [CrossRef] [PubMed]
- Hellewell, S.B.; Bowen, W.D. A sigma-like binding site in rat pheochromocytoma (PC12) cells: Decreased affinity for (+)-benzomorphans and lower molecular weight suggest a different sigma receptor form from that of guinea pig brain. Brain Res. 1990, 527, 244–253. [Google Scholar] [CrossRef]
- Alon, A.; Schmidt, H.R.; Wood, M.D.; Sahn, J.J.; Martin, S.F.; Kruse, A.C. Identification of the gene that codes for the sigma2 receptor. Proc. Natl. Acad. Sci. USA 2017, 114, 7160–7165. [Google Scholar] [CrossRef]
- Chu, U.B.; Mavlyutov, T.A.; Chu, M.L.; Yang, H.; Schulman, A.; Mesangeau, C.; McCurdy, C.R.; Guo, L.W.; Ruoho, A.E. The Sigma-2 Receptor and Progesterone Receptor Membrane Component 1 are Different Binding Sites Derived From Independent Genes. EBioMedicine 2015, 2, 1806–1813. [Google Scholar] [CrossRef] [PubMed]
- Hanner, M.; Moebius, F.F.; Flandorfer, A.; Knaus, H.G.; Striessnig, J.; Kempner, E.; Glossmann, H. Purification, molecular cloning, and expression of the mammalian sigma1-binding site. Proc. Natl. Acad. Sci. USA 1996, 93, 8072–8077. [Google Scholar] [CrossRef]
- Alon, A.; Lyu, J.; Braz, J.M.; Tummino, T.A.; Craik, V.; O’Meara, M.J.; Webb, C.M.; Radchenko, D.S.; Moroz, Y.S.; Huang, X.P.; et al. Structures of the sigma2 receptor enable docking for bioactive ligand discovery. Nature 2021, 600, 759–764. [Google Scholar] [CrossRef]
- Schmidt, H.R.; Zheng, S.; Gurpinar, E.; Koehl, A.; Manglik, A.; Kruse, A.C. Crystal structure of the human sigma1 receptor. Nature 2016, 532, 527–530. [Google Scholar] [CrossRef]
- Fontanilla, D.; Johannessen, M.; Hajipour, A.R.; Cozzi, N.V.; Jackson, M.B.; Ruoho, A.E. The hallucinogen N,N-dimethyltryptamine (DMT) is an endogenous sigma-1 receptor regulator. Science 2009, 323, 934–937. [Google Scholar] [CrossRef] [Green Version]
- Maurice, T. Bi-phasic dose response in the preclinical and clinical developments of sigma-1 receptor ligands for the treatment of neurodegenerative disorders. Expert Opin. Drug Discov. 2021, 16, 373–389. [Google Scholar] [CrossRef] [PubMed]
- Wang, J.; Saul, A.; Roon, P.; Smith, S.B. Activation of the molecular chaperone, sigma 1 receptor, preserves cone function in a murine model of inherited retinal degeneration. Proc. Natl. Acad. Sci. USA 2016, 113, E3764–E3772. [Google Scholar] [CrossRef]
- Calusic, M.; Marcec, R.; Luksa, L.; Jurkovic, I.; Kovac, N.; Mihaljevic, S.; Likic, R. Safety and efficacy of fluvoxamine in COVID-19 ICU patients: An open label, prospective cohort trial with matched controls. Br. J. Clin. Pharmacol. 2022, 88, 2065–2073. [Google Scholar] [CrossRef] [PubMed]
- Kumar, S.; Javed, R.; Mudd, M.; Pallikkuth, S.; Lidke, K.A.; Jain, A.; Tangavelou, K.; Gudmundsson, S.R.; Ye, C.; Rusten, T.E.; et al. Mammalian hybrid pre-autophagosomal structure HyPAS generates autophagosomes. Cell 2021, 184, 5950–5969.e22. [Google Scholar] [CrossRef] [PubMed]
- Yang, H.; Shen, H.; Li, J.; Stanford, K.I.; Guo, L.W. Sigma-1 receptor ablation impedes adipocyte-like differentiation of mouse embryonic fibroblasts. Cell. Signal. 2020, 75, 109732. [Google Scholar] [CrossRef]
- Hayashi, T.; Hayashi, E.; Fujimoto, M.; Sprong, H.; Su, T.P. The lifetime of UDP-galactose:ceramide galactosyltransferase is controlled by a distinct endoplasmic reticulum-associated degradation (ERAD) regulated by sigma-1 receptor chaperones. J. Biol. Chem. 2012, 287, 43156–43169. [Google Scholar] [CrossRef]
- Hayashi, T.; Su, T.P. Sigma-1 receptors (sigma(1) binding sites) form raft-like microdomains and target lipid droplets on the endoplasmic reticulum: Roles in endoplasmic reticulum lipid compartmentalization and export. J. Pharmacol. Exp. Ther. 2003, 306, 718–725. [Google Scholar] [CrossRef]
- Aishwarya, R.; Abdullah, C.S.; Morshed, M.; Remex, N.S.; Bhuiyan, M.S. Sigmar1’s Molecular, Cellular, and Biological Functions in Regulating Cellular Pathophysiology. Front. Physiol. 2021, 12, 705575. [Google Scholar] [CrossRef]
- Izzo, N.J.; Colom-Cadena, M.; Riad, A.A.; Xu, J.; Singh, M.; Abate, C.; Cahill, M.A.; Spires-Jones, T.L.; Bowen, W.D.; Mach, R.H.; et al. Proceedings from the Fourth International Symposium on sigma-2 Receptors: Role in Health and Disease. eNeuro 2020, 7. [Google Scholar] [CrossRef]
- Bartz, F.; Kern, L.; Erz, D.; Zhu, M.; Gilbert, D.; Meinhof, T.; Wirkner, U.; Erfle, H.; Muckenthaler, M.; Pepperkok, R.; et al. Identification of cholesterol-regulating genes by targeted RNAi screening. Cell Metab. 2009, 10, 63–75. [Google Scholar] [CrossRef] [Green Version]
- Riad, A.; Zeng, C.; Weng, C.C.; Winters, H.; Xu, K.; Makvandi, M.; Metz, T.; Carlin, S.; Mach, R.H. Sigma-2 Receptor/TMEM97 and PGRMC-1 Increase the Rate of Internalization of LDL by LDL Receptor through the Formation of a Ternary Complex. Sci. Rep. 2018, 8, 16845. [Google Scholar] [CrossRef] [PubMed]
- Shen, H.; Li, J.; Xie, X.; Yang, H.; Zhang, M.; Wang, B.; Kent, K.C.; Plutzky, J.; Guo, L.W. BRD2 regulation of sigma-2 receptor upon cholesterol deprivation. Life Sci. Alliance 2021, 4. [Google Scholar] [CrossRef]
- Sanchez-Blazquez, P.; Cortes-Montero, E.; Rodriguez-Munoz, M.; Merlos, M.; Garzon-Nino, J. The Sigma 2 receptor promotes and the Sigma 1 receptor inhibits mu-opioid receptor-mediated antinociception. Mol. Brain 2020, 13, 150. [Google Scholar] [CrossRef] [PubMed]
- Zeng, C.; Weng, C.C.; Schneider, M.E., Jr.; Puentes, L.; Riad, A.; Xu, K.; Makvandi, M.; Jin, L.; Hawkins, W.G.; Mach, R.H. TMEM97 and PGRMC1 do not mediate sigma-2 ligand-induced cell death. Cell Death Discov. 2019, 5, 58. [Google Scholar] [CrossRef]
- Tenta, M.; Eguchi, J.; Wada, J. Roles of Transmembrane Protein 97 (TMEM97) in Adipose Tissue and Skeletal Muscle. Acta Med. Okayama 2022, 76, 235–245. [Google Scholar] [CrossRef] [PubMed]
- Sahlholm, K.; Liao, F.; Holtzman, D.M.; Xu, J.; Mach, R.H. Sigma-2 receptor binding is decreased in female, but not male, APP/PS1 mice. Biochem. Biophys. Res. Commun. 2015, 460, 439–445. [Google Scholar] [CrossRef]
- Skuza, G. Potential antidepressant activity of sigma ligands. Pol. J. Pharmacol. 2003, 55, 923–934. [Google Scholar]
- Ramachandran, S.; Chu, U.B.; Mavlyutov, T.A.; Pal, A.; Pyne, S.; Ruoho, A.E. The sigma1 receptor interacts with N-alkyl amines and endogenous sphingolipids. Eur. J. Pharmacol. 2009, 609, 19–26. [Google Scholar] [CrossRef]
- Zhemkov, V.; Ditlev, J.A.; Lee, W.R.; Wilson, M.; Liou, J.; Rosen, M.K.; Bezprozvanny, I. The role of sigma 1 receptor in organization of endoplasmic reticulum signaling microdomains. Elife 2021, 10, e65192. [Google Scholar] [CrossRef]
- Hayashi, T.; Fujimoto, M. Detergent-resistant microdomains determine the localization of sigma-1 receptors to the endoplasmic reticulum-mitochondria junction. Mol. Pharmacol. 2010, 77, 517–528. [Google Scholar] [CrossRef]
- Schmidt, H.R.; Betz, R.M.; Dror, R.O.; Kruse, A.C. Structural basis for sigma1 receptor ligand recognition. Nat. Struct. Mol. Biol. 2018, 25, 981–987. [Google Scholar] [CrossRef]
- Cheng, Y.S.; Zhang, T.; Ma, X.; Pratuangtham, S.; Zhang, G.C.; Ondrus, A.A.; Mafi, A.; Lomenick, B.; Jones, J.J.; Ondrus, A.E. A proteome-wide map of 20(S)-hydroxycholesterol interactors in cell membranes. Nat. Chem. Biol. 2021, 17, 1271–1280. [Google Scholar] [CrossRef] [PubMed]
- Shen, H.; Li, J.; Heisler-Taylor, T.; Makin, R.; Yang, H.; Mavlyutov, T.A.; Gelfand, B.; Cebulla, C.M.; Guo, L.W. TMEM97 ablation aggravates oxidant-induced retinal degeneration. Cell. Signal. 2021, 86, 110078. [Google Scholar] [CrossRef] [PubMed]
- Peres Valgas da Silva, C.; Shettigar, V.K.; Baer, L.A.; Abay, E.; Madaris, K.L.; Mehling, M.R.; Hernandez-Saavedra, D.; Pinckard, K.M.; Seculov, N.P.; Ziolo, M.T.; et al. Brown adipose tissue prevents glucose intolerance and cardiac remodeling in high-fat-fed mice after a mild myocardial infarction. Int. J. Obes. 2022, 46, 350–358. [Google Scholar] [CrossRef] [PubMed]
- Lessard, S.J.; Rivas, D.A.; Alves-Wagner, A.B.; Hirshman, M.F.; Gallagher, I.J.; Constantin-Teodosiu, D.; Atkins, R.; Greenhaff, P.L.; Qi, N.R.; Gustafsson, T.; et al. Resistance to aerobic exercise training causes metabolic dysfunction and reveals novel exercise-regulated signaling networks. Diabetes 2013, 62, 2717–2727. [Google Scholar] [CrossRef] [PubMed] [Green Version]


Publisher’s Note: MDPI stays neutral with regard to jurisdictional claims in published maps and institutional affiliations. |
© 2022 by the authors. Licensee MDPI, Basel, Switzerland. This article is an open access article distributed under the terms and conditions of the Creative Commons Attribution (CC BY) license (https://creativecommons.org/licenses/by/4.0/).
Share and Cite
Li, J.; Félix-Soriano, E.; Wright, K.R.; Shen, H.; Baer, L.A.; Stanford, K.I.; Guo, L.-W. Differential Responses to Sigma-1 or Sigma-2 Receptor Ablation in Adiposity, Fat Oxidation, and Sexual Dimorphism. Int. J. Mol. Sci. 2022, 23, 10846. https://doi.org/10.3390/ijms231810846
Li J, Félix-Soriano E, Wright KR, Shen H, Baer LA, Stanford KI, Guo L-W. Differential Responses to Sigma-1 or Sigma-2 Receptor Ablation in Adiposity, Fat Oxidation, and Sexual Dimorphism. International Journal of Molecular Sciences. 2022; 23(18):10846. https://doi.org/10.3390/ijms231810846
Chicago/Turabian StyleLi, Jing, Elisa Félix-Soriano, Katherine R. Wright, Hongtao Shen, Lisa A. Baer, Kristin I. Stanford, and Lian-Wang Guo. 2022. "Differential Responses to Sigma-1 or Sigma-2 Receptor Ablation in Adiposity, Fat Oxidation, and Sexual Dimorphism" International Journal of Molecular Sciences 23, no. 18: 10846. https://doi.org/10.3390/ijms231810846