1. Introduction
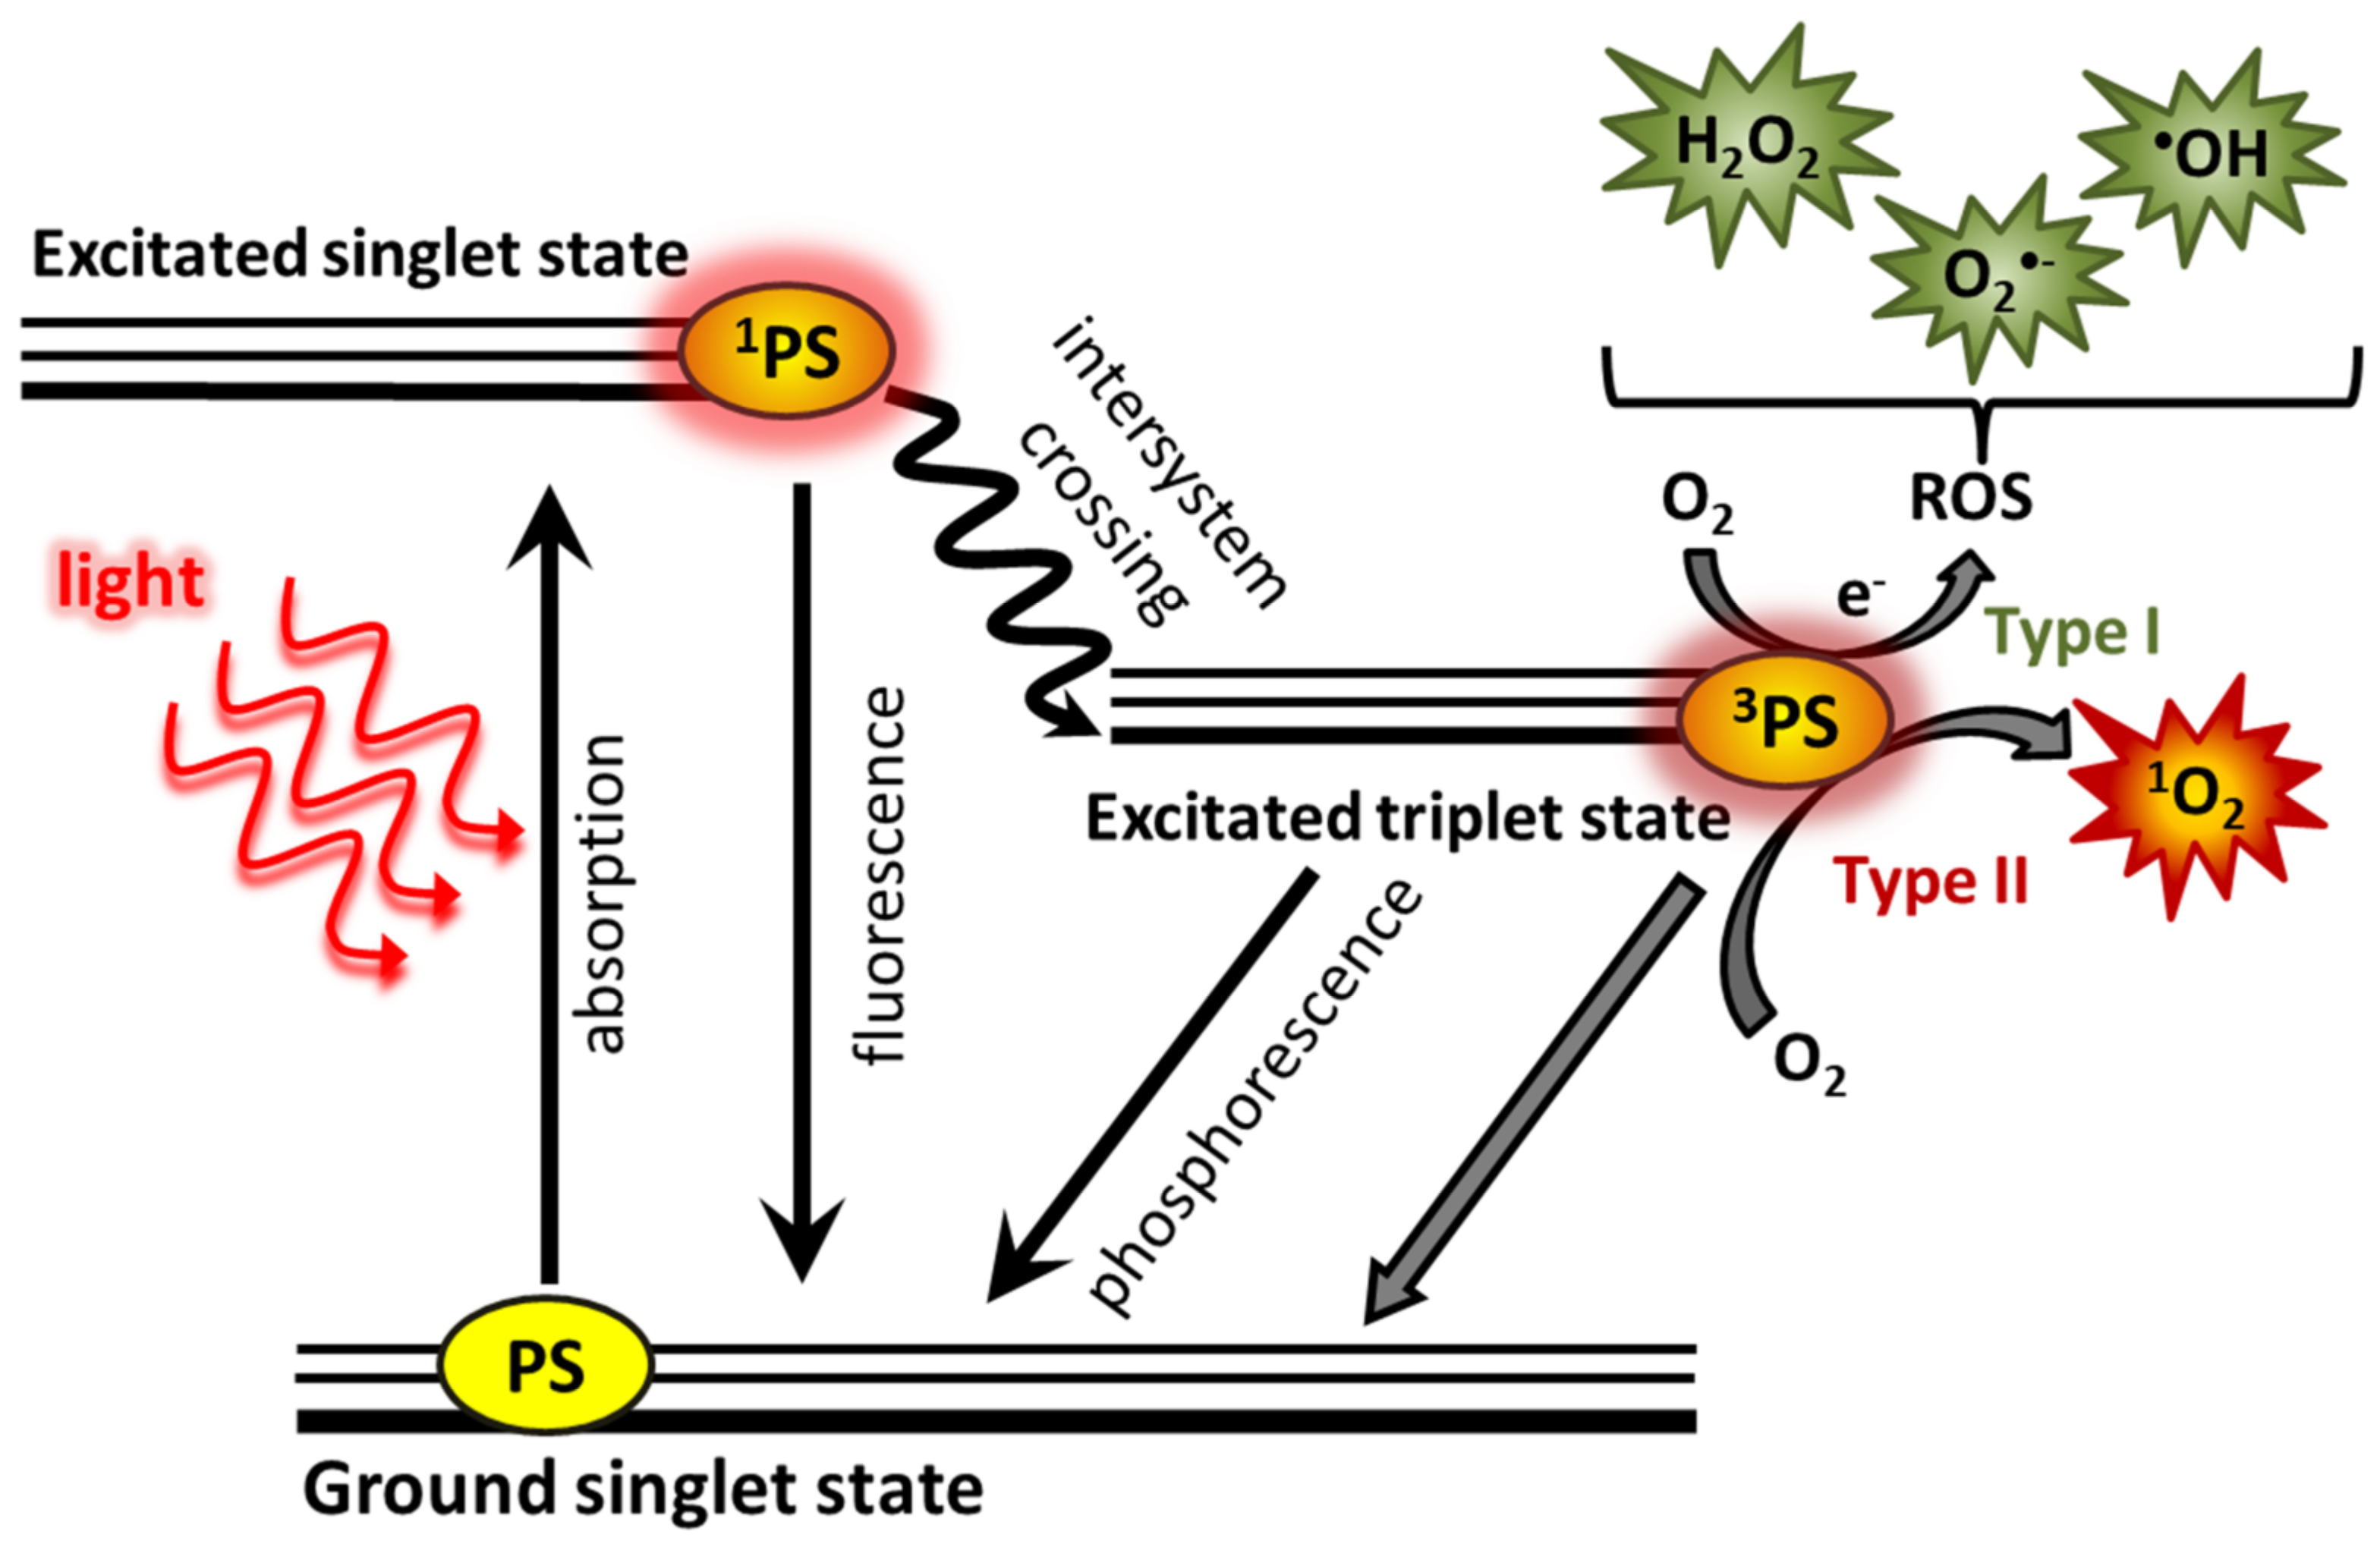
Photodynamic therapy (PDT) is one of the less invasive treatment methods [
1] causing the death of cancer cells [
1,
2]. A photosensitizer (PS) applied to the patient accumulates in tumor cells and its vascularity. PS is activated under the appropriate wavelength of light and oxygen, leading to the destruction of the tumor. The activation of PS takes place through the absorption of a photon, causing its transition to a singlet excited state with low stability. PS in the singlet state can return to the ground state through the energy loss by fluorescence. This phenomenon can be used for the detection and delineation of a tumor [
1,
3]. Alternatively, activated PS may lose some energy through a non-radiative transition to the excited triplet state, which has a longer lifetime than the excited singlet state [
4]. Further loss of photosensitizer energy may occur through phosphorescence or as a result of collisions with other molecules in two types of reactions, type I and type II. These reactions lead to the formation of reactive forms (
Figure 1) [
1].
In the type I reaction, PS receive an electron or a proton which lead to the formation of radicals and ion radicals [
1,
4]. Typically, PS reacts with the electron supplying substrate [
1] (e.g., NADPH, guanine in nucleic acids, and tryptophan and tyrosine in proteins) to form photosensitizer anion radical (PS
•−) and biomolecule cation radical (biomolecule
•+). In the oxygen environment, PS
•− transfers its additional electron to molecular oxygen, creating a superoxide radical anion (O
2•−), which restores PS to the ground state [
5].
Superoxide can oxidize small molecules and reacts with cellular radicals, releasing potentially cytotoxic products. In reaction with NO
•, it forms a strong oxidant-peroxynitrite (ONOO
−). This product reacts with CO
2 and bicarbonates to form nitrosoperoxycarbonate (ONOOCO
2−), a precursor of the carbonate radical anion (CO
3•−), which may abstract electrons from tyrosine and tryptophan [
5].
Furthermore, superoxide can lead to oxidation of [4Fe–4S] clusters located in proteins. These proteins are mainly dehydratases and Krebs cycle enzymes. The destruction of [4Fe–4S] clusters causes the inactivation of such proteins and affects the metabolic pathways in which they are involved. Moreover, iron released from [4Fe–4S] clusters bind to anionic molecules such as proteins, nucleic acids, lipids and other components of the cell membrane and is maintained in reduced form Fe
2+ by cellular reductants. Upon encountering hydrogen peroxide (H
2O
2), it creates a strong oxidizing hydroxyl radical (HO
•) via the Fenton reaction. HO
• can also be generated in the reaction of H
2O
2 reduction by the anion radical of the photosensitizer (PS
•−). Due to its very high reactivity, HO
• damages objects that it encounters at the site of its creation [
5].
When PS absorbs hydrogen, neutral radicals of the photosensitizer (PS
•) and biomolecules (biomolecule
•) are formed. In the presence of oxygen, hydrogen is transferred from the photosensitizer radical to molecular oxygen, leading to the formation of the hydroperoxide radical (HO
2•) and the restoration of PS in its grand state [
4].
In the type II reaction, PS in the triplet state transfers energy to molecular oxygen in the triplet state (
3O
2), creating the highly reactive singlet oxygen (
1O
2) [
1], which is considered to be the basic component of PDT [
3,
5] that destroys the tumor and its vascularization [
3]. Singlet oxygen interacts mainly with unsaturated compounds that contain double bonds [
4], it can also react with neutral nucleophiles (such as sulfides and amines) and anions. Reactions with singlet oxygen lead to the formation of peroxides. The decomposition of peroxides generates radicals that can initiate various chemical reactions, producing biologically active products [
5].
Most photosensitizers generate both singlet oxygen and radicals [
5]. Both singlet oxygen and superoxide anion contribute to cytotoxicity, as they can induce damage to lipids, proteins, and nucleic acids [
1]. Cells can protect themselves against this cytotoxicity by increasing antioxidant mechanisms and repair capacity [
6,
7]. However, unlike enzymes that protect against superoxide anion, living organisms have not developed enzymatic antioxidants to remove singlet oxygen [
5].
On the other hand, reactive oxygen species (ROS) function as signaling molecules that may activate various signaling pathways [
8,
9,
10]. Changes in the amount of these molecules may affect cell phenotype and response to treatment, as ROS are involved in cytoskeletal remodeling, proliferation, survival, migration, epithelial-mesenchymal transition (EMT), and drug resistance [
10]. In our previous study, we showed that resistant CAL-39 cells become more elongated after seventh cycle of PDT. We also observed that they detached easier from the plate [
6]. On the other hand, resistance to PDT did not induce any visible morphological changes in A-431 cells [
6]. Nevertheless, they also change their adhesive properties, as they detached harder from the plate.
In this study we show that resistance to PDT may result from changes in ROS level in PDT-resistant cell lines. We also demonstrate that PDT affects cytoskeleton molecules in PDT-sensitive cells and leads to changes in cytoskeleton of PDT-resistant cells. These changes may play an important role in resistance to PDT as both EMT [
10] and increased adhesion may activate survival pathways [
7,
11,
12,
13,
14,
15].
3. Discussion
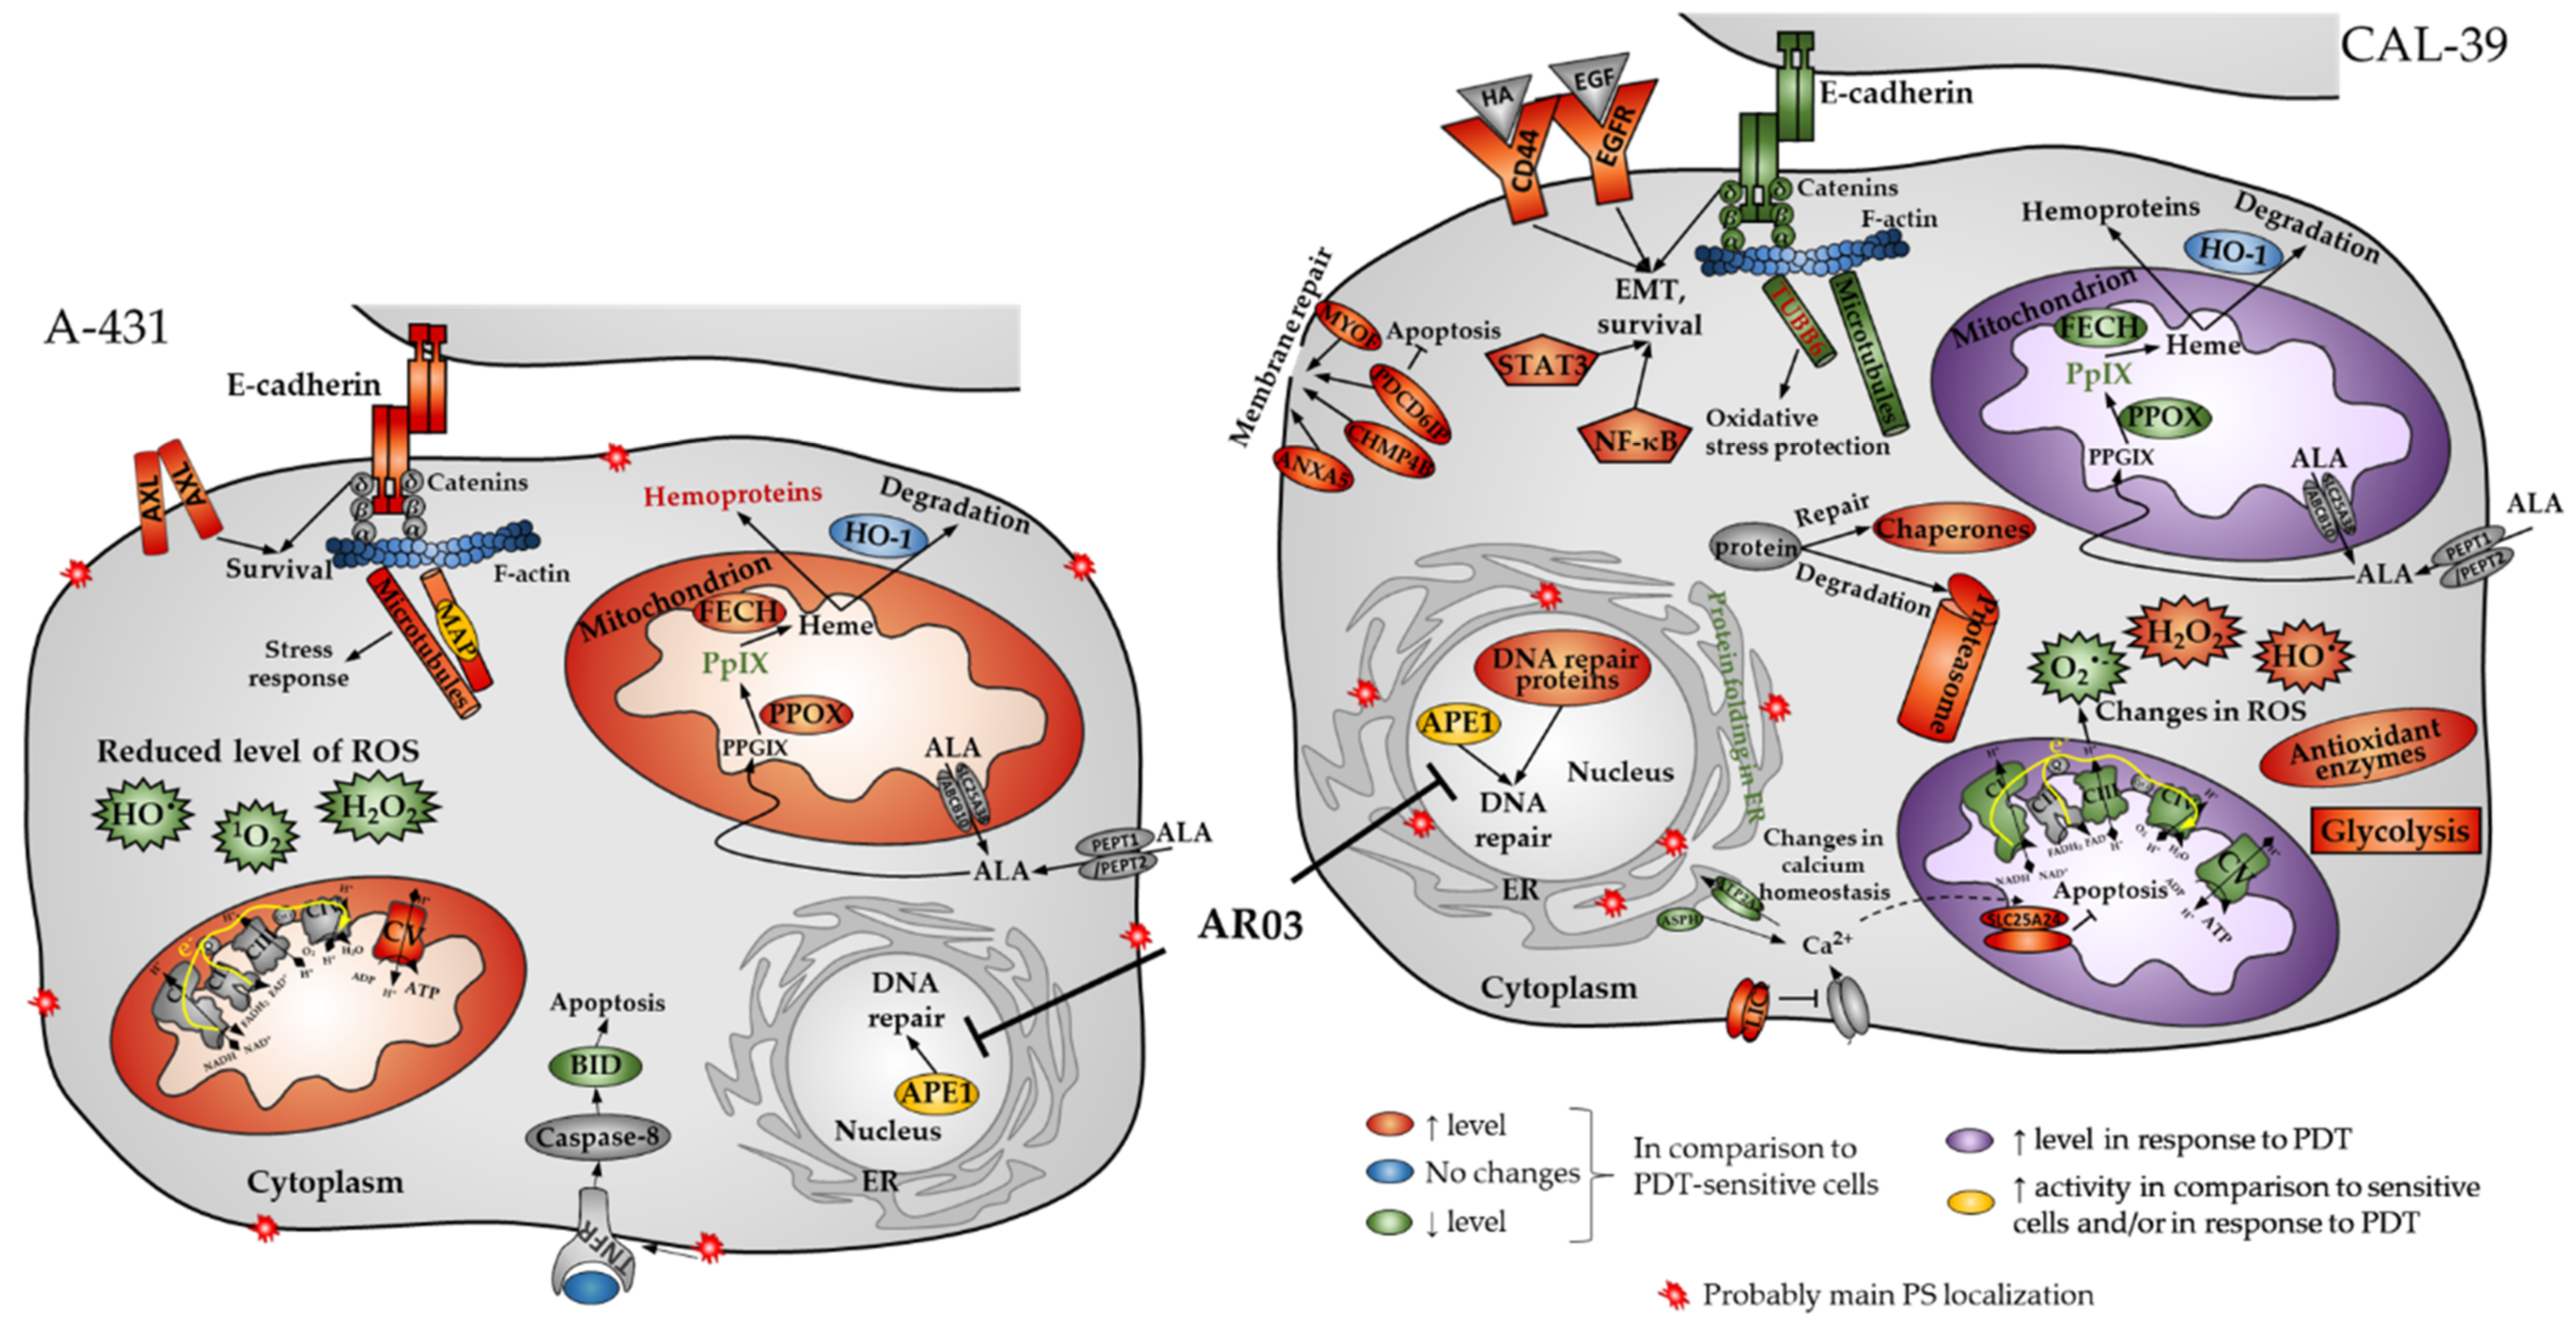
PDT is a valuable method for treating precancerous conditions and early tumors. However, this kind of treatment is not always effective due to developing resistance to the treatment. Understanding the mechanisms of resistance may lead to the development of a more effective approach. Our research using two human vulvar cell lines (A-431 and CAL-39) revealed a number of changes that may contribute to the development of resistance to PDT in vulvar cancer (
Figure 11).
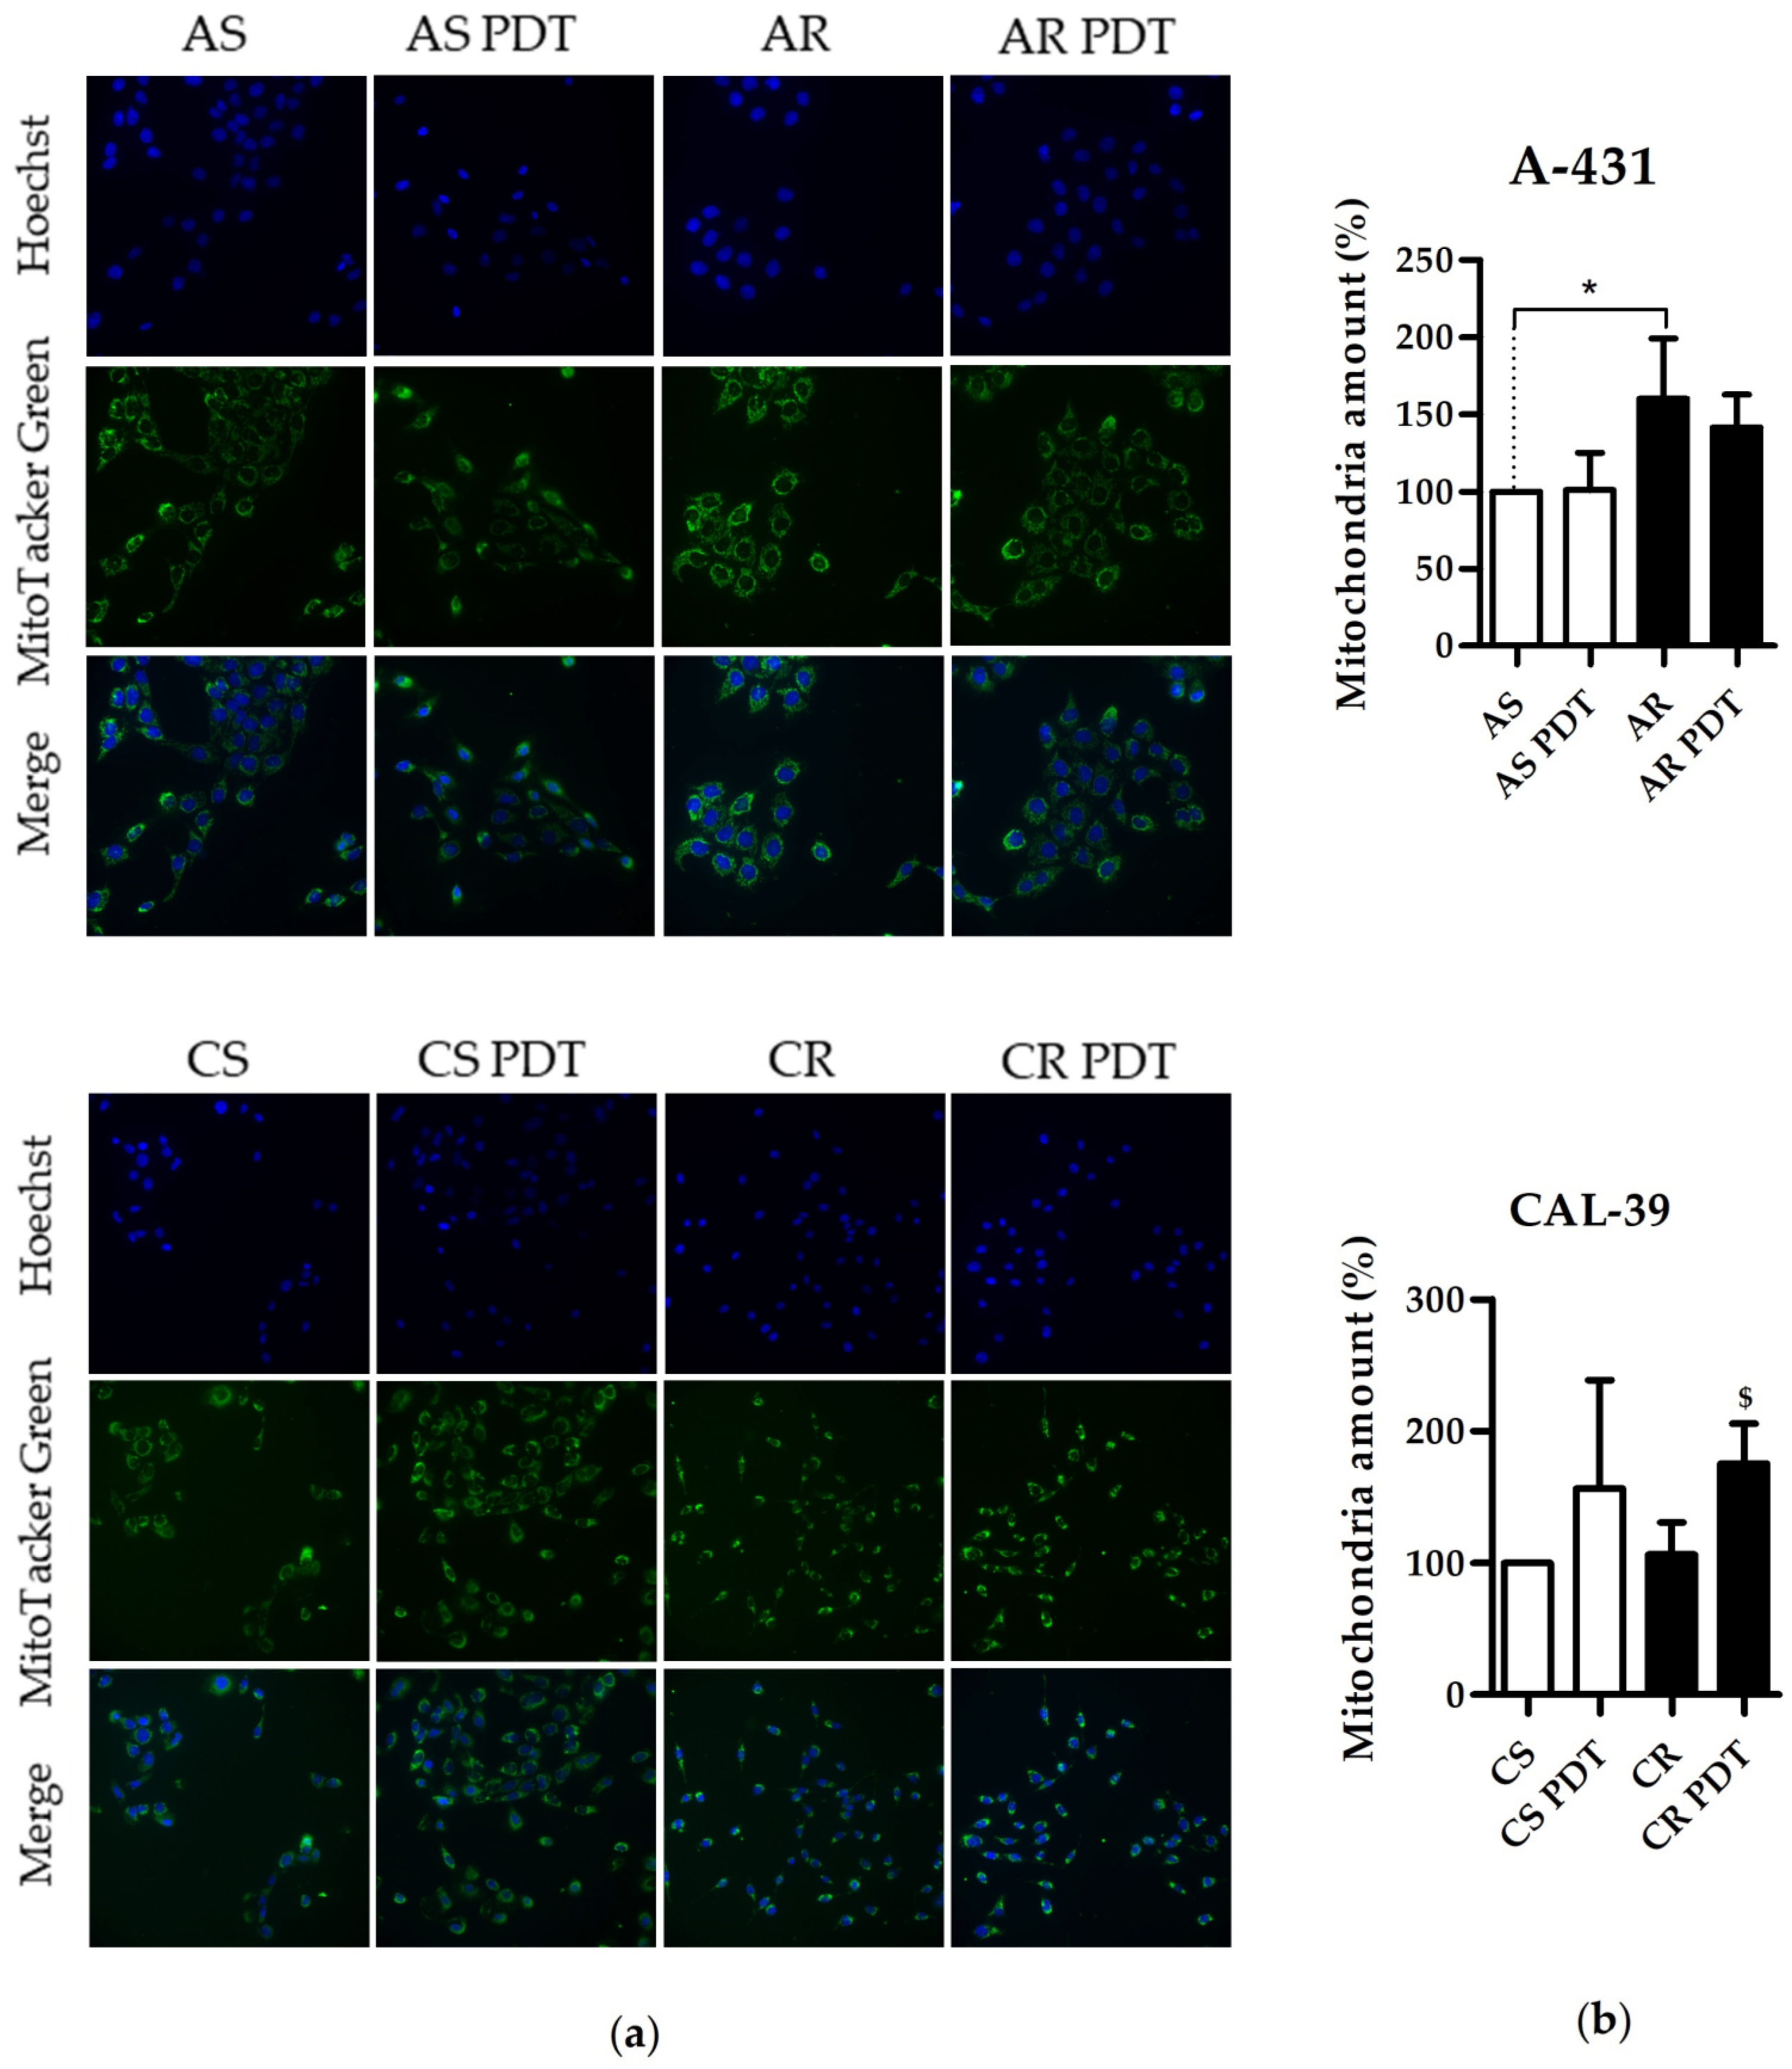
In this work, we showed that resistant A-431 cells are characterized by an increased number of mitochondria in comparison to PDT-sensitive cells (
Figure 7). The increased amount of these organelles in resistant A-431 cells leads to an increased amount of heme metabolism enzymes and a faster conversion of PpIX to heme [
6]. A higher number of mitochondria may also increase the number of enzymes involved in aerobic respiration (
Figure 2,
Supplementary Table S4) and increased respiratory activity (
Supplementary Figure S2). This may result in increased ATP level and cellular metabolism and reduce the effect of PDT.
On the other hand, resistant CAL-39 cells did not show changes in the number of mitochondria compared to parental PDT-sensitive cells but increased the number of mitochondria in response to PDT (
Figure 7). Response to oxidative stress may increase the number of mitochondria to provide energy necessary for cell survival [
26]. However, higher levels of the mitochondrial transporter SLC25A24 (
Supplementary Table S13) may also indicate other mitochondrial function in response to PDT. This protein may assure the protection of cells from death induced by oxidative stress as well as high concentration of calcium ions [
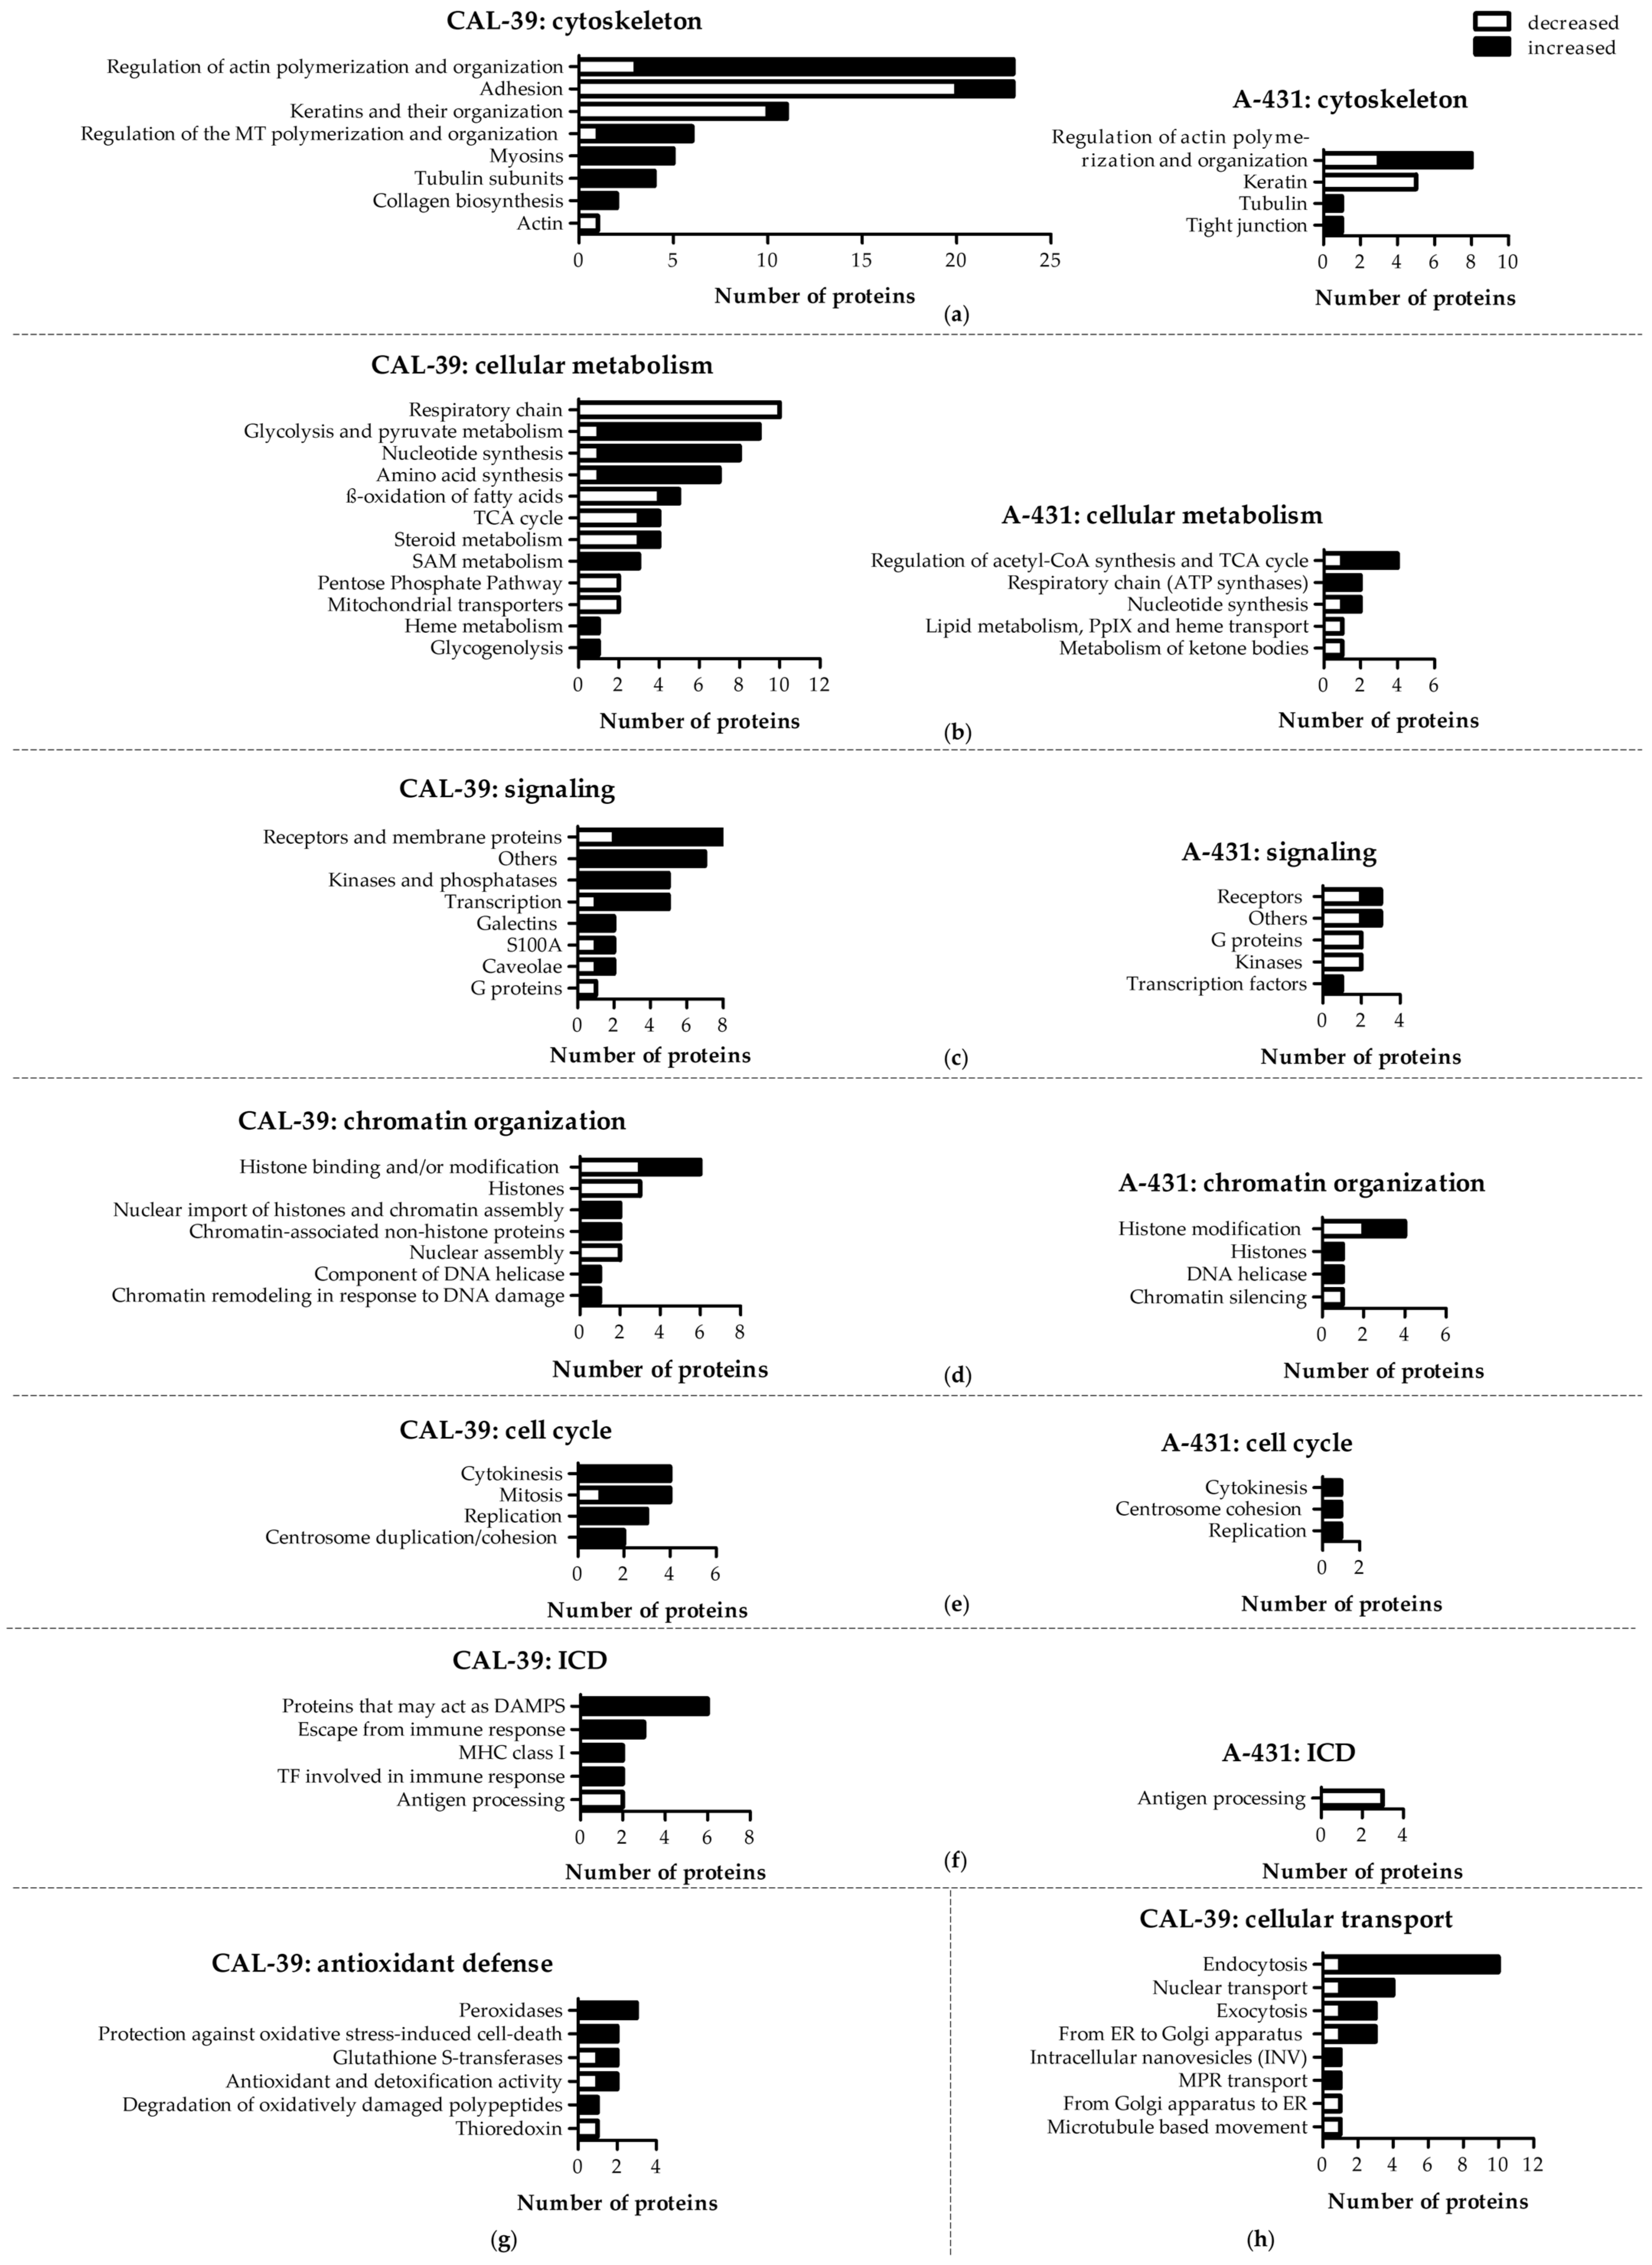
27]. In addition, CAL-39 resistant cells showed changes in the level of numerous mitochondrial proteins and other proteins involved in cellular metabolism. These changes may be associated with metabolic reprogramming. Resistant CAL-39 cells had an increased level of enzymes involved in glycolysis and reduced the amount of oxidative phosphorylation enzymes (
Figure 2,
Supplementary Table S3). This metabolic transition of cells from oxidative phosphorylation to glycolysis is called the Warburg effect and is considered a hallmark of cancer development and progression [
28]. Although this process is much less efficient in terms of ATP production, it provides cancer cells with building blocks for macromolecule synthesis, the necessary redox conditions and the required energy [
29]. This metabolic reprograming also minimizes ROS production in mitochondria [
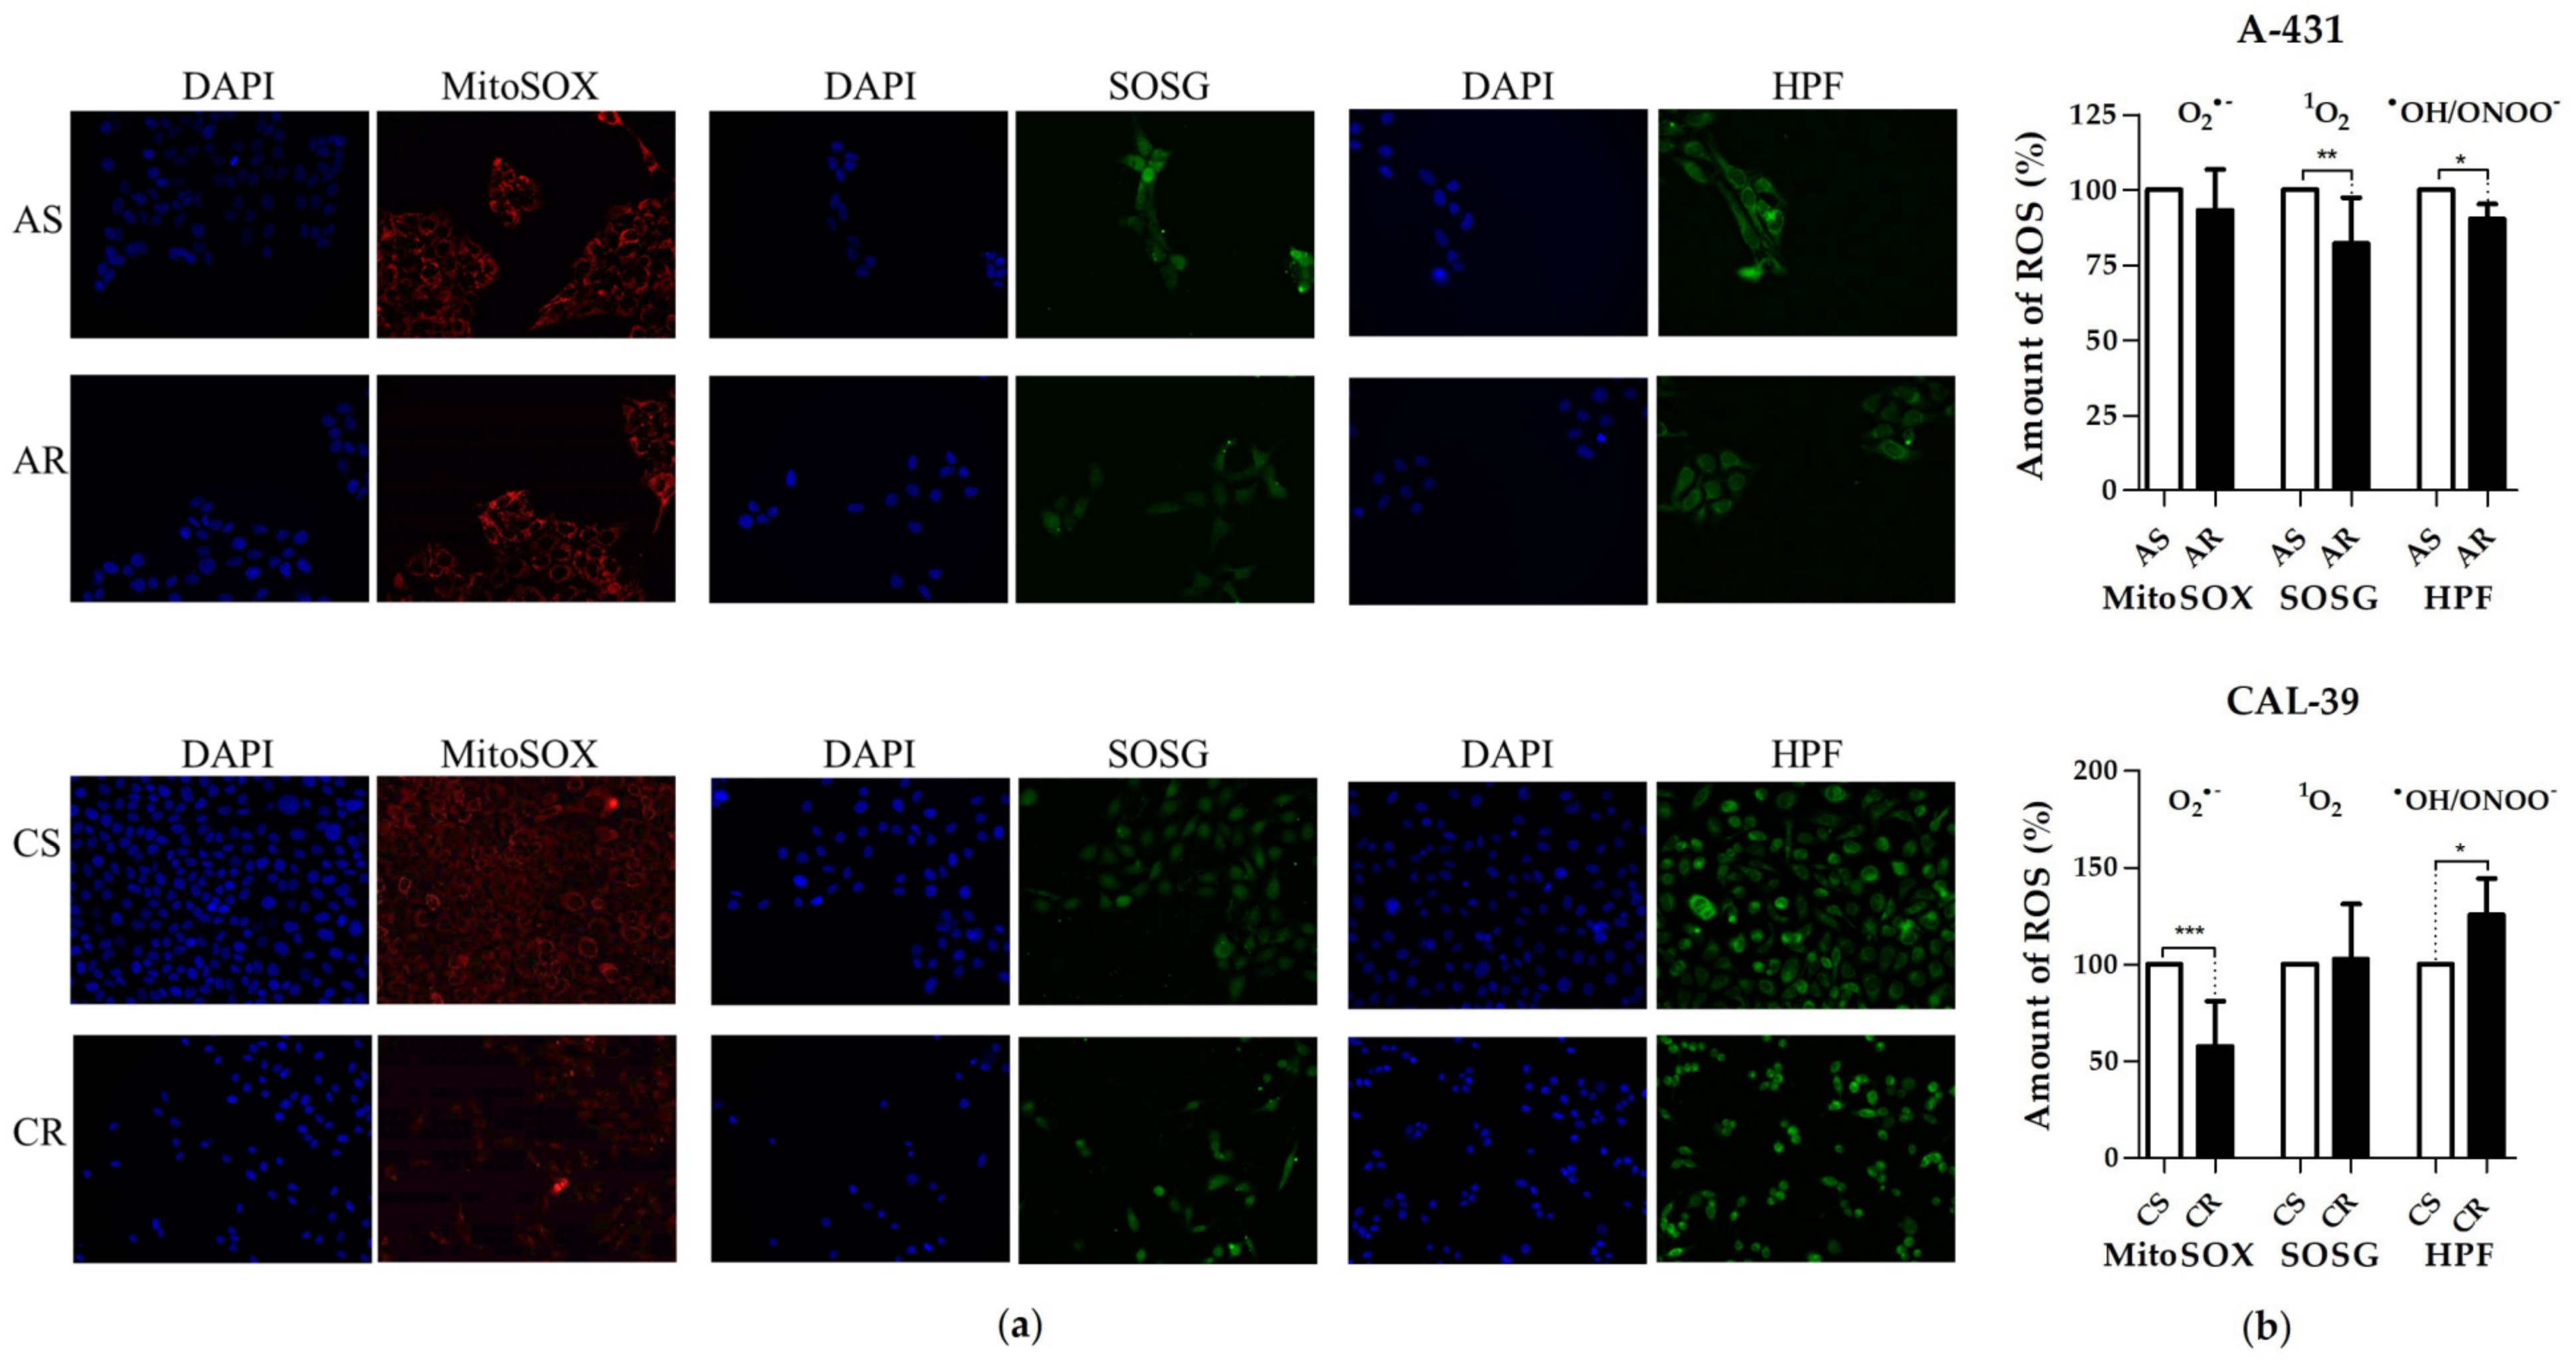
28]. By switching to aerobic glycolysis resistant CAL-39 cells could reduce the amount of O
2•− (
Figure 6), as the respiratory chain is the main source of this ROS [
17]. Superoxide and singlet oxygen are the main reactive oxygen species formed during PDT. Therefore, metabolic reprogramming, that leads to a significant reduction in O
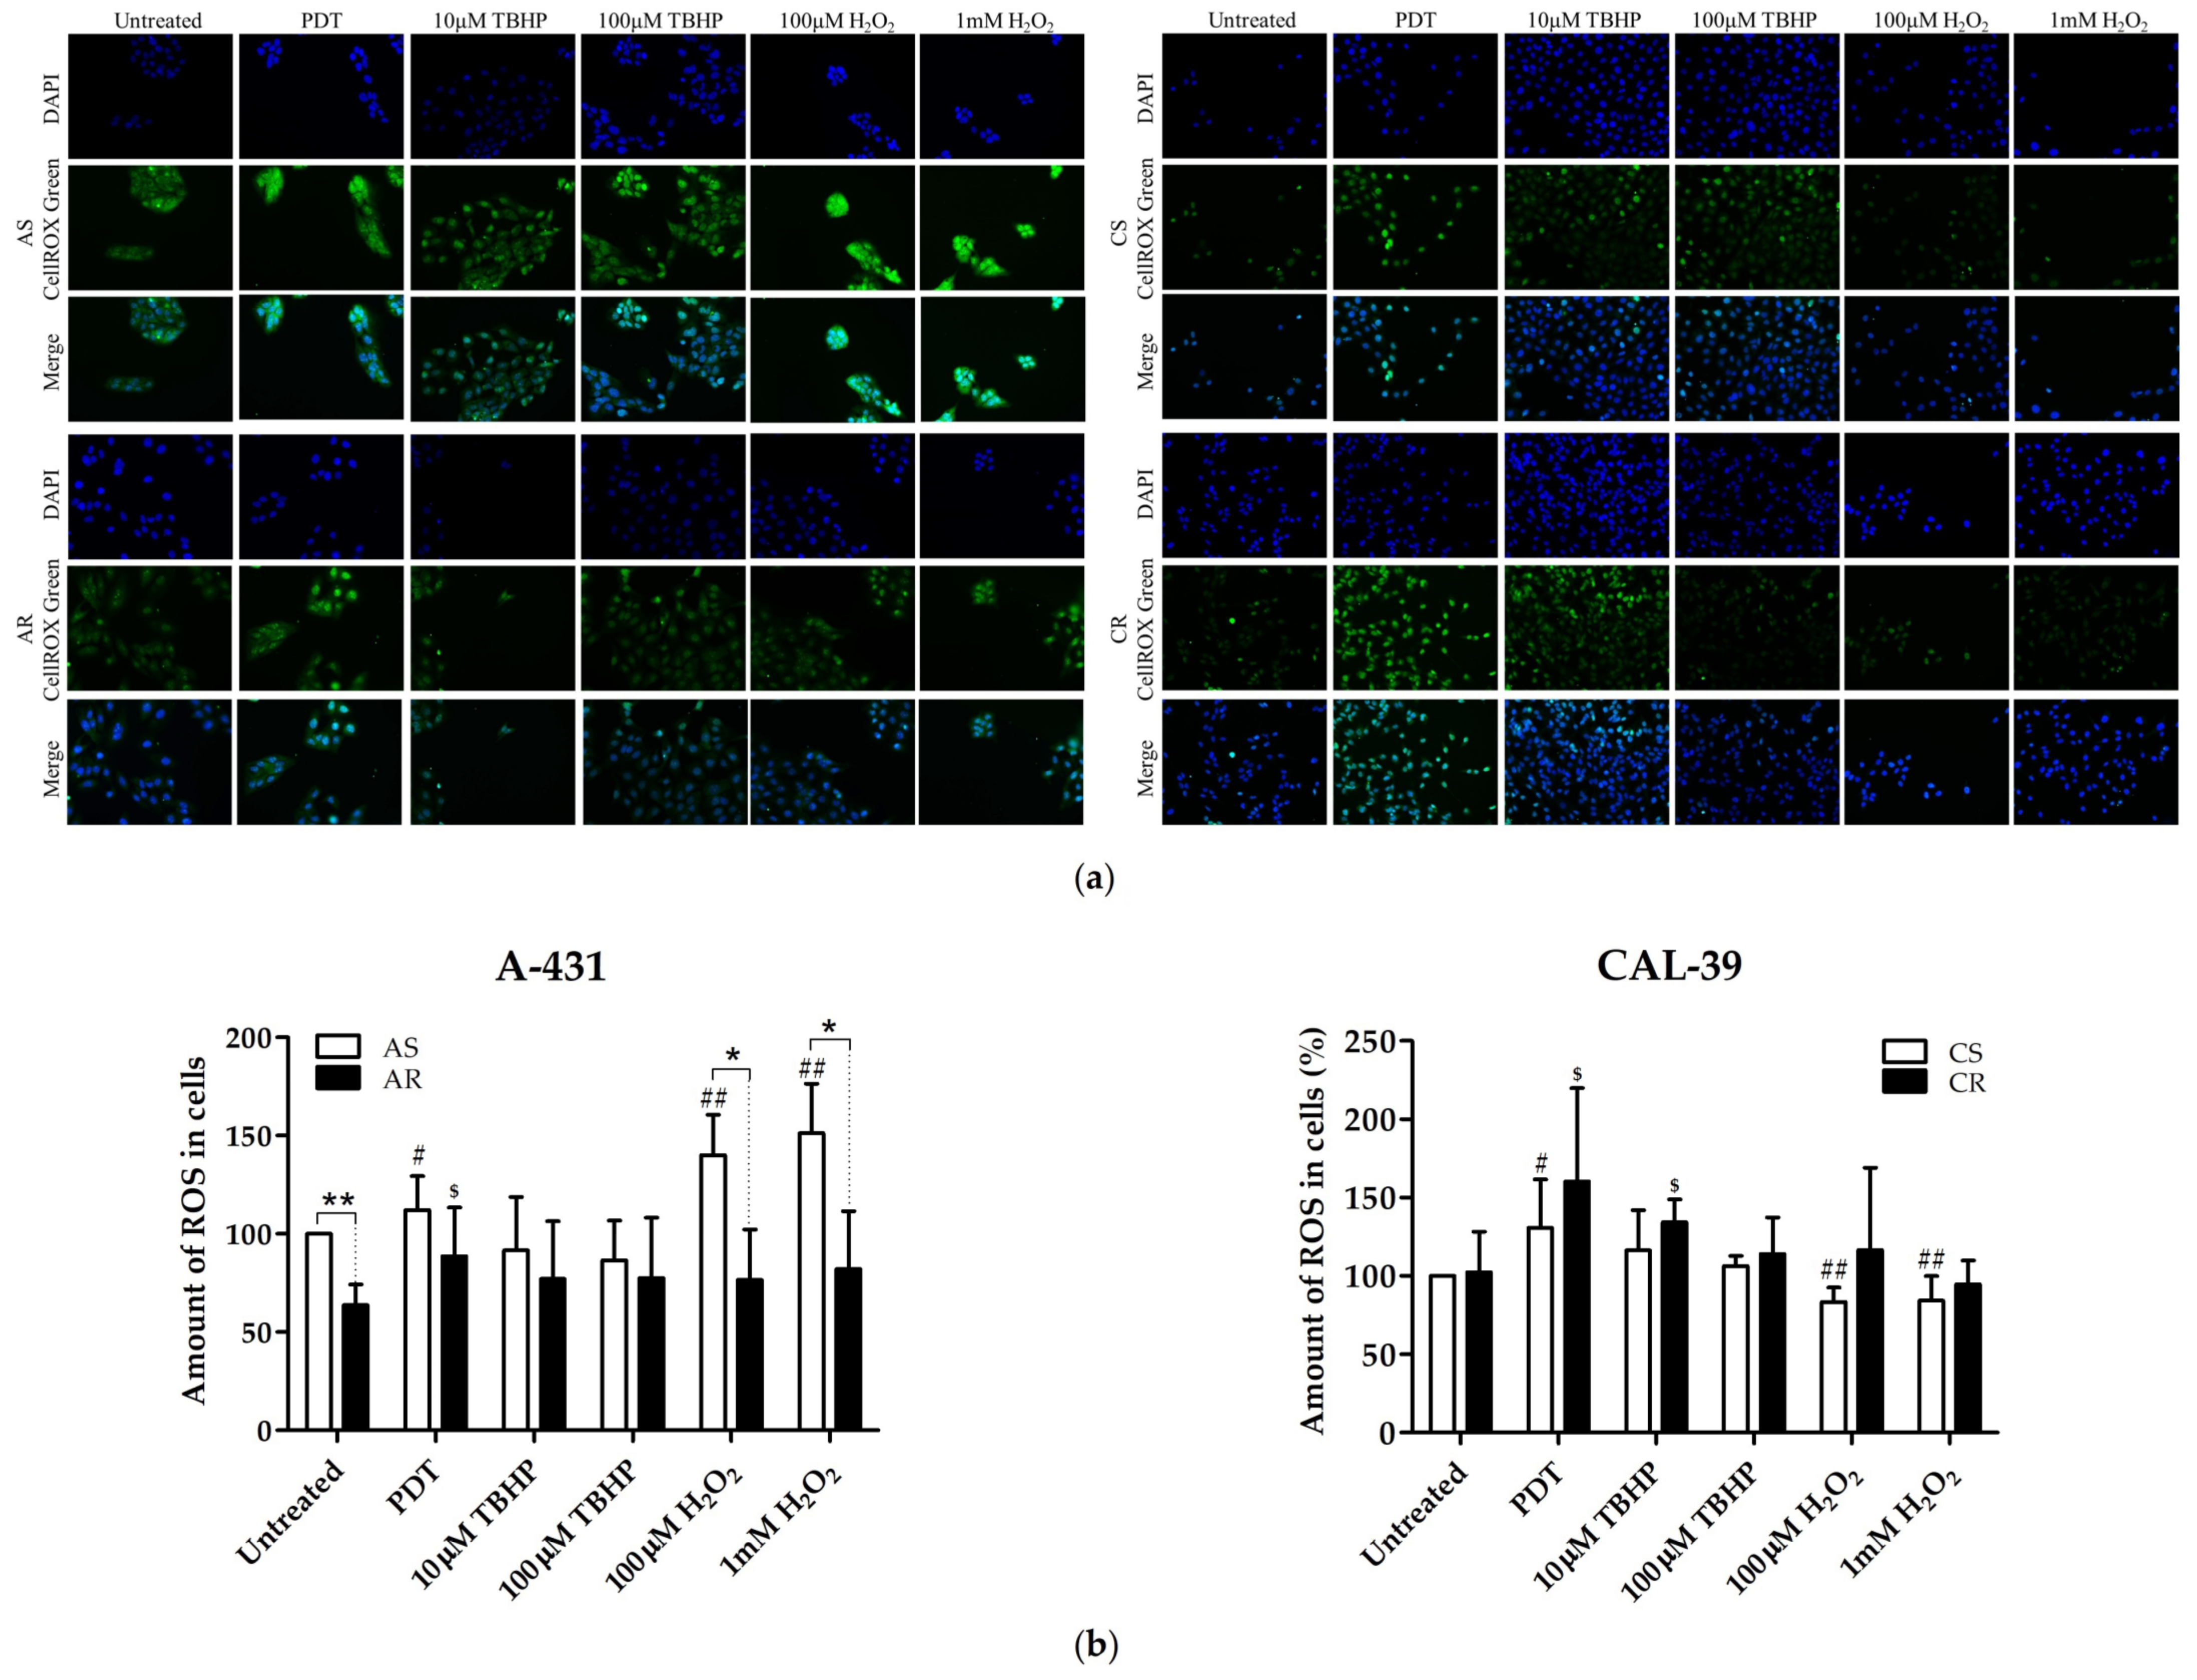
2•− may have an impact on the efficacy of PDT. The lack of changes in the total amount of ROS in resistant CAL-39 cells (
Figure 4) result from metabolic changes (
Figure 2,
Supplementary Table S3) leading to a decrease in O
2•− and an increased level of H
2O
2 and HO
•. These changes may lead to increased resistance to PDT but also to increased sensitivity to other oxidizing agents (
Figure 5). An increased pool of antioxidants may have also protective effect. These cells showed increased level of peroxidases, both glutathione- and thioredoxin-dependent, and glutathione S-transferase omega-1 (GSTO1) (
Supplementary Table S13), an enzyme involved in the reduction of the oxidized form of ascorbic acid (ASC) – dehydroascorbate (DHA) [
30,
31] and detoxification of lipid peroxidation products by combining them with glutathione [
17]. Elevated levels of these proteins and reduced levels of thioredoxin (
Supplementary Table S13) may suggest a strong dependence of these cells on glutathione and ascorbate as antioxidant molecules.
These antioxidant molecules may also play a role in the acquisition of resistance in A-431 cells. As shown, resistant A-431 cells contain less ROS than sensitive cells (
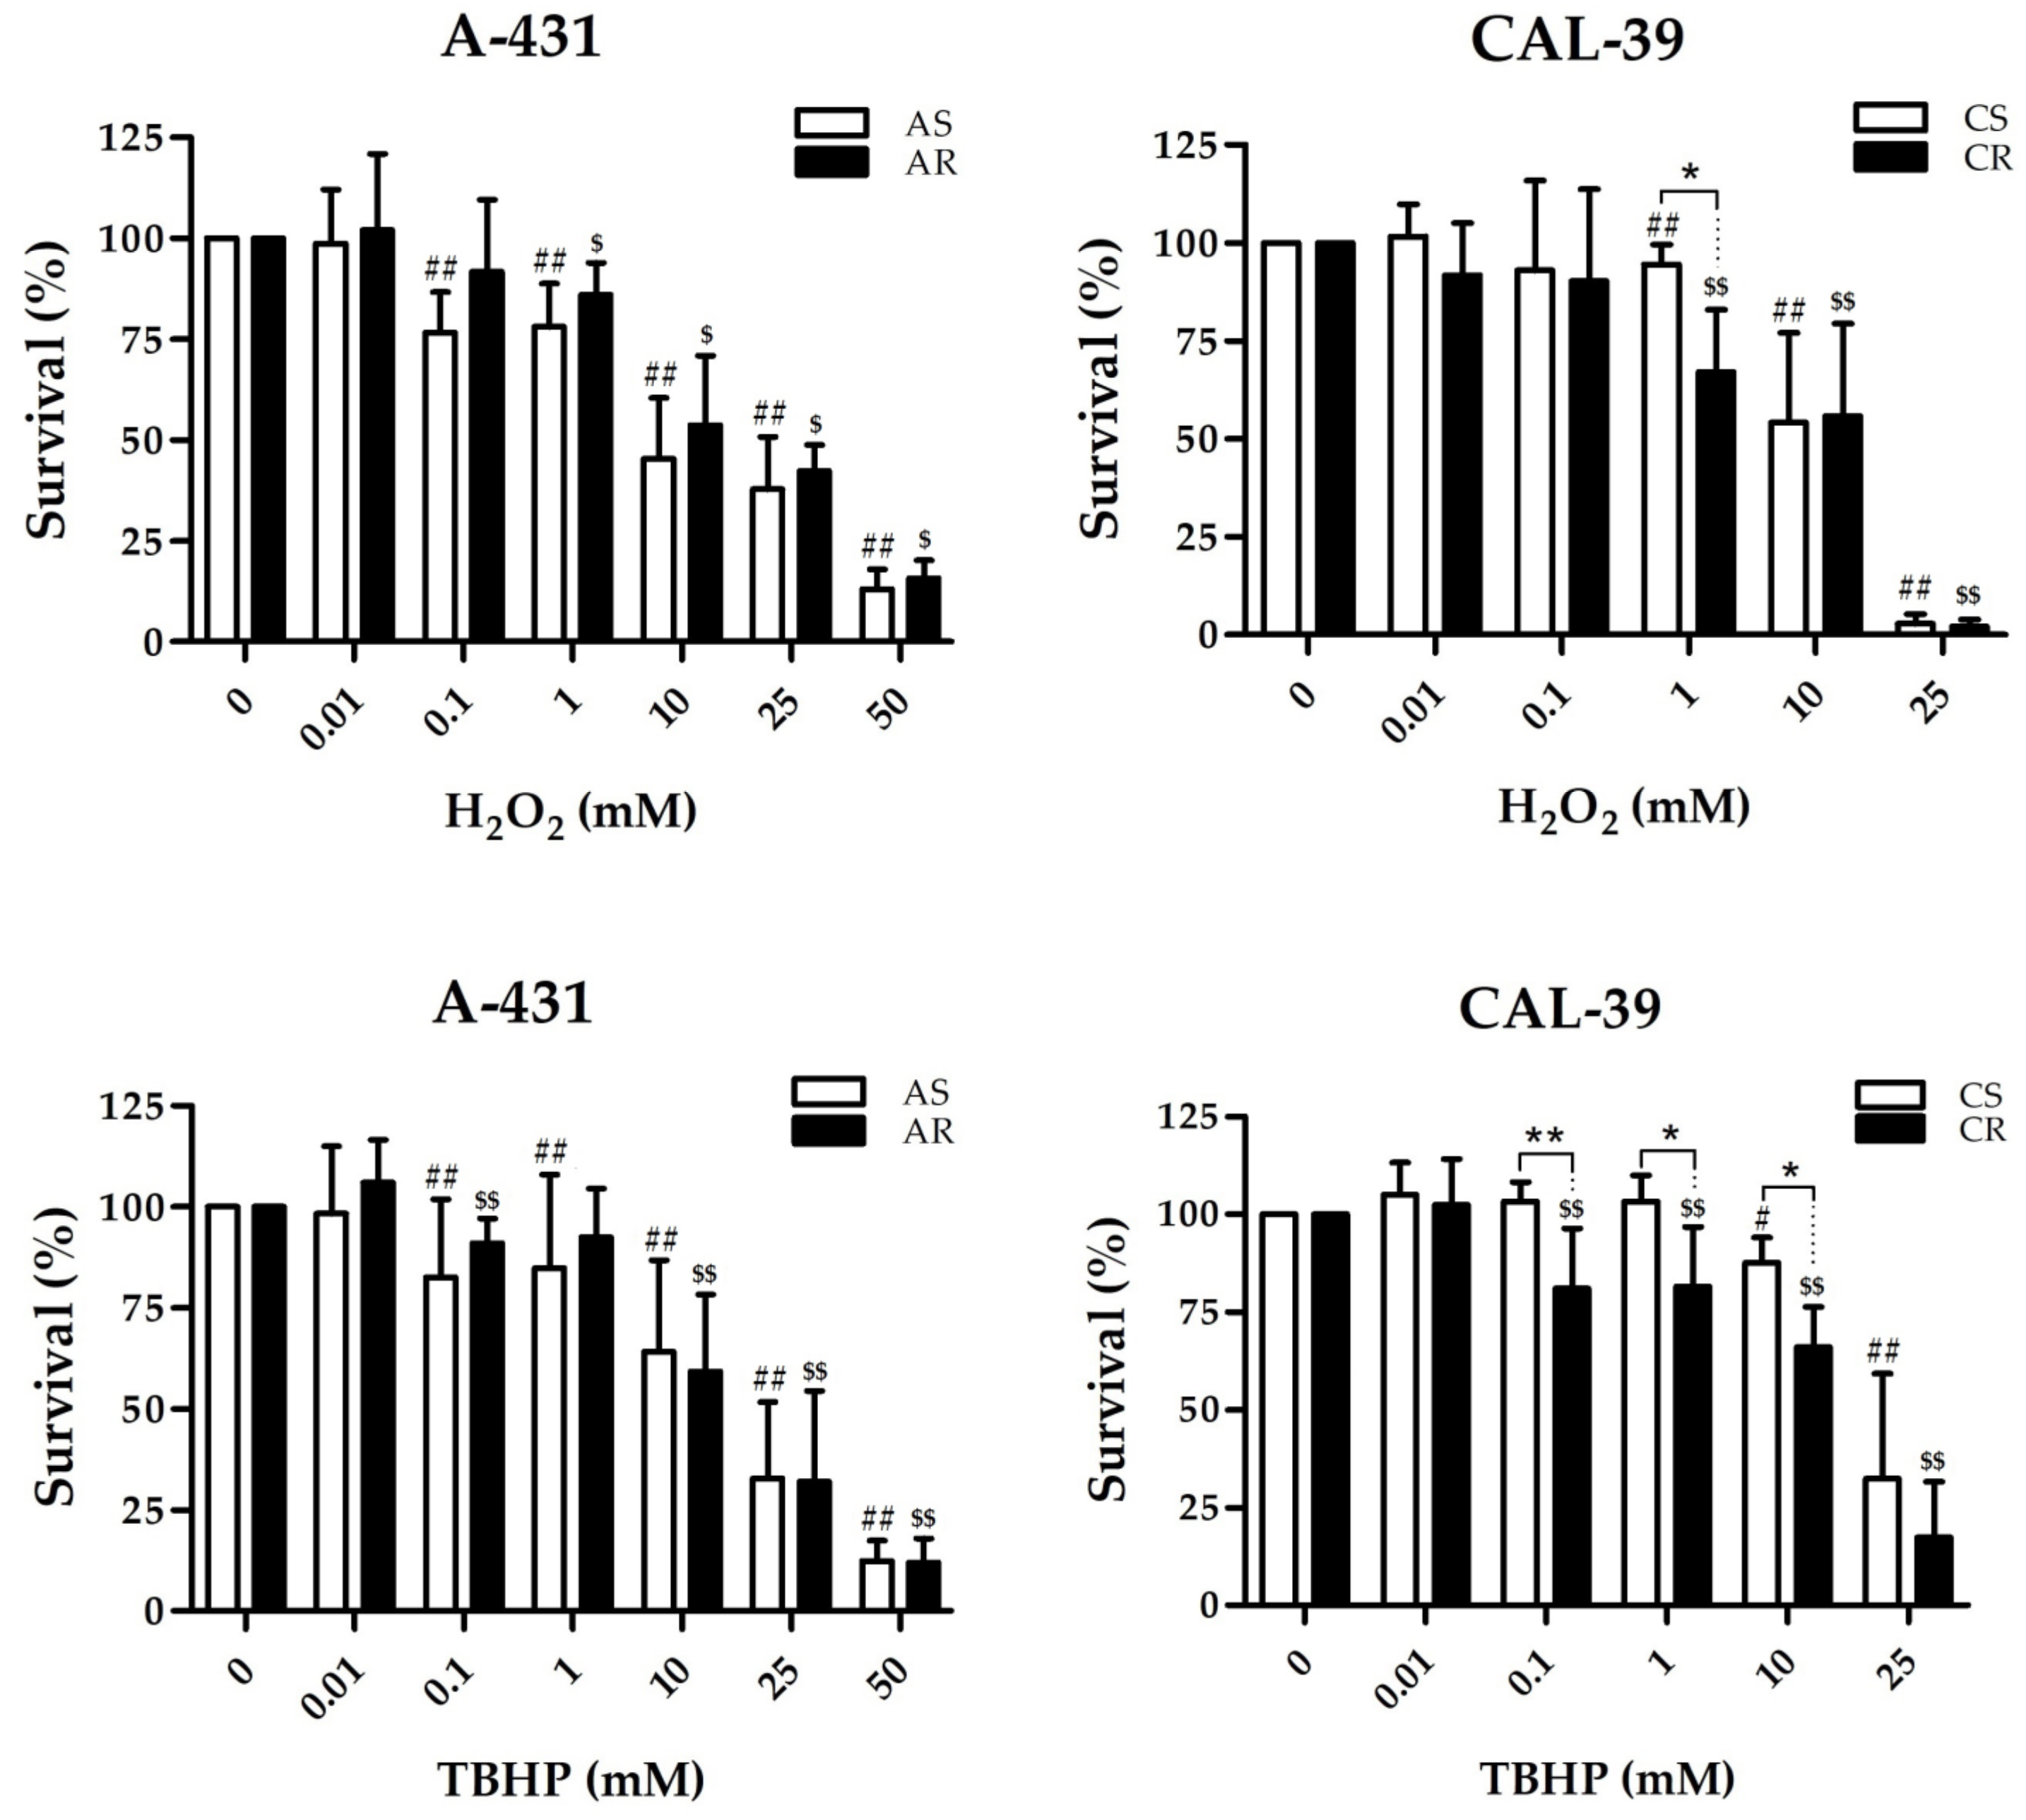
Figure 4). The decreased amount of ROS in resistant A-431 cells is caused by the lower content of
1O
2, H
2O
2 and HO
•, which results in reduced effectiveness of PDT, but also in some other oxidizing agents, such as H
2O
2 (
Figure 5). Taking into consideration that there are no enzymatic mechanisms to eliminate
1O
2 [
5], the decreased level of this ROS (
Figure 6) in resistant A-431 cells may be caused by increase in the amount of such molecules as bilirubin, ascorbate (ASC), tocopherols and carotenoids, which are capable of quenching various ROS, including singlet oxygen [
17]. Resistant A-431 cells may produce more bilirubin as a result of changes in heme metabolism and heme oxygenase activity. Alternatively, resistant cells could increase the production of antioxidant hemoproteins, such as, for example, catalase [
6]. Moreover, taking into account greater tolerance to H
2O
2 and a decreased level of HO
• in resistant A-431 cells than in the parental line, an increased amount of glutathione may promote the restoration of damaged cellular components, proteins and lipids also in this resistant cell line.
Glutathione is an essential component of antioxidant defense, involved in the reduction of organic peroxides, hydrogen peroxide, and free radicals, both HO
• and organic radicals. The quenching reaction is accelerated by glutathione peroxidases [
17]. Due to the high importance of the glutathione system in the elimination of various ROS, the inhibition of glutathione synthesis could have a beneficial effect on the effectiveness of PDT. The increased level of reduced glutathione [
7] and the number of enzymes utilizing it were previously associated with protection against PDT in various cell lines [
7,
32]. Moreover, it was shown that inhibition of glutathione synthesis influenced the cytotoxicity of PDT in the MCF-7 line by increasing ROS levels and led to apoptosis [
33].
On the other hand, ascorbate, despite its strong reducing properties against various ROS [
17], may show a pro-oxidative effect at high concentration. Preclinical and clinical studies suggest that it can be administered safely to patients in high doses and improve the anticancer effect of chemo- and radiotherapy [
34]. Considering the importance of nonenzymatic antioxidants in the protection of cells against ROS generated during PDT, it can be assumed that additional administration of ascorbate, leading to changes in its antioxidant properties to pro-oxidative properties, may also improve the effectiveness of this therapy.
Nevertheless, changes in ROS level may also affect PDT efficiency by influence on signaling pathways. ROS are involved in the activation of various signaling pathways that can lead to changes in proliferation, metabolism, angiogenesis [
9], adhesion, migration, invasion, and EMT [
10]. The main ROS involved in redox signaling is H
2O
2, the amount of which was changed in resistant cells of both lines. H
2O
2 is produced in response to EGF [
8], leads to inactivation of inhibitory phosphatases of PI3K and AKT [
8,
9,
35], which may result in increased activity of the EGFR/PI3K/AKT pathway, increased proliferation and survival. The amount of EGFR (
Supplementary Tables S5 and S6) was changed in the same way as H
2O
2 in resistant cell lines. An increased amount of this receptor was observed in resistant CAL-39 cells. Thus, the EGFR/PI3K/AKT pathway may play a role in the development of resistance in CAL-39 cells and be one of the reasons for the observed changes in cellular metabolism (
Figure 2,
Supplementary Table S3) as the activation of AKT may promote aerobic glycolysis by affecting glucose uptake and the glycolysis pathway [
35]. Moreover, the PI3K/AKT pathway may also facilitate protein synthesis, promote EMT by activating the NF-κB pathway and increase cell migration [
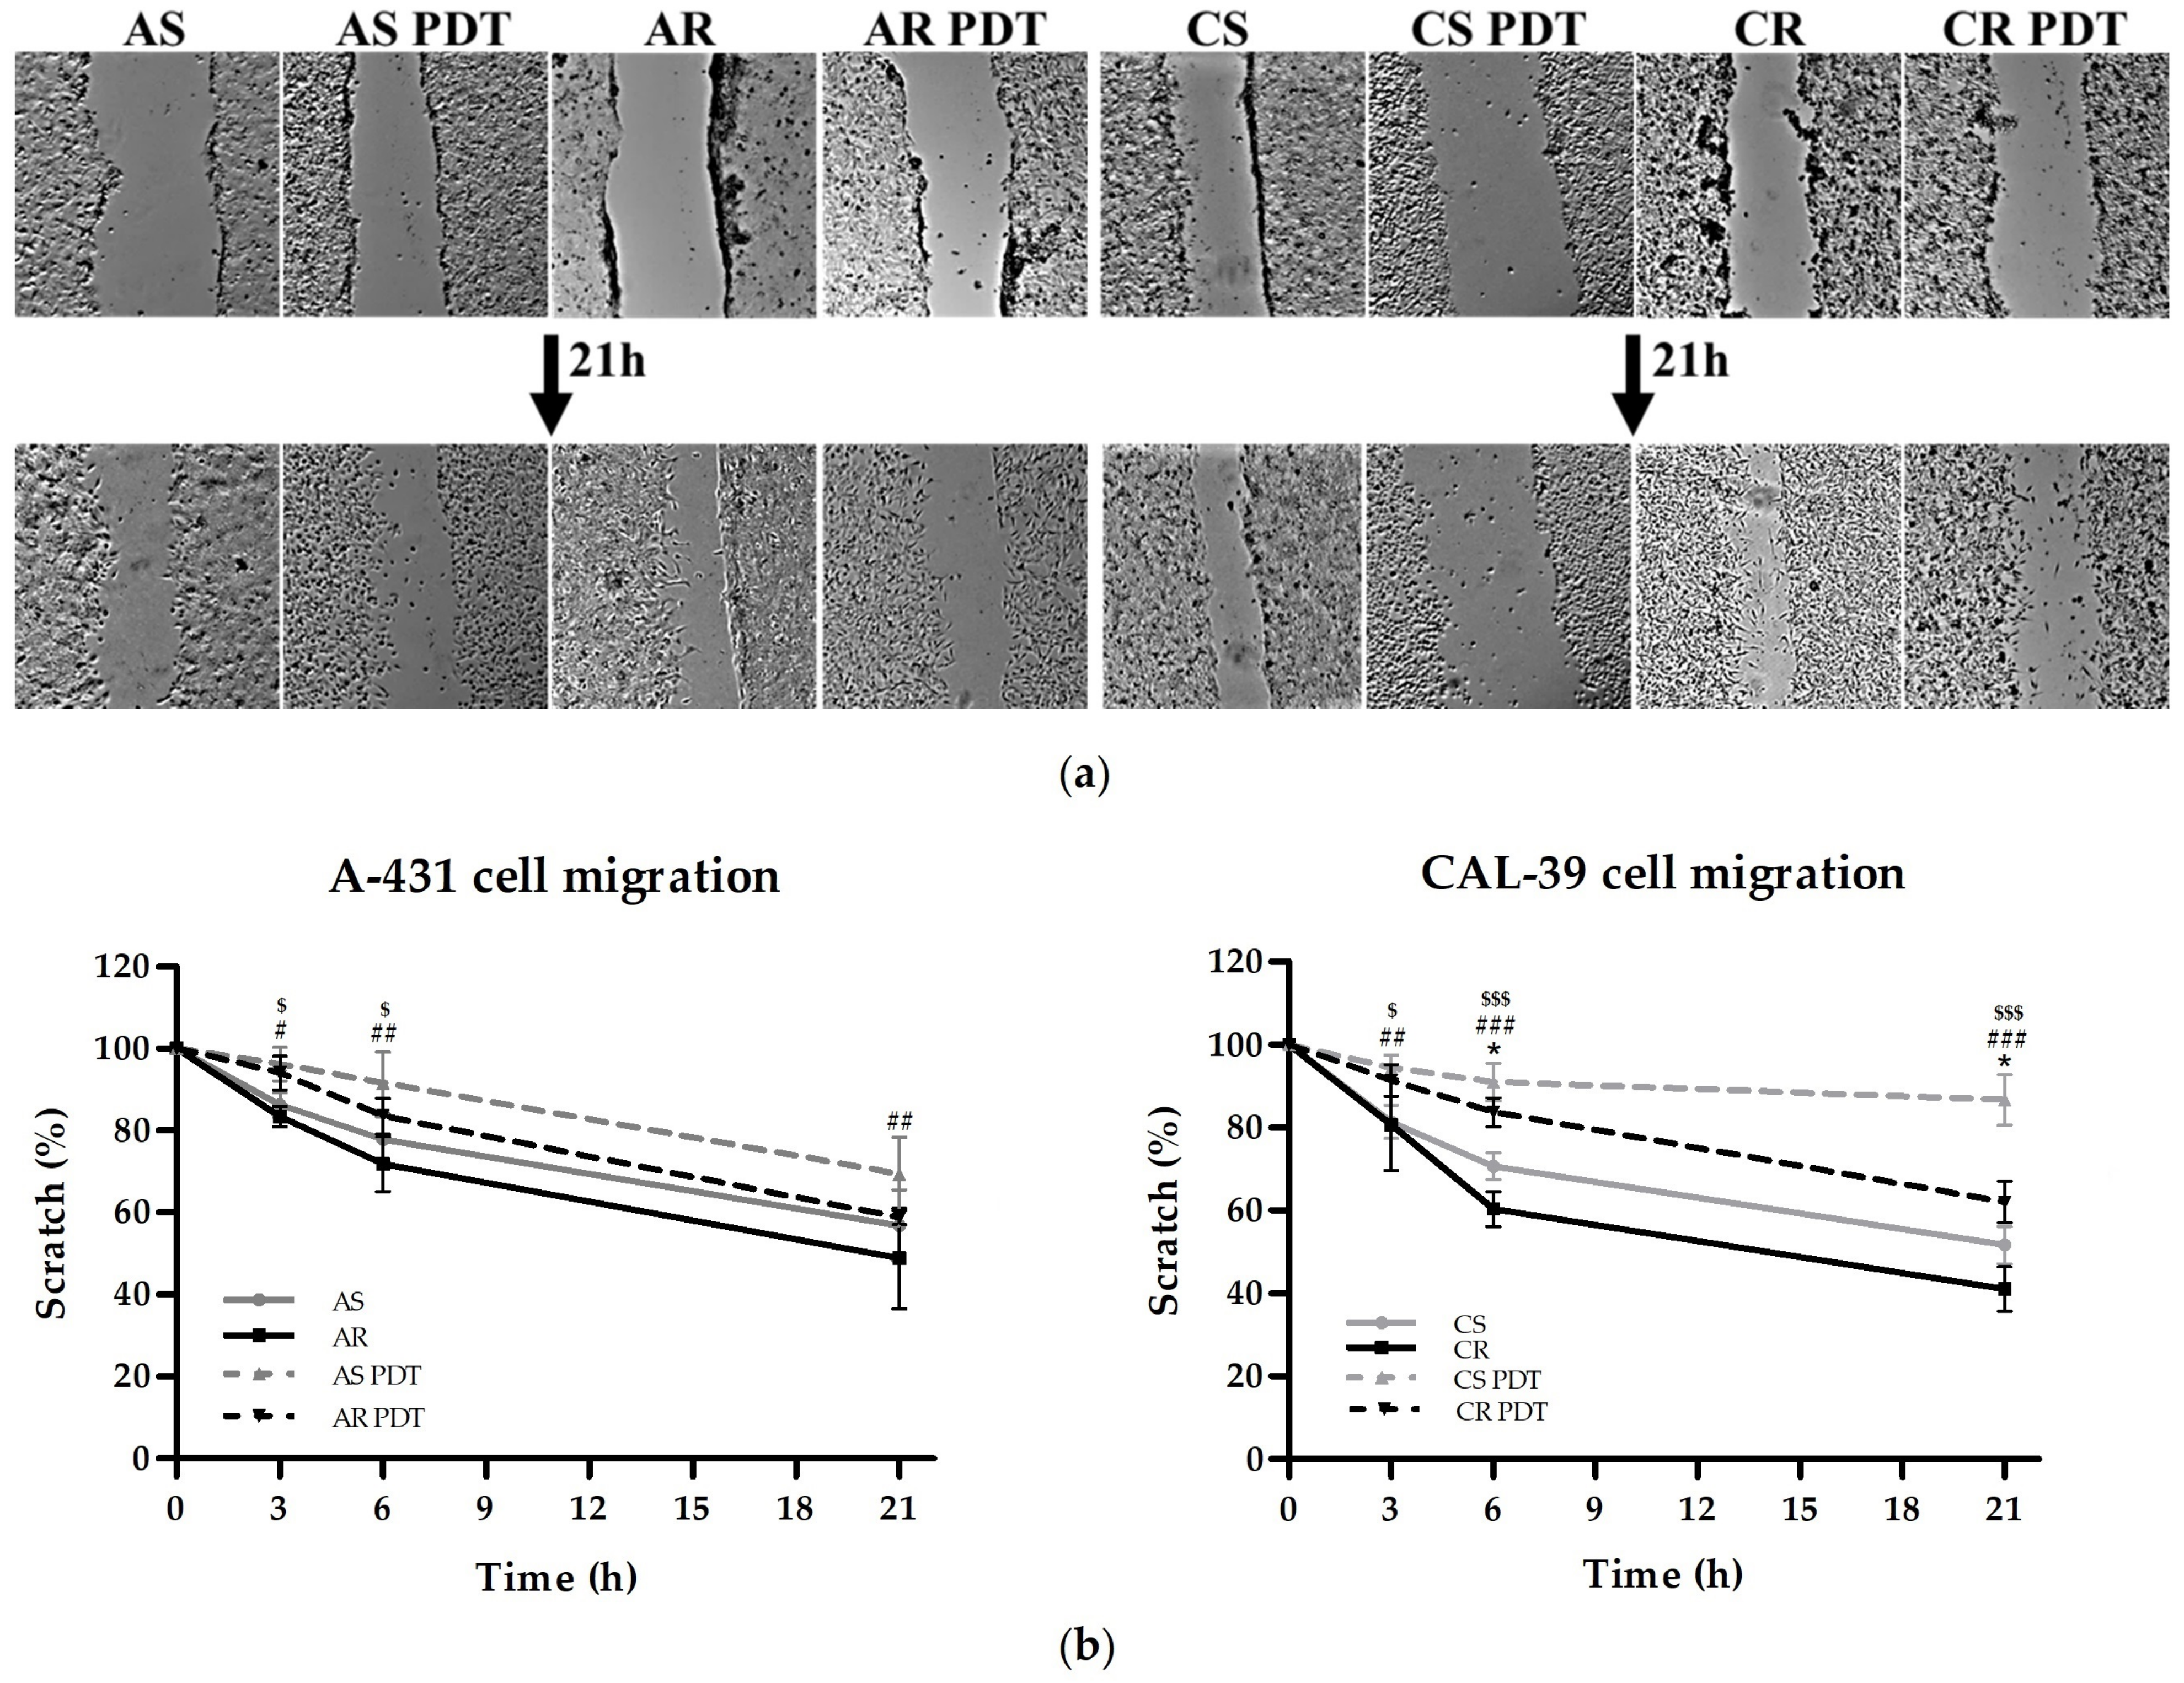
10]. Resistant CAL-39 cells increased the level of proteins involved in synthesis of proteins [
6] and one of the NF-κB subunits (RELA,
Supplementary Table S5), showed an increased rate of migration (
Figure 8), as well as numerous changes in the cytoskeleton (
Figure 2,
Figure 9,
Supplementary Table S1) that could confirm the epithelial-mesenchymal transition. EMT is an adaptive process that can confer cancer cells a stem-like phenotype to survive lethal stimuli and develop drug resistance [
10]. CD44 is one of the key markers of cancer stem cells [
10,
36]. Its amount also increased in resistant CAL-39 cells (
Supplementary Table S5).
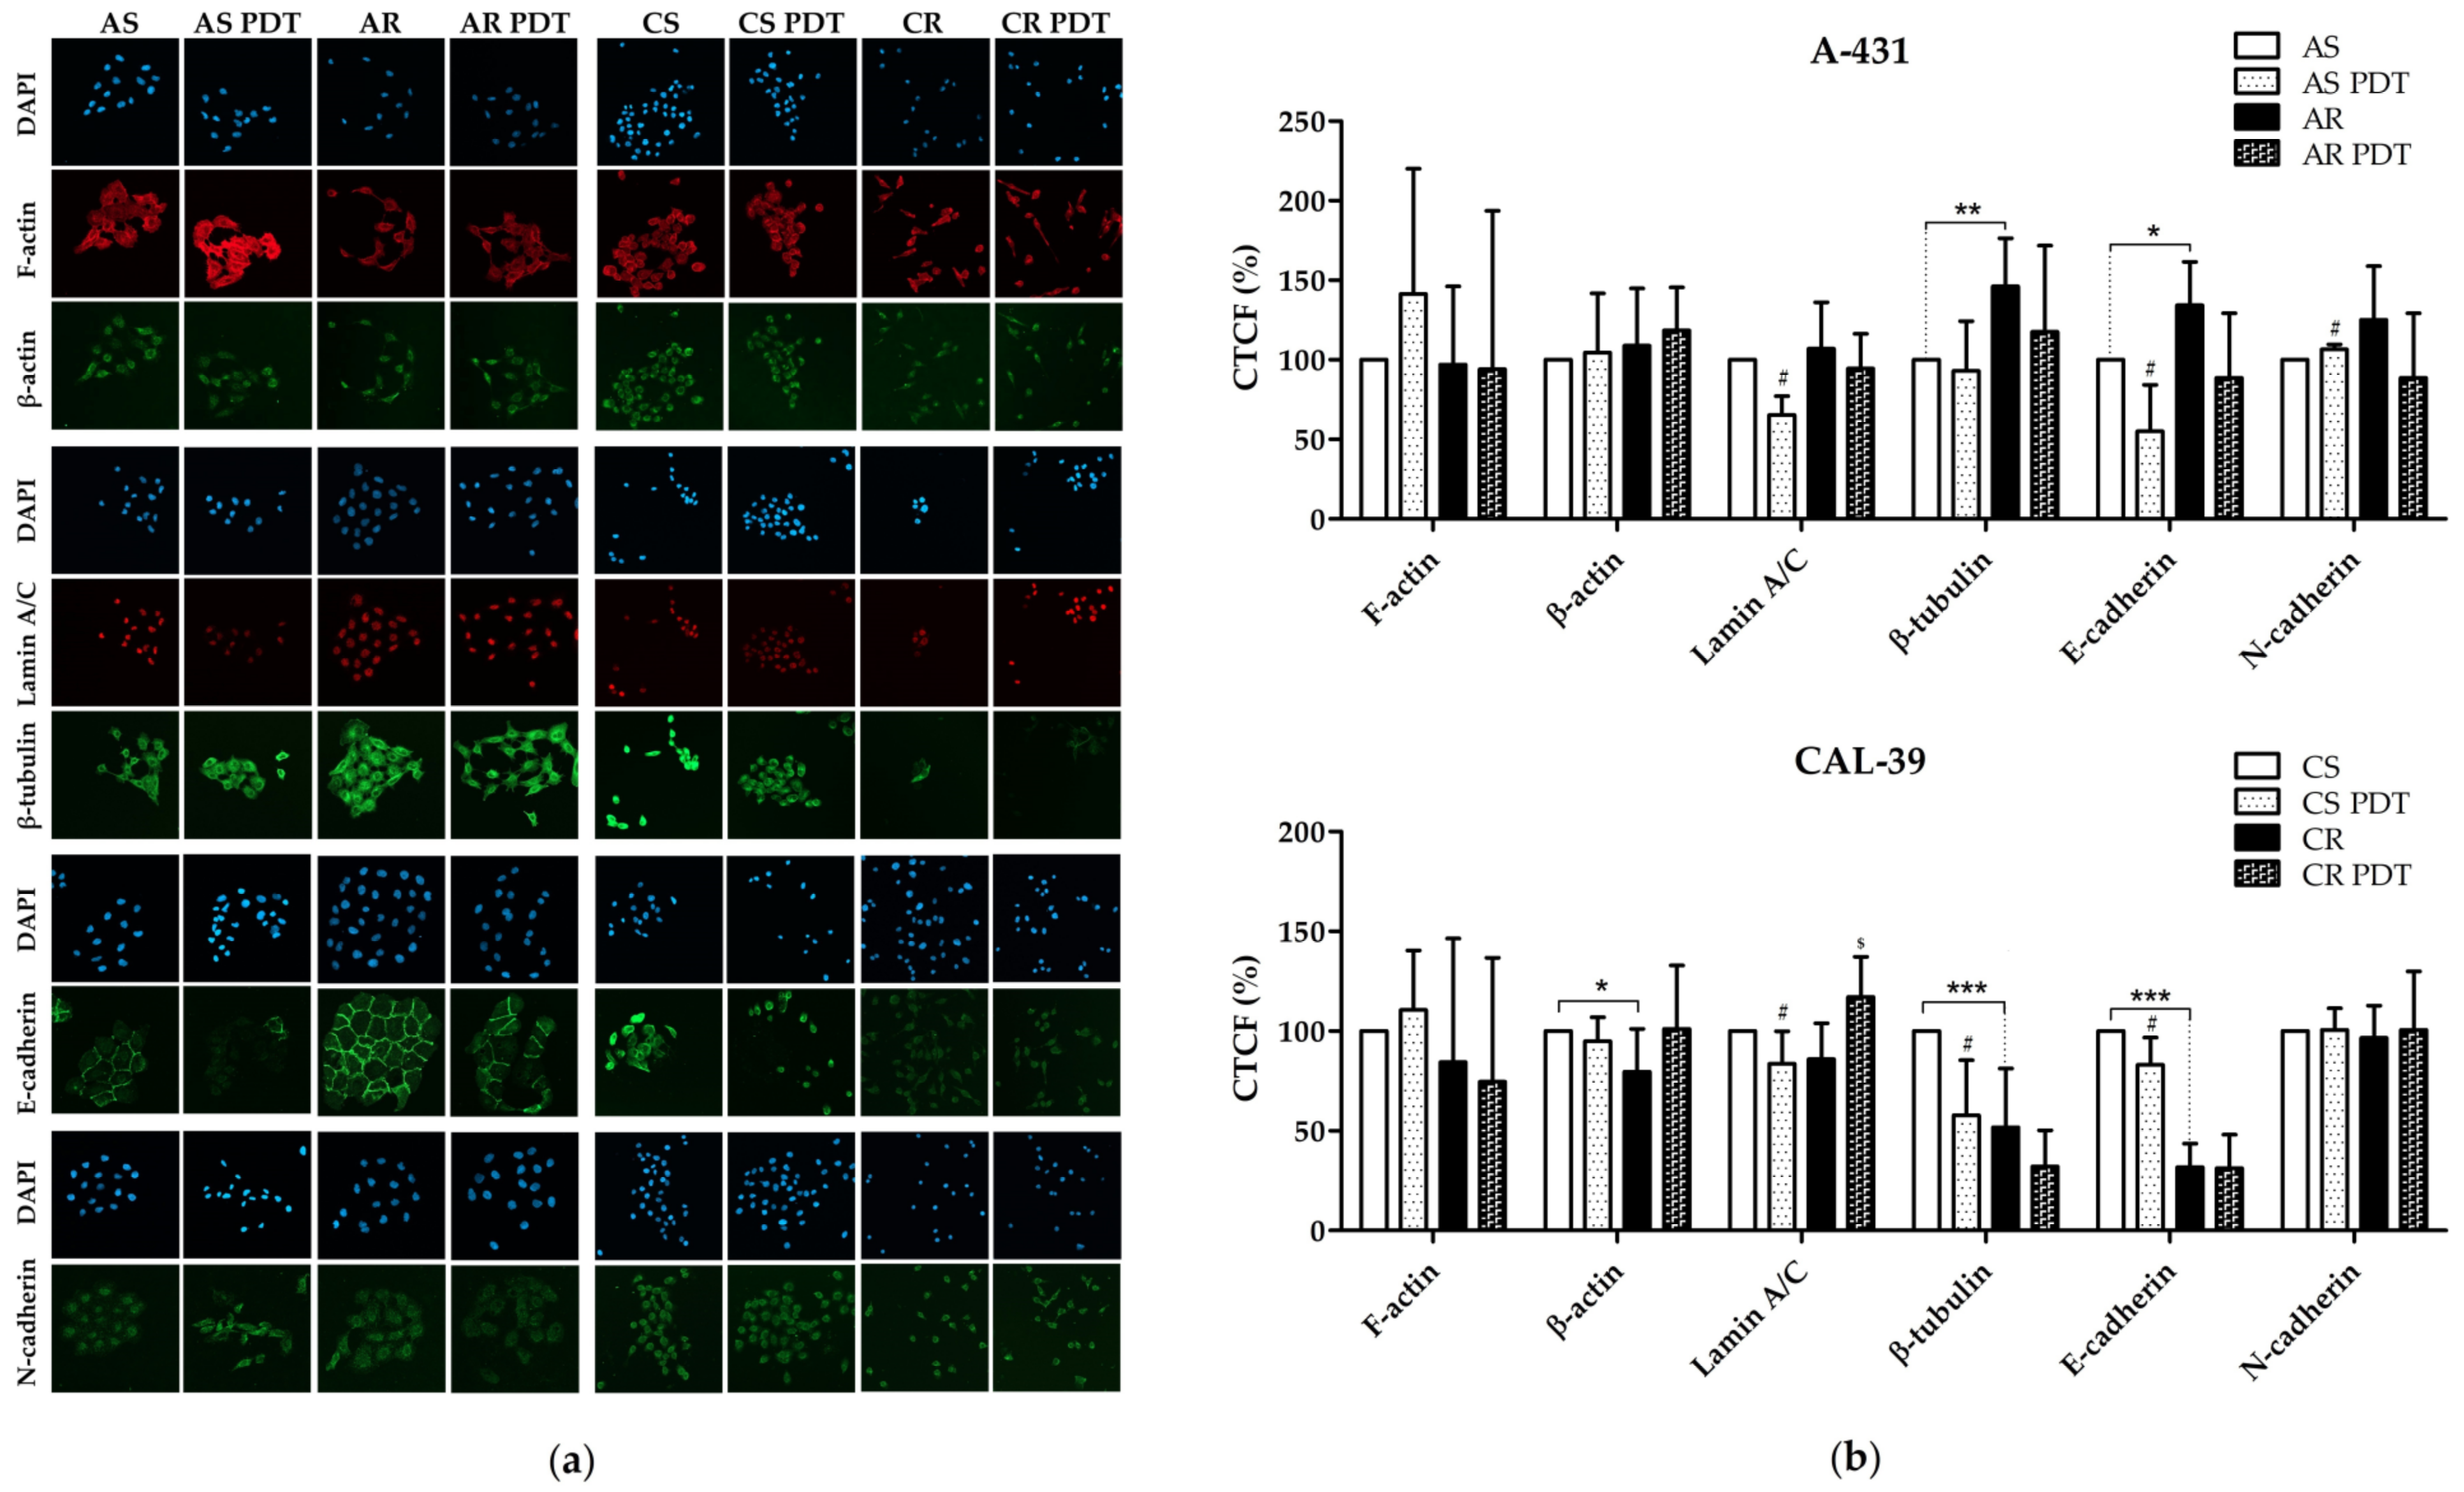
However, both resistant human vulvar cancer cell lines showed changes in cytoskeleton. Moreover, we demonstrated that PDT also affect cytoskeleton structures (
Figure 9). In contrast to resistant CAL-39 cells, which showed a decrease in the level of E-cadherin (
Figure 9,
Supplementary Table S1), catenins (
Supplementary Table S1) and many other cell adhesion molecules (
Supplementary Table S1), resistant A-431 cells increased the level of E-cadherin (
Figure 9) and tight junction protein (
Supplementary Table S2). As a result of PDT, the level of E-cadherin decreased in both sensitive cell lines (
Figure 9). As mentioned above, changes in resistant CAL-39 cells may be associated with EMT and resistance to treatment. However, also increased amount of E-cadherin in resistant A-431 cells may lead to a poorer response to the therapy. The intercellular interactions created by E-cadherin were previously linked with protection of cancer cells against chemotherapy [
11,
12,
13,
14,
15]. For this reason, the degradation of E-cadherin in sensitive cells of both lines due to ROS action after PDT may contribute to their death, and the increased amount of E-cadherin in resistant A-431 cells may lead to a weaker response to treatment.
Changes in the microtubule cytoskeleton may also promote resistance to PDT. Resistant A-431 cells showed an increased amount of β-tubulin, and resistant CAL-39 cells decreased the level of this protein (
Figure 9), with an increase in some isotypes (
Supplementary Table S1). Microtubules play a role in cell adhesion [
37,
38], which may promote resistance to various therapies by influencing antiapoptotic pathways [
7]. Additionally, changes in microtubule stability, tubulin isotypes expression and its post-translational modifications have been correlated with poor prognosis and resistance to chemotherapy [
20]. The lack of changes in β-tubulin level after PDT in both sensitive and resistant A-431 cells may suggest stabilization of microtubules and their protection against ROS. MAP proteins protect microtubules against depolymerization in response to oxidative stress. Their interactions with tubulin also affect sensitivity to chemotherapy [
20]. Thus, an increase in microtubule level in resistant A-431 cells may contribute to resistance by influencing cell adhesion, and MAP proteins likely favor PDT resistance by ensuring high microtubule stability. In turn, in the CAL-39 cell line, PDT causes a significant decrease in β-tubulin level only in sensitive cells (
Figure 9). ROS generated during PDT can depolymerize microtubules unbound with MAP proteins and damage β-tubulin. However, reduced susceptibility to microtubule cytoskeleton damage may result from changes in β-tubulin isotypes. Specific β-tubulin isotypes can provide protection against oxidative stress. These include tubulins of βIII, βV and βVI classes, which, acting as redox switches, can alter the response to oxidative stress. These proteins contain cysteine at the ser/ala124 position and serine instead of cys239. ROS, by oxidizing β-tubulin in cys239, inhibits the microtubule assembly and stabilization [
20] and damages the cytoskeleton by reducing the amount of microtubules and tubulin [
10]. Resistant CAL-39 cells showed, among others, increased level of βV-tubulin (TUBB6,
Supplementary Table S1). On the other hand, the β-tubulin isotypes susceptible to oxidation in CAL-39 sensitive cells may lead to significant destruction of microtubules after PDT (
Figure 9) and contribute to their death. Moreover, destruction or stabilization of the microtubule network may block migration [
38], which is consistent with decreased migration rate in response to PDT in all tested cells (
Figure 8). In addition, tubulins and microtubule-related proteins may also play a role in the response to cellular stress, thus ensuring increased survival of cancer cells. Microtubules can participate in signal transduction in response to cellular stress, influence the activity of MAPK pathways and the stress response dependent on TP53. The microtubule network probably may also be involved in the regulation of apoptosis [
20].
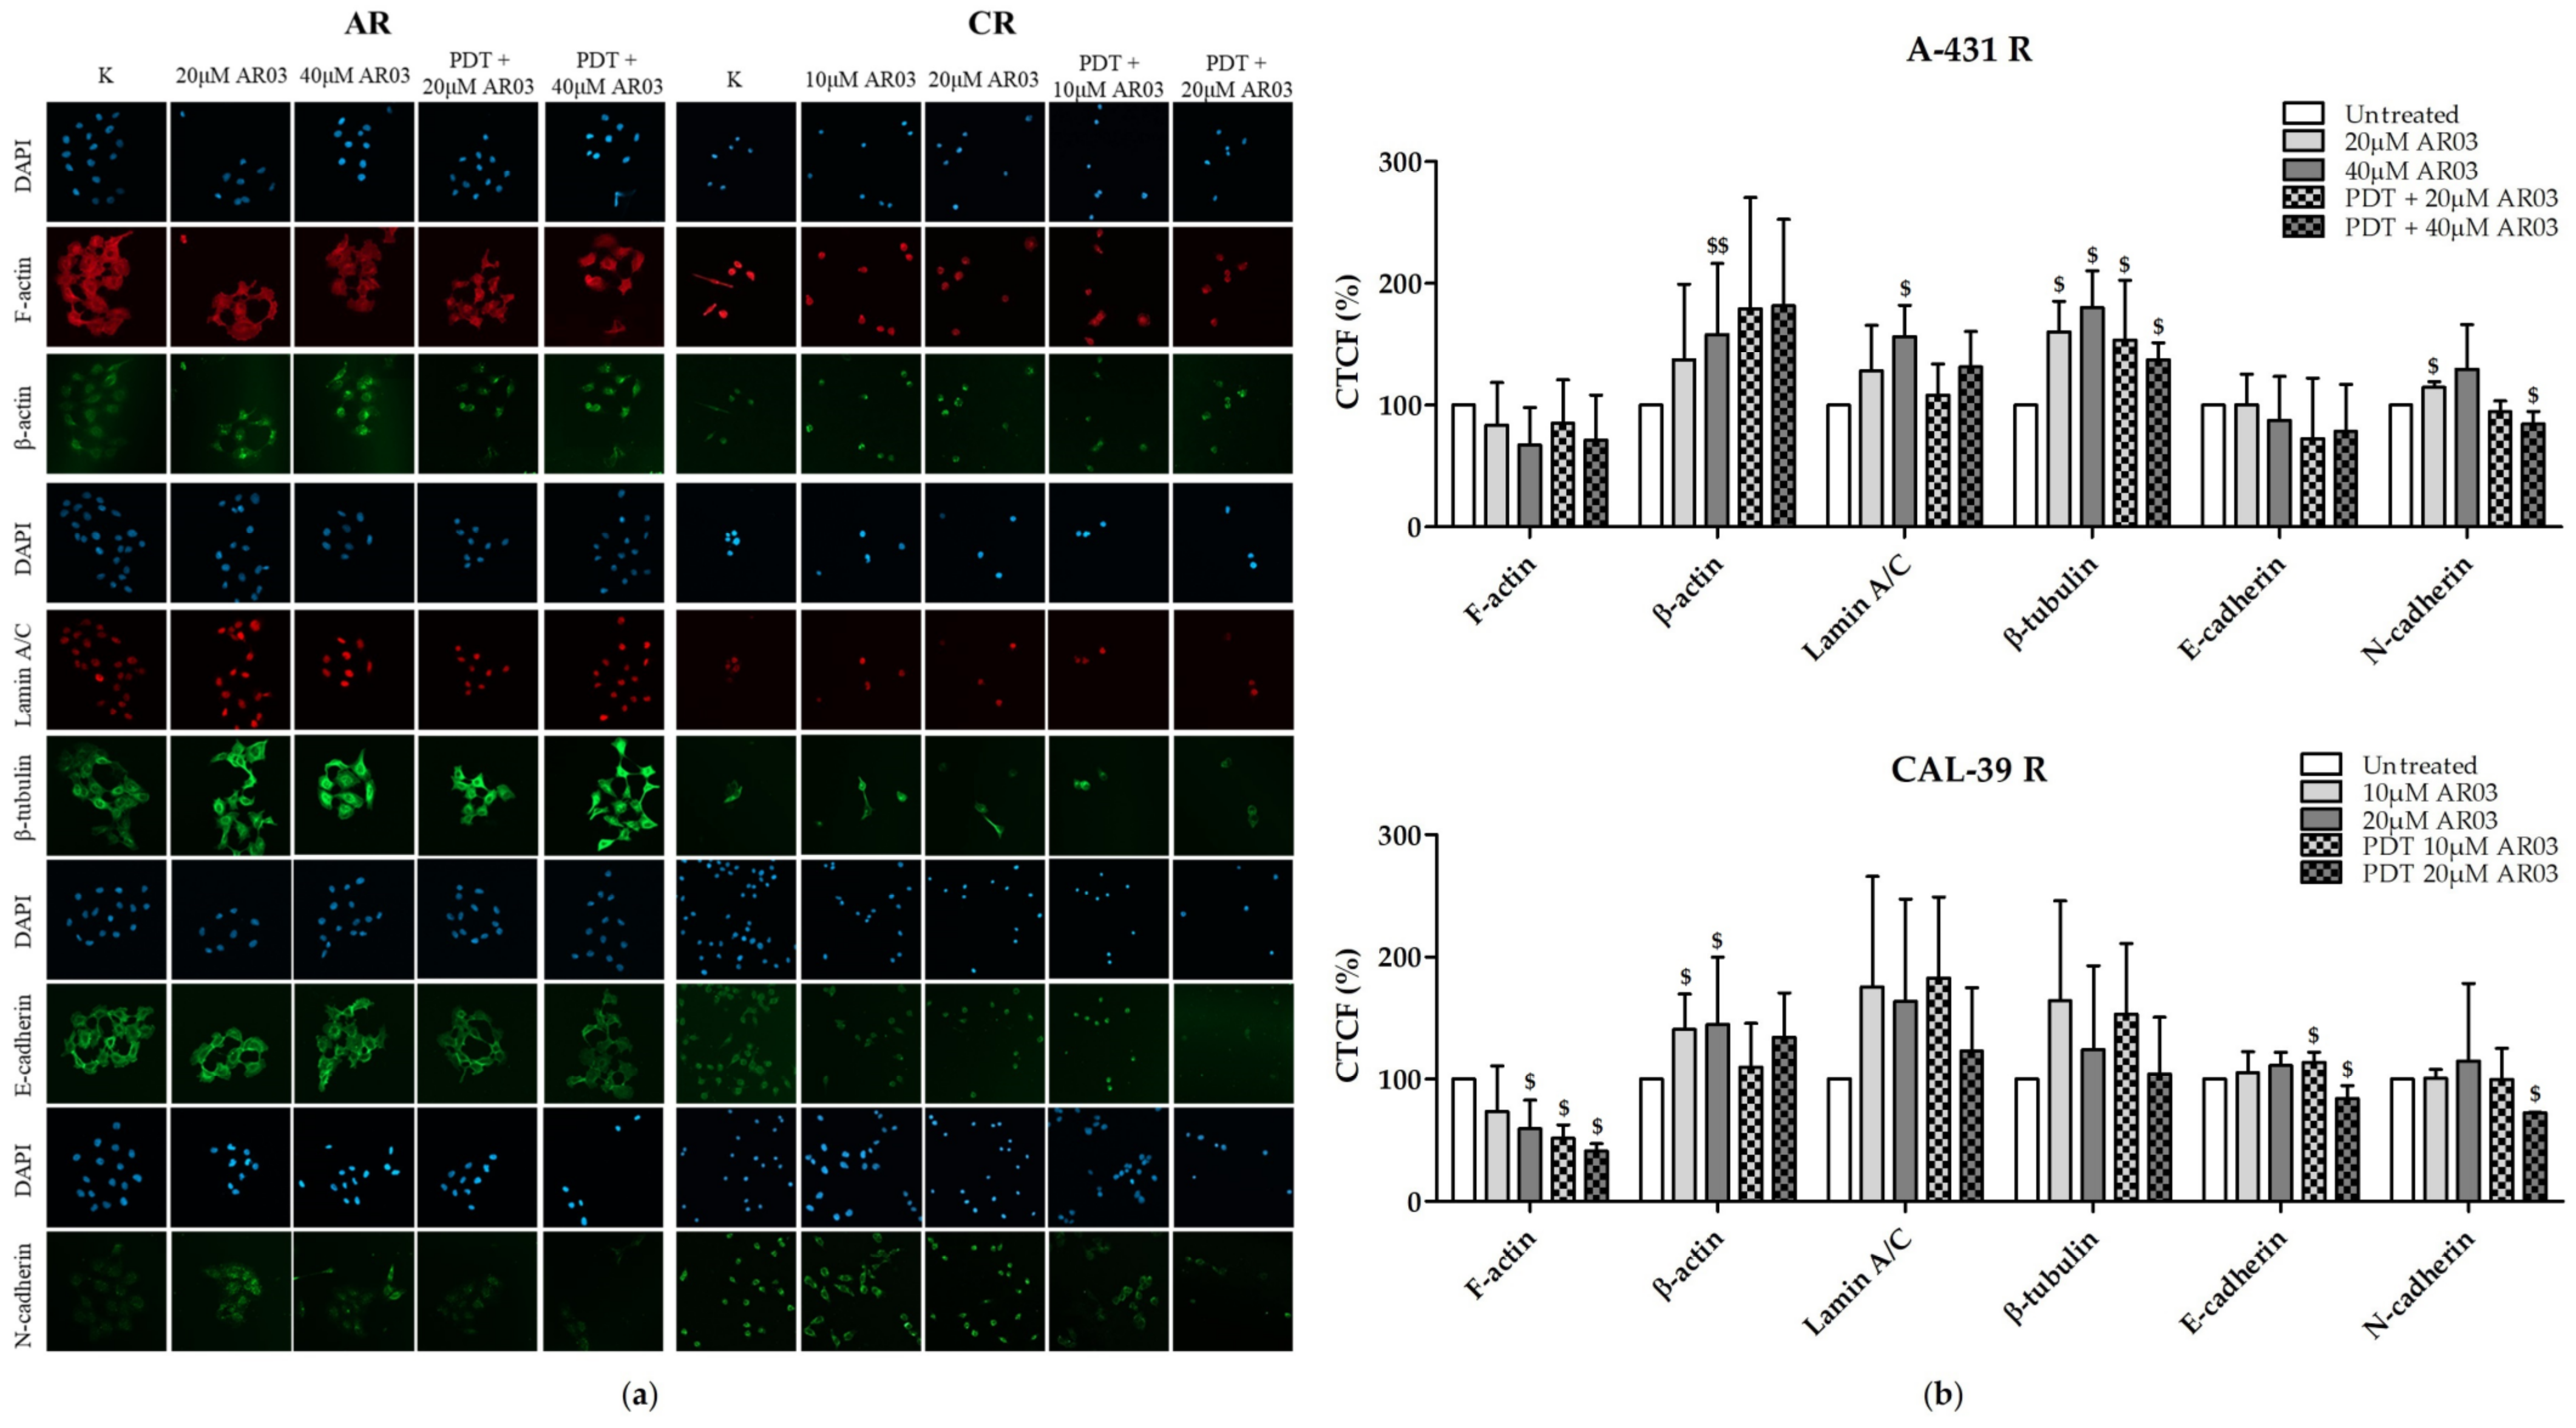
In this study, we also analyzed whether the APE1 endonuclease inhibitor, which effectively sensitized vulvar cancer cells to PDT [
6], may affect the cytoskeleton. Resistant A-431 cells showed higher levels of β-tubulin, and resistant CAL-39 cells showed lower levels of F-actin in response to PDT combined with AR03 treatment (
Figure 10). This may indicate that inhibition of APE1 promotes assembly and stabilization of microtubules in resistant A-431 cells and depolymerization of F-actin in resistant CAL-39 cells. Changes in the dynamics of actin or microtubules can lead to cell death. Agents that inhibit actin polymerization and destabilize existing F-actin [
39,
40] or promote microtubule assembly and stabilization [
20] have been linked to induction of apoptosis. The APE1 inhibitor in combination with PDT also decreased the amount of cadherins in resistant cells (
Figure 10). The reduction in the amount of cadherins may lead to the inhibition of their protective effect on the survival of cancer cells. As mentioned above, E-cadherin-mediated cell adhesion may promote cancer cell survival. However, N-cadherin dependent adhesion also was associated with inhibition of apoptosis [
15]. Therefore, APE1 inhibition may improve the effect of PDT not only by reduction of DNA repair efficacy, but also by affecting other processes, such as those that lead to cytoskeletal disruption (
Figure 10) or changes in heme metabolism pathway [
6].
4. Materials and Methods
4.1. Cell Cultures
Two human vulvar squamous cancer cell lines were used as a VIN model. A-431 was purchased from ATCC and CAL-39 from DSMZ. This cell lines are described as sensitive ones. Resistant cells were isolated by subjecting them to repeated PDT cycles as described in [
6]. Sensitive and resistant A-431 cell lines were cultured in RPMI-1640 medium (Gibco by Thermo Fisher Scientific, Waltham, MA, USA) supplemented with 10% fetal bovine serum (FBS; Gibco) and 1% penicillin–streptomycin antibiotic solution (Pen-Strep; HyClone by Thermo Fisher Scientific, Waltham, MA, USA). Sensitive and resistant CAL-39 cells were maintained in Dulbecco’s modified Eagle’s medium (DMEM; HyClone) with 20% FBS, 2 mM L-glutamine (Gibco), 1 mM sodium pyruvate (Gibco), 0.5 nM hydrocortisone (Sigma-Aldrich, Saint Louis, MO, USA), 1 μg/100 mL EGF (Gibco), and 1% Pen-Strep. All cell lines were cultured at 37 °C in a humidified incubator with 5% CO
2 and atmospheric oxygen concentration.
4.2. PDT-Treatment
Cells were incubated for 3 h in serum-free medium with 0.6 mM 5-aminolevulinic acid (5-ALA; precursor of actual PS - PpIX) (Sigma-Aldrich). Then, cells were exposed to red light (630 nm wavelength, 187 W/m2 power density) emitted by LED lamp with a dose describe in each experiment.
4.3. Mass Spectrometry Analysis
Protein extraction, digestion, measurement, and analysis were performed as described in [
6]. Proteins with
t-test value ≤ 0.05 and fold change of resistance to sensitive cell ≥ 1.5 or ≤ 0.67 were taken for further analysis. These include 85 proteins in line A-431 and 390 in CAL-39, which were analyzed with KEGG Mapper. The proteins’ functions were checked in the Uniport/Genecards databases (September 2019) and, if necessary, in additional publications.
4.4. Cell Cycle Analysis
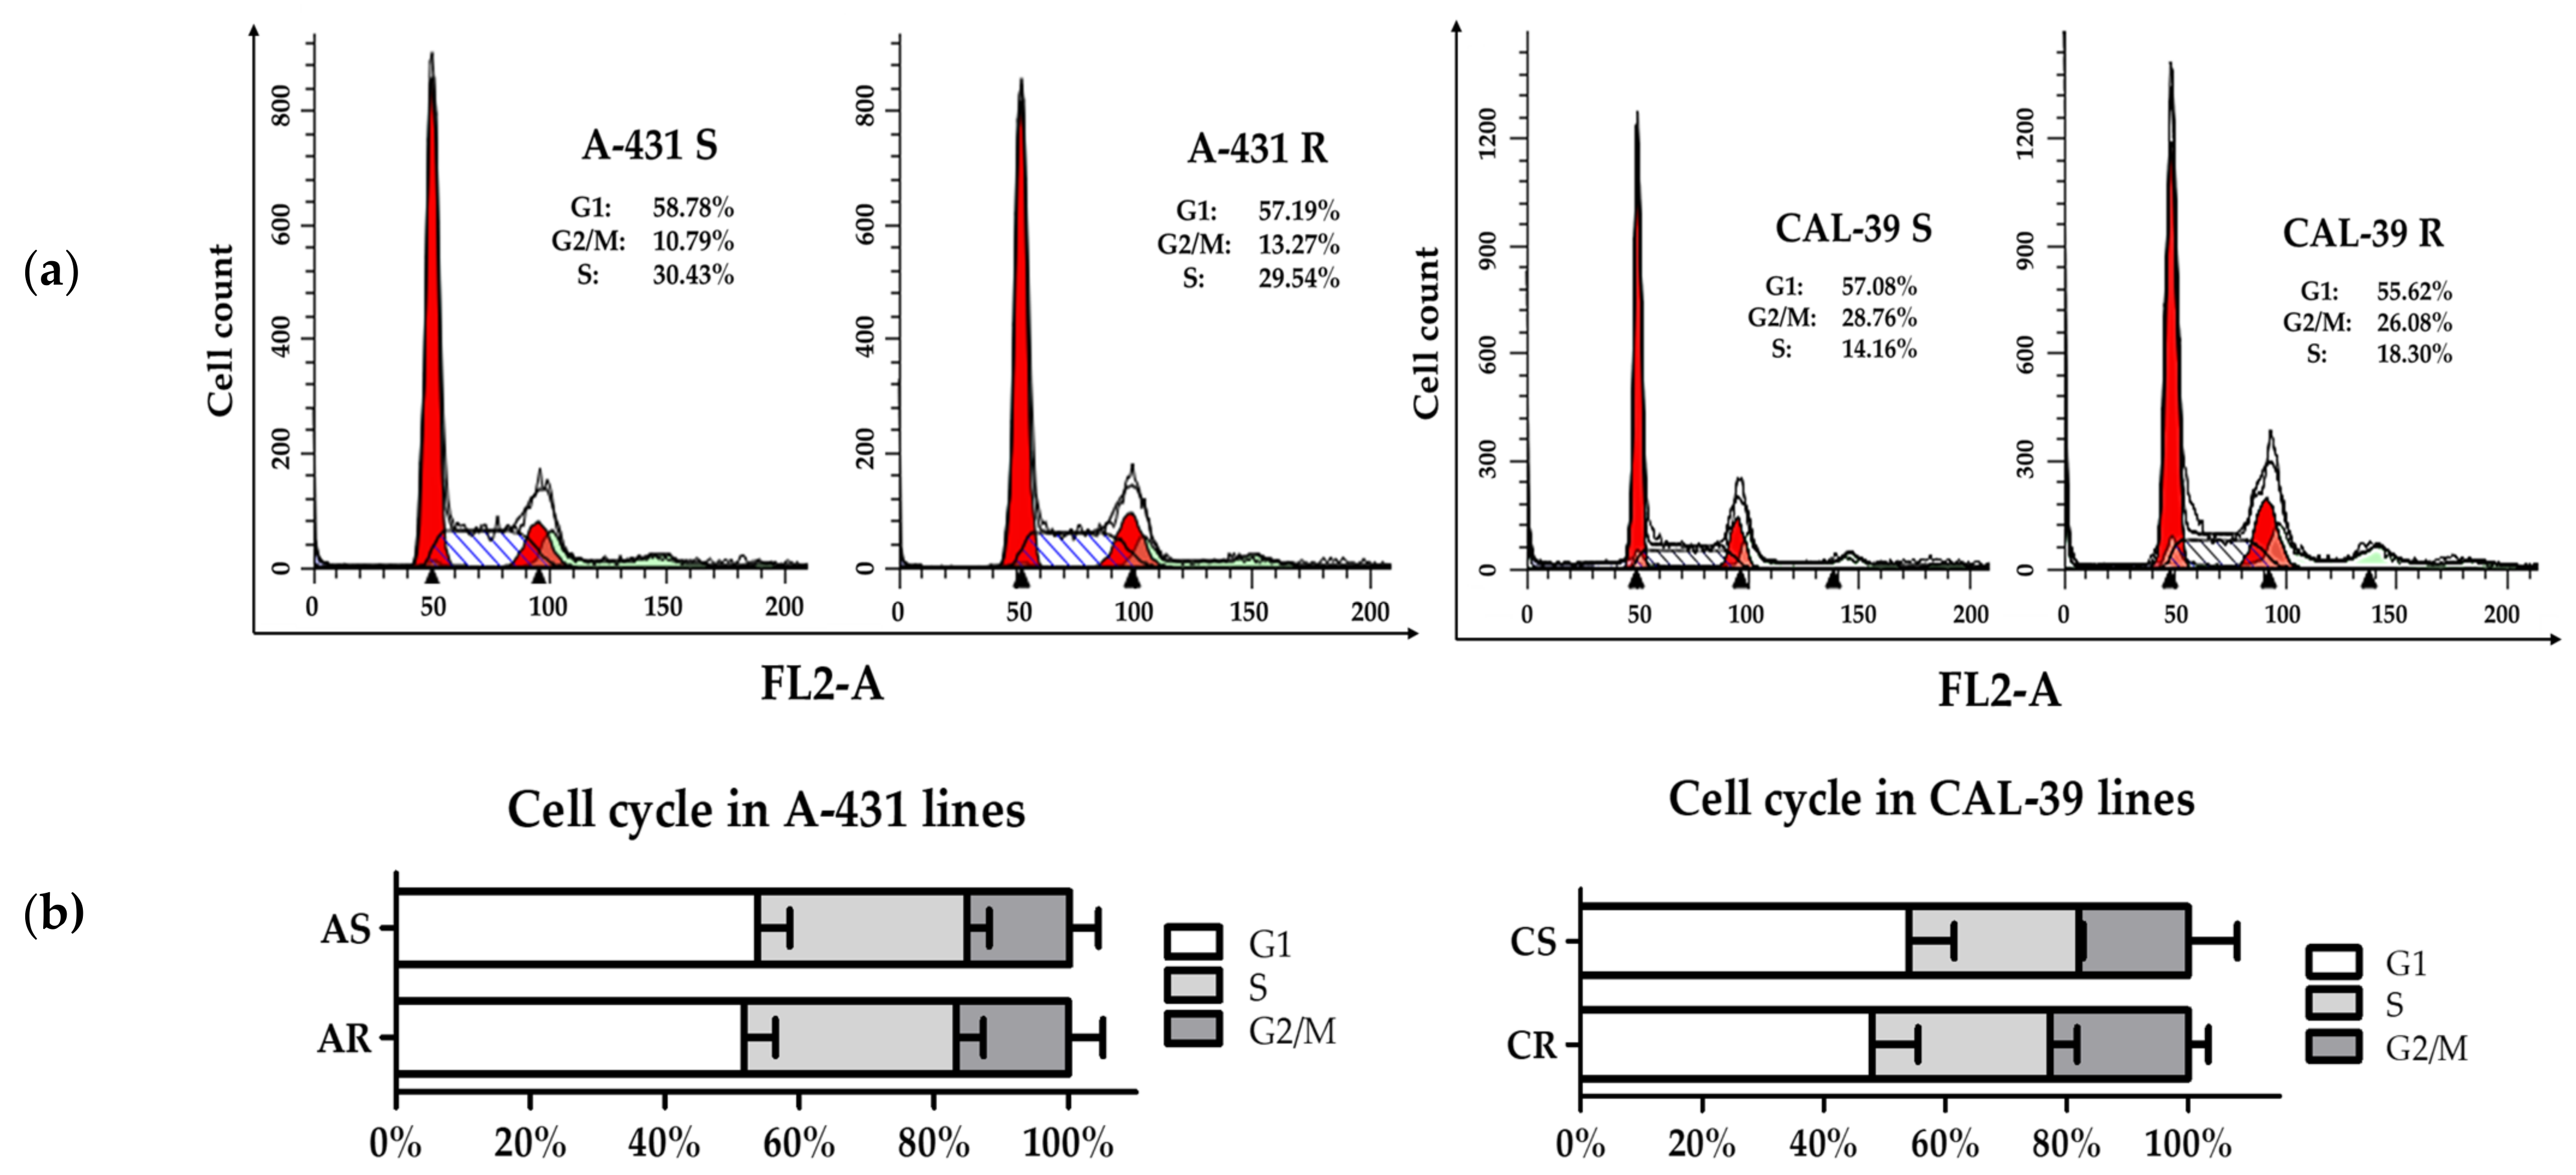
Cells were seeded on 10 cm dishes. After reaching 70–80% confluency, 106 cells were collected and centrifuged (4 min, 400 × g at room temperature). Cells were washed with PBS, resuspended in PBS, fixed overnight in cold 70% ethanol (4 °C). The next day, cells were centrifuged (7 min, 600 × g at 4 °C), washed with PBS and resuspended in PBS containing 50 µg/mL propidium iodide (PI) and 50 µg/mL RNase A (Sigma-Aldrich). Samples were incubated with the staining solution for 30 min in the dark on a shaker (50 rpm) at 26 °C and then analyzed on a BD FACS Calibur flow cytometer (BD Biosciences, NJ, USA) with the detector set to FL2A channel to detect excited PI. Data were collected in BD CellQuest Pro software (BD Biosciences) and presented as histograms showing DNA content of the cell nuclei. Further analysis was performed using ModFit LT software (BD Biosciences). The experiment was carried out in at least triplicate using independent cell cultures.
4.5. Measurement of Oxidative Stress Using CellROX Green Reagent
Cells were seeded in 24-well plates at a density of 2 × 10⁵ per well for A-431 cell lines or 1.5 × 10⁵ per well for CAL-39 cell lines. Cells of each line were subjected to PDT (with light dose of 11.2 J/cm2 for CAL-39 cells or 16.8 J/cm2 for A-431 cells), treated with H2O2 (100 μM and 1 mM) or TBHP (10 μM and 100 μM). Untreated cells were used as a control. After treatment, in all wells, the medium was changed to that containing 5 µM CellROX Green reagent (Thermo Fisher Scientific) and cells were incubated for 30 min at 37 °C. Afterwards, cells were washed three times with PBS, fixed in 3.7% formaldehyde (in PBS), washed twice with PBS and stained with DAPI (Vector Laboratories, Burlingame, CA) in PBS (1: 1000) for 30 min. At least 10 random pictures were taken on each well using ScanR fluorescence microscope (Olympus, Tokyo, Japan) with UPlanSApo 20.0× NA 0.75. Images were processed and analyzed with ImageJ software (National Institutes of Health, Bethesda, MD, USA). The results are presented as a percentage of the mean fluorescence intensity of the parental untreated cells. The experiment was carried out at least in triplicate using independent cell cultures.
4.6. Cell Viability Assay
Cells were seeded 24 h before the experiment at a density of 6 × 10³ cells per well. The next day, cells were incubated for 1.5 h with TBHP or H2O2 at concentrations: 10 μM-50 mM for A-431 cells and 10 μM-25 mM for CAL-39 in serum-free medium. Control cells were incubated in serum-free medium. After treatment, cells were incubated for 4 h with 10% alamarBlue Cell Viability Reagent (Invitrogen, Thermo Fisher Scientific, Waltham, MA, USA) in complete medium at 37 °C in a cell culture incubator. Fluorescence intensity was measured using a DTX 880 Multimode Detector (Beckman-Coulter; Brea, CA, USA) at 540 nm excitation and 590 nm emission wavelengths. The fluorescence ratio of the tested groups to the untreated control was calculated and presented as a percentage value of the control. Cell viability assay was performed at least three times with independent cell cultures.
4.7. Analysis of the Type of ROS
Cells were seeded in black 24-well plates (A-431 cell lines and sensitive CAL-39 cells at a density of 1,5 × 10⁴ per well and resistant CAL-39 cells at 4 × 10⁴ per well). After 3 days, cells were incubated: 1) 3 h with 20 μM Singlet Oxygen Sensor Green (Invitrogen), which in the presence of 1O2 emits green fluorescence, 2) 10 min with 5 μM MitoSOX Red (Invitrogen), which as a result of oxidation by O2•− produces red fluorescence, or 3) 3 h with 20 μM hydroxyphenyl fluorescein (Invitrogen), which after oxidation by HO• or ONOO− shows green fluorescence. In addition, cell nuclei were stained for 20 min with 5 µg/mL Hoechst 33342 (Invitrogen) in all variants of the experiment. Twenty-five random pictures were taken for each well using ScanR fluorescence microscope (Olympus) with UPlanSApo 20.0× NA 0.75. The analysis was performed automatically by related software. At least three independent experiments were conducted.
4.8. Comparison of Mitochondria Amount
Cells were seeded in black 96-well plates. The next day, cells were subjected to PDT with a light dose of 1.1 J/cm2 for CAL-39 cell lines and 3.4 J/cm2 for A-431 cell lines. Untreated cells were used as controls. Then, in all wells, medium was changed and cells were incubated for 30 min in serum-free medium containing 100 nM MitoTacker Green (Invitrogen), 2.5 μg/mL Hoechst 33342, after which cells were washed with PBS and flooded with serum-free medium. Pictures were taken using ScanR fluorescence microscope (Olympus) with UPlanSApo 20.0× NA 0.75. The mean value of corrected total cell fluorescence (CTCF) was calculated for each variant of the experiment using ImageJ. The experiment was performed at least in triplicate using independent cell cultures, and the results were presented as the percentage of mean CTCF of untreated parental cells.
4.9. Scratch Assay
The rate of migration was measured using the scratch assay. Cells were seeded in 24-well plates at the density of 3 × 10⁵ cells per well for A-431 cells, 4.5 × 10⁵ for sensitive CAL-39 cells and 5.5 × 10⁵ for resistant CAL-39 cells. After reaching 95–100% confluence, PDT was performed with light dose of 1.1 J/cm2 for CAL-39 cells and 3.4 J/cm2 for A-431 cells. Untreated cells were used as controls. The medium was removed and in each well scratch was made. Cells were rinsed with PBS and flooded with serum free medium. Pictures were taken at 0, 3, 6 and 21 h after scratch was performed using the Xcellence fluorescence microscope (Olympus) with the UplanFL N 4× objective with phase contrast (Olympus). Scratches were measured in 10 places for each image in ImageJ and converted to percent of the size of the scratch relative to time 0. The experiment was carried out at least in triplicate using independent cell cultures.
4.10. Immunofluorescence
The experiment was performed as described in [
6]. Cells seeded in 24-well plates were cultured until 70% confluence was reached and treated with (1) PDT, (2) APE1 inhibitor, or (3) PDT with APE1 inhibitor. Untreated cells were used as a control. Afterwards, cells were washed 3 times with PBS, fixed with 3.7% paraformaldehyde in PBS, permeabilized with 0.2% Triton X-100 in PBS and again washed 3 times with PBS. Subsequently, cells were blocked in SuperBlock (PBS) (Thermo Scientific) with 0.025% Triton X-100, washed 5 times with PBS containing 0.5% BSA, and incubated overnight with primary antibodies (
Table 1). The next day, cells were washed 5 times with PBS containing 0.5% BSA and incubated for 1 h at room temperature in the dark with secondary antibodies (
Table 1) or phalloidin-iFluor 647 (Abcam) diluted 1:1000 in PBS containing 0.5% BSA.
4.11. Statistical analysis
Data presented in Figures are means ± SD of at least three independent experiments. Statistical significance of differences between groups was estimated by two-tailed Mann-Whitney test or two-way analysis of variance (two-way ANOVA) followed by Bonferroni post-tests. Differences were considered significant if the p-value was ≤ 0.05. Data was analyzed and visualized using GraphPad Prism 5.03 (GraphPad Software)
Samples were washed with limited access to light: 5 times with PBS containing 0.5% BSA and 3 times with PBS and then cell nuclei were stained with Fluoroshield Mounting Medium With DAPI (Abcam). Six random pictures of each well were taken using Zeiss LSM 800 confocal microscope (20× objective). The images were analyzed with ImageJ software and CTCF was calculated. This experiment was carried out at least three times with an independent cell culture. Results showing changes that occurred with development of resistance and in response to PDT in sensitive and resistant cells are presented as percentage values of sensitive cell fluorescence. Results of APE1 inhibitor treatment alone and in combination with PDT are presented as percentage values of untreated resistant cell fluorescence.

 ,
, 


