
Long-Term Simulation of Microgravity Induces Changes in Gene Expression in Breast Cancer Cells

 , , , , and
Abstract
:1. Introduction
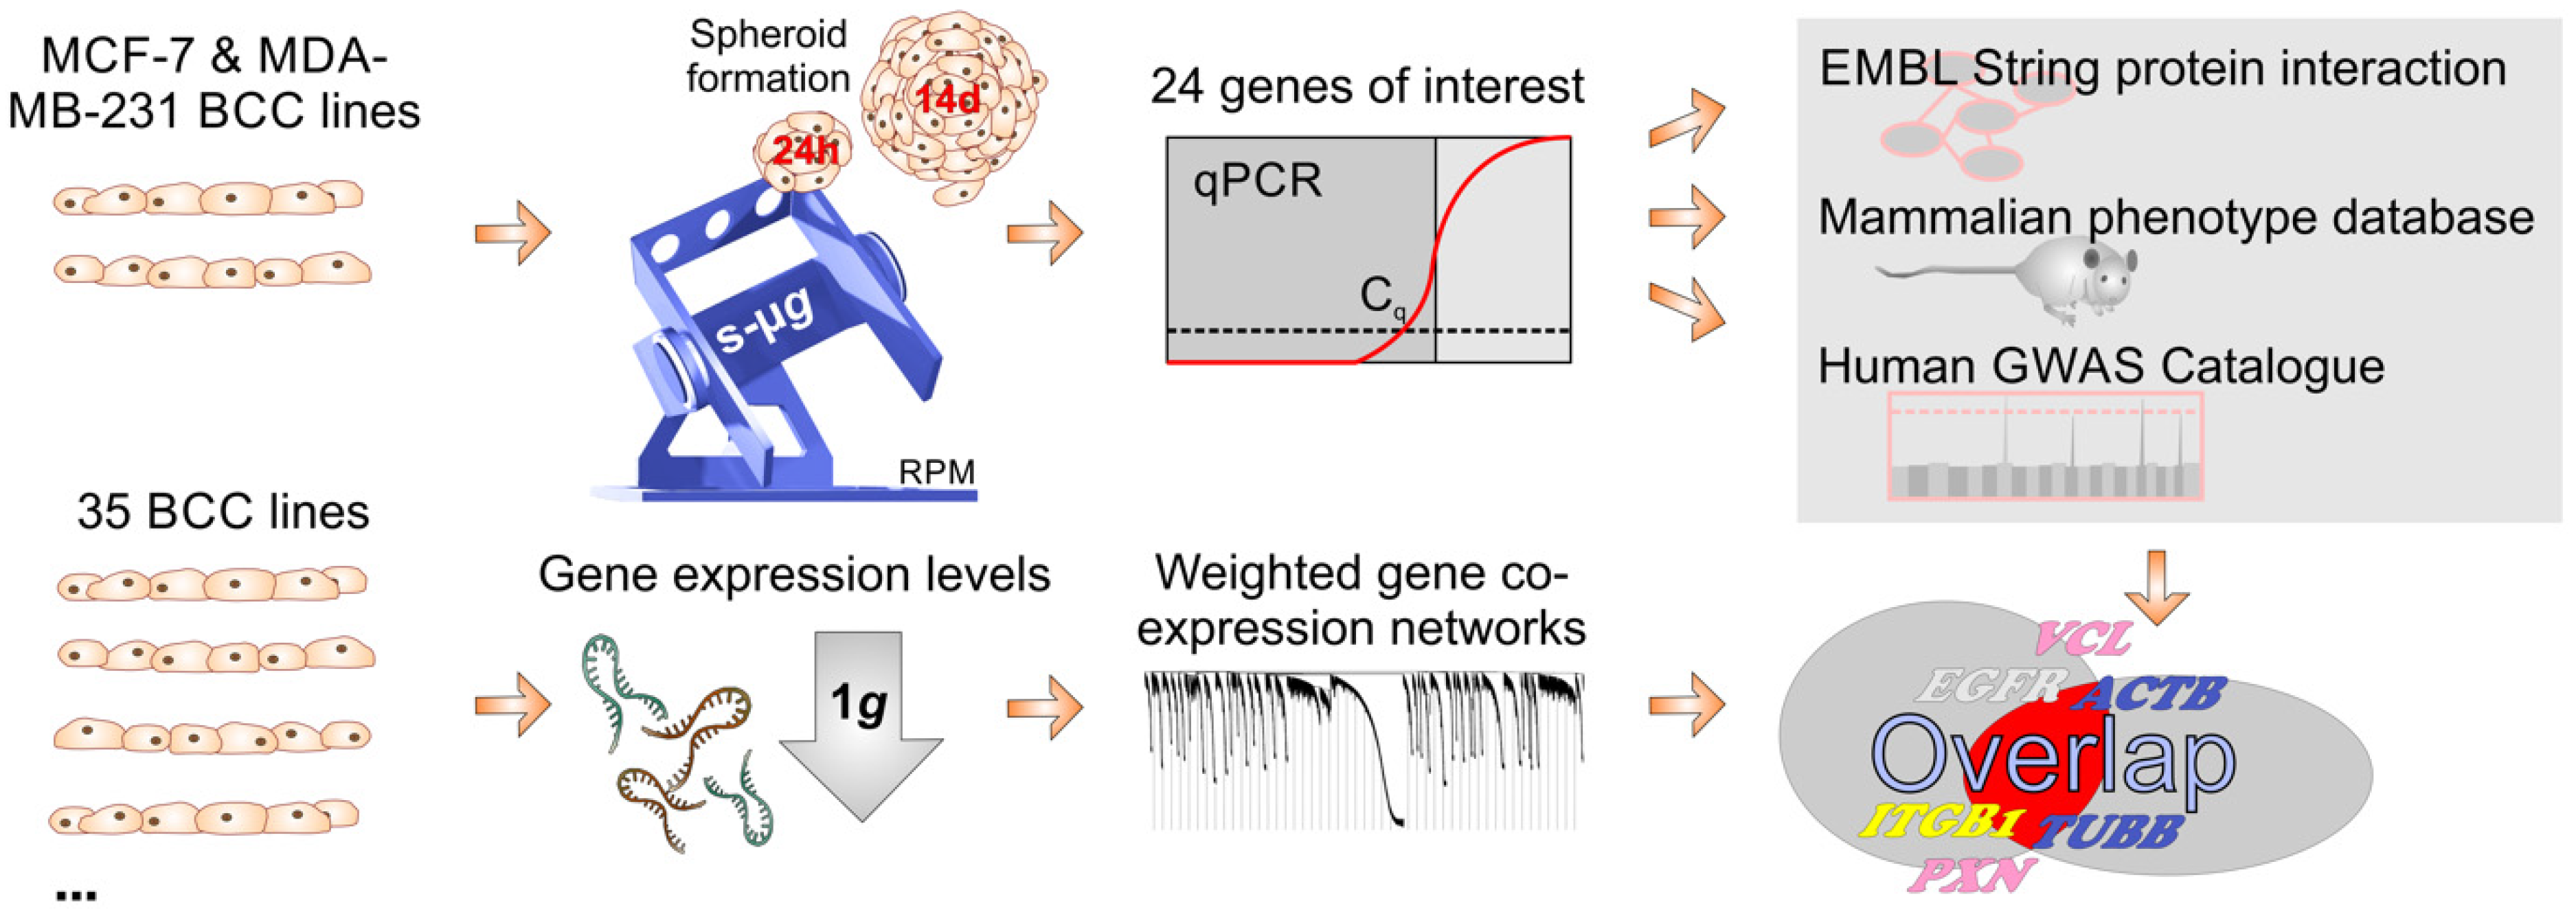
2. Results
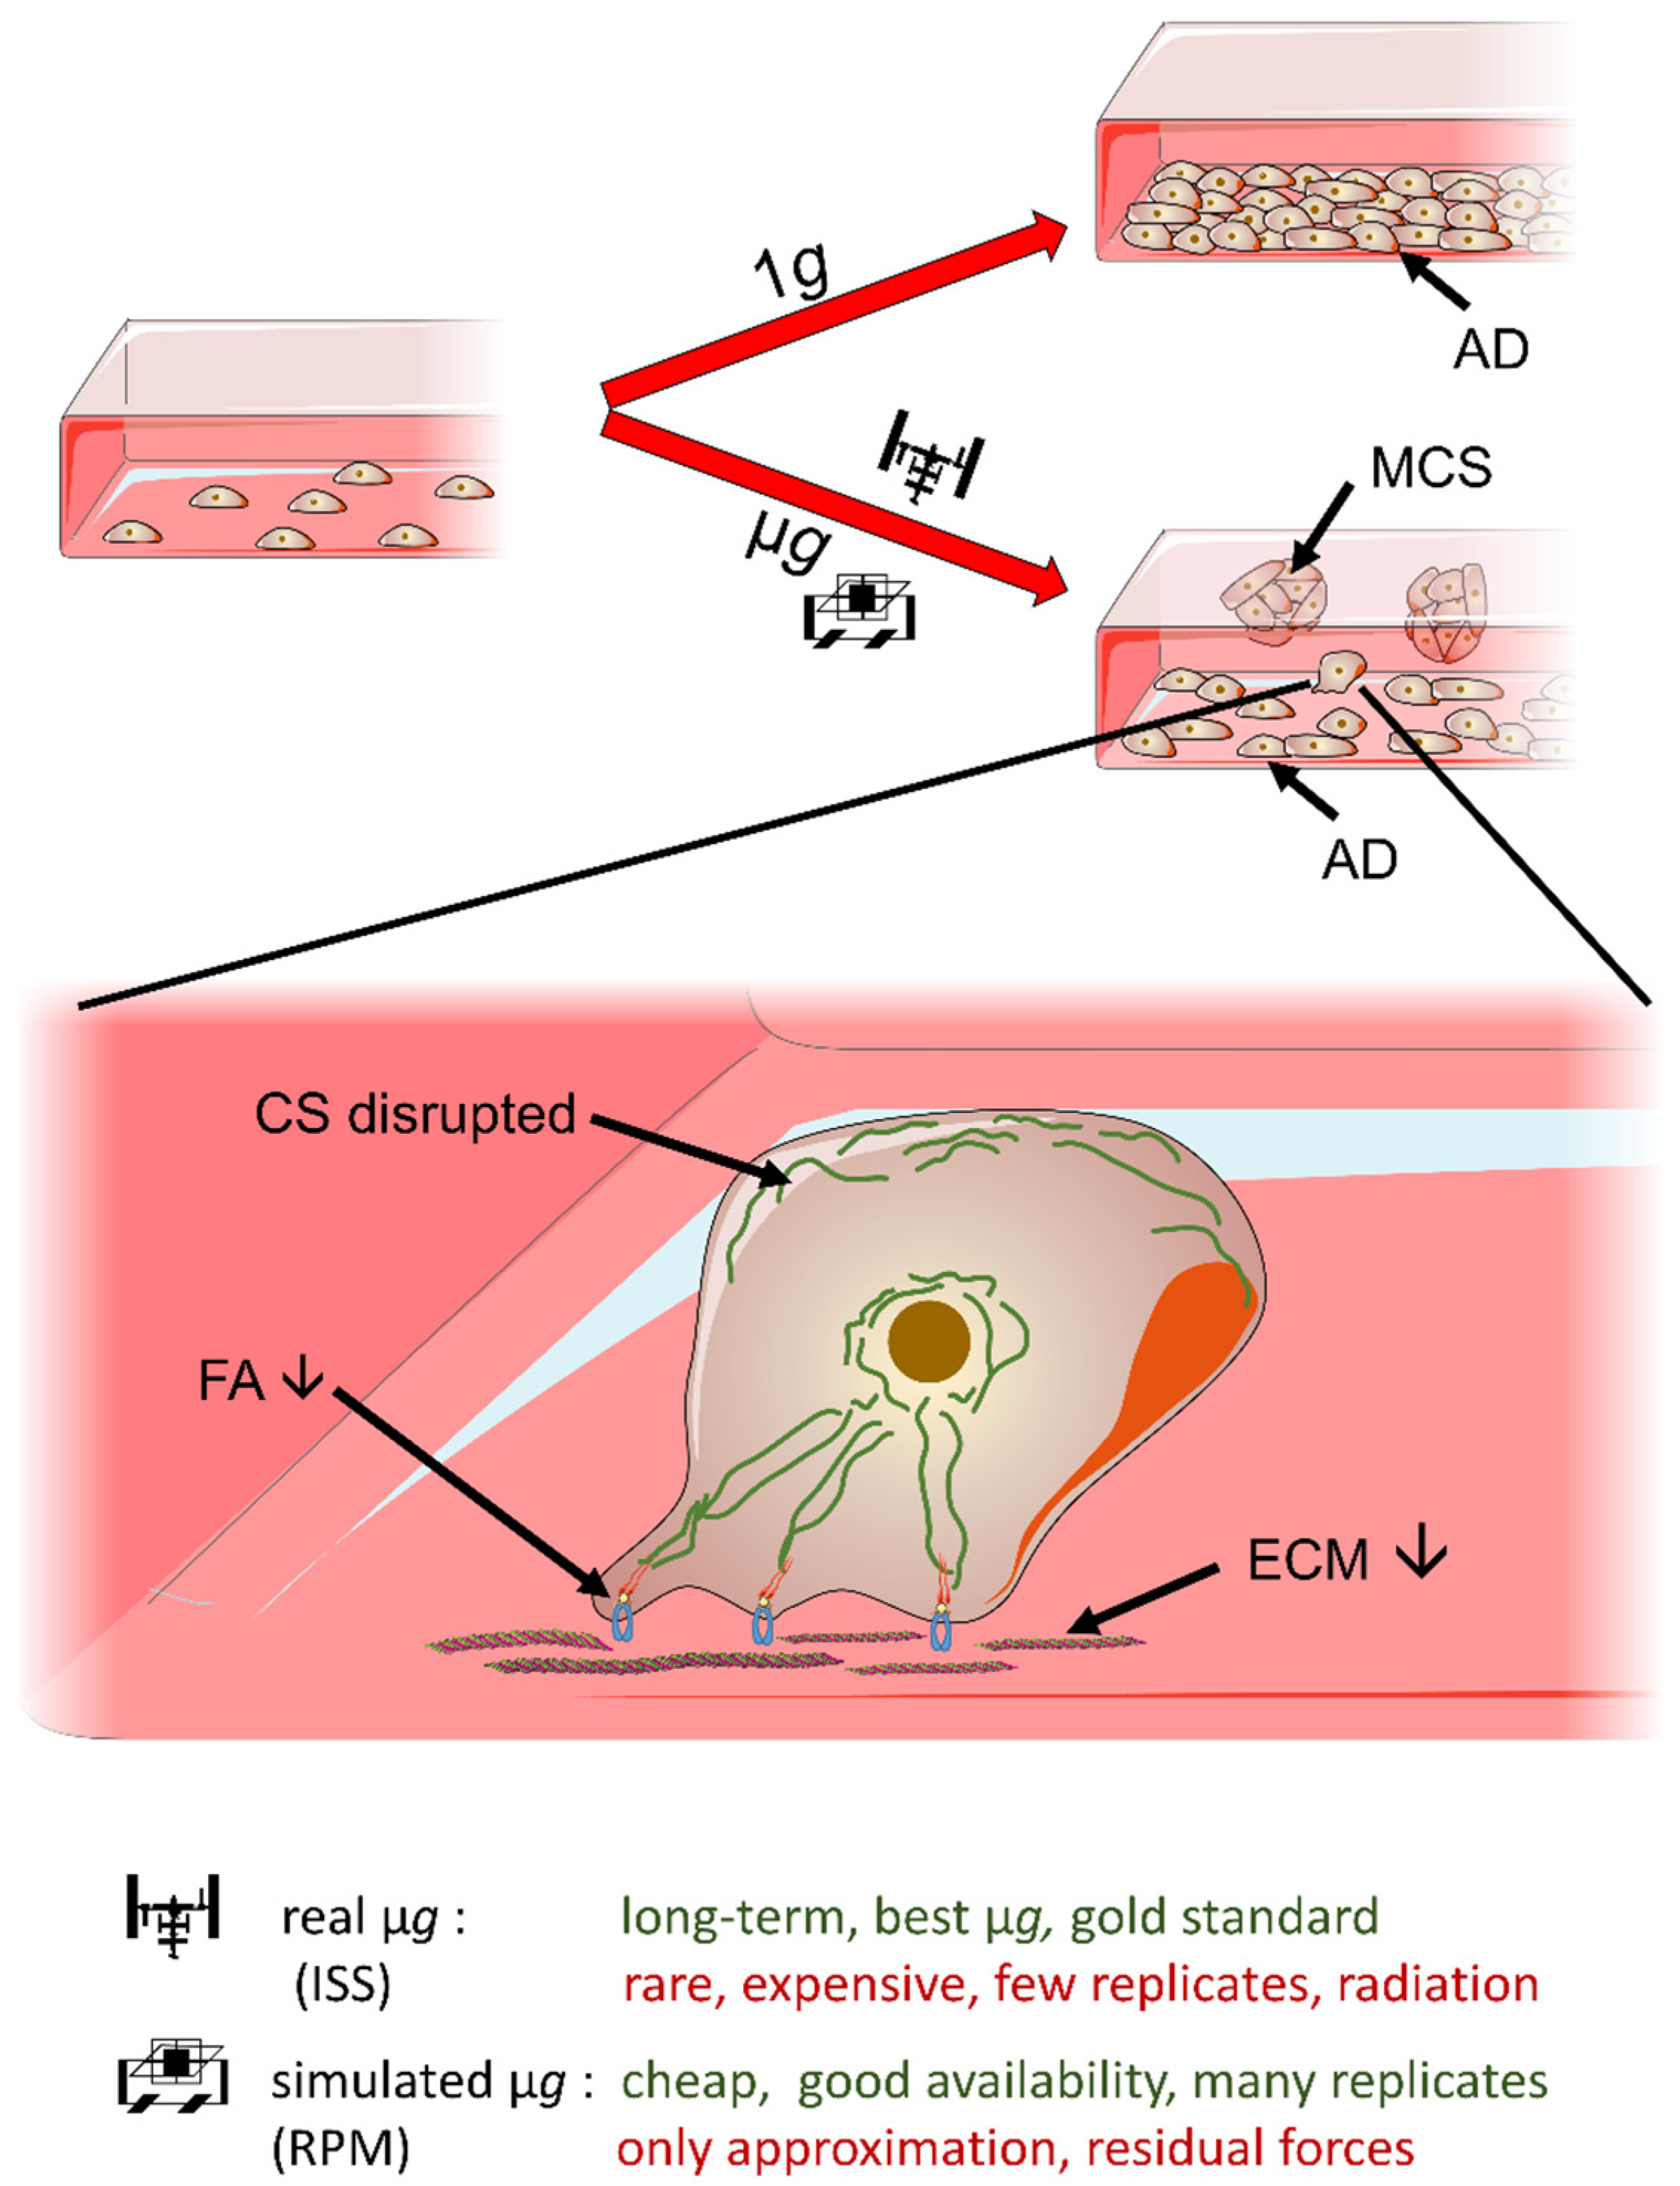
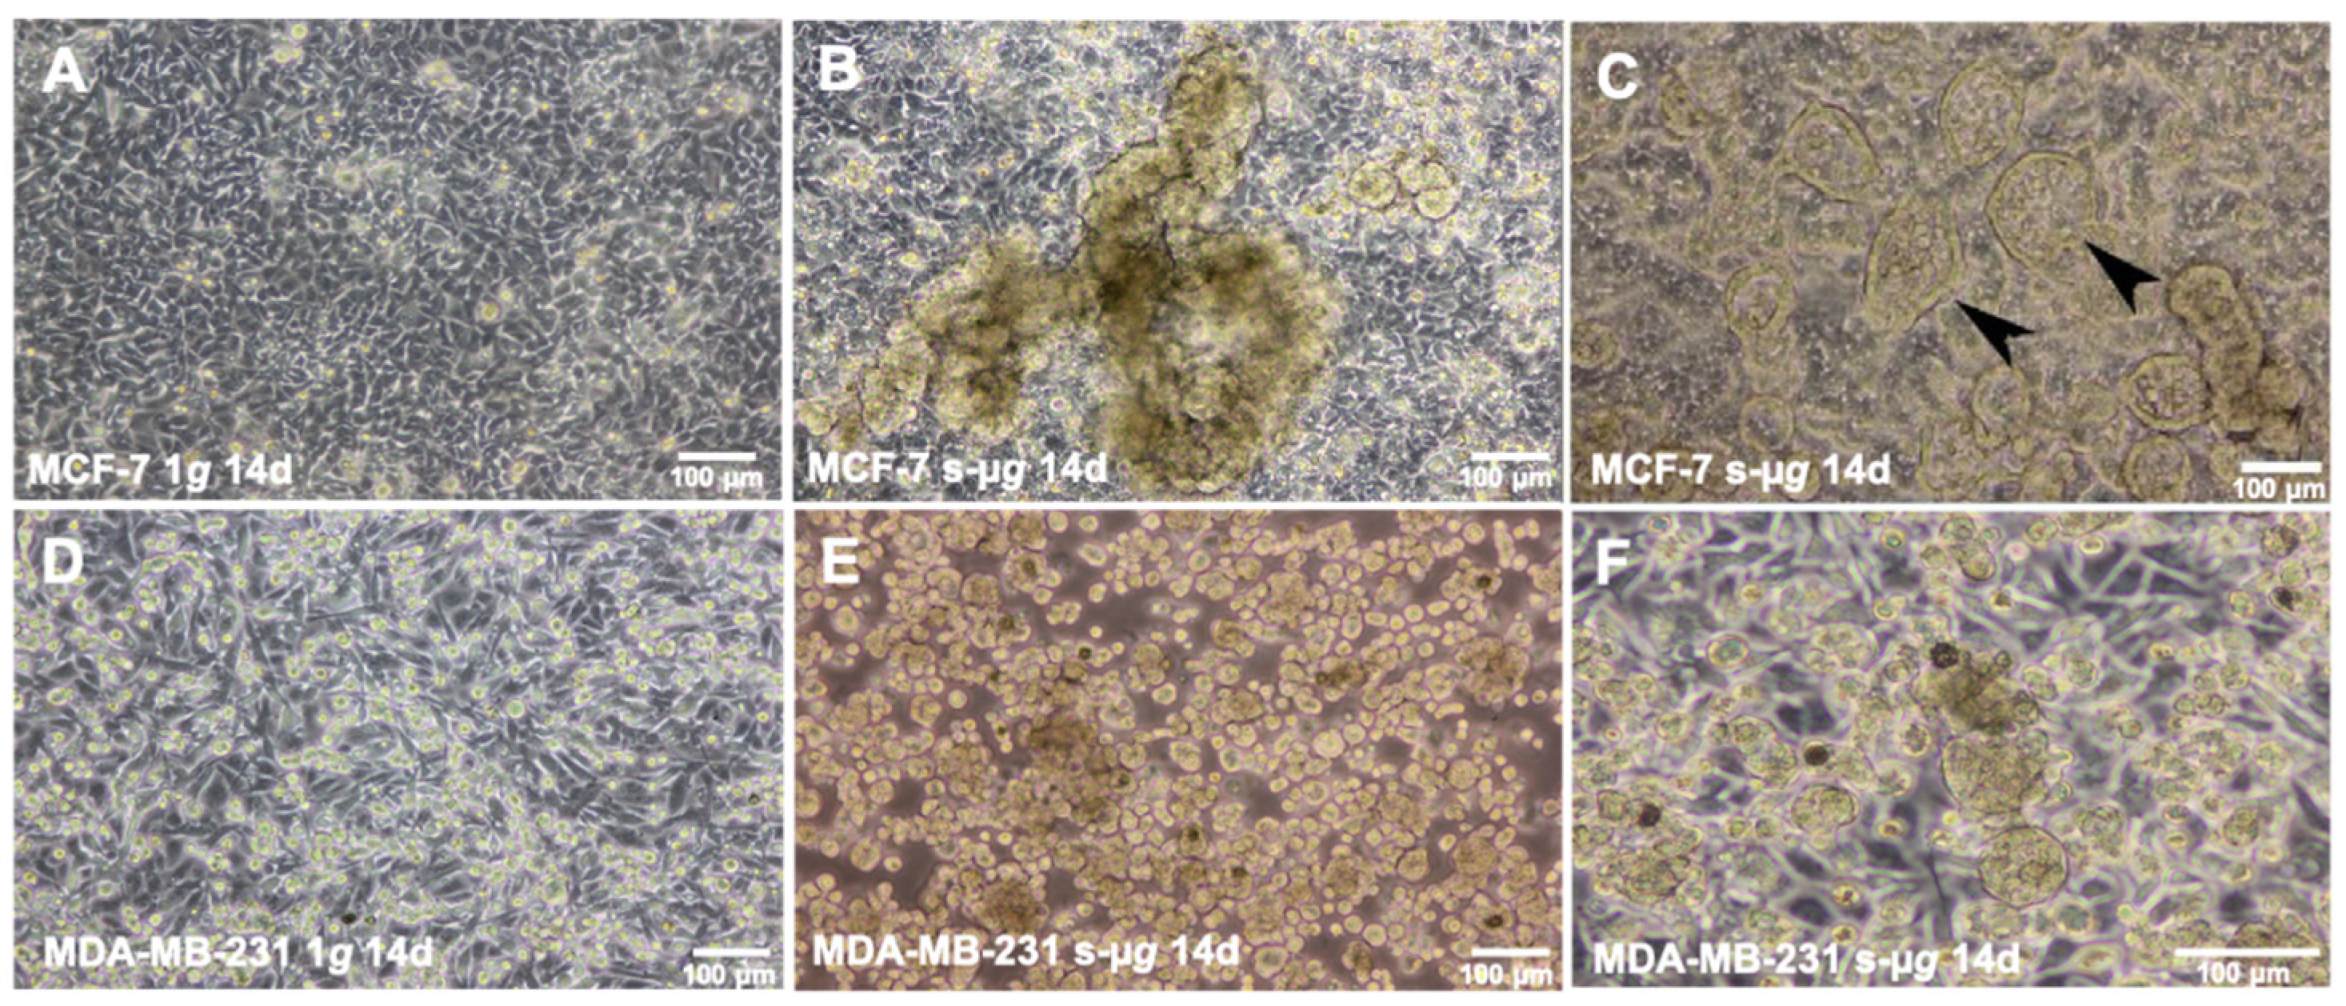
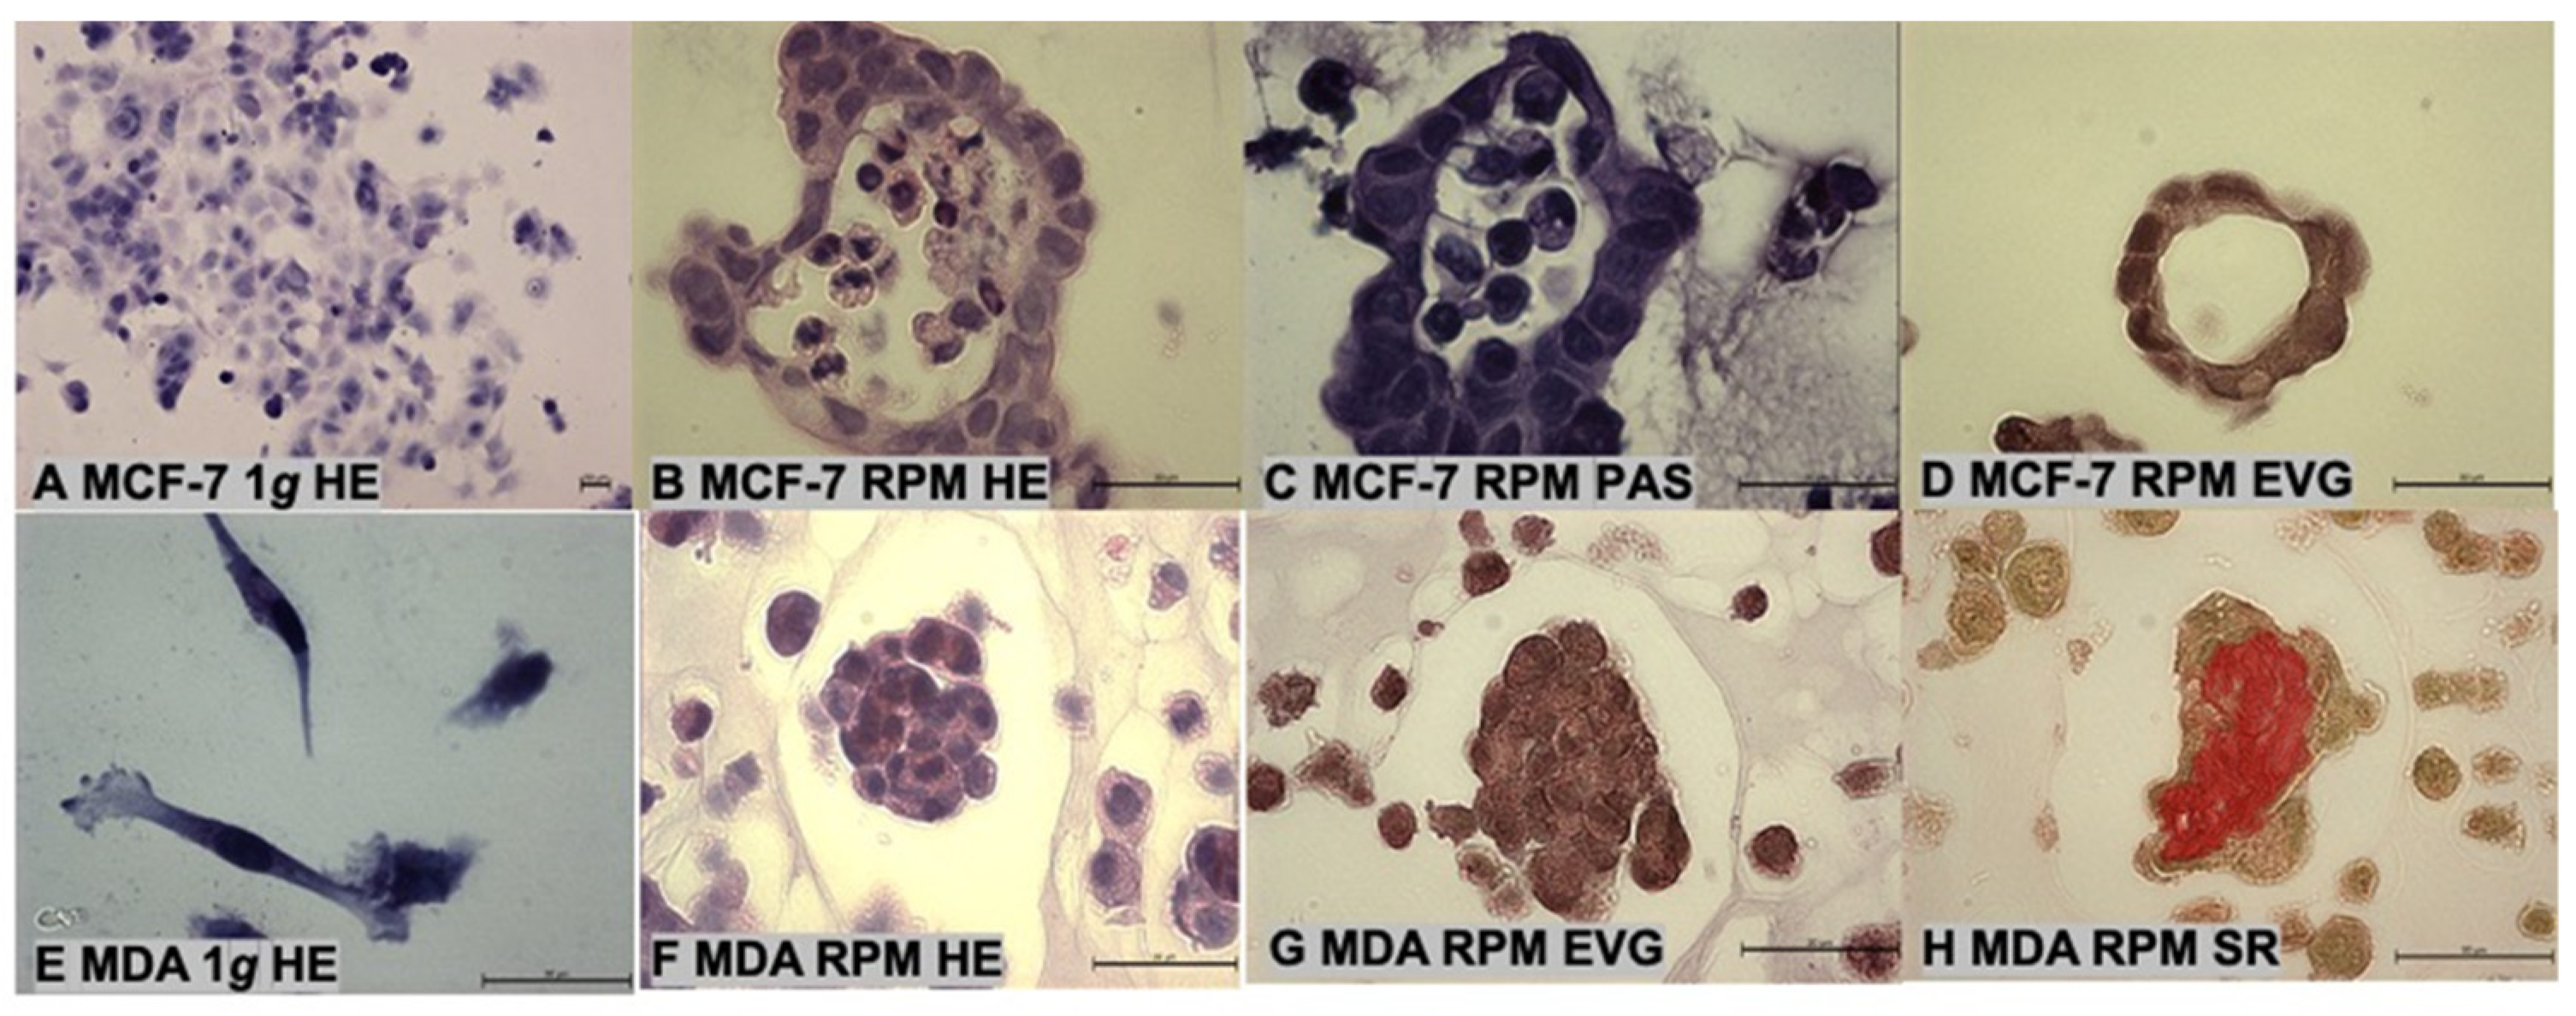
2.1. Cell Growth and Morphology
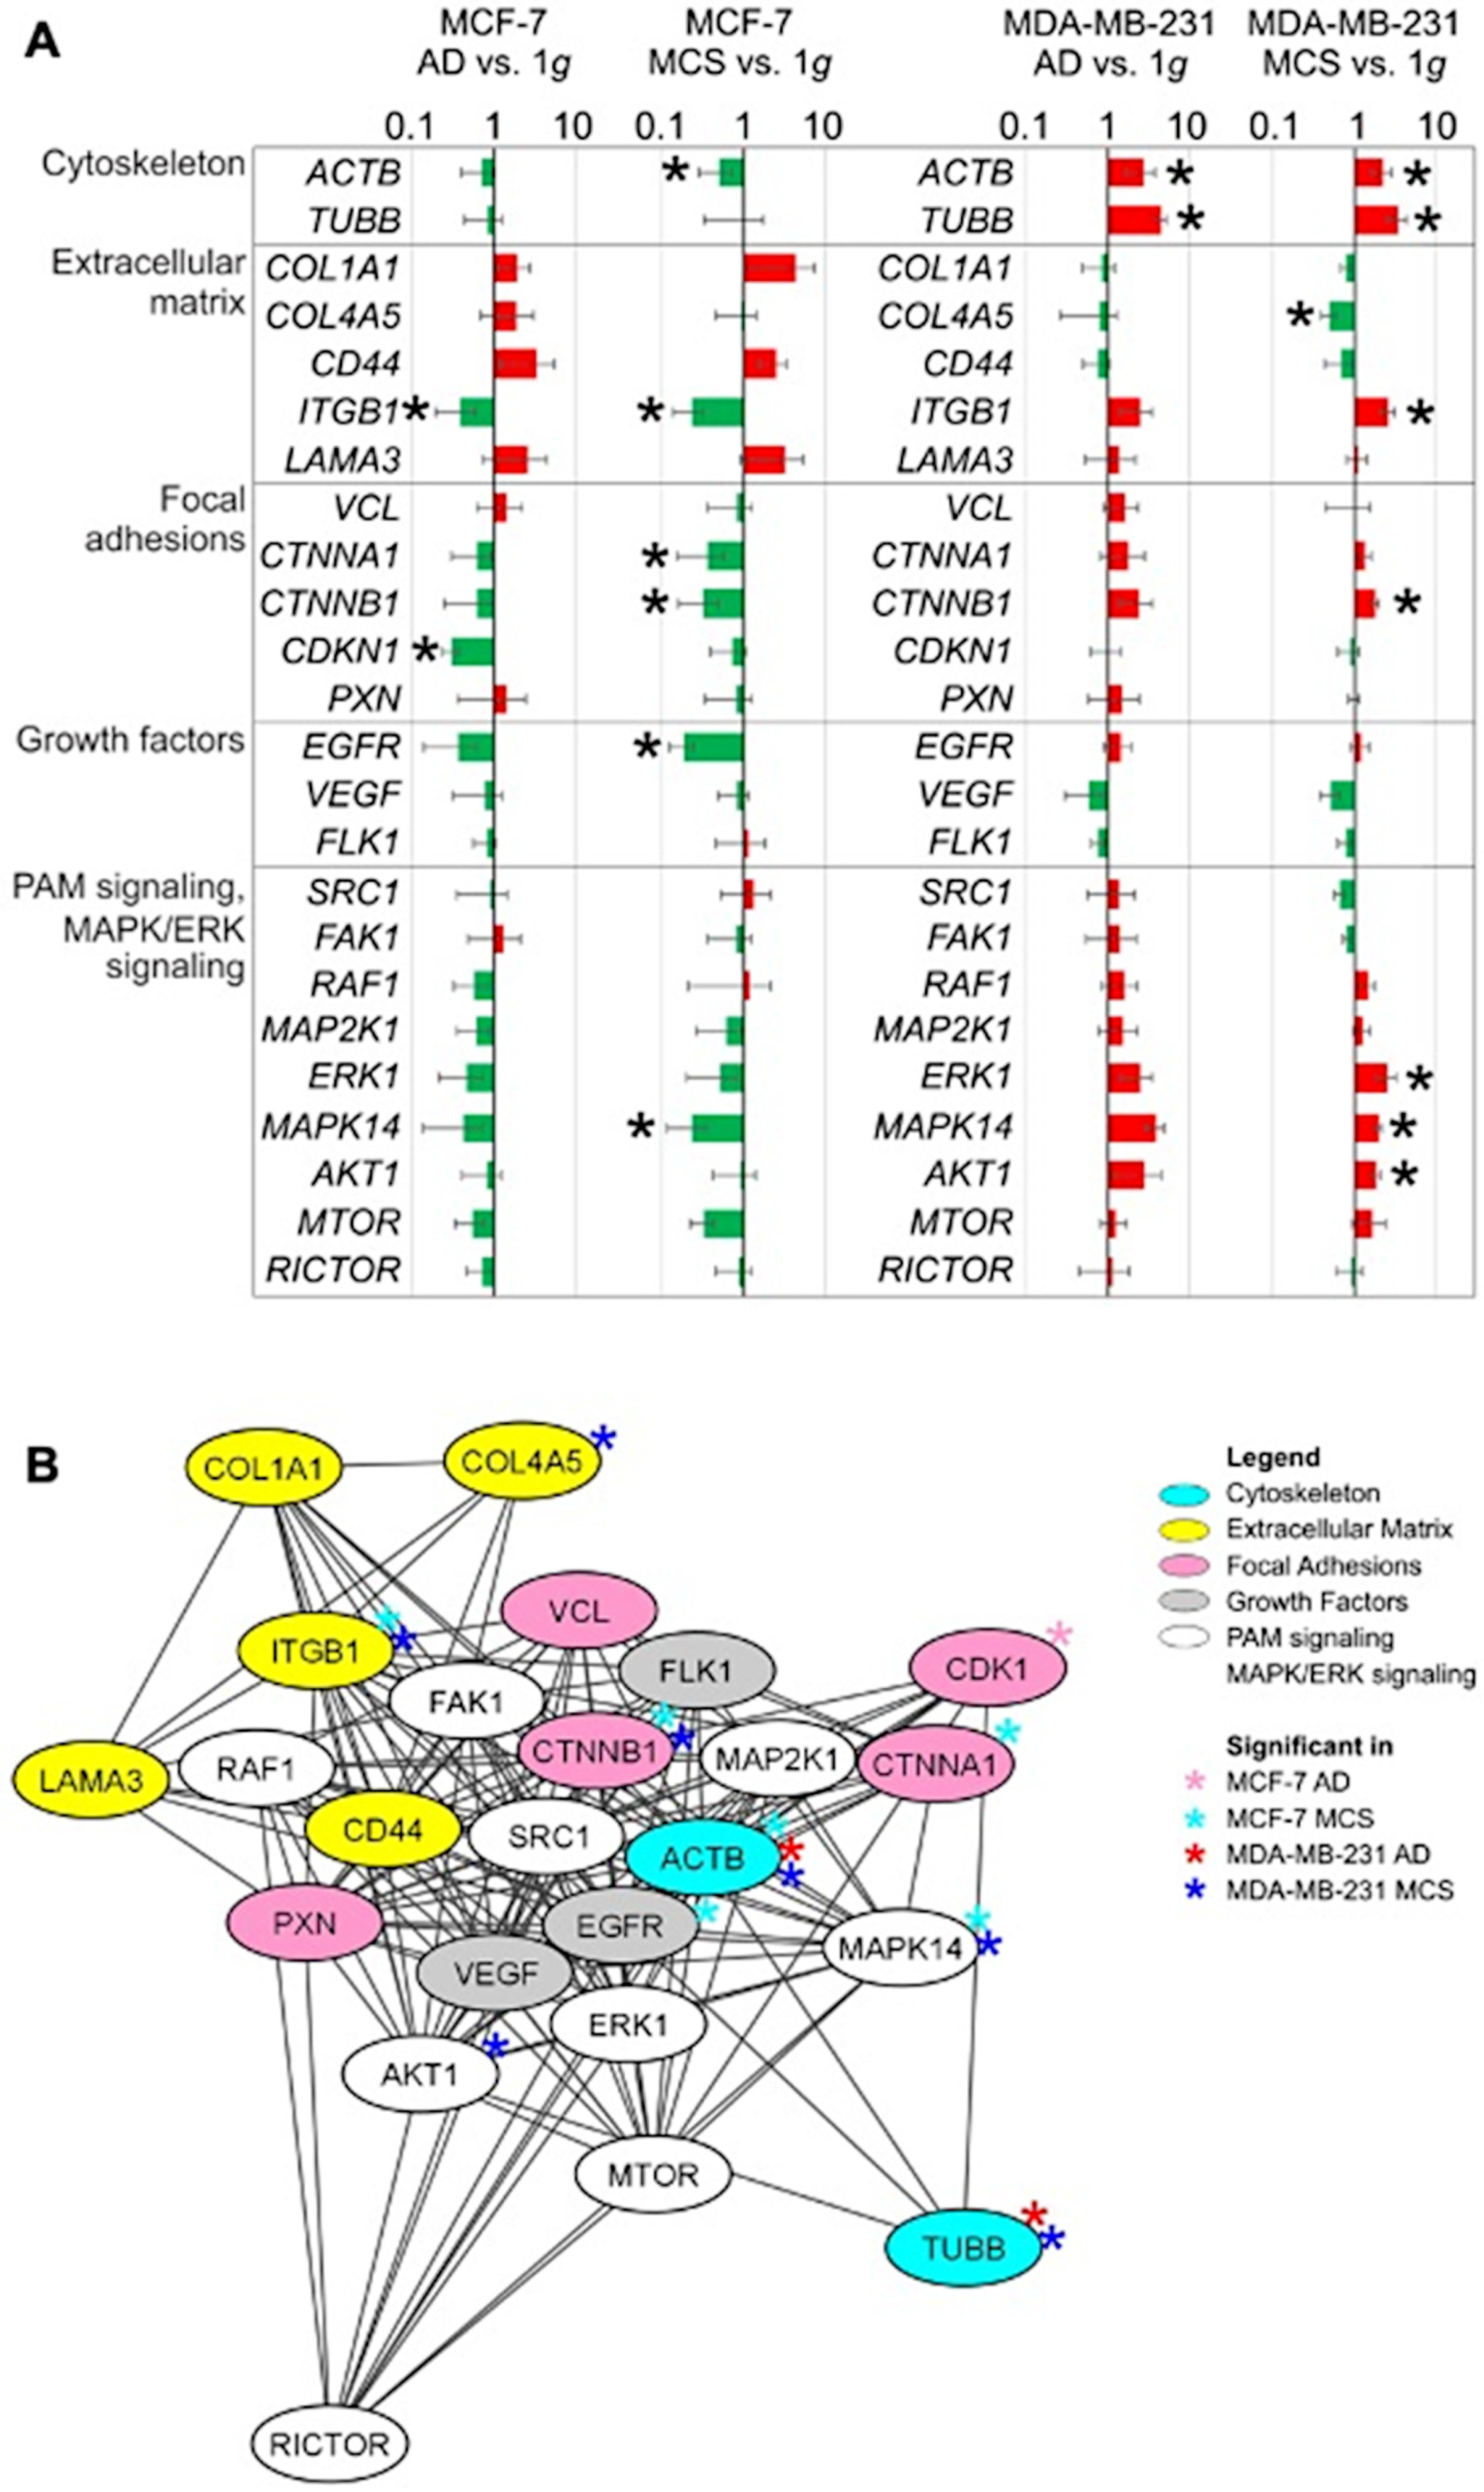
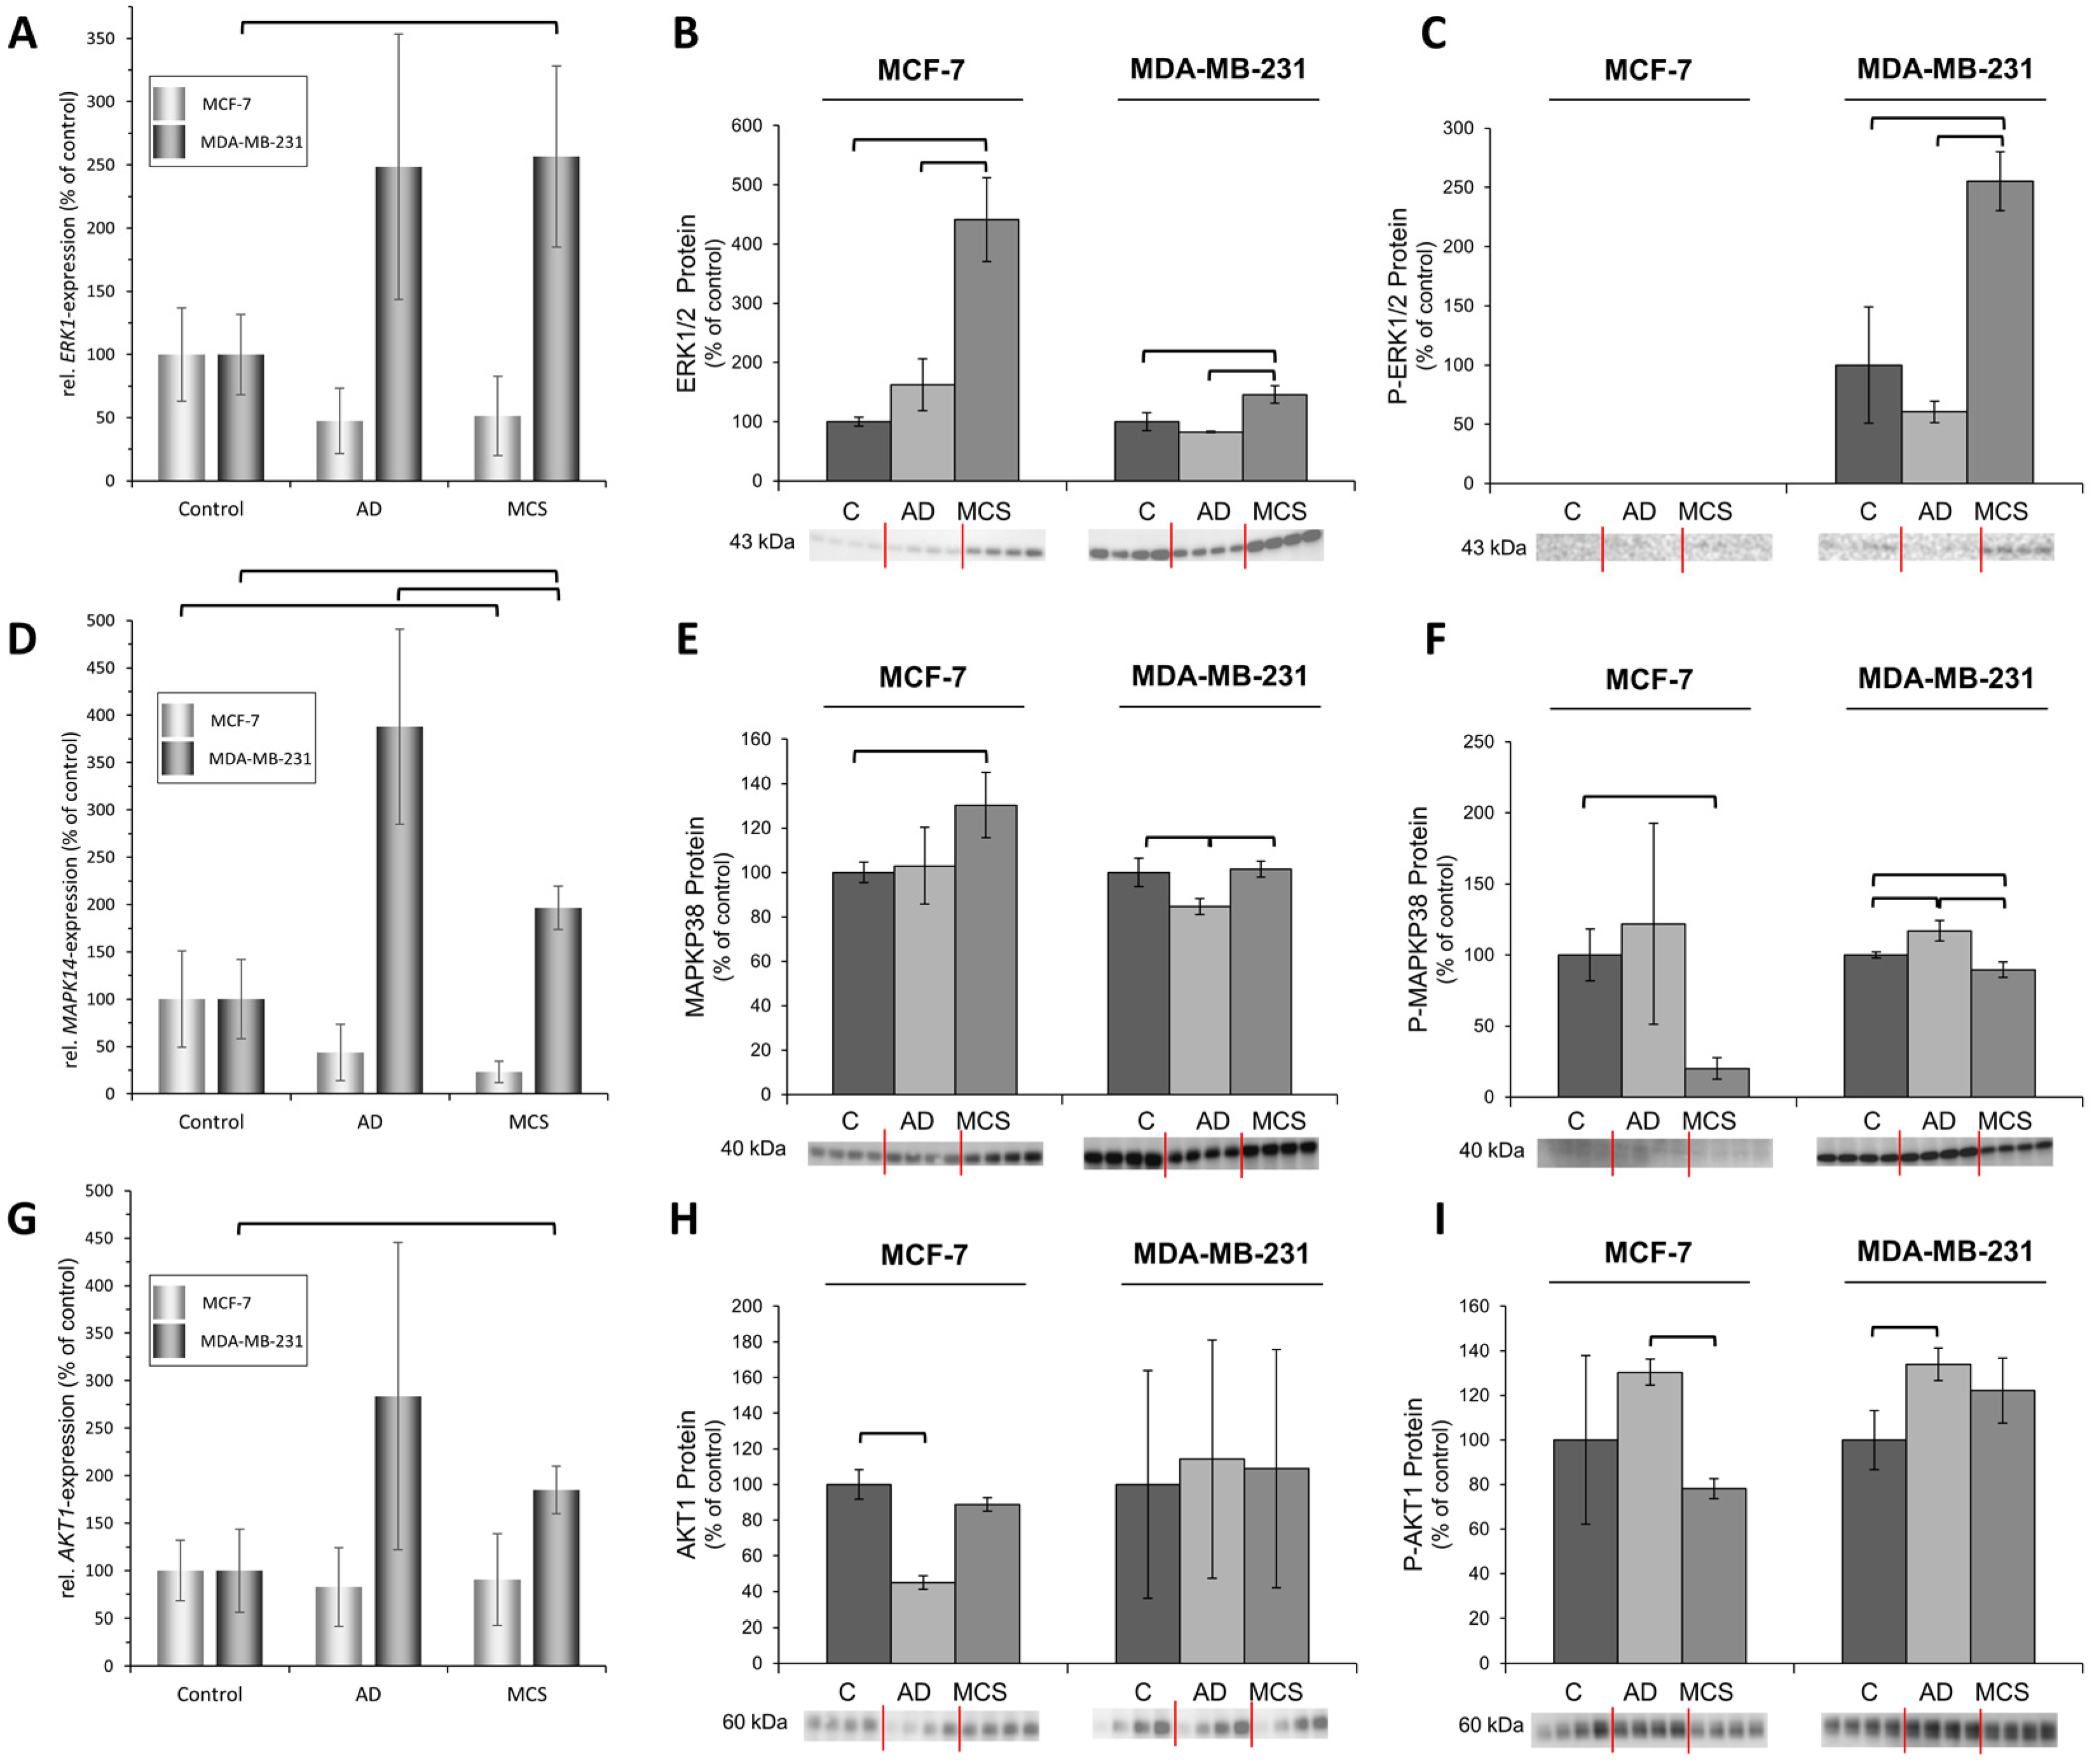
2.2. Expression Changes in Genes Related to the Cytoskeleton, Extracellular Matrix, Focal Adhesion Genes, Growth Factors and Signal Transduction
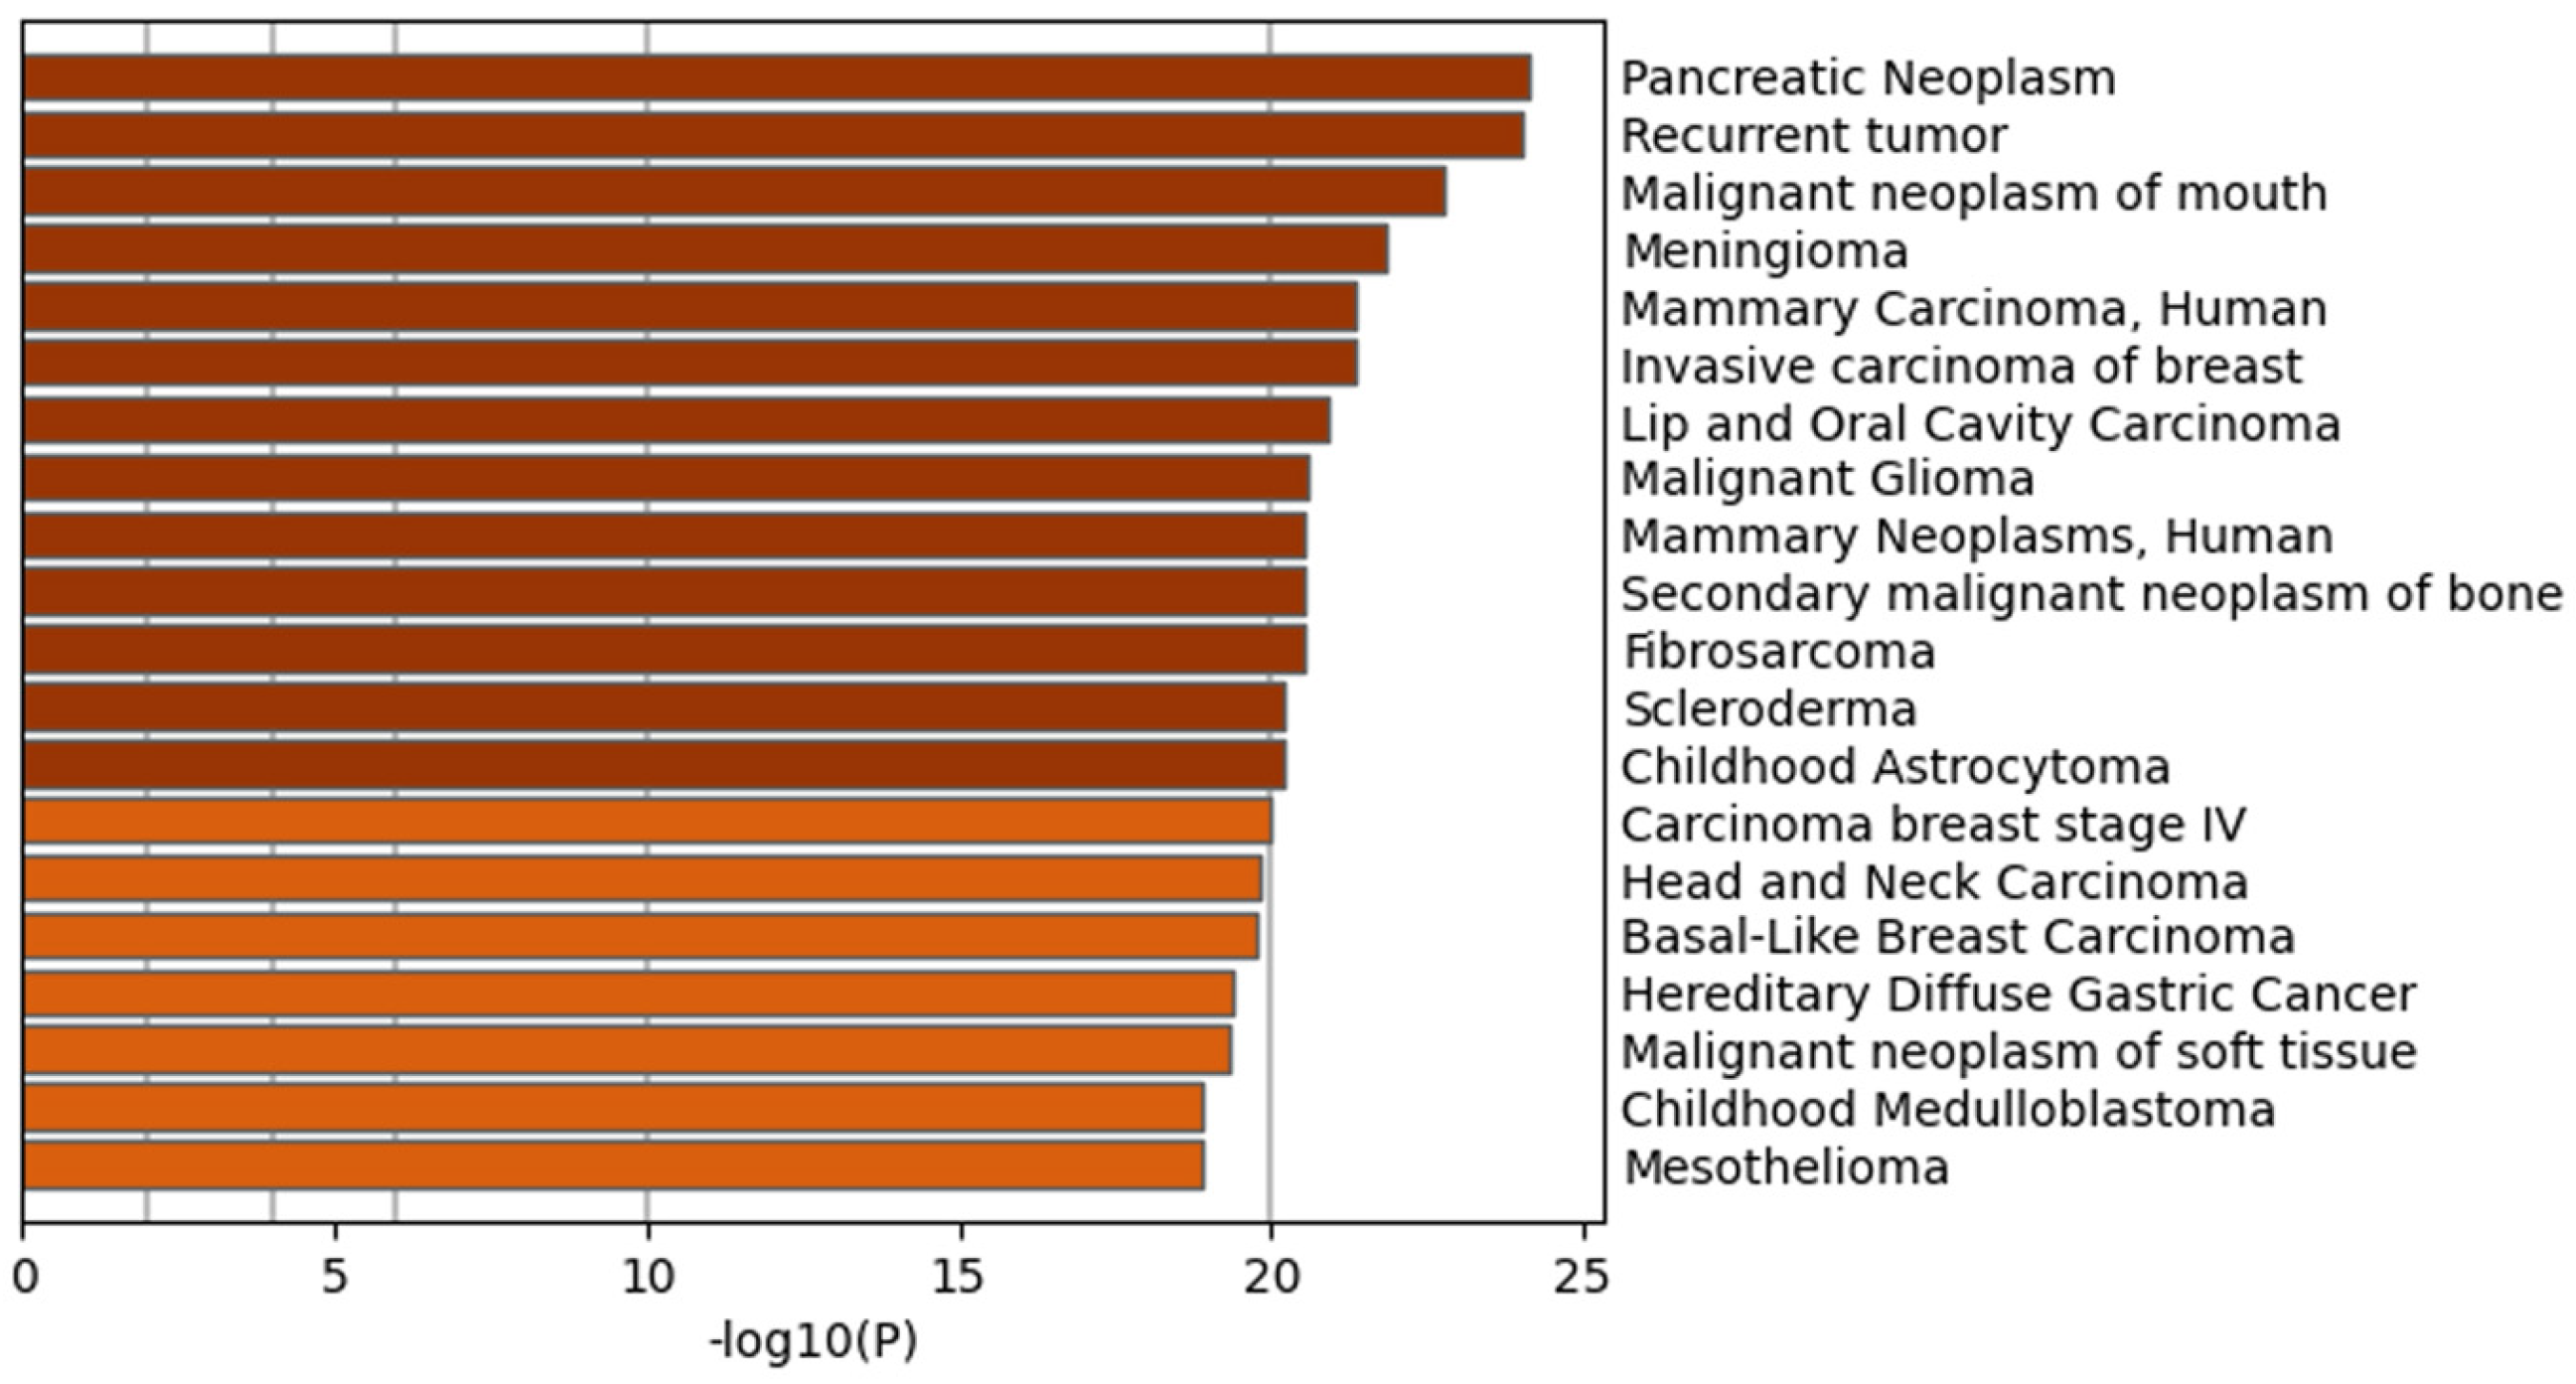
2.3. Mammalian Phenotype Database and Human GWAS Catalogue
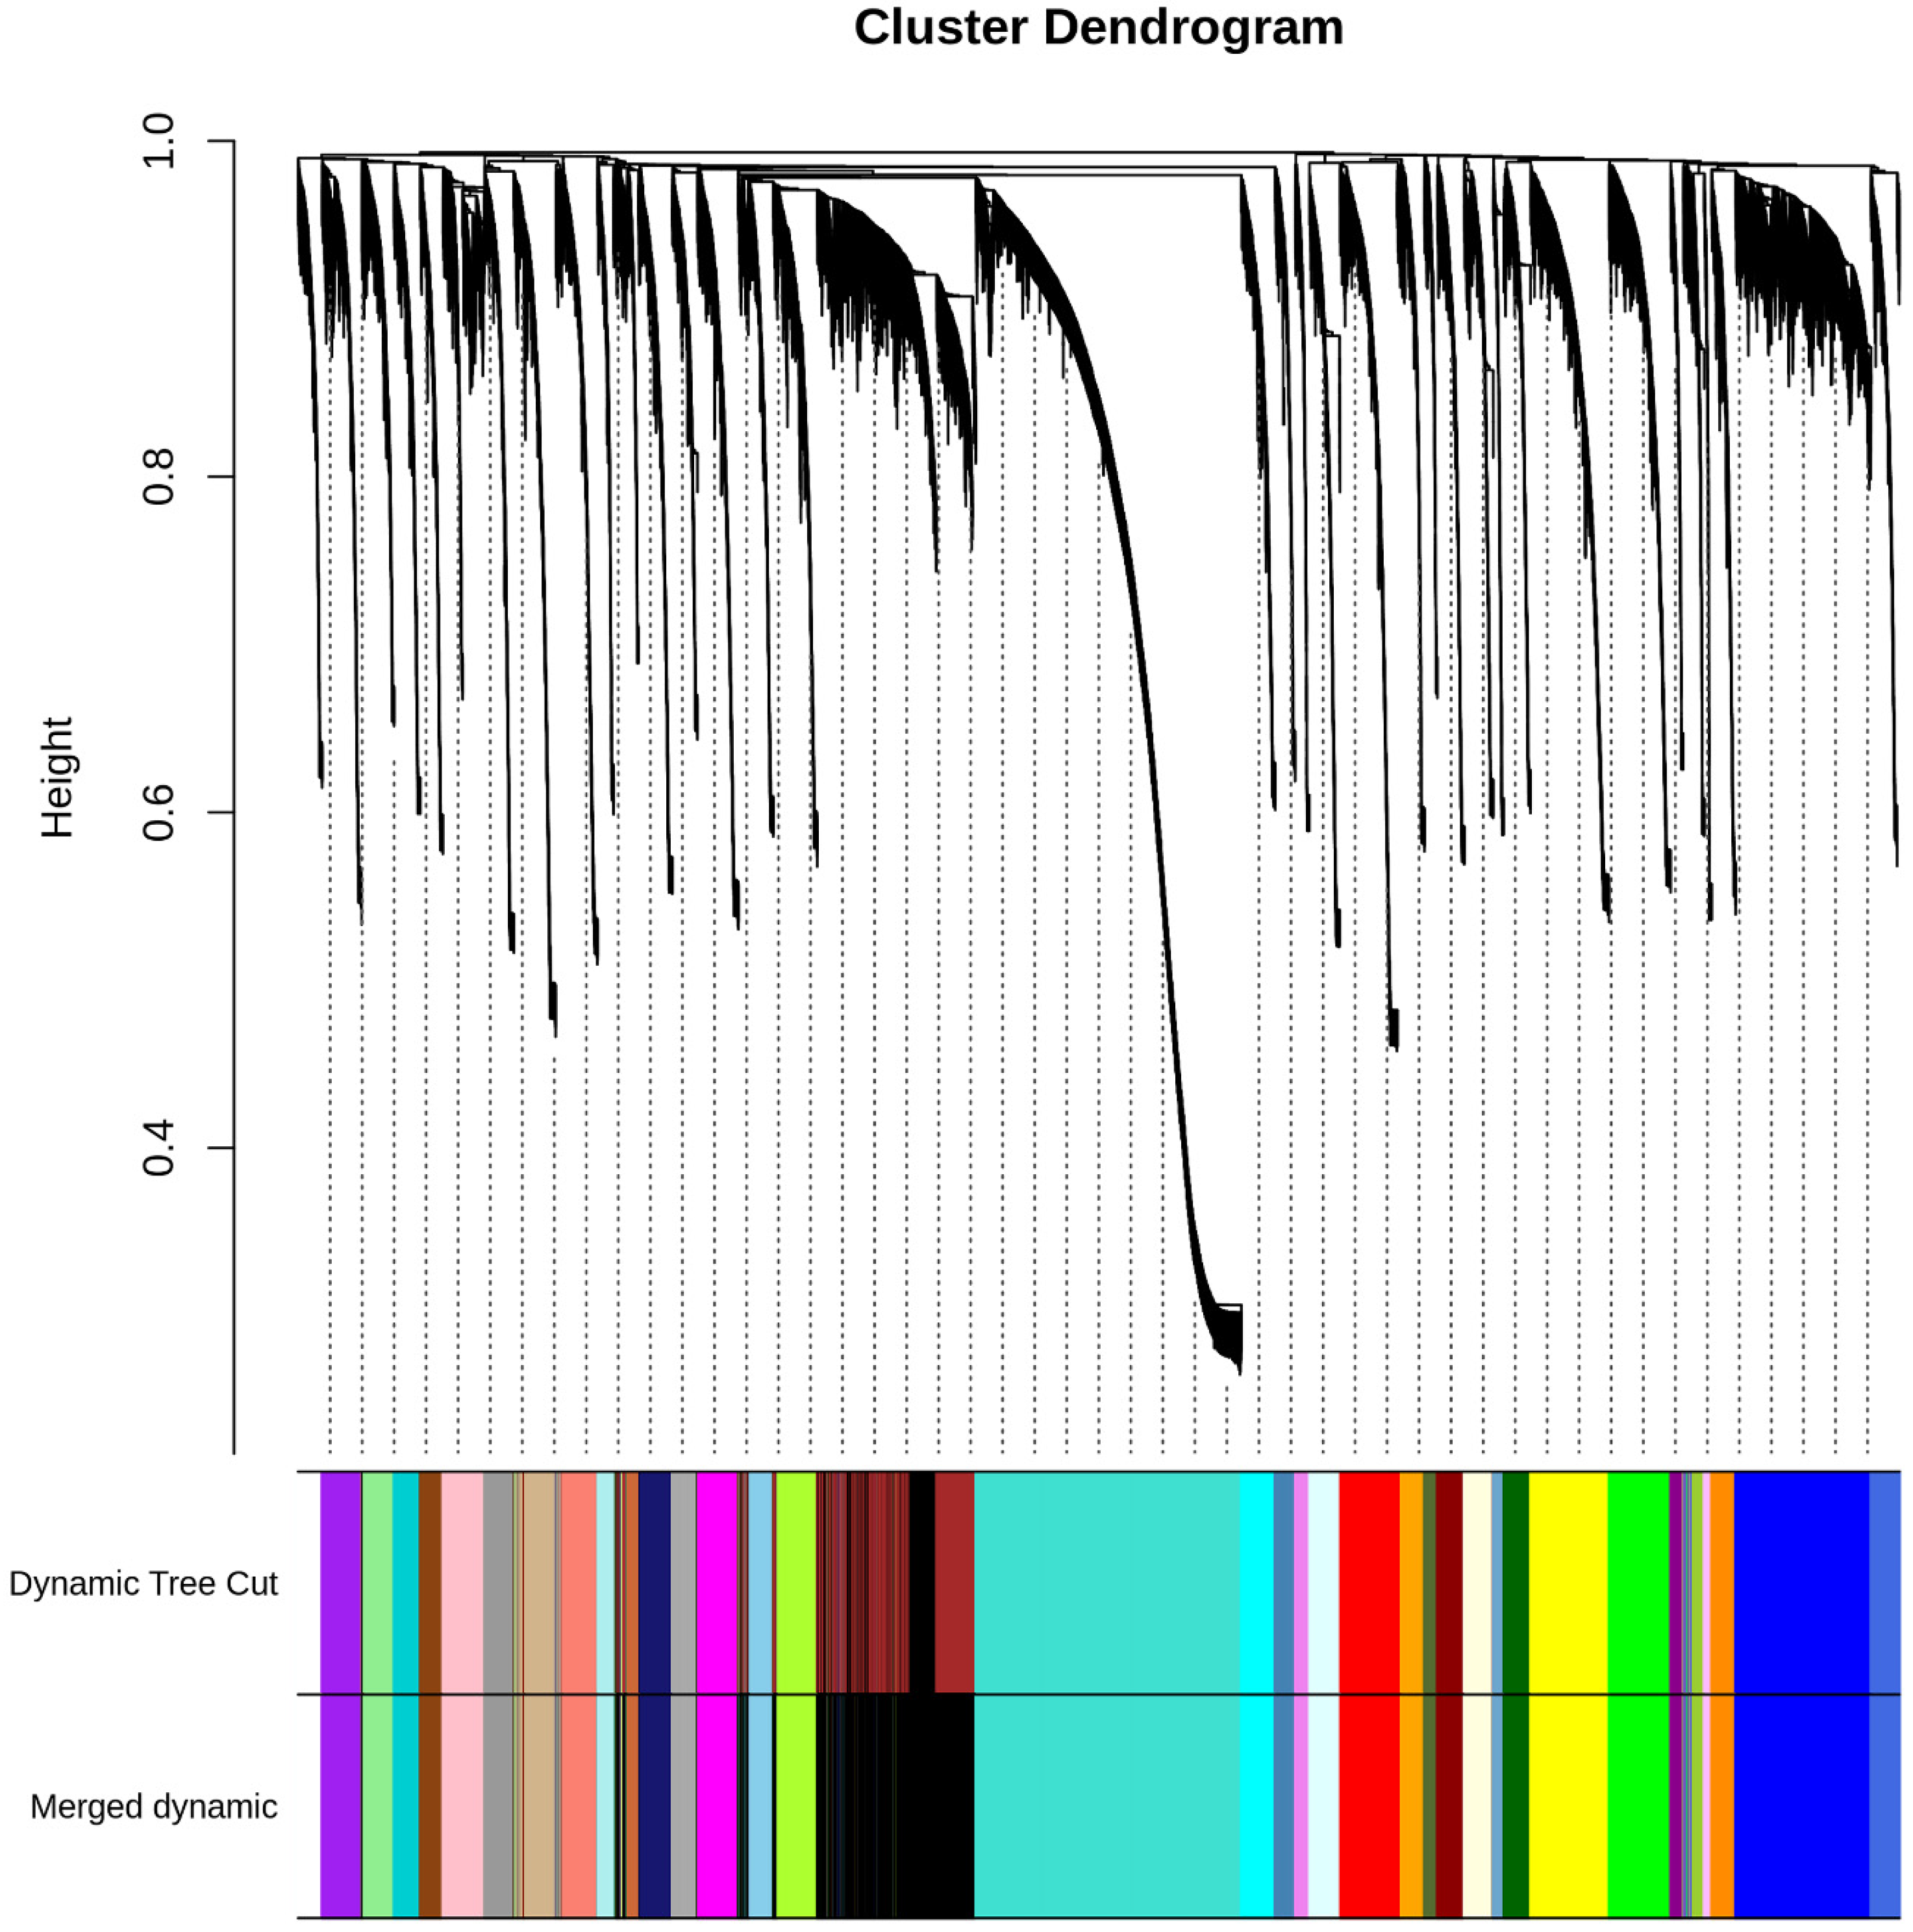
2.4. Weighted Gene Co-Expression Network Analysis
3. Discussion
3.1. Long-Term RPM-Exposed BCCs Exhibit Alterations in Growth, Cytoskeleton and Extracellular Matrix
3.2. Simulated Microgravity Influences the Expression of Focal Adhesion Factors, Growth Factors and Signal Transduction
3.3. Mammalian Phenotype Database and Human GWAS Catalog
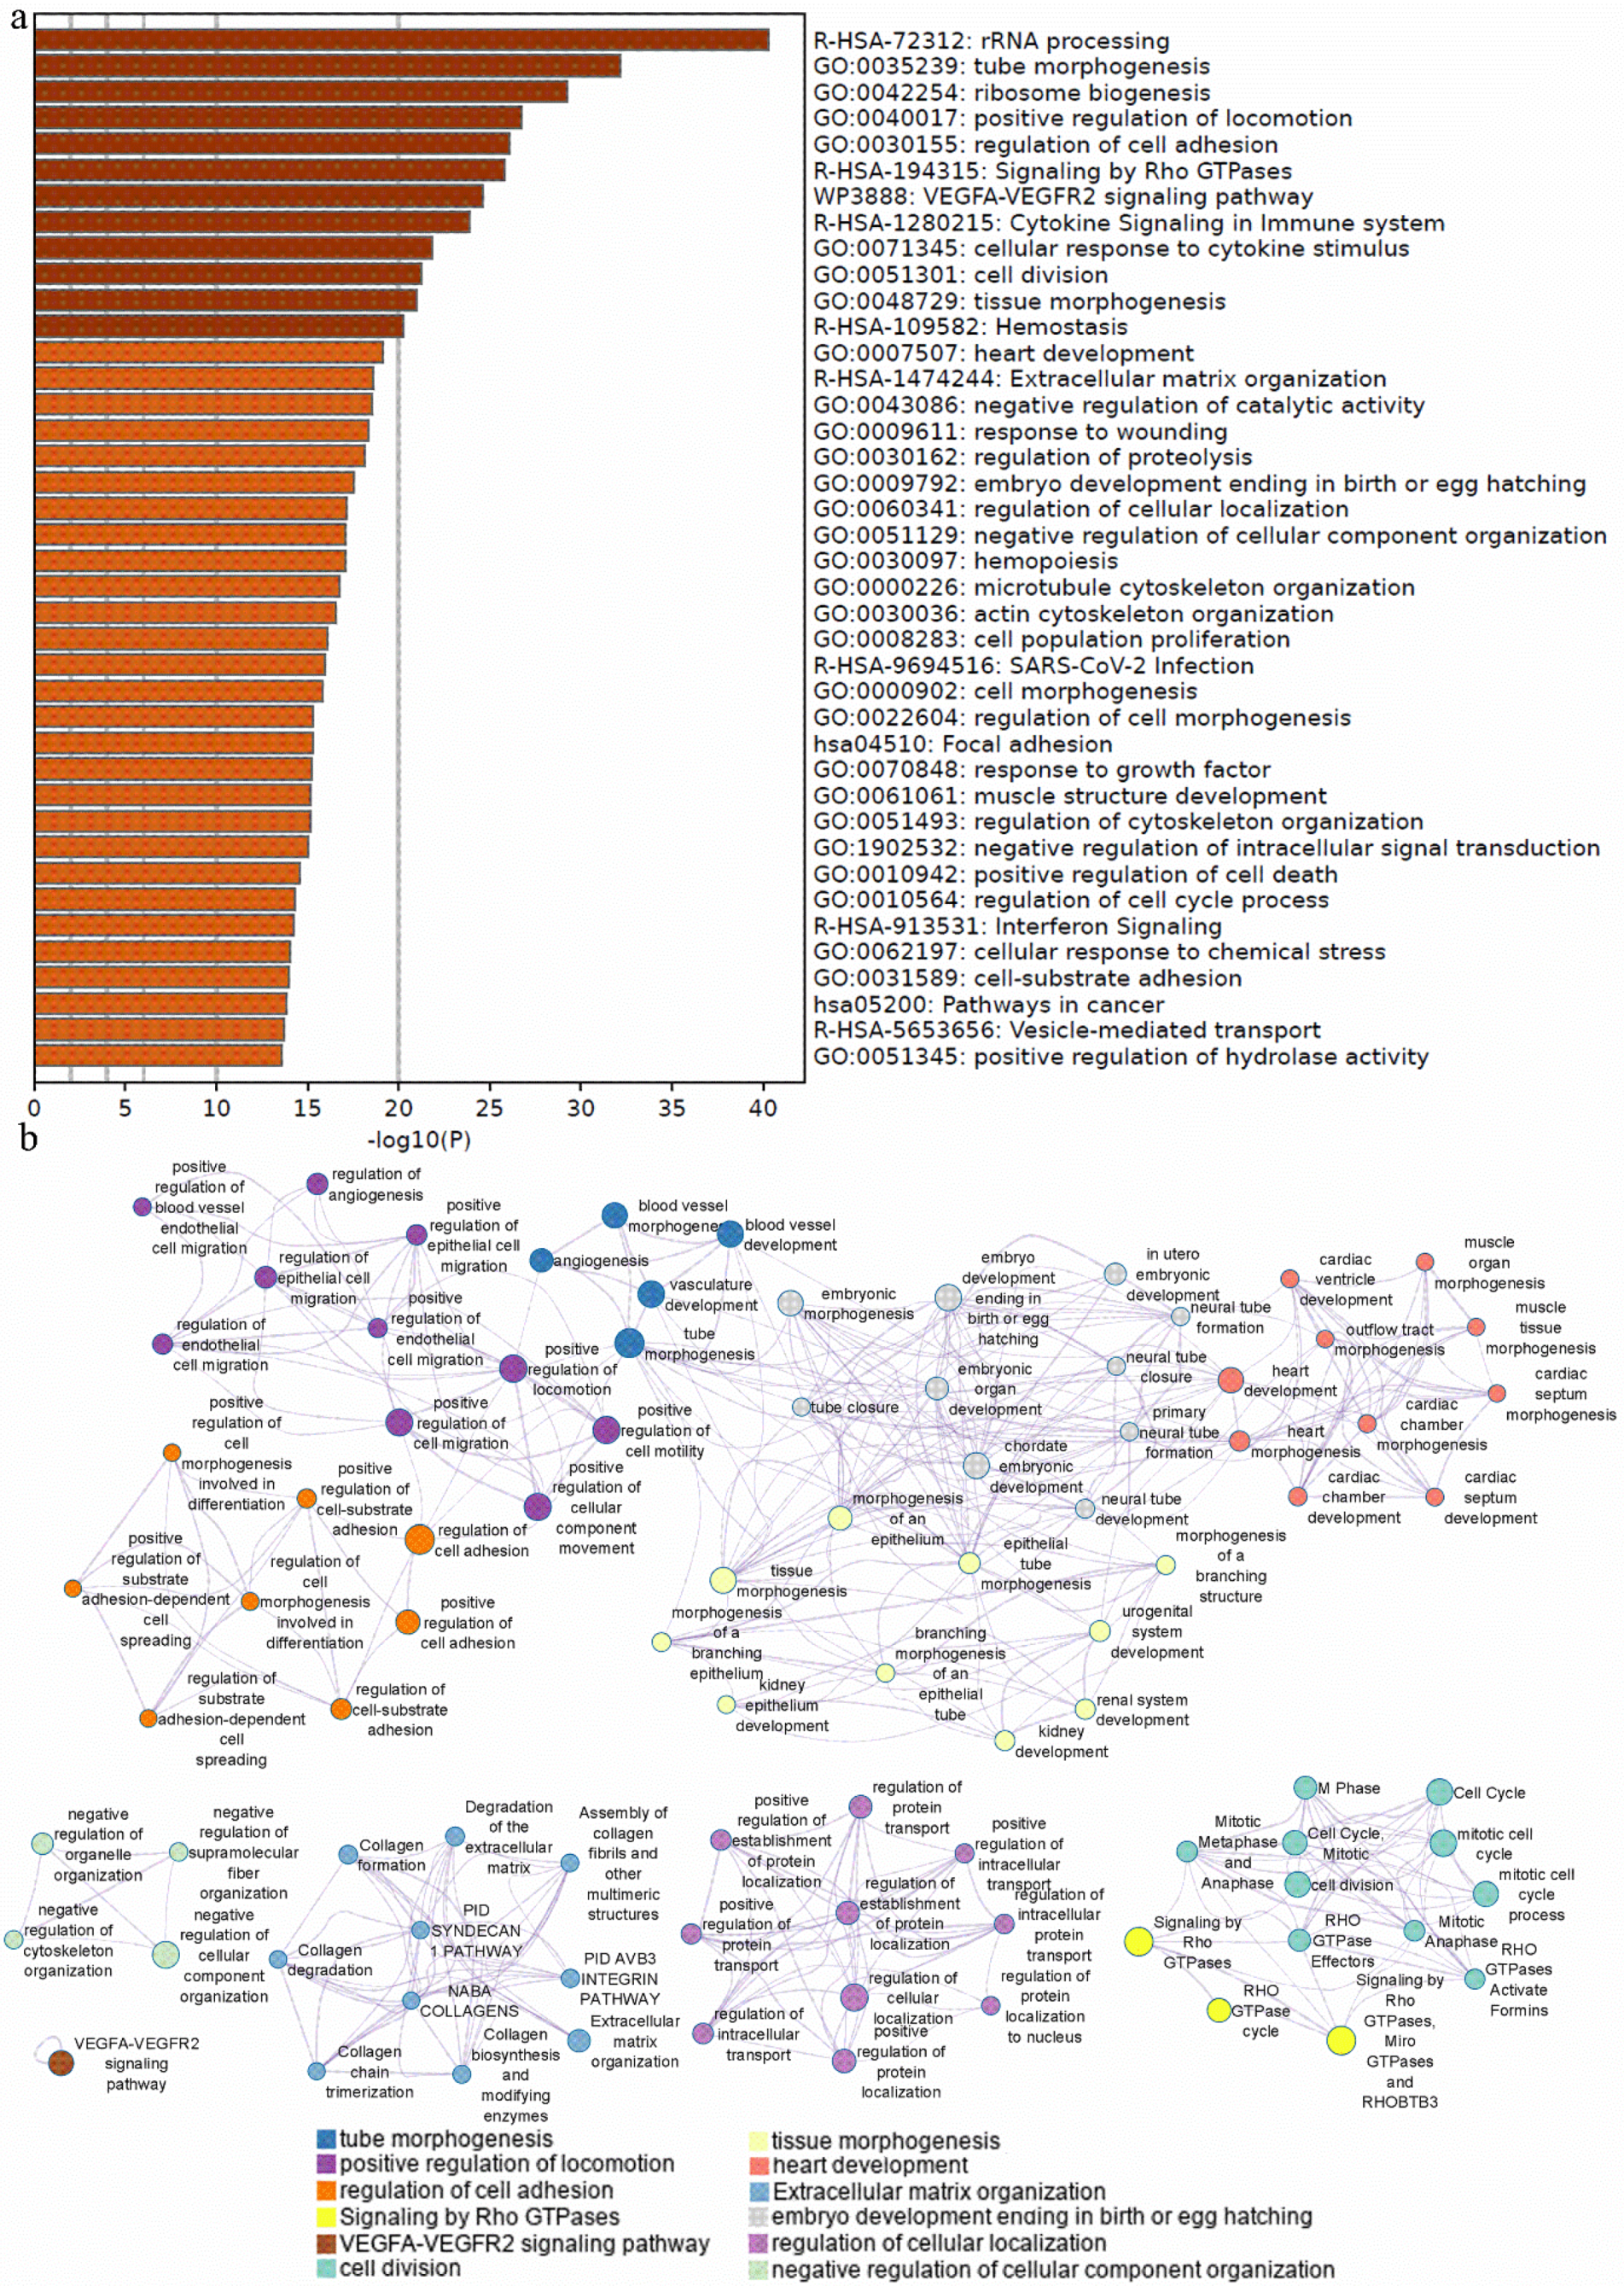
3.4. Interaction Network of Selected Genes Evaluated by STRING Analysis and Cytoscape
3.5. Weighted Gene Co-Expression Network Analysis
4. Materials and Methods
4.1. Cell Culture
4.2. Simulated Microgravity Using the Desktop Random Positioning Machine
4.3. Histochemical Staining
4.4. Microscopy
4.5. RNA Extraction and Quantitative Real-Time Polymerase Chain Reaction (qPCR)
4.6. Sample Collection and Protein Extraction
4.7. Western Blot Analysis
4.8. Weighted Gene Co-Expression Network Analysis: HMS LINCS Database
4.9. Gene Annotation and Gene Enrichment Analysis
4.10. STRING Analyses
4.11. Statistical Analysis
5. Conclusions
Supplementary Materials
Author Contributions
Funding
Institutional Review Board Statement
Informed Consent Statement
Data Availability Statement
Conflicts of Interest
Abbreviations
| µg | Microgravity |
| 2D | Two-dimensional |
| 3D | Three-dimensional |
| ACTB | Beta-actin |
| AD | Adherent monolayer |
| AKT1 | RAC-alpha serine/threonine-protein kinase 1 |
| CD44 | Cell-surface glycoprotein |
| CDKN1 | Cyclin-dependent kinase inhibitor 1A |
| CTNNA1 | Catenin alpha-1 |
| CTNNB1 | Catenin beta-1 |
| COL1A1 | Collagen-1a1 |
| COL4A5 | Collagen-4a5 |
| ECM | Extracellular matrix |
| EGF | Epidermal growth factor |
| EGFR1 | Epidermal growth factor receptor 1 |
| ERK1 | Extracellular signal-regulated kinase 1 |
| EVG | Elastica van Gieson staining |
| FAK1 | Focal adhesion kinase 1 (PTK2) |
| FLK1 | Fetal liver kinase 1 |
| HARV | High aspect rotating-wall vessel |
| HE | Hematoxylin eosin staining |
| ITGB1 | Integrin-beta-1 |
| KDR | Kinase insert domain receptor |
| LAMA3 | Laminin subunit alpha 3 |
| MCS | Multicellular spheroid(s) |
| MAP2K1 | Mitogen-activated protein kinase kinase 1 |
| MAPK14 | Mitogen-activated protein kinase 14 |
| MTOR | Mechanistic target of rapamycin kinase |
| PAS | Periodic acid–Schiff staining |
| PCNA | Proliferating cell nuclear antigen |
| PFA | Paraformaldehyde |
| PIK3CB | Phosphatidylinositol-4,5-bisphosphate 3-kinase catalytic subunit beta |
| r-µg | Real microgravity |
| RAF1 | RAF proto-oncogene serine/threonine-protein kinase |
| RICTOR | Rapamycin-insensitive companion of mammalian target of rapamycin |
| RPM | Random positioning machine |
| RWV | Rotating wall vessel |
| SR | Sirius red staining |
| SRC1 | Steroid receptor coactivator-1 |
| s-µg | Simulated microgravity |
| TUBB | Tubulin beta |
| VCL | Vinculin |
| VEGFA | Vascular endothelial growth factor A |
References
- Sung, H.; Ferlay, J.; Siegel, R.L.; Laversanne, M.; Soerjomataram, I.; Jemal, A.; Bray, F. Global Cancer Statistics 2020: GLOBOCAN Estimates of Incidence and Mortality Worldwide for 36 Cancers in 185 Countries. CA A Cancer J. Clin. 2021, 71, 209–249. [Google Scholar] [CrossRef] [PubMed]
- Leo, C.P.; Leo, C.; Szucs, T.D. Publisher Correction: Breast cancer drug approvals by the US FDA from 1949 to 2018. Nat. Rev. Drug Discov. 2020, 19, 291. [Google Scholar] [CrossRef] [Green Version]
- Becker, J.L.; Souza, G.R. Using space-based investigations to inform cancer research on Earth. Nat. Rev. Cancer 2013, 13, 315–327. [Google Scholar] [CrossRef]
- Cortes-Sanchez, J.L.; Callant, J.; Kruger, M.; Sahana, J.; Kraus, A.; Baselet, B.; Infanger, M.; Baatout, S.; Grimm, D. Cancer Studies under Space Conditions: Finding Answers Abroad. Biomedicines 2021, 10, 25. [Google Scholar] [CrossRef]
- Grimm, D.; Schulz, H.; Kruger, M.; Cortes-Sanchez, J.L.; Egli, M.; Kraus, A.; Sahana, J.; Corydon, T.J.; Hemmersbach, R.; Wise, P.M.; et al. The Fight against Cancer by Microgravity: The Multicellular Spheroid as a Metastasis Model. Int. J. Mol. Sci. 2022, 23, 3073. [Google Scholar] [CrossRef]
- White, R.J.; Averner, M. Humans in space. Nature 2001, 409, 1115–1118. [Google Scholar] [CrossRef]
- Schüler, O.; Hemmersbach, R.; Böhmer, M. A Bird’s-Eye View of Molecular Changes in Plant Gravitropism Using Omics Techniques. Front. Plant Sci. 2015, 6, 1176. [Google Scholar] [CrossRef] [Green Version]
- Hemmersbach, R.; Simon, A.; Waßer, K.; Hauslage, J.; Christianen, P.C.; Albers, P.W.; Lebert, M.; Richter, P.; Alt, W.; Anken, R. Impact of a high magnetic field on the orientation of gravitactic unicellular organisms--a critical consideration about the application of magnetic fields to mimic functional weightlessness. Astrobiology 2014, 14, 205–215. [Google Scholar] [CrossRef] [Green Version]
- Holley, J.M.; Stanbouly, S.; Pecaut, M.J.; Willey, J.S.; Delp, M.; Mao, X.W. Characterization of gene expression profiles in the mouse brain after 35 days of spaceflight mission. NPJ Microgravity 2022, 8, 35. [Google Scholar] [CrossRef]
- Grimm, D.; Wehland, M.; Corydon, T.J.; Richter, P.; Prasad, B.; Bauer, J.; Egli, M.; Kopp, S.; Lebert, M.; Krüger, M. The effects of microgravity on differentiation and cell growth in stem cells and cancer stem cells. Stem Cells Transl. Med. 2020, 9, 882–894. [Google Scholar] [CrossRef]
- Ingram, M.; Techy, G.B.; Saroufeem, R.; Yazan, O.; Narayan, K.S.; Goodwin, T.J.; Spaulding, G.F. Three-dimensional growth patterns of various human tumor cell lines in simulated microgravity of a NASA bioreactor. Vitr. Cell. Dev. Biol.-Anim. 1997, 33, 459–466. [Google Scholar] [CrossRef] [PubMed]
- Masiello, M.G.; Cucina, A.; Proietti, S.; Palombo, A.; Coluccia, P.; D’Anselmi, F.; Dinicola, S.; Pasqualato, A.; Morini, V.; Bizzarri, M. Phenotypic switch induced by simulated microgravity on MDA-MB-231 breast cancer cells. BioMed Res. Int. 2014, 2014, 652434. [Google Scholar] [CrossRef] [PubMed] [Green Version]
- Kopp, S.; Slumstrup, L.; Corydon, T.J.; Sahana, J.; Aleshcheva, G.; Islam, T.; Magnusson, N.E.; Wehland, M.; Bauer, J.; Infanger, M.; et al. Identifications of novel mechanisms in breast cancer cells involving duct-like multicellular spheroid formation after exposure to the Random Positioning Machine. Sci. Rep. 2016, 6, 26887. [Google Scholar] [CrossRef] [PubMed]
- Sahana, J.; Corydon, T.J.; Wehland, M.; Kruger, M.; Kopp, S.; Melnik, D.; Kahlert, S.; Relja, B.; Infanger, M.; Grimm, D. Alterations of Growth and Focal Adhesion Molecules in Human Breast Cancer Cells Exposed to the Random Positioning Machine. Front. Cell Dev. Biol. 2021, 9, 672098. [Google Scholar] [CrossRef] [PubMed]
- Vassy, J.; Portet, S.; Beil, M.; Millot, G.; Fauvel-Lafeve, F.; Karniguian, A.; Gasset, G.; Irinopoulou, T.; Calvo, F.; Rigaut, J.P.; et al. The effect of weightlessness on cytoskeleton architecture and proliferation of human breast cancer cell line MCF-7. FASEB J. 2001, 15, 1104–1106. [Google Scholar] [CrossRef] [Green Version]
- Vassy, J.; Portet, S.; Beil, M.; Millot, G.; Fauvel-Lafeve, F.; Gasset, G.; Schoevaert, D. Weightlessness acts on human breast cancer cell line MCF-7. Adv. Space Res. 2003, 32, 1595–1603. [Google Scholar] [CrossRef]
- Kopp, S.; Sahana, J.; Islam, T.; Petersen, A.G.; Bauer, J.; Corydon, T.J.; Schulz, H.; Saar, K.; Huebner, N.; Slumstrup, L.; et al. The role of NFκB in spheroid formation of human breast cancer cells cultured on the Random Positioning Machine. Sci. Rep. 2018, 8, 921. [Google Scholar] [CrossRef] [Green Version]
- Monti, N.; Masiello, M.G.; Proietti, S.; Catizone, A.; Ricci, G.; Harrath, A.H.; Alwasel, S.H.; Cucina, A.; Bizzarri, M. Survival Pathways Are Differently Affected by Microgravity in Normal and Cancerous Breast Cells. Int. J. Mol. Sci. 2021, 22, 862. [Google Scholar] [CrossRef]
- Qian, A.R.; Zhang, W.; Xie, L.; Weng, Y.Y.; Yang, P.F.; Wang, Z.; Hu, L.F.; Xu, H.Y.; Tian, Z.C.; Shang, P. Simulated weightlessness alters biological characteristics of human breast cancer cell line MCF-7. Acta Astronaut. 2008, 63, 947–958. [Google Scholar] [CrossRef]
- Grimm, D.; Wehland, M.; Pietsch, J.; Aleshcheva, G.; Wise, P.; van Loon, J.; Ulbrich, C.; Magnusson, N.E.; Infanger, M.; Bauer, J. Growing tissues in real and simulated microgravity: New methods for tissue engineering. Tissue Eng. Part B Rev. 2014, 20, 555–566. [Google Scholar] [CrossRef]
- Dietz, C.; Infanger, M.; Romswinkel, A.; Strube, F.; Kraus, A. Apoptosis Induction and Alteration of Cell Adherence in Human Lung Cancer Cells under Simulated Microgravity. Int. J. Mol. Sci. 2019, 20, 3601. [Google Scholar] [CrossRef] [PubMed] [Green Version]
- Hybel, T.E.; Dietrichs, D.; Sahana, J.; Corydon, T.J.; Nassef, M.Z.; Wehland, M.; Kruger, M.; Magnusson, N.E.; Bauer, J.; Utpatel, K.; et al. Simulated Microgravity Influences VEGF, MAPK, and PAM Signaling in Prostate Cancer Cells. Int. J. Mol. Sci. 2020, 21, 1263. [Google Scholar] [CrossRef] [Green Version]
- Dietrichs, D.; Grimm, D.; Sahana, J.; Melnik, D.; Corydon, T.J.; Wehland, M.; Kruger, M.; Vermeesen, R.; Baselet, B.; Baatout, S.; et al. Three-Dimensional Growth of Prostate Cancer Cells Exposed to Simulated Microgravity. Front. Cell Dev. Biol. 2022, 10, 841017. [Google Scholar] [CrossRef] [PubMed]
- Langfelder, P.; Horvath, S. WGCNA: An R package for weighted correlation network analysis. BMC Bioinform. 2008, 9, 559. [Google Scholar] [CrossRef] [Green Version]
- MacArthur, J.; Bowler, E.; Cerezo, M.; Gil, L.; Hall, P.; Hastings, E.; Junkins, H.; McMahon, A.; Milano, A.; Morales, J.; et al. The new NHGRI-EBI Catalog of published genome-wide association studies (GWAS Catalog). Nucleic Acids Res. 2017, 45, D896–D901. [Google Scholar] [CrossRef]
- Cheng, T.H.; Thompson, D.J.; O’Mara, T.A.; Painter, J.N.; Glubb, D.M.; Flach, S.; Lewis, A.; French, J.D.; Freeman-Mills, L.; Church, D.; et al. Five endometrial cancer risk loci identified through genome-wide association analysis. Nat. Genet. 2016, 48, 667–674. [Google Scholar] [CrossRef]
- Quinn, M.C.J.; McCue, K.; Shi, W.; Johnatty, S.E.; Beesley, J.; Civitarese, A.; O’Mara, T.A.; Glubb, D.M.; Tyrer, J.P.; Armasu, S.M.; et al. Identification of a Locus Near ULK1 Associated With Progression-Free Survival in Ovarian Cancer. Cancer Epidemiol. Biomark. Prev. 2021, 30, 1669–1680. [Google Scholar] [CrossRef] [PubMed]
- Study, C.; Houlston, R.S.; Webb, E.; Broderick, P.; Pittman, A.M.; Di Bernardo, M.C.; Lubbe, S.; Chandler, I.; Vijayakrishnan, J.; Sullivan, K.; et al. Meta-analysis of genome-wide association data identifies four new susceptibility loci for colorectal cancer. Nat. Genet. 2008, 40, 1426–1435. [Google Scholar] [CrossRef] [PubMed]
- Schmit, S.L.; Edlund, C.K.; Schumacher, F.R.; Gong, J.; Harrison, T.A.; Huyghe, J.R.; Qu, C.; Melas, M.; Van Den Berg, D.J.; Wang, H.; et al. Novel Common Genetic Susceptibility Loci for Colorectal Cancer. J. Natl. Cancer Inst. 2019, 111, 146–157. [Google Scholar] [CrossRef]
- Murabito, J.M.; Rosenberg, C.L.; Finger, D.; Kreger, B.E.; Levy, D.; Splansky, G.L.; Antman, K.; Hwang, S.J. A genome-wide association study of breast and prostate cancer in the NHLBI’s Framingham Heart Study. BMC Med. Genet 2007, 8 (Suppl. S1), S6. [Google Scholar] [CrossRef]
- Brandes, N.; Linial, N.; Linial, M. Genetic association studies of alterations in protein function expose recessive effects on cancer predisposition. Sci. Rep. 2021, 11, 14901. [Google Scholar] [CrossRef] [PubMed]
- Michailidou, K.; Lindstrom, S.; Dennis, J.; Beesley, J.; Hui, S.; Kar, S.; Lemacon, A.; Soucy, P.; Glubb, D.; Rostamianfar, A.; et al. Association analysis identifies 65 new breast cancer risk loci. Nature 2017, 551, 92–94. [Google Scholar] [CrossRef] [PubMed] [Green Version]
- Phelan, C.M.; Kuchenbaecker, K.B.; Tyrer, J.P.; Kar, S.P.; Lawrenson, K.; Winham, S.J.; Dennis, J.; Pirie, A.; Riggan, M.J.; Chornokur, G.; et al. Identification of 12 new susceptibility loci for different histotypes of epithelial ovarian cancer. Nat. Genet. 2017, 49, 680–691. [Google Scholar] [CrossRef] [Green Version]
- Masuda, T.; Low, S.K.; Akiyama, M.; Hirata, M.; Ueda, Y.; Matsuda, K.; Kimura, T.; Murakami, Y.; Kubo, M.; Kamatani, Y.; et al. GWAS of five gynecologic diseases and cross-trait analysis in Japanese. Eur. J. Hum. Genet. 2020, 28, 95–107. [Google Scholar] [CrossRef] [PubMed] [Green Version]
- Pinero, J.; Bravo, A.; Queralt-Rosinach, N.; Gutierrez-Sacristan, A.; Deu-Pons, J.; Centeno, E.; Garcia-Garcia, J.; Sanz, F.; Furlong, L.I. DisGeNET: A comprehensive platform integrating information on human disease-associated genes and variants. Nucleic Acids Res. 2017, 45, D833–D839. [Google Scholar] [CrossRef]
- Hauslage, J.; Cevik, V.; Hemmersbach, R. Pyrocystis noctiluca represents an excellent bioassay for shear forces induced in ground-based microgravity simulators (clinostat and random positioning machine). NPJ Microgravity 2017, 3, 12. [Google Scholar] [CrossRef] [Green Version]
- Wuest, S.L.; Stern, P.; Casartelli, E.; Egli, M. Fluid Dynamics Appearing during Simulated Microgravity Using Random Positioning Machines. PLoS ONE 2017, 12, e0170826. [Google Scholar] [CrossRef] [Green Version]
- Paddillaya, N.; Ingale, K.; Gaikwad, C.; Saini, D.K.; Pullarkat, P.; Kondaiah, P.; Menon, G.I.; Gundiah, N. Cell adhesion strength and tractions are mechano-diagnostic features of cellular invasiveness. Soft Matter 2022, 18, 4378–4388. [Google Scholar] [CrossRef]
- Pietsch, J.; Gass, S.; Nebuloni, S.; Echegoyen, D.; Riwaldt, S.; Baake, C.; Bauer, J.; Corydon, T.J.; Egli, M.; Infanger, M.; et al. Three-dimensional growth of human endothelial cells in an automated cell culture experiment container during the SpaceX CRS-8 ISS space mission—The SPHEROIDS project. Biomaterials 2017, 124, 126–156. [Google Scholar] [CrossRef]
- Pietsch, J.; Ma, X.; Wehland, M.; Aleshcheva, G.; Schwarzwalder, A.; Segerer, J.; Birlem, M.; Horn, A.; Bauer, J.; Infanger, M.; et al. Spheroid formation of human thyroid cancer cells in an automated culturing system during the Shenzhou-8 Space mission. Biomaterials 2013, 34, 7694–7705. [Google Scholar] [CrossRef]
- Nassef, M.Z.; Kopp, S.; Wehland, M.; Melnik, D.; Sahana, J.; Krüger, M.; Corydon, T.J.; Oltmann, H.; Schmitz, B.; Schütte, A.; et al. Real Microgravity Influences the Cytoskeleton and Focal Adhesions in Human Breast Cancer Cells. Int. J. Mol. Sci. 2019, 20, 3156. [Google Scholar] [CrossRef] [Green Version]
- Ingber, D.E.; Wang, N.; Stamenovic, D. Tensegrity, cellular biophysics, and the mechanics of living systems. Rep. Prog. Phys. 2014, 77, 046603. [Google Scholar] [CrossRef] [Green Version]
- Guo, C.; Liu, S.; Wang, J.; Sun, M.Z.; Greenaway, F.T. ACTB in cancer. Clin. Chim. Acta 2013, 417, 39–44. [Google Scholar] [CrossRef]
- Li, J.; Zhang, S.; Chen, J.; Du, T.; Wang, Y.; Wang, Z. Modeled microgravity causes changes in the cytoskeleton and focal adhesions, and decreases in migration in malignant human MCF-7 cells. Protoplasma 2009, 238, 23–33. [Google Scholar] [CrossRef]
- Kanojia, D.; Morshed, R.A.; Zhang, L.; Miska, J.M.; Qiao, J.; Kim, J.W.; Pytel, P.; Balyasnikova, I.V.; Lesniak, M.S.; Ahmed, A.U. betaIII-Tubulin Regulates Breast Cancer Metastases to the Brain. Mol. Cancer Ther. 2015, 14, 1152–1161. [Google Scholar] [CrossRef] [Green Version]
- Ikeda, K.; Iyama, K.; Ishikawa, N.; Egami, H.; Nakao, M.; Sado, Y.; Ninomiya, Y.; Baba, H. Loss of expression of type IV collagen alpha5 and alpha6 chains in colorectal cancer associated with the hypermethylation of their promoter region. Am. J. Pathol. 2006, 168, 856–865. [Google Scholar] [CrossRef] [Green Version]
- Cabodi, S.; Di Stefano, P.; Leal Mdel, P.; Tinnirello, A.; Bisaro, B.; Morello, V.; Damiano, L.; Aramu, S.; Repetto, D.; Tornillo, G.; et al. Integrins and signal transduction. Adv. Exp. Med. Biol. 2010, 674, 43–54. [Google Scholar] [CrossRef]
- Klahan, S.; Huang, W.C.; Chang, C.M.; Wong, H.S.; Huang, C.C.; Wu, M.S.; Lin, Y.C.; Lu, H.F.; Hou, M.F.; Chang, W.C. Gene expression profiling combined with functional analysis identify integrin beta1 (ITGB1) as a potential prognosis biomarker in triple negative breast cancer. Pharm. Res. 2016, 104, 31–37. [Google Scholar] [CrossRef]
- Chen, Z.H.; Zhang, Y.; Zhao, F.; Yin, C.; Yang, C.F.; Wang, X.; Wu, Z.X.; Liang, S.J.; Li, D.J.; Lin, X.; et al. Recombinant Irisin Prevents the Reduction of Osteoblast Differentiation Induced by Stimulated Microgravity through Increasing beta-Catenin Expression. Int. J. Mol. Sci. 2020, 21, 1259. [Google Scholar] [CrossRef] [Green Version]
- Xu, J.; Prosperi, J.R.; Choudhury, N.; Olopade, O.I.; Goss, K.H. beta-Catenin is required for the tumorigenic behavior of triple-negative breast cancer cells. PLoS ONE 2015, 10, e0117097. [Google Scholar] [CrossRef]
- Price, J.T.; Tiganis, T.; Agarwal, A.; Djakiew, D.; Thompson, E.W. Epidermal growth factor promotes MDA-MB-231 breast cancer cell migration through a phosphatidylinositol 3 ‘-kinase and phospholipase C-dependent mechanism. Cancer Res. 1999, 59, 5475–5478. [Google Scholar]
- Bhat, F.A.; Sharmila, G.; Balakrishnan, S.; Singh, P.R.; Srinivasan, N.; Arunakaran, J. Epidermal growth factor-induced prostate cancer (PC3) cell survival and proliferation is inhibited by quercetin, a plant flavonoid through apoptotic machinery. Biomed. Prev. Nutr. 2014, 4, 459–468. [Google Scholar] [CrossRef]
- Jessup, J.M.; Frantz, M.; Sonmez-Alpan, E.; Locker, J.; Skena, K.; Waller, H.; Battle, P.; Nachman, A.; Weber, M.E.; Thomas, D.A.; et al. Microgravity culture reduces apoptosis and increases the differentiation of a human colorectal carcinoma cell line. Vitr. Cell. Dev. Biol.-Anim. 2000, 36, 367–373. [Google Scholar] [CrossRef]
- Ma, X.; Pietsch, J.; Wehland, M.; Schulz, H.; Saar, K.; Hubner, N.; Bauer, J.; Braun, M.; Schwarzwalder, A.; Segerer, J.; et al. Differential gene expression profile and altered cytokine secretion of thyroid cancer cells in space. FASEB J. 2014, 28, 813–835. [Google Scholar] [CrossRef]
- Chen, Y.; Xue, F.; Russo, A.; Wan, Y. Proteomic Analysis of Extracellular Vesicles Derived from MDA-MB-231 Cells in Microgravity. Protein J. 2021, 40, 108–118. [Google Scholar] [CrossRef]
- Akiyama, H.; Kanai, S.; Hirano, M.; Shimokawa, H.; Katano, H.; Mukai, C.; Nagaoka, S.; Morita, S.; Kumei, Y. Expression of PDGF-beta receptor, EGF receptor, and receptor adaptor protein Shc in rat osteoblasts during spaceflight. Mol. Cell. Biochem. 1999, 202, 63–71. [Google Scholar] [CrossRef]
- Wee, P.; Wang, Z. Epidermal Growth Factor Receptor Cell Proliferation Signaling Pathways. Cancers 2017, 9, 52. [Google Scholar] [CrossRef] [Green Version]
- Kowanetz, M.; Ferrara, N. Vascular endothelial growth factor signaling pathways: Therapeutic perspective. Clin. Cancer Res. 2006, 12, 5018–5022. [Google Scholar] [CrossRef] [Green Version]
- Blake, J.A.; Bult, C.J.; Kadin, J.A.; Richardson, J.E.; Eppig, J.T.; Mouse Genome Database, G. The Mouse Genome Database (MGD): Premier model organism resource for mammalian genomics and genetics. Nucleic Acids Res. 2011, 39, D842–D848. [Google Scholar] [CrossRef] [Green Version]
- Ciardiello, F.; Troiani, T.; Bianco, R.; Orditura, M.; Morgillo, F.; Martinelli, E.; Morelli, M.P.; Cascone, T.; Tortora, G. Interaction between the epidermal growth factor receptor (EGFR) and the vascular endothelial growth factor (VEGF) pathways: A rational approach for multi-target anticancer therapy. Ann. Oncol. 2006, 17 (Suppl. S7), vii109–vii114. [Google Scholar] [CrossRef]
- Ancker, O.V.; Kruger, M.; Wehland, M.; Infanger, M.; Grimm, D. Multikinase Inhibitor Treatment in Thyroid Cancer. Int. J. Mol. Sci. 2019, 21, 10. [Google Scholar] [CrossRef]
- Li, A.; Zhou, T.; Guo, L.; Si, J. Collagen type I regulates beta-catenin tyrosine phosphorylation and nuclear translocation to promote migration and proliferation of gastric carcinoma cells. Oncol. Rep. 2010, 23, 1247–1255. [Google Scholar] [CrossRef] [Green Version]
- Lu, Z.; Ghosh, S.; Wang, Z.; Hunter, T. Downregulation of caveolin-1 function by EGF leads to the loss of E-cadherin, increased transcriptional activity of beta-catenin, and enhanced tumor cell invasion. Cancer Cell 2003, 4, 499–515. [Google Scholar] [CrossRef] [Green Version]
- Melnik, D.; Sahana, J.; Corydon, T.J.; Kopp, S.; Nassef, M.Z.; Wehland, M.; Infanger, M.; Grimm, D.; Kruger, M. Dexamethasone Inhibits Spheroid Formation of Thyroid Cancer Cells Exposed to Simulated Microgravity. Cells 2020, 9, 367. [Google Scholar] [CrossRef] [Green Version]
- Fang, D.; Hawke, D.; Zheng, Y.; Xia, Y.; Meisenhelder, J.; Nika, H.; Mills, G.B.; Kobayashi, R.; Hunter, T.; Lu, Z. Phosphorylation of beta-catenin by AKT promotes beta-catenin transcriptional activity. J. Biol. Chem. 2007, 282, 11221–11229. [Google Scholar] [CrossRef] [Green Version]
- Ju, X.; Katiyar, S.; Wang, C.; Liu, M.; Jiao, X.; Li, S.; Zhou, J.; Turner, J.; Lisanti, M.P.; Russell, R.G.; et al. Akt1 governs breast cancer progression in vivo. Proc. Natl. Acad. Sci. USA 2007, 104, 7438–7443. [Google Scholar] [CrossRef] [Green Version]
- Singh, R.; Rajput, M.; Singh, R.P. Simulated microgravity triggers DNA damage and mitochondria-mediated apoptosis through ROS generation in human promyelocytic leukemic cells. Mitochondrion 2021, 61, 114–124. [Google Scholar] [CrossRef]
- Katsumi, A.; Orr, A.W.; Tzima, E.; Schwartz, M.A. Integrins in mechanotransduction. J. Biol. Chem. 2004, 279, 12001–12004. [Google Scholar] [CrossRef] [Green Version]
- Zhivodernikov, I.; Ratushnyy, A.; Buravkova, L. Simulated Microgravity Remodels Extracellular Matrix of Osteocommitted Mesenchymal Stromal Cells. Int. J. Mol. Sci. 2021, 22, 5428. [Google Scholar] [CrossRef]
- Wehland, M.; Steinwerth, P.; Aleshcheva, G.; Sahana, J.; Hemmersbach, R.; Lutzenberg, R.; Kopp, S.; Infanger, M.; Grimm, D. Tissue Engineering of Cartilage Using a Random Positioning Machine. Int. J. Mol. Sci. 2020, 21, 9596. [Google Scholar] [CrossRef]
- Chan, K.T.; Cortesio, C.L.; Huttenlocher, A. FAK alters invadopodia and focal adhesion composition and dynamics to regulate breast cancer invasion. J. Cell Biol. 2009, 185, 357–370. [Google Scholar] [CrossRef]
- Grossi, V.; Peserico, A.; Tezil, T.; Simone, C. p38alpha MAPK pathway: A key factor in colorectal cancer therapy and chemoresistance. World J. Gastroenterol. 2014, 20, 9744–9758. [Google Scholar] [CrossRef]
- Zhang, C.; Li, L.; Jiang, Y.; Wang, C.; Geng, B.; Wang, Y.; Chen, J.; Liu, F.; Qiu, P.; Zhai, G.; et al. Space microgravity drives transdifferentiation of human bone marrow-derived mesenchymal stem cells from osteogenesis to adipogenesis. FASEB J. 2018, 32, 4444–4458. [Google Scholar] [CrossRef] [Green Version]
- Yu, B.; Yu, D.; Cao, L.; Zhao, X.; Long, T.; Liu, G.; Tang, T.; Zhu, Z. Simulated microgravity using a rotary cell culture system promotes chondrogenesis of human adipose-derived mesenchymal stem cells via the p38 MAPK pathway. Biochem. Biophys. Res. Commun. 2011, 414, 412–418. [Google Scholar] [CrossRef]
- Borst, A.G.; van Loon, J.J.W.A. Technology and Developments for the Random Positioning Machine, RPM. Microgravity Sci. Technol. 2009, 21, 287–292. [Google Scholar] [CrossRef]
- Grimm, D.; Infanger, M.; Westphal, K.; Ulbrich, C.; Pietsch, J.; Kossmehl, P.; Vadrucci, S.; Baatout, S.; Flick, B.; Paul, M.; et al. A delayed type of three-dimensional growth of human endothelial cells under simulated weightlessness. Tissue Eng. Part A 2009, 15, 2267–2275. [Google Scholar] [CrossRef]
- Riecke, K.; Grimm, D.; Shakibaei, M.; Kossmehl, P.; Schulze-Tanzil, G.; Paul, M.; Stahlmann, R. Low doses of 2,3,7,8-tetrachlorodibenzo- p-dioxin increase transforming growth factor beta and cause myocardial fibrosis in marmosets (Callithrix jacchus). Arch. Toxicol. 2002, 76, 360–366. [Google Scholar] [CrossRef]
- Rothermund, L.; Kreutz, R.; Kossmehl, P.; Fredersdorf, S.; Shakibaei, M.; Schulze-Tanzil, G.; Paul, M.; Grimm, D. Early onset of chondroitin sulfate and osteopontin expression in angiotensin II-dependent left ventricular hypertrophy. Am. J. Hypertens. 2002, 15, 644–652. [Google Scholar] [CrossRef] [Green Version]
- Ma, X.; Wehland, M.; Schulz, H.; Saar, K.; Hubner, N.; Infanger, M.; Bauer, J.; Grimm, D. Genomic approach to identify factors that drive the formation of three-dimensional structures by EA.hy926 endothelial cells. PLoS ONE 2013, 8, e64402. [Google Scholar] [CrossRef] [Green Version]
- Zhou, Y.; Zhou, B.; Pache, L.; Chang, M.; Khodabakhshi, A.H.; Tanaseichuk, O.; Benner, C.; Chanda, S.K. Metascape provides a biologist-oriented resource for the analysis of systems-level datasets. Nat. Commun. 2019, 10, 1523. [Google Scholar] [CrossRef]
- Snel, B.; Lehmann, G.; Bork, P.; Huynen, M.A. STRING: A web-server to retrieve and display the repeatedly occurring neighbourhood of a gene. Nucleic Acids Res. 2000, 28, 3442–3444. [Google Scholar] [CrossRef] [PubMed]


| Gene | Primer Name | Sequence |
|---|---|---|
| 18S rRNA | 18S-F | GGAGCCTGCGGCTTAATTT |
| 18S-R | CAACTAAGAACGGCCATGCA | |
| ACTB | ACTB-F | TGCCGACAGGATGCAGAAG |
| ACTB-R | GCCGATCCACACGGAGTACT | |
| AKT1 | AKT1-F | CTTCTATGGCGCTGAGATTGTG |
| AKT1-R | CAGCATGAGGTTCTCCAGCTT | |
| CD44 | CD44-F | ACCCTCCCCTCATTCACCAT |
| CD44-R | GTTGTACTACTAGGAGTTGCCTGGATT | |
| CDKN1 | CDKN1-F | GACCTGCAACCGACGATTCT |
| CDKN1-R | GGGCGTCTGCTCCACAGA | |
| COL1A1 | COL1A1-F | CGATGGATTCCCGTTCGAGT |
| COL1A1-R | GAGGCCTCGGTGGACATTAG | |
| COL4A5 | COL4A5-F | GGTACCTGTAACTACTATGCCAACTCCTA |
| COL4A5-R | CGGCTAATTCGTGTCCTCAAG | |
| CTNNA1 | CTNNA1-F | AATTTAGCGCTCGCCCAG |
| CTNNA1-R | ACAAGGGTTGTAACCTGTGTAA | |
| CTNNB1 | CTNNB1-F | GAAACAGCTCGTTGTACCGC |
| CTNNB1-R | ATCCACTGGTGAACCAAGCA | |
| EGFR | EGFR-F | TTGCCGCAAAGTGTGTAACG |
| EGFR-R | GAGATCGCCACTGATGGAGG | |
| ERK1 | ERK1-F | ACCTGCGACCTTAAGATTTGTGA |
| ERK1-R | AGCCACATACTCCGTCAGGAA | |
| FAK1 | FAK1-F | TGTGGGTAAACCAGATCCTGC |
| FAK1-R | CTGAAGCTTGACACCCTCGT | |
| FLK1 | FLK1-F | TCTTCTGGCTACTTCTTGTCATCATC |
| FLK1-R | GATGGACAAGTAGCCTGTCTTCAGT | |
| ITGB1 | ITGB1-F | GAAAACAGCGCATATCTGGAAATT |
| ITGB1-R | CAGCCAATCAGTGATCCACAA | |
| LAMA3 | LAMA3-F | AAAGCAAGAAGTCAGTCCAGC |
| LAMA3-R | TCCCATGAAGACCATCTCGG | |
| MAP2K1 | MAP2K1-F | CGTTACCCGGGTCCAAAATG |
| MAP2K1-R | TCCAAGTTGGTCTCCGCA | |
| MAPK14 | MAPK14-F | TGTTTCCTGGTACAGACCATATT |
| MAPK14-R | CATGGCTTGGCATCCTGTT | |
| MTOR | MTOR-F | ATCTTGGCCATAGCTAGCCTC |
| MTOR-R | ACAACTGGGTCATTGGAGGG | |
| PXN | PXN-F | CATGGACGACCTCGACGC |
| PXN-R | CAAGAACACAGGCCGTTTGG | |
| RAF1 | RAF1-F | GGGAGCTTGGAAGACGATCAG |
| RAF1-R | ACACGGATAGTGTTGCTTGTC | |
| RICTOR | RICTOR-F | GGAAGCCTGTTGATGGTGAT |
| RICTOR-R | GGCAGCCTGTTTTATGGTGT | |
| SRC1 | SRC1-F | CCACCTTTGTGGCCCTCTAT |
| SRC1-R | CCTCTGTGTTGTTGACAATCTGG | |
| TUBB | TUBB-F | CTGGACCGCATCTCTGTGTACTAC |
| TUBB-R | GACCTGAGCGAACAGAGTCCAT | |
| VCL | VCL-F | GTCTCGGCTGCTCGTATCTT |
| VCL-R | GTCCACCAGCCCTGTCATTT | |
| VEGF | VEGF-F | CTACCTCCACCATGCCAAGTG |
| VEGF-R | GCGCTGATAGACATCCATGAAC |
| Antibody | Catalog nr. and Company | Dilution Primary Antibody | Host Species | Secondary Antibody | Dilution Secondary Antibody |
|---|---|---|---|---|---|
| AKT 1 | Ab 89402, Abcam | 1:1000 | Mouse | #7076S, Cell signalling | 1:4000 |
| P-Akt1 | # 92715, Cell signalling | 1:1000 | Rabbit | #7074S, Cell signalling | 1: 4000 |
| MAPKp38 | MA5 15116, Thermo Fisher | 1:1000 | Mouse | #7076S, Cell signalling | 1: 4000 |
| P-MAPKp38 | 446845G, Invitrogen | 1:1000 | Rabbit | #7074S, Cell signalling | 1: 4000 |
| ERK1/2 | #9102, Cell signalling | 1:1000 | Mouse | #7076S, Cell signalling | 1: 5000 |
| P-ERK1/2 | #9101, Cell signalling | 1:1000 | Rabbit | #7074S, Cell signalling | 1: 5000 |
Disclaimer/Publisher’s Note: The statements, opinions and data contained in all publications are solely those of the individual author(s) and contributor(s) and not of MDPI and/or the editor(s). MDPI and/or the editor(s) disclaim responsibility for any injury to people or property resulting from any ideas, methods, instructions or products referred to in the content. |
© 2023 by the authors. Licensee MDPI, Basel, Switzerland. This article is an open access article distributed under the terms and conditions of the Creative Commons Attribution (CC BY) license (https://creativecommons.org/licenses/by/4.0/).
Share and Cite
Sahana, J.; Cortés-Sánchez, J.L.; Sandt, V.; Melnik, D.; Corydon, T.J.; Schulz, H.; Cai, Z.; Evert, K.; Grimm, D.; Wehland, M. Long-Term Simulation of Microgravity Induces Changes in Gene Expression in Breast Cancer Cells. Int. J. Mol. Sci. 2023, 24, 1181. https://doi.org/10.3390/ijms24021181
Sahana J, Cortés-Sánchez JL, Sandt V, Melnik D, Corydon TJ, Schulz H, Cai Z, Evert K, Grimm D, Wehland M. Long-Term Simulation of Microgravity Induces Changes in Gene Expression in Breast Cancer Cells. International Journal of Molecular Sciences. 2023; 24(2):1181. https://doi.org/10.3390/ijms24021181
Chicago/Turabian StyleSahana, Jayashree, José Luis Cortés-Sánchez, Viviann Sandt, Daniela Melnik, Thomas J. Corydon, Herbert Schulz, Zexi Cai, Katja Evert, Daniela Grimm, and Markus Wehland. 2023. "Long-Term Simulation of Microgravity Induces Changes in Gene Expression in Breast Cancer Cells" International Journal of Molecular Sciences 24, no. 2: 1181. https://doi.org/10.3390/ijms24021181