Figure 1.
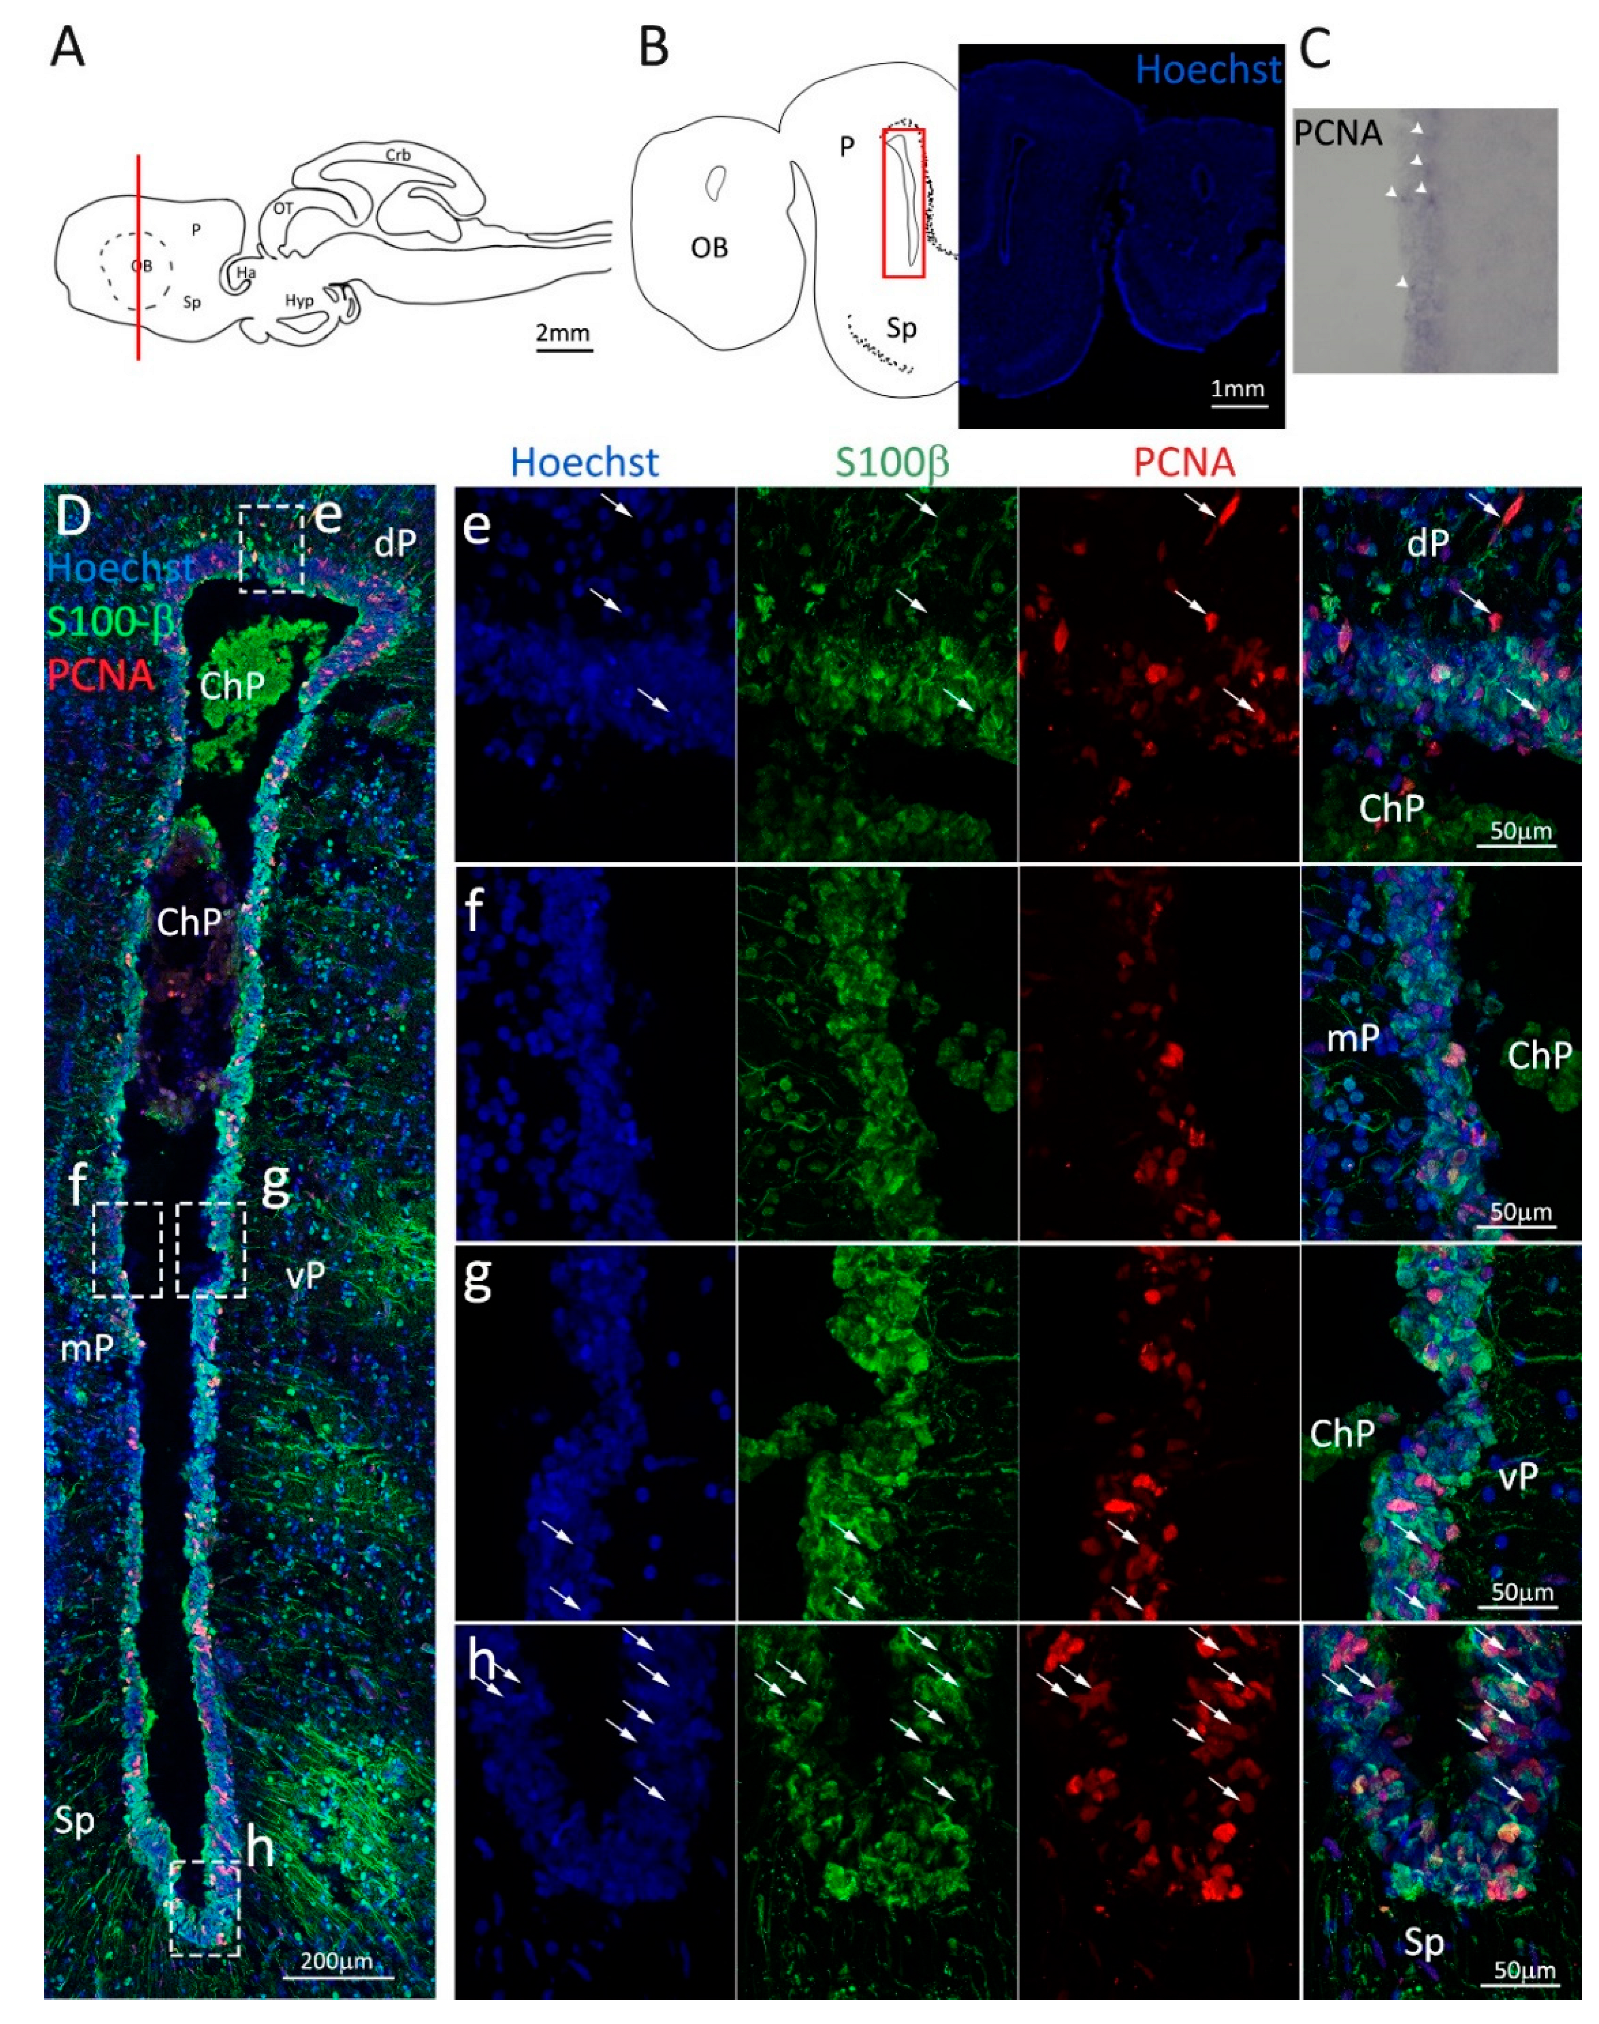
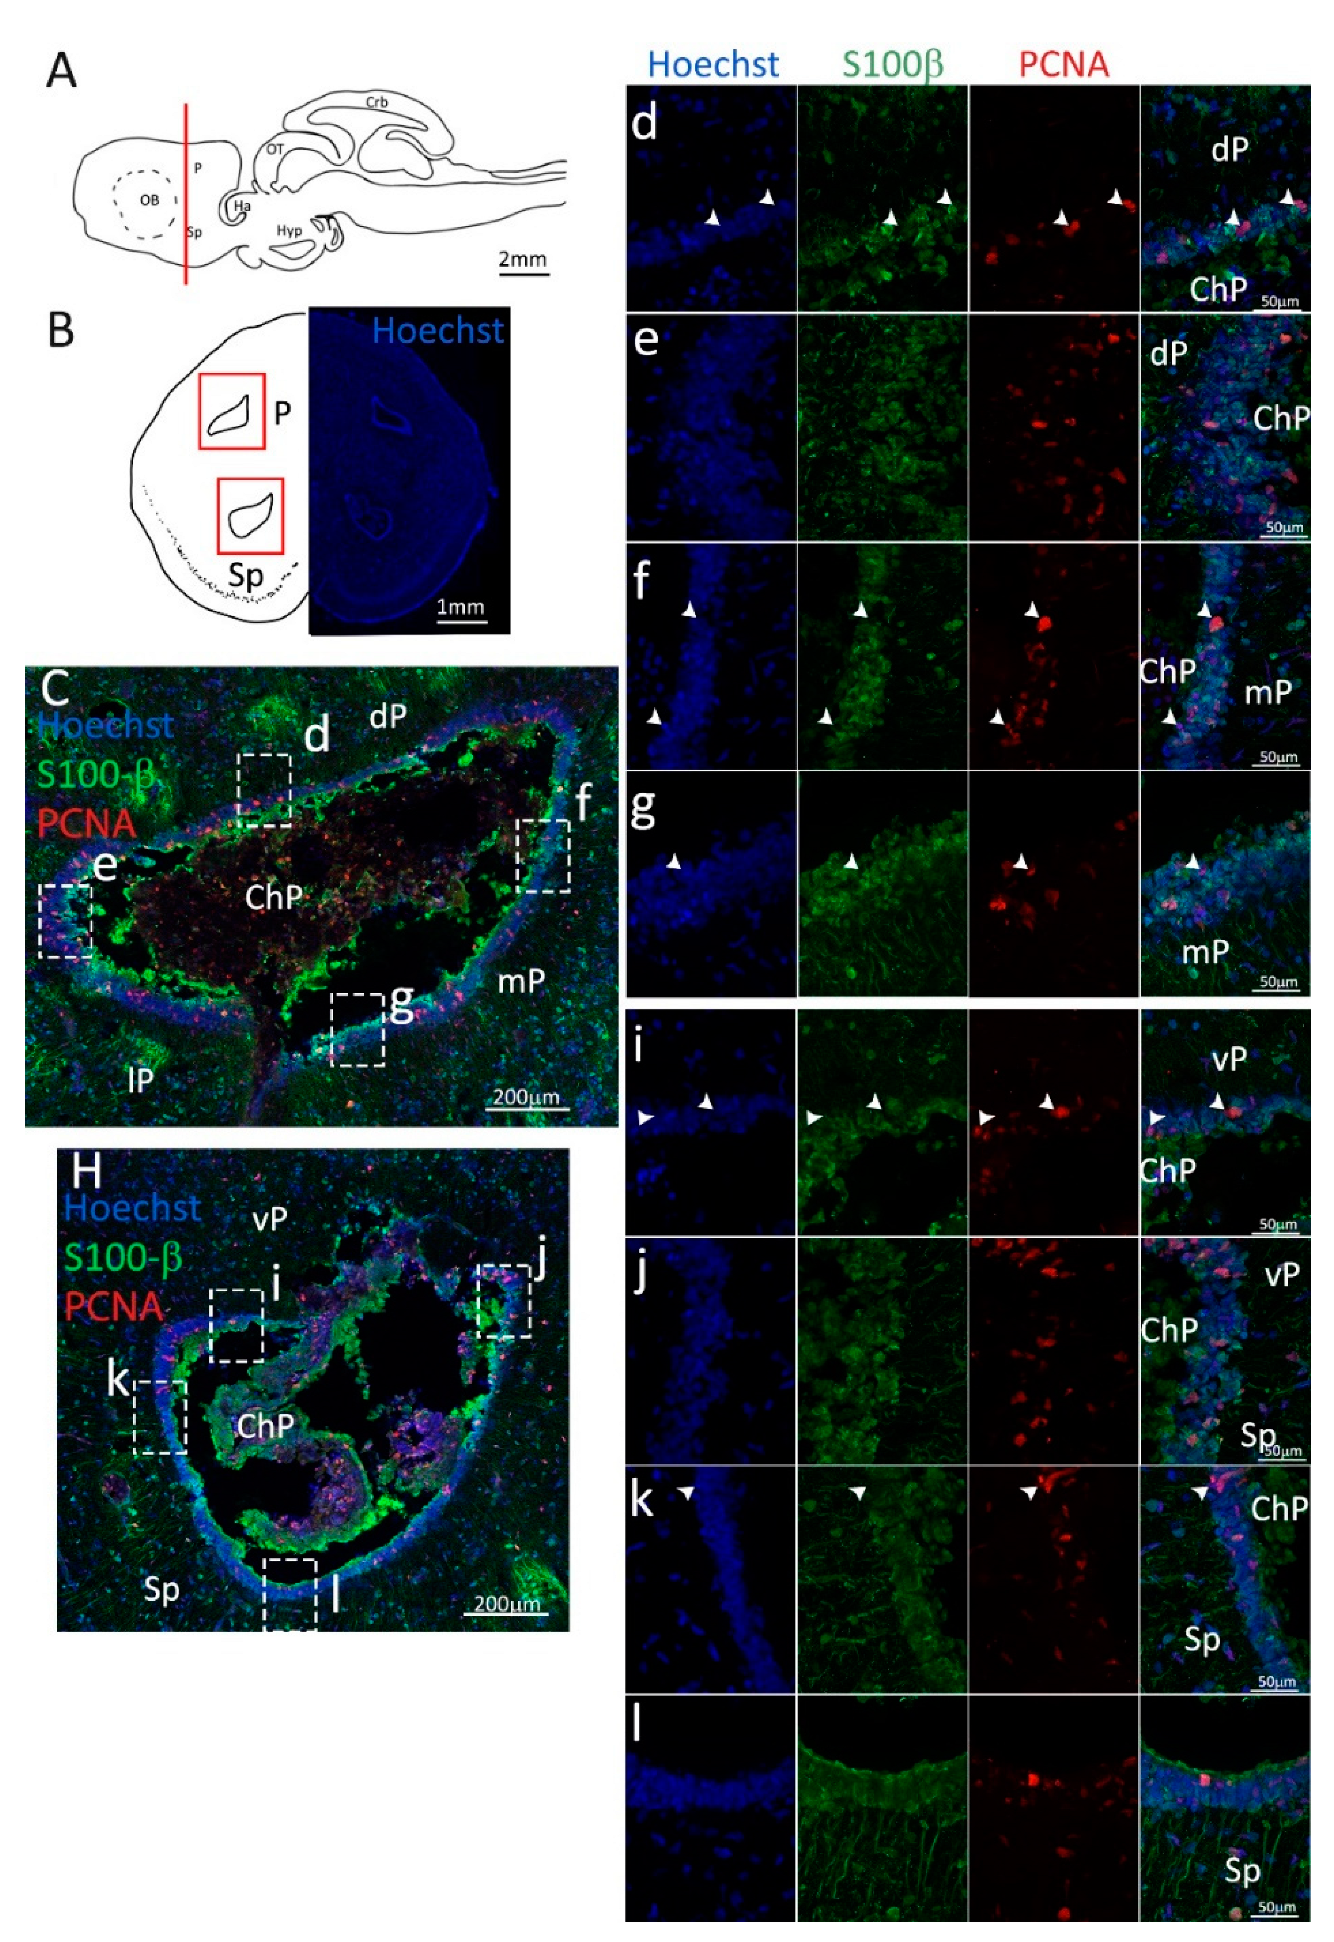
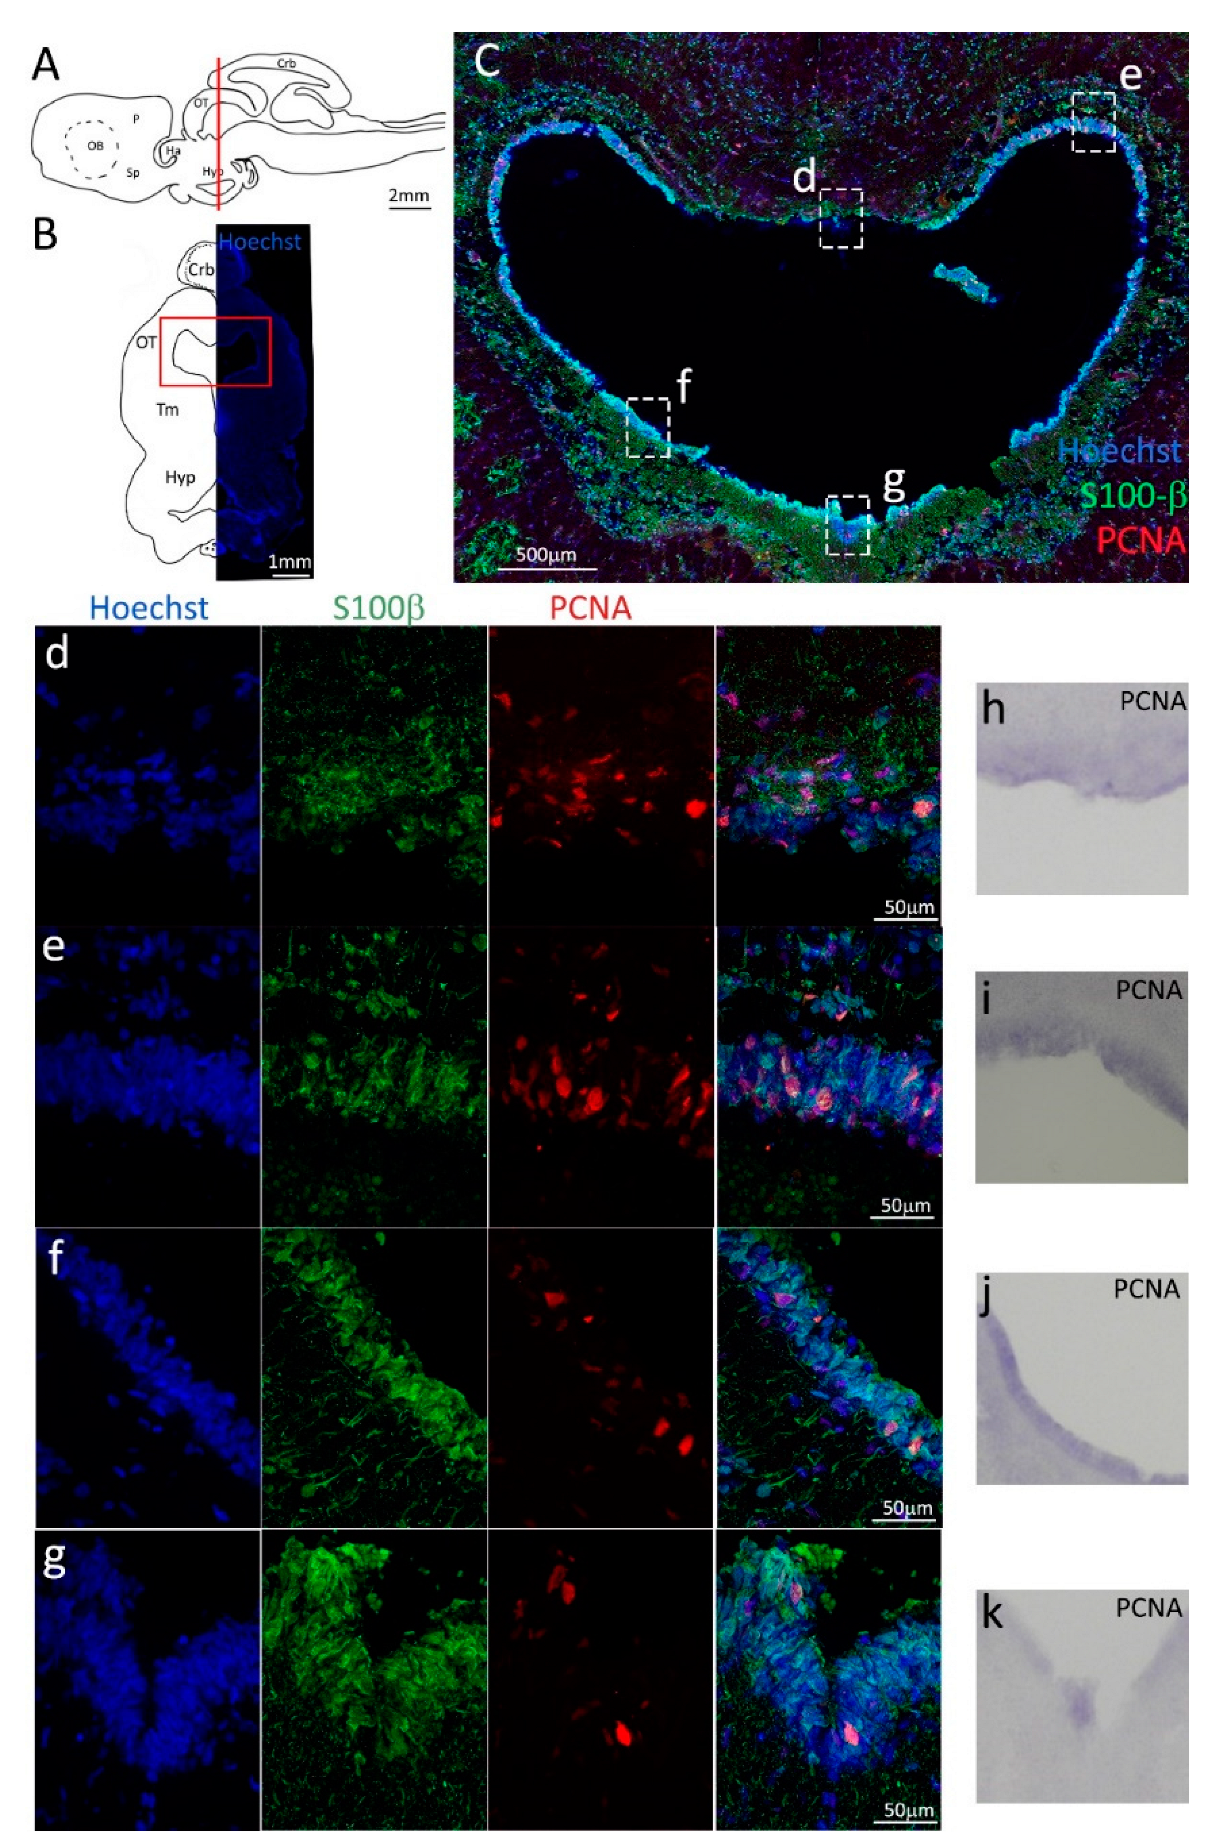
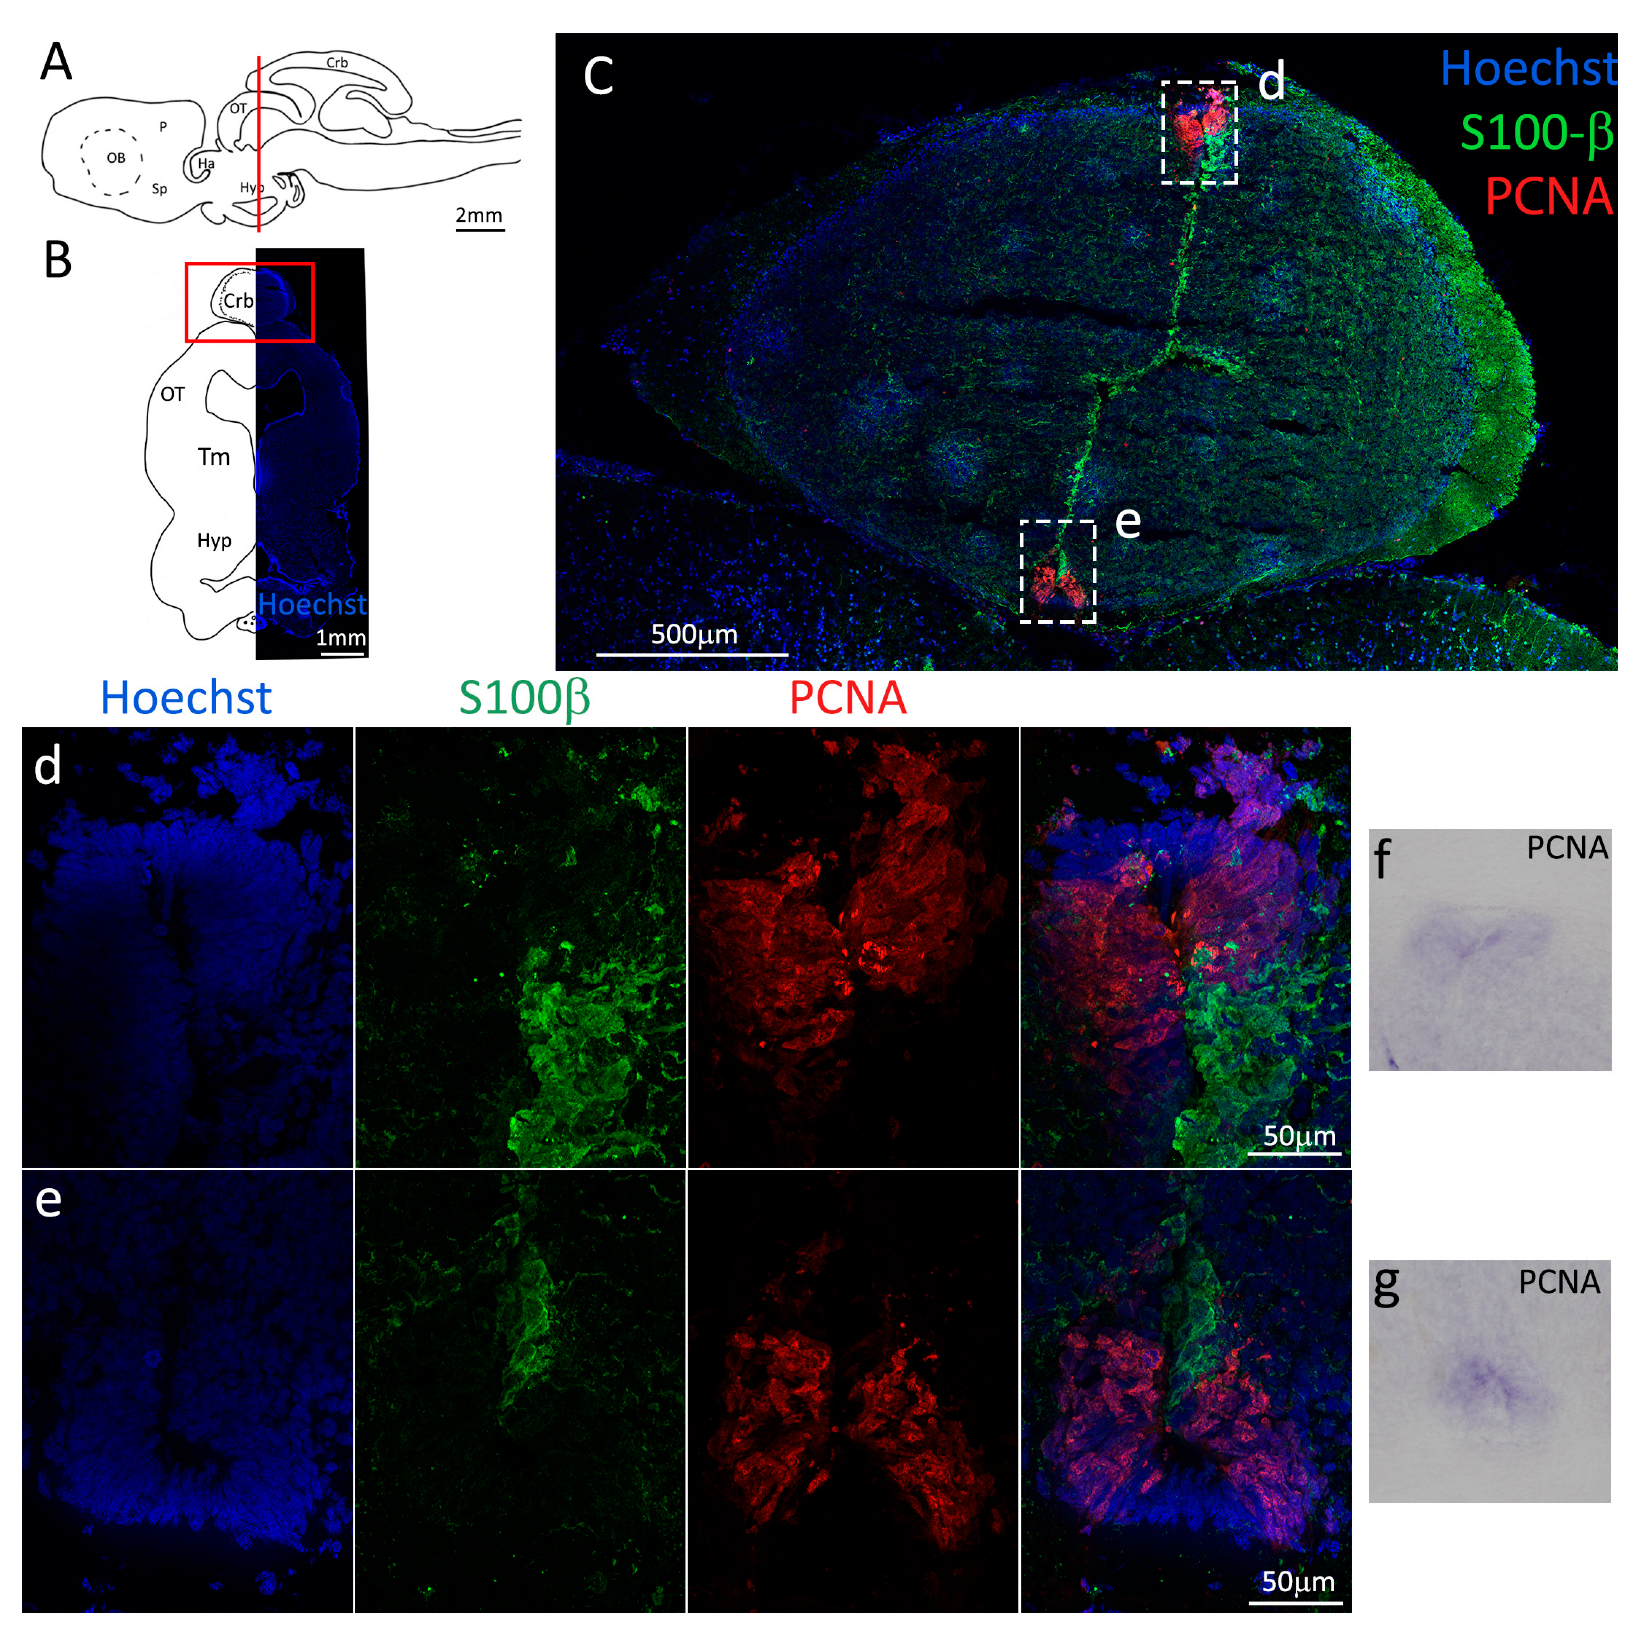
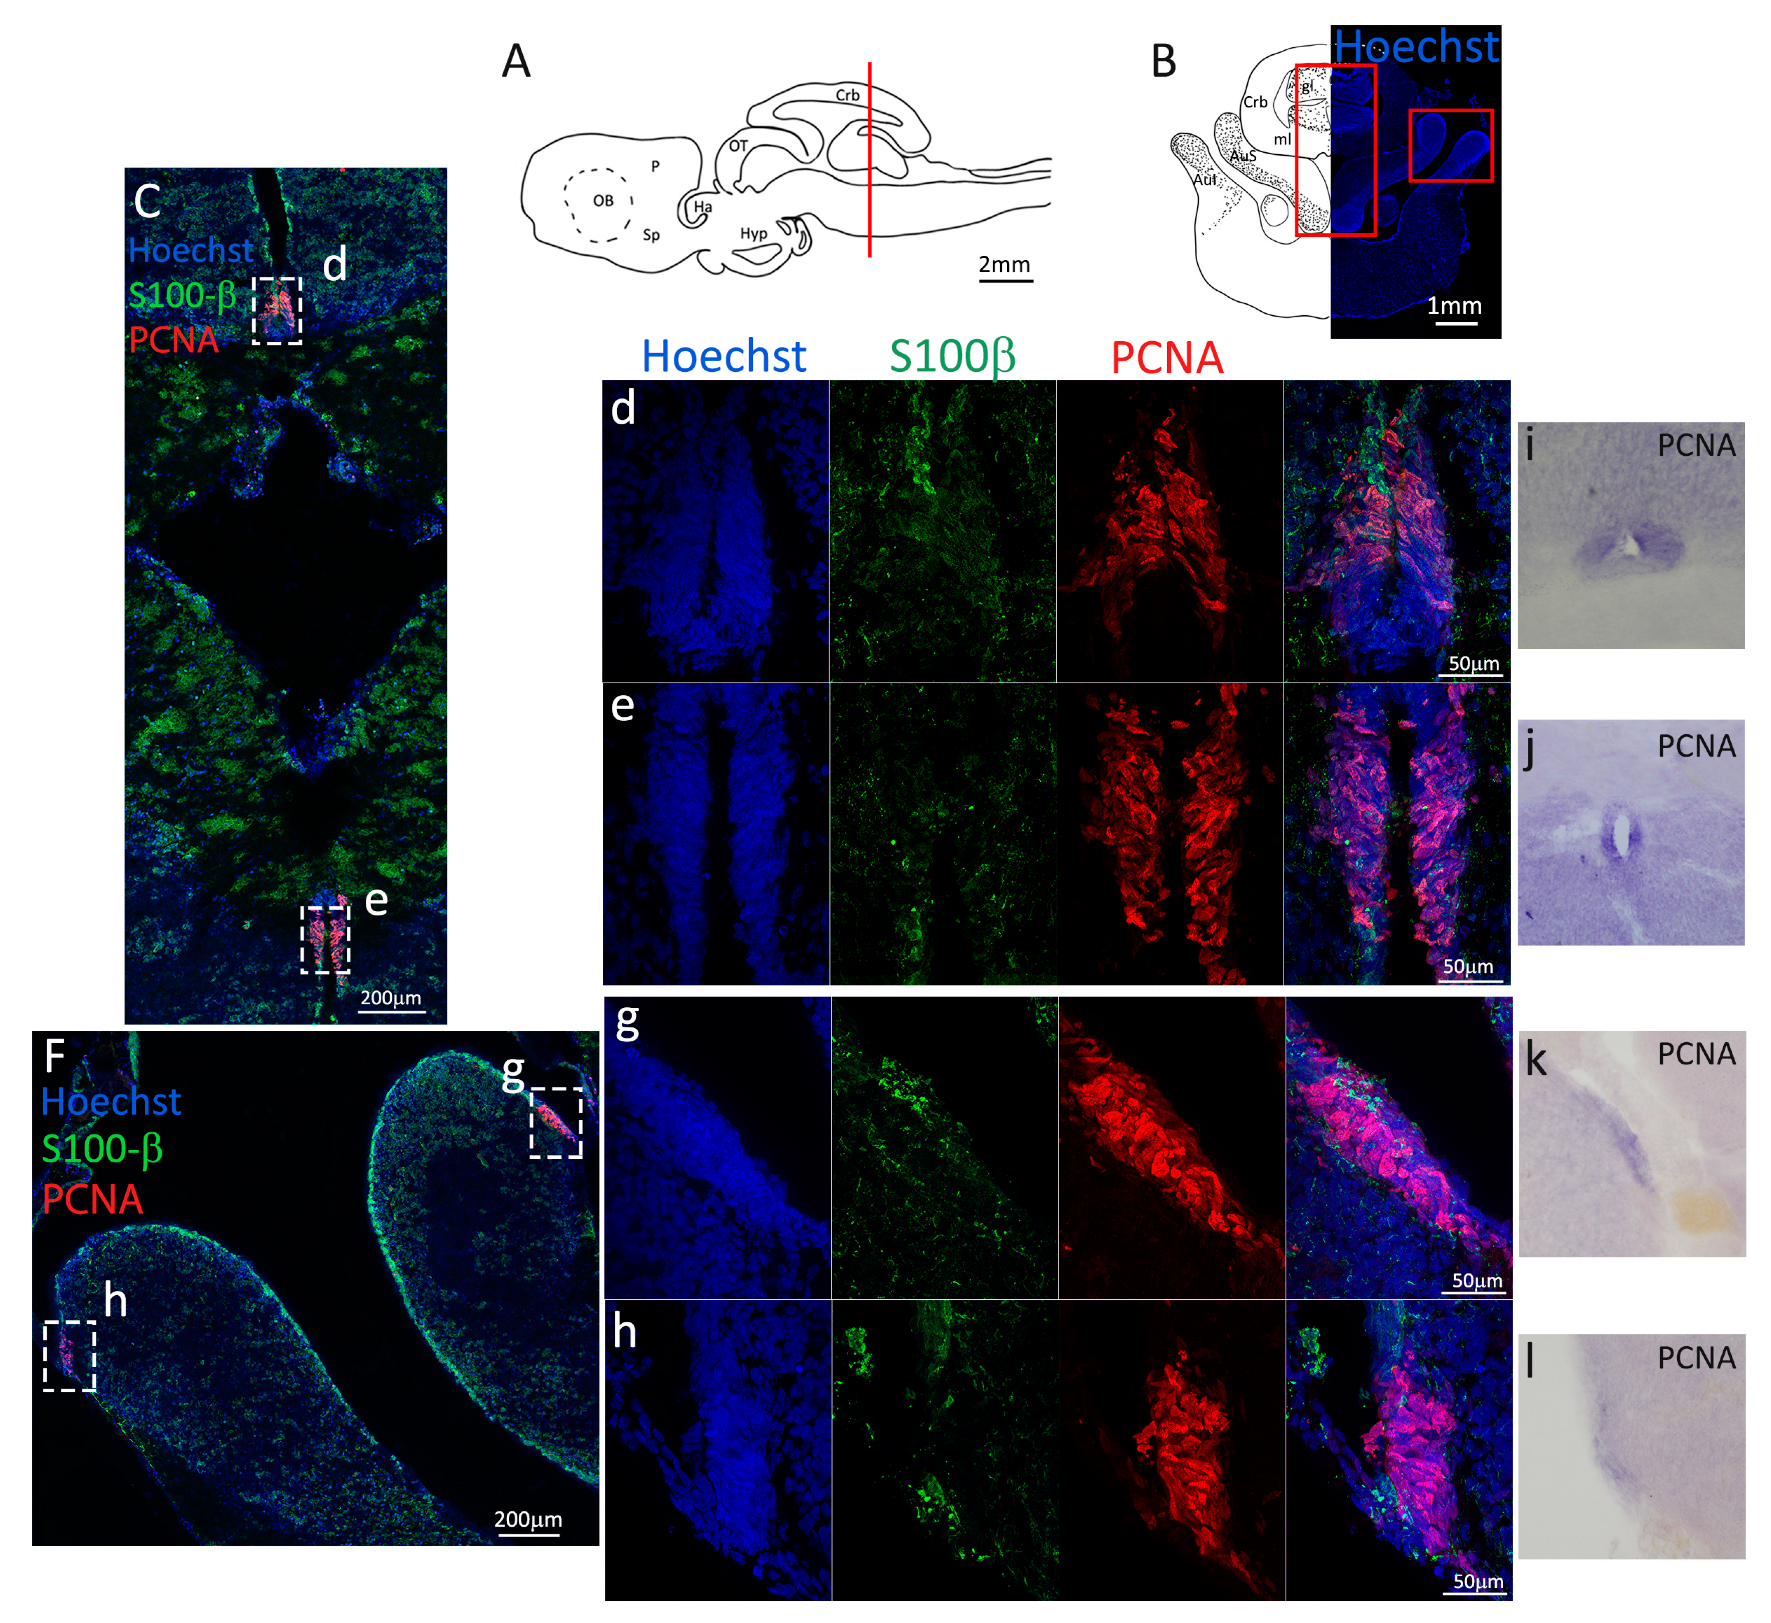
Localization of PCNA and S100β positive cells in the anterior telencephalon of S. canicula. (A) Sagittal representation of S. canicula brain. The red line indicates the rostro-caudal localization of the section represented in the panel. (B) Coronal map of the anterior telencephalon. On the right, a real coronal section is stained with Hoechst 33342 to show nuclei distribution; on the left, a cartoon is drawn to indicate anatomical references. Red rectangle identifies the general area from which images are taken. (C) S. canicula PCNA in situ hybridization in the anterior telencephalon ventricle. White arrowheads indicate cells expressing pcna mRNA. (D) Anterior telencephalic neurogenic niche. Radial glial cell bodies (S100β+, green) are localized around the ventricular wall and their processes spread into the surrounding tissue. Some S100β+ cells are also PCNA+ (red), indicating the proliferative state of the stem cells. (e) Magnification of the neurogenic niche localized in the dP. White arrows indicate PCNA+/S100β− cells. (f) Magnification of the neurogenic niche localized in the mP. (g) Magnification of the neurogenic niche localized in the vP. White arrowheads indicate PCNA+/S100β− cells. (h) Magnification of the neurogenic niche localized in the Sp. White arrowheads indicate PCNA+/S100β− cells. Abbreviations: OB: olfactory bulb, P: pallium, Sp: subpallium, dP: dorsal pallium, mP: medial pallium, vP: ventral pallium, ChP: choroid plexus.
Figure 1.
Localization of PCNA and S100β positive cells in the anterior telencephalon of S. canicula. (A) Sagittal representation of S. canicula brain. The red line indicates the rostro-caudal localization of the section represented in the panel. (B) Coronal map of the anterior telencephalon. On the right, a real coronal section is stained with Hoechst 33342 to show nuclei distribution; on the left, a cartoon is drawn to indicate anatomical references. Red rectangle identifies the general area from which images are taken. (C) S. canicula PCNA in situ hybridization in the anterior telencephalon ventricle. White arrowheads indicate cells expressing pcna mRNA. (D) Anterior telencephalic neurogenic niche. Radial glial cell bodies (S100β+, green) are localized around the ventricular wall and their processes spread into the surrounding tissue. Some S100β+ cells are also PCNA+ (red), indicating the proliferative state of the stem cells. (e) Magnification of the neurogenic niche localized in the dP. White arrows indicate PCNA+/S100β− cells. (f) Magnification of the neurogenic niche localized in the mP. (g) Magnification of the neurogenic niche localized in the vP. White arrowheads indicate PCNA+/S100β− cells. (h) Magnification of the neurogenic niche localized in the Sp. White arrowheads indicate PCNA+/S100β− cells. Abbreviations: OB: olfactory bulb, P: pallium, Sp: subpallium, dP: dorsal pallium, mP: medial pallium, vP: ventral pallium, ChP: choroid plexus.
![Ijms 24 03650 g001]()
Figure 2.
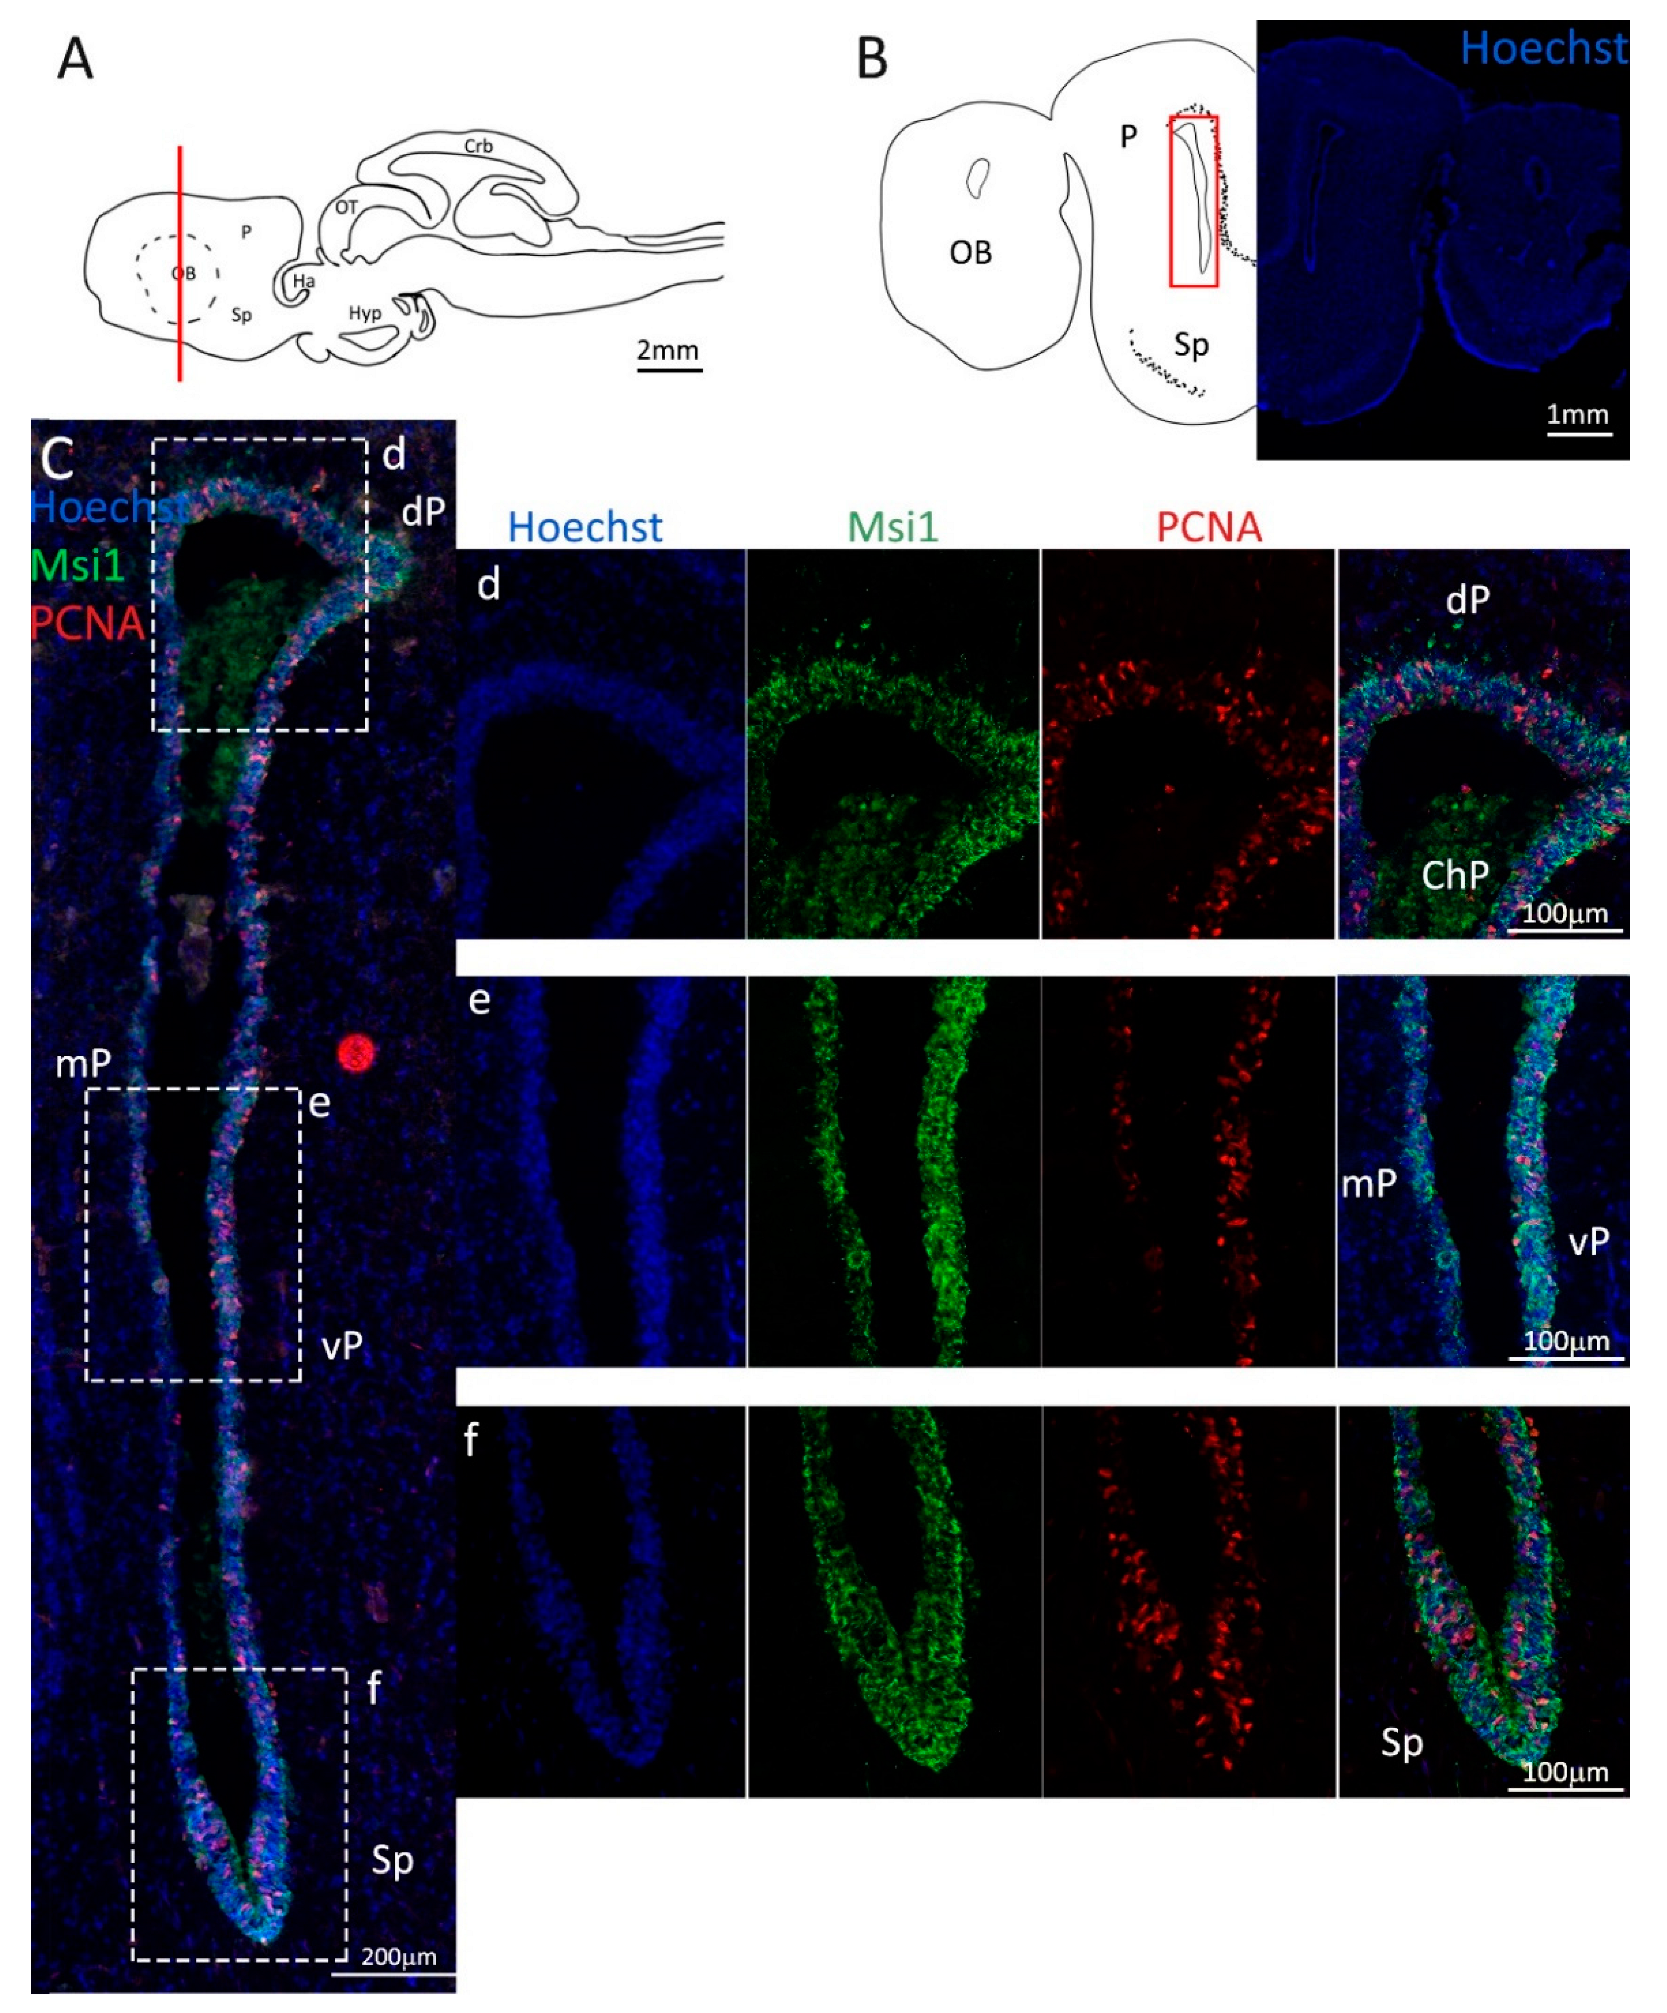
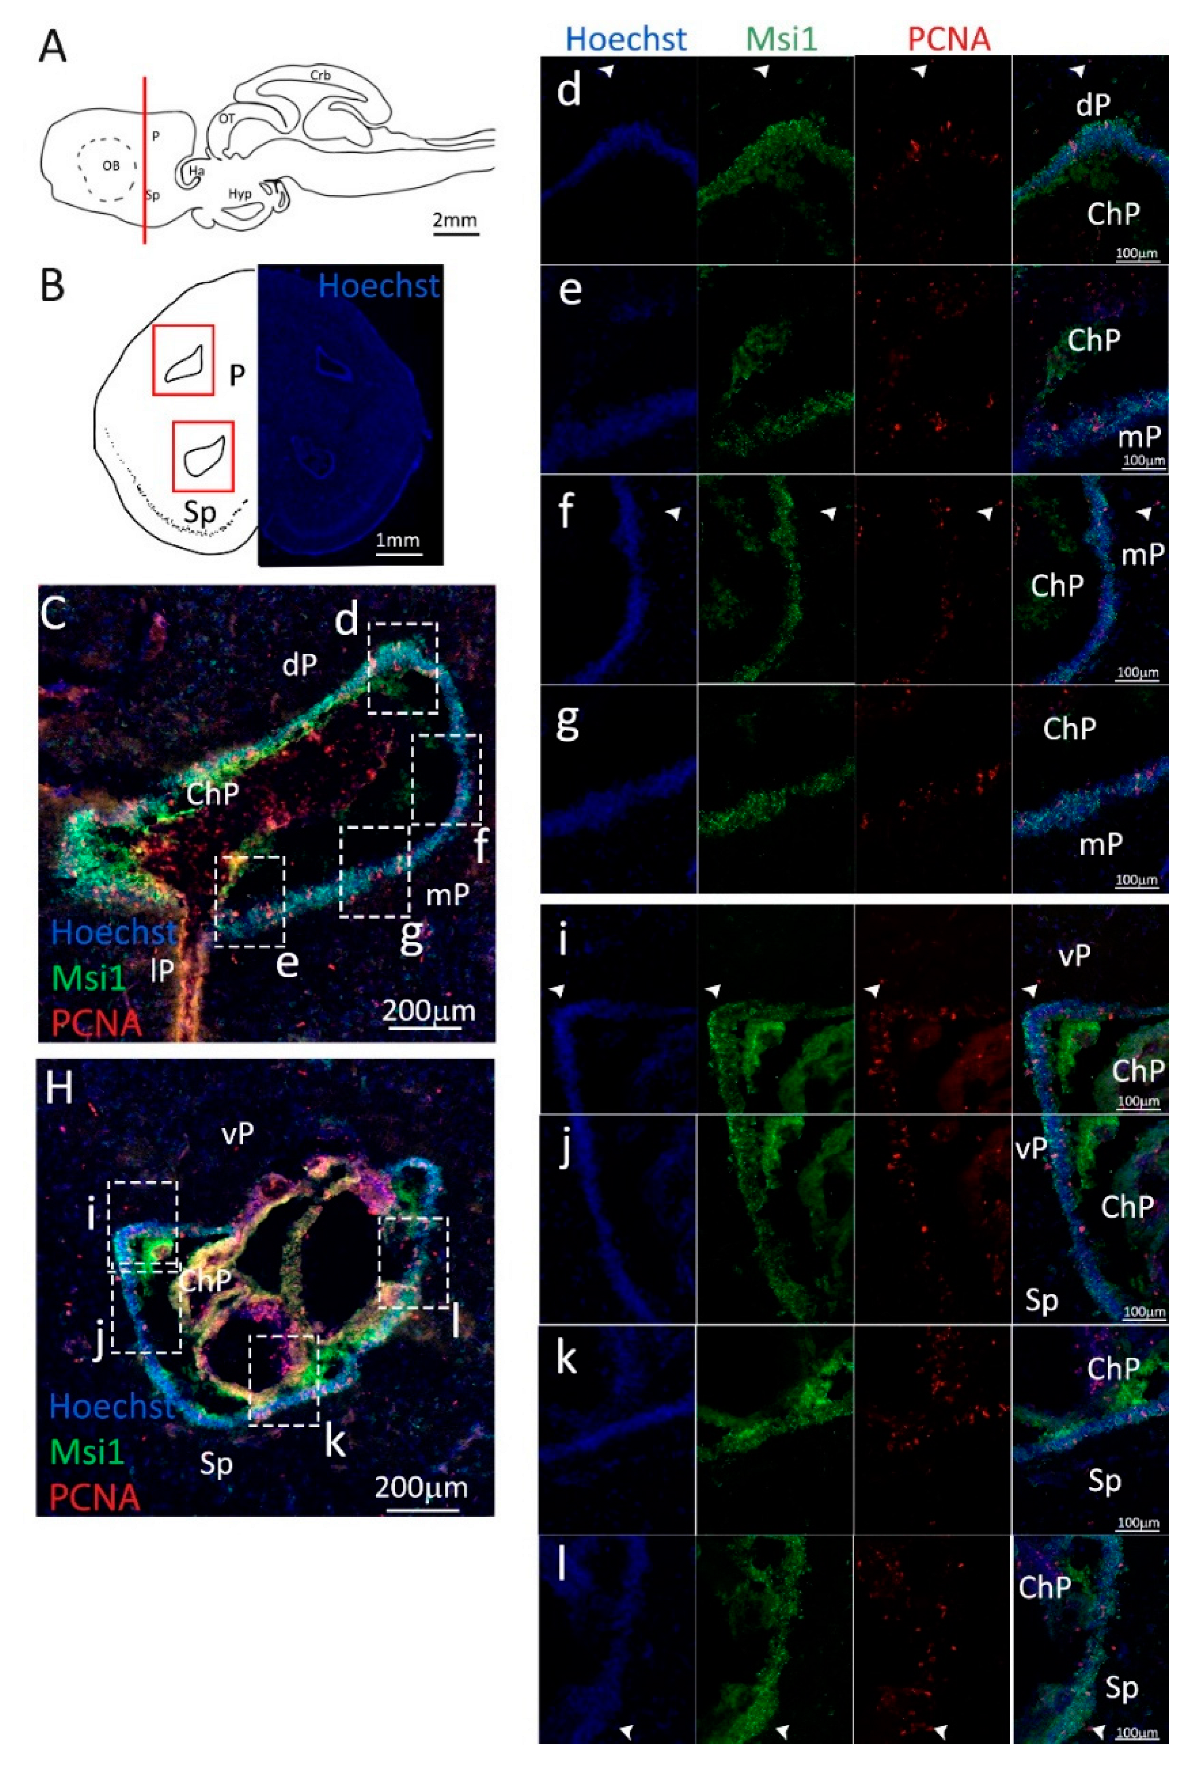
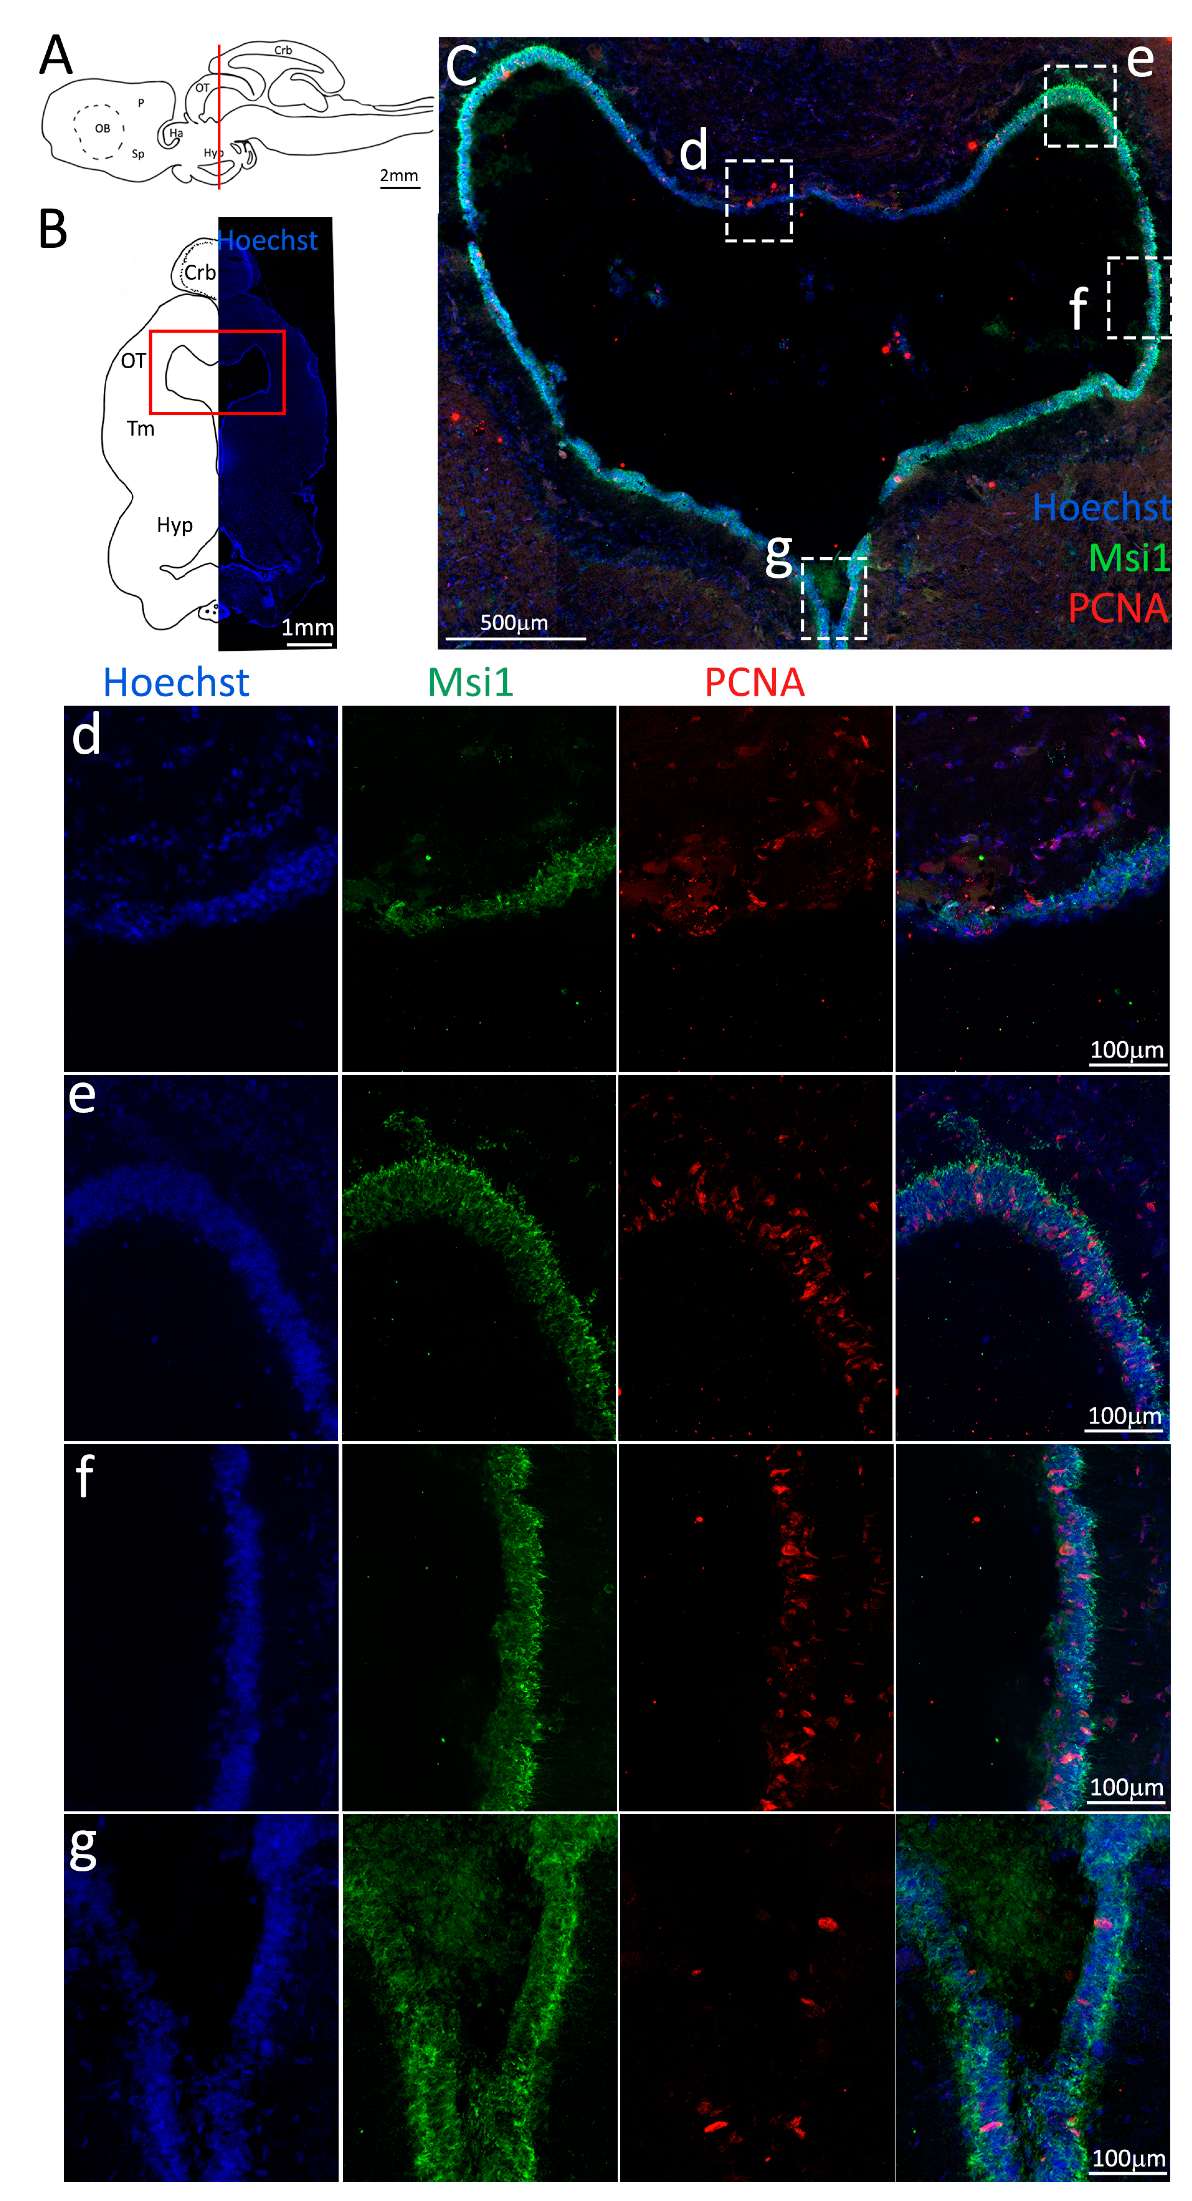
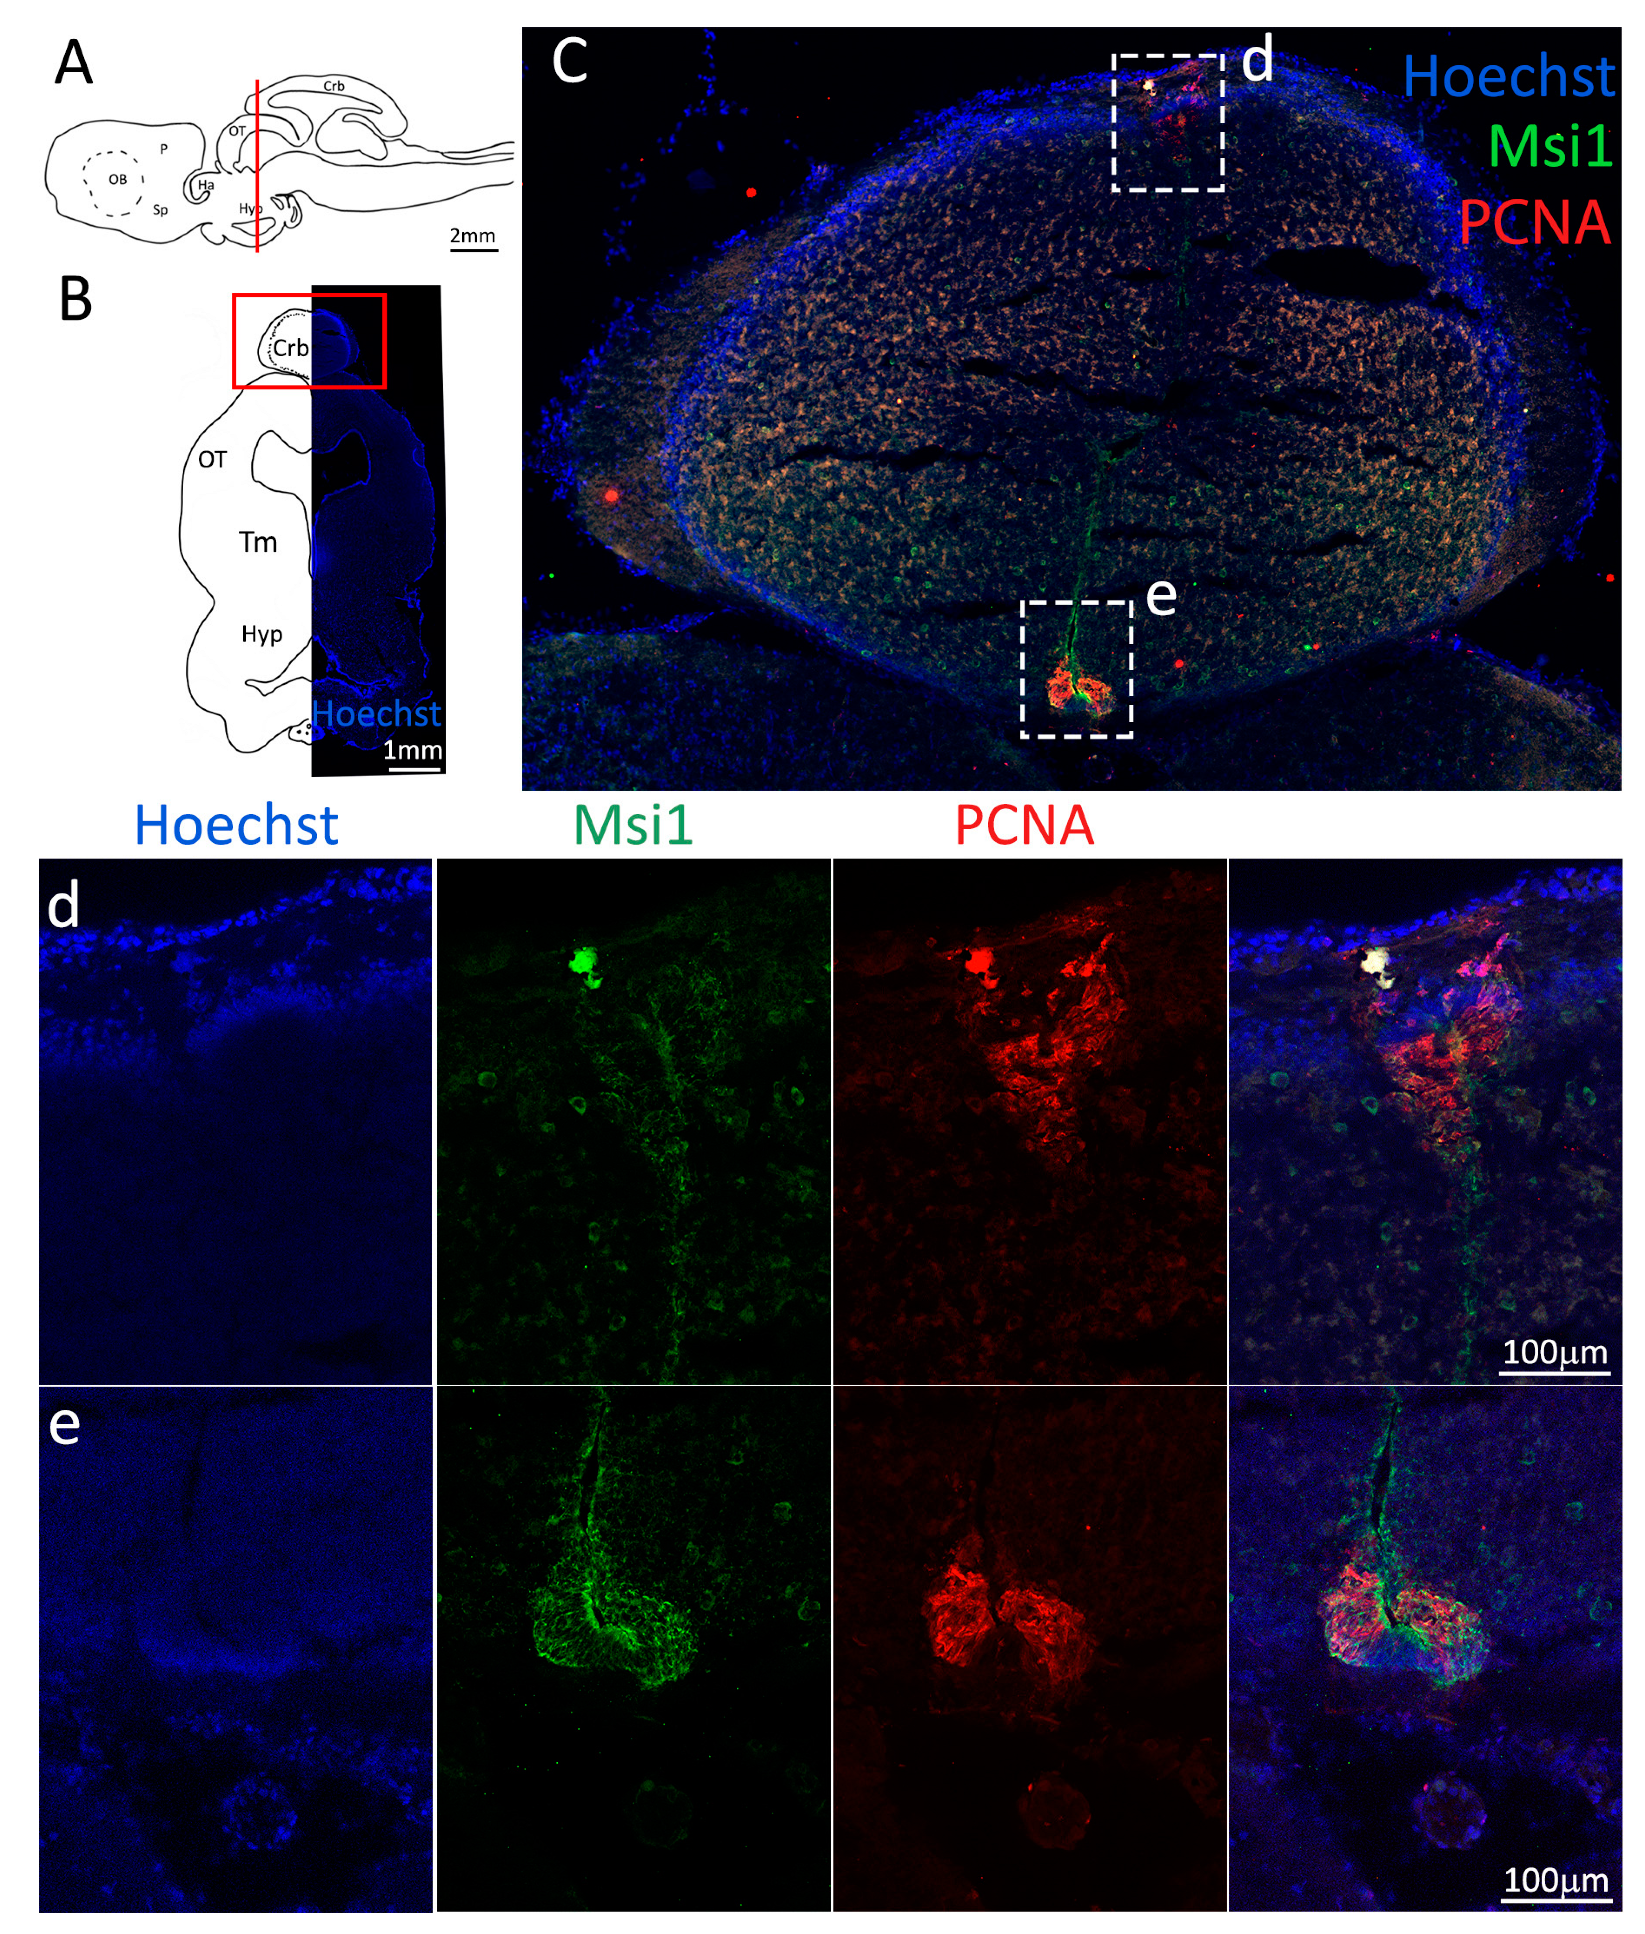
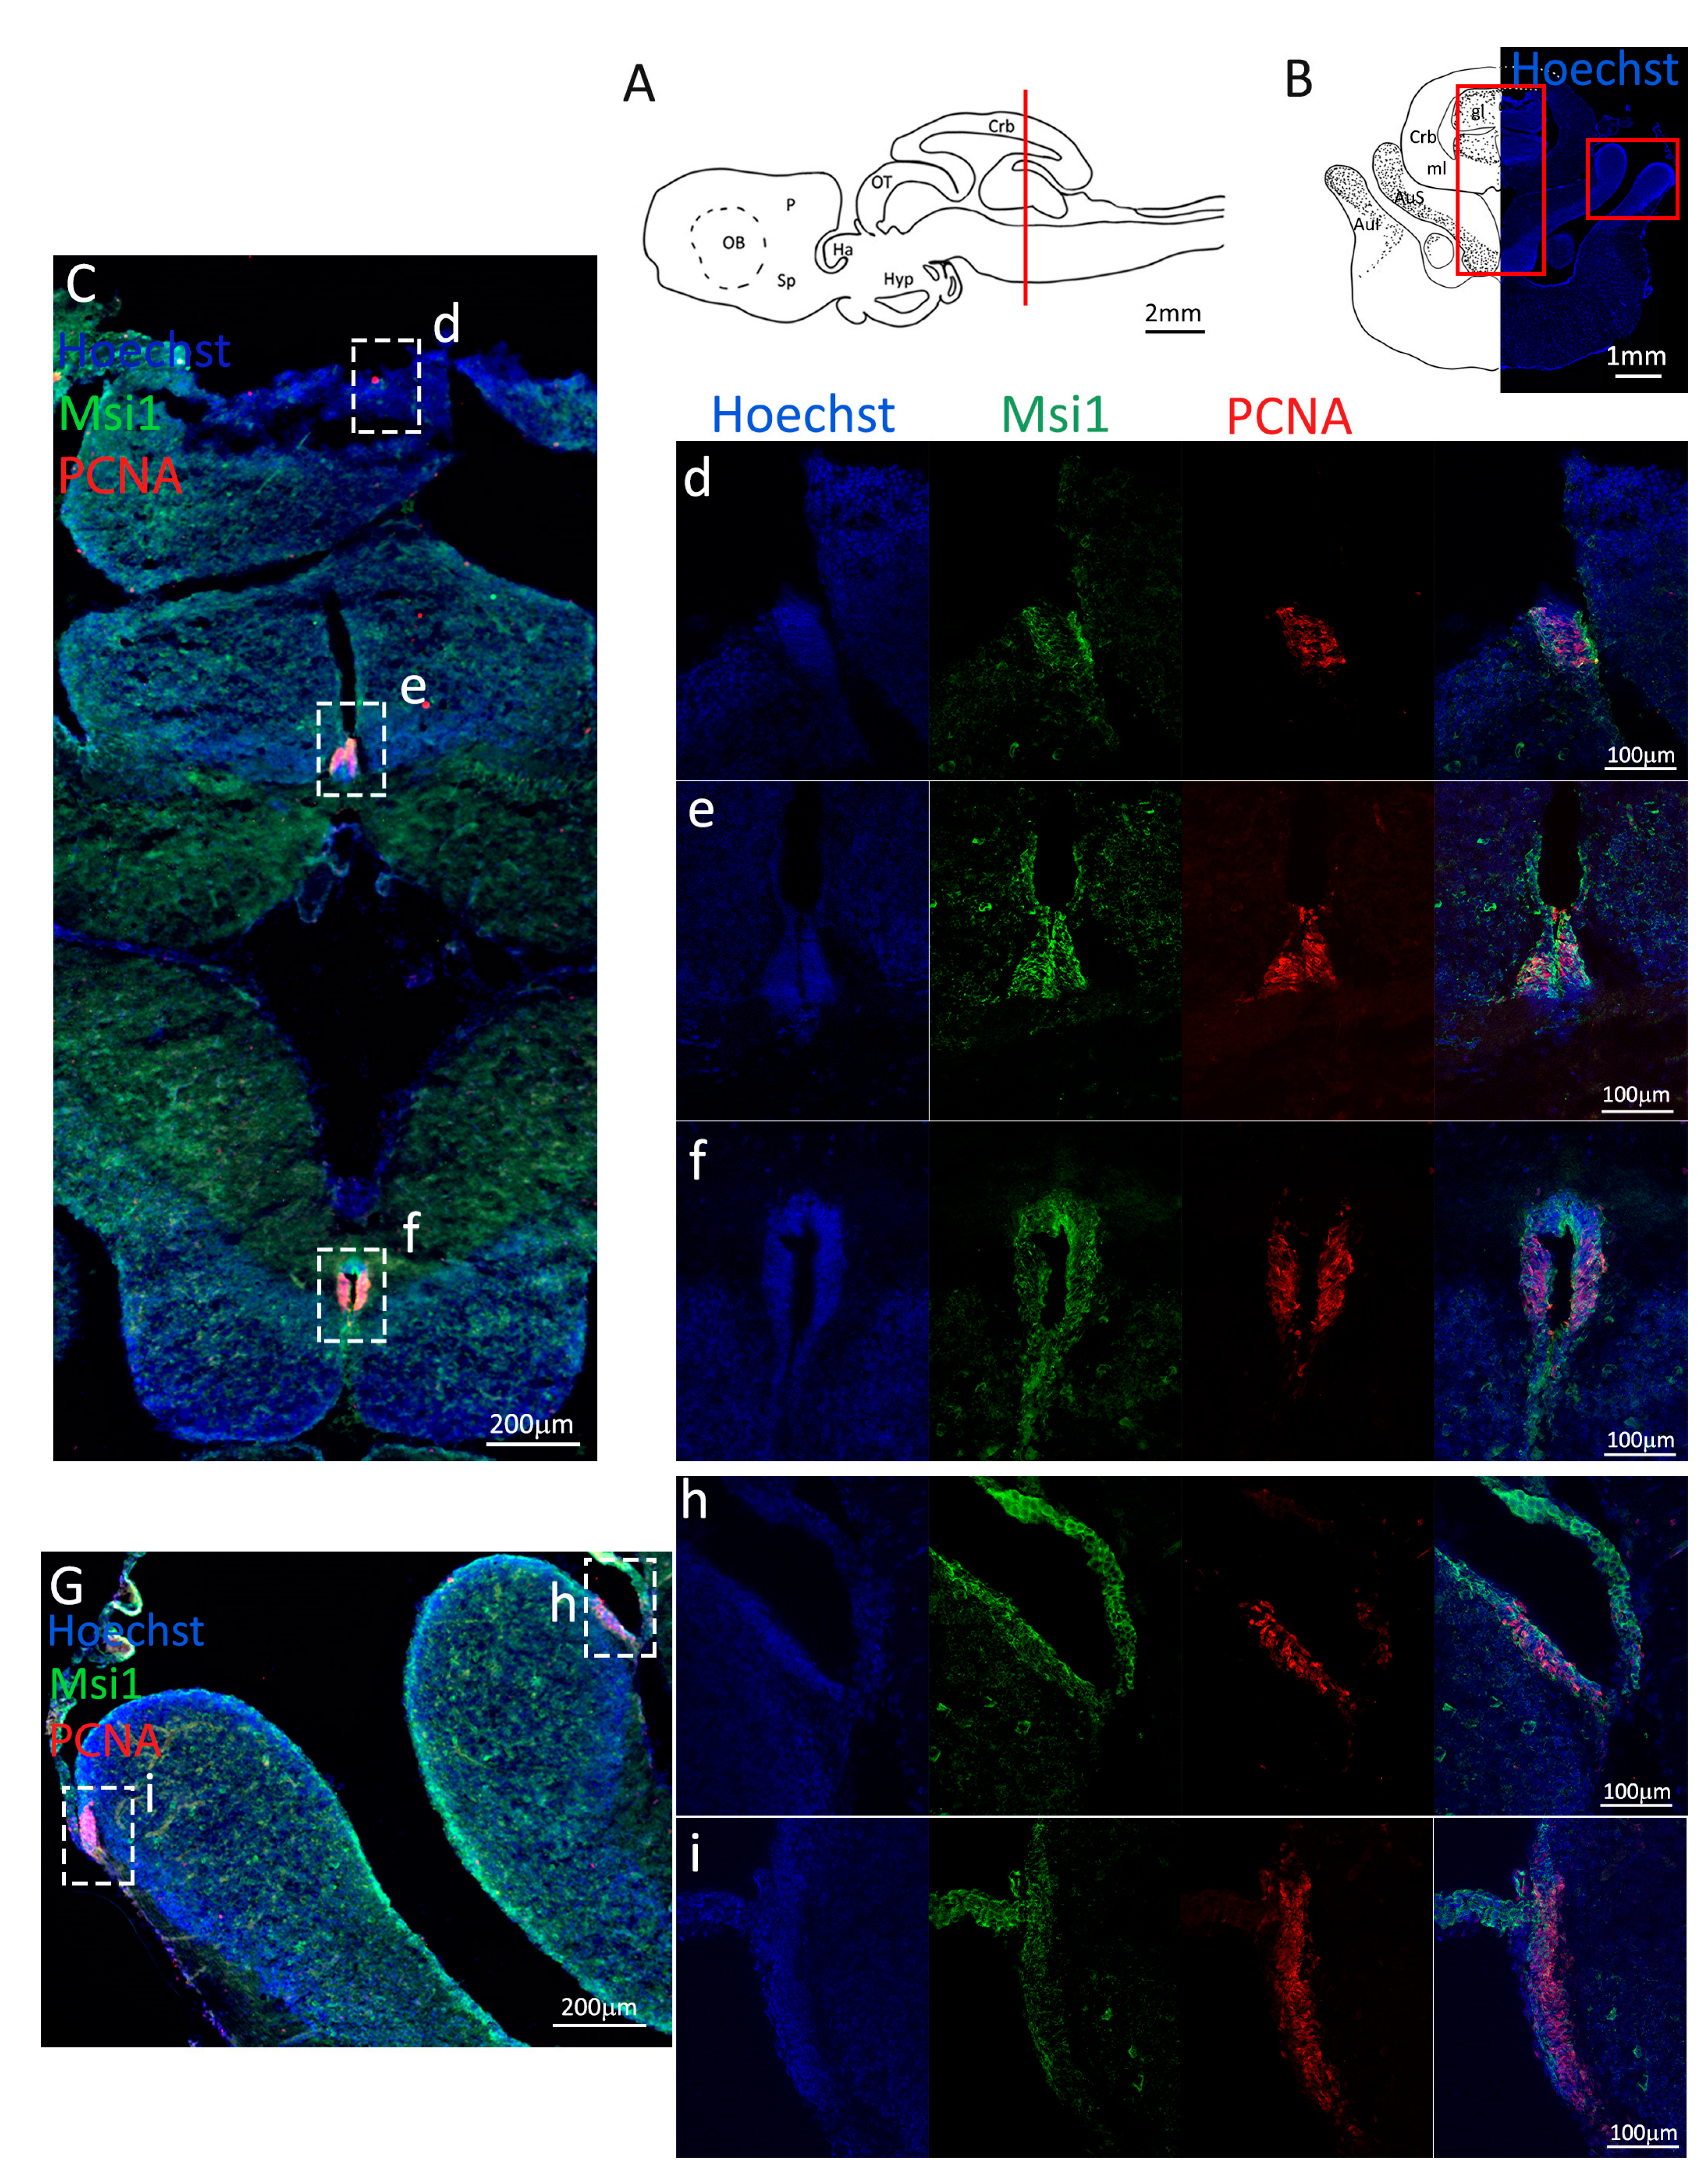
Localization of PCNA (red) and Msi1 (green) positive cells in the anterior telencephalon of S. canicula. (A) Sagittal representation of S. canicula brain. The red line indicates the rostro-caudal localization of the section represented in the panel. (B) Coronal map of the anterior telencephalon. On the right, a real coronal section is stained with Hoechst 33342 to show nuclei distribution; on the left, a cartoon is drawn to indicate anatomical references. Red rectangle identifies the general area from which images are taken. (C) Progenitor cells in the anterior telencephalic neurogenic niche. Progenitor cells (Msi1+, green) are localized around the ventricular wall. (d) Magnification of the neurogenic niche localized in the dP. (e) Magnification of the neurogenic niche localized in the mP and vP. It is evident the major thickness of the progenitor cells layer on the side of the vP in respect to the mP, as well as the higher number of PCNA+ cells (red). (f) Magnification of the neurogenic niche localized in the Sp. Abbreviations: OB: olfactory bulb, P: pallium, Sp: subpallium, dP: dorsal pallium, mP: medial pallium, vP: ventral pallium, ChP: choroid plexus.
Figure 2.
Localization of PCNA (red) and Msi1 (green) positive cells in the anterior telencephalon of S. canicula. (A) Sagittal representation of S. canicula brain. The red line indicates the rostro-caudal localization of the section represented in the panel. (B) Coronal map of the anterior telencephalon. On the right, a real coronal section is stained with Hoechst 33342 to show nuclei distribution; on the left, a cartoon is drawn to indicate anatomical references. Red rectangle identifies the general area from which images are taken. (C) Progenitor cells in the anterior telencephalic neurogenic niche. Progenitor cells (Msi1+, green) are localized around the ventricular wall. (d) Magnification of the neurogenic niche localized in the dP. (e) Magnification of the neurogenic niche localized in the mP and vP. It is evident the major thickness of the progenitor cells layer on the side of the vP in respect to the mP, as well as the higher number of PCNA+ cells (red). (f) Magnification of the neurogenic niche localized in the Sp. Abbreviations: OB: olfactory bulb, P: pallium, Sp: subpallium, dP: dorsal pallium, mP: medial pallium, vP: ventral pallium, ChP: choroid plexus.
![Ijms 24 03650 g002]()
Figure 3.
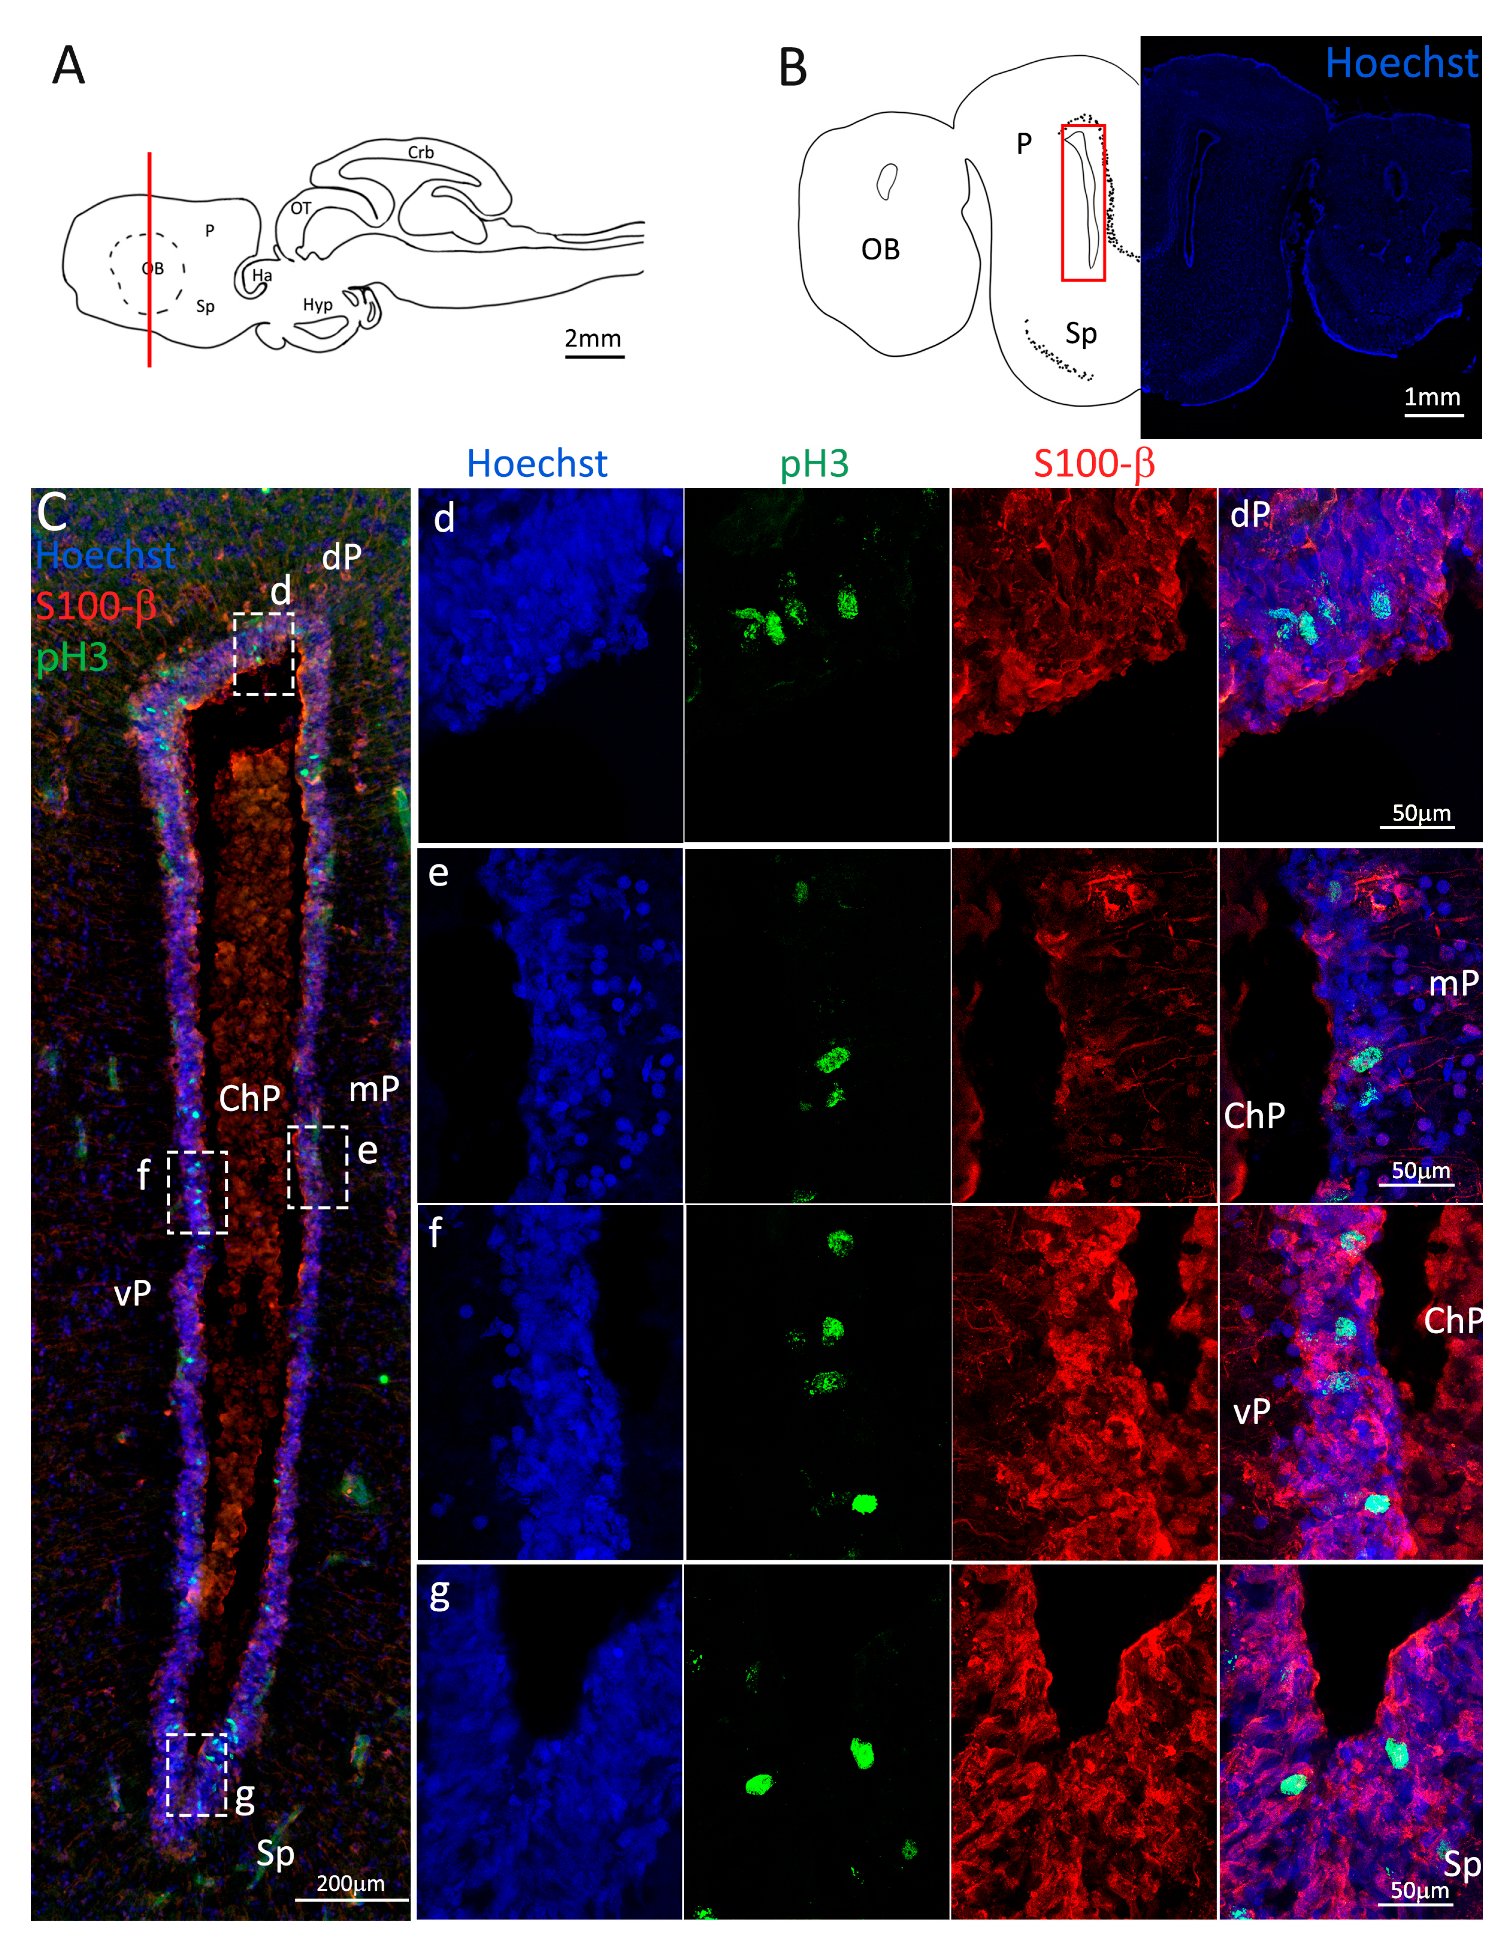
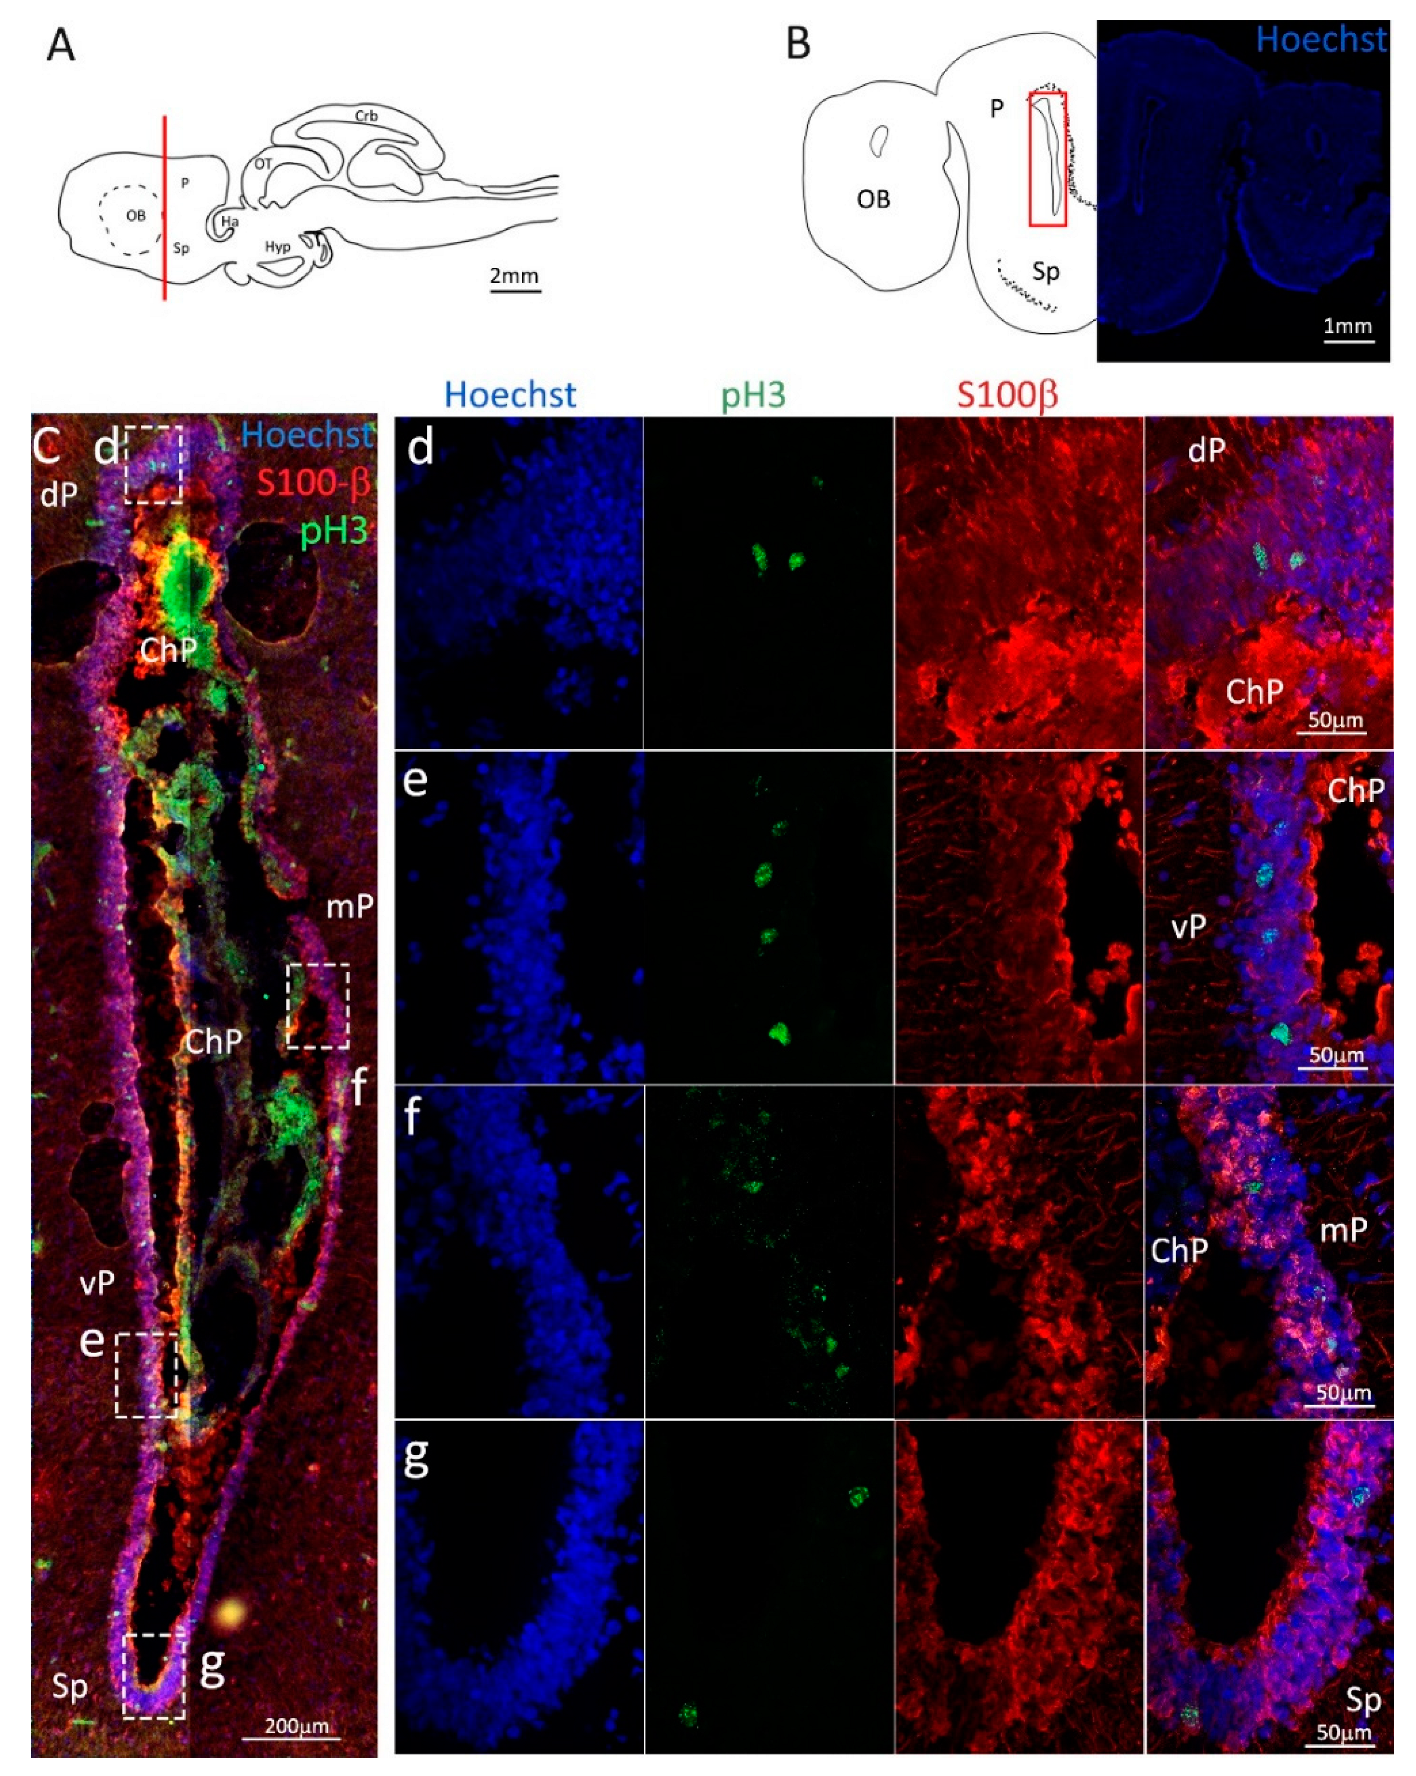
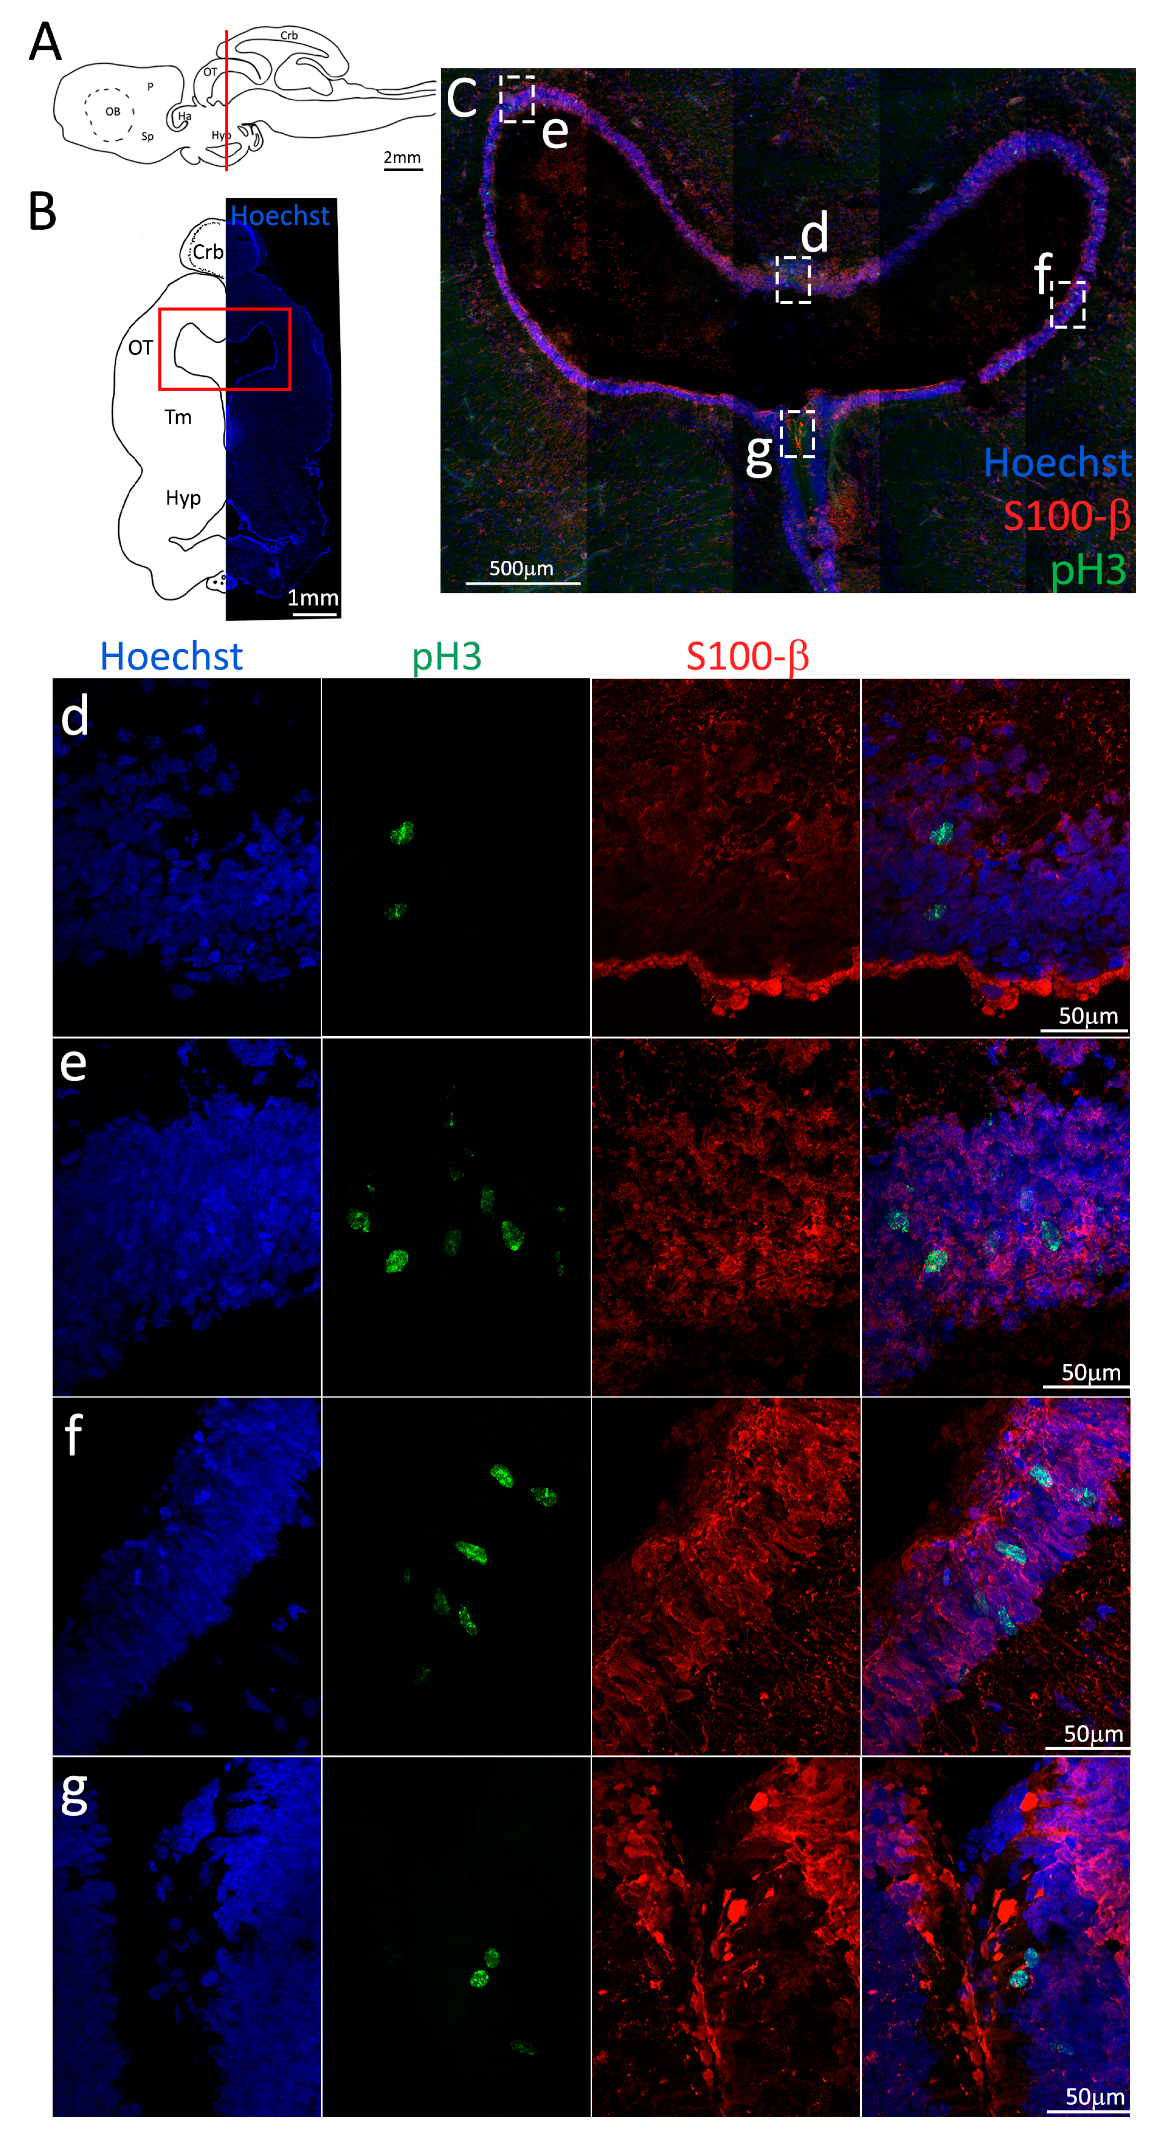
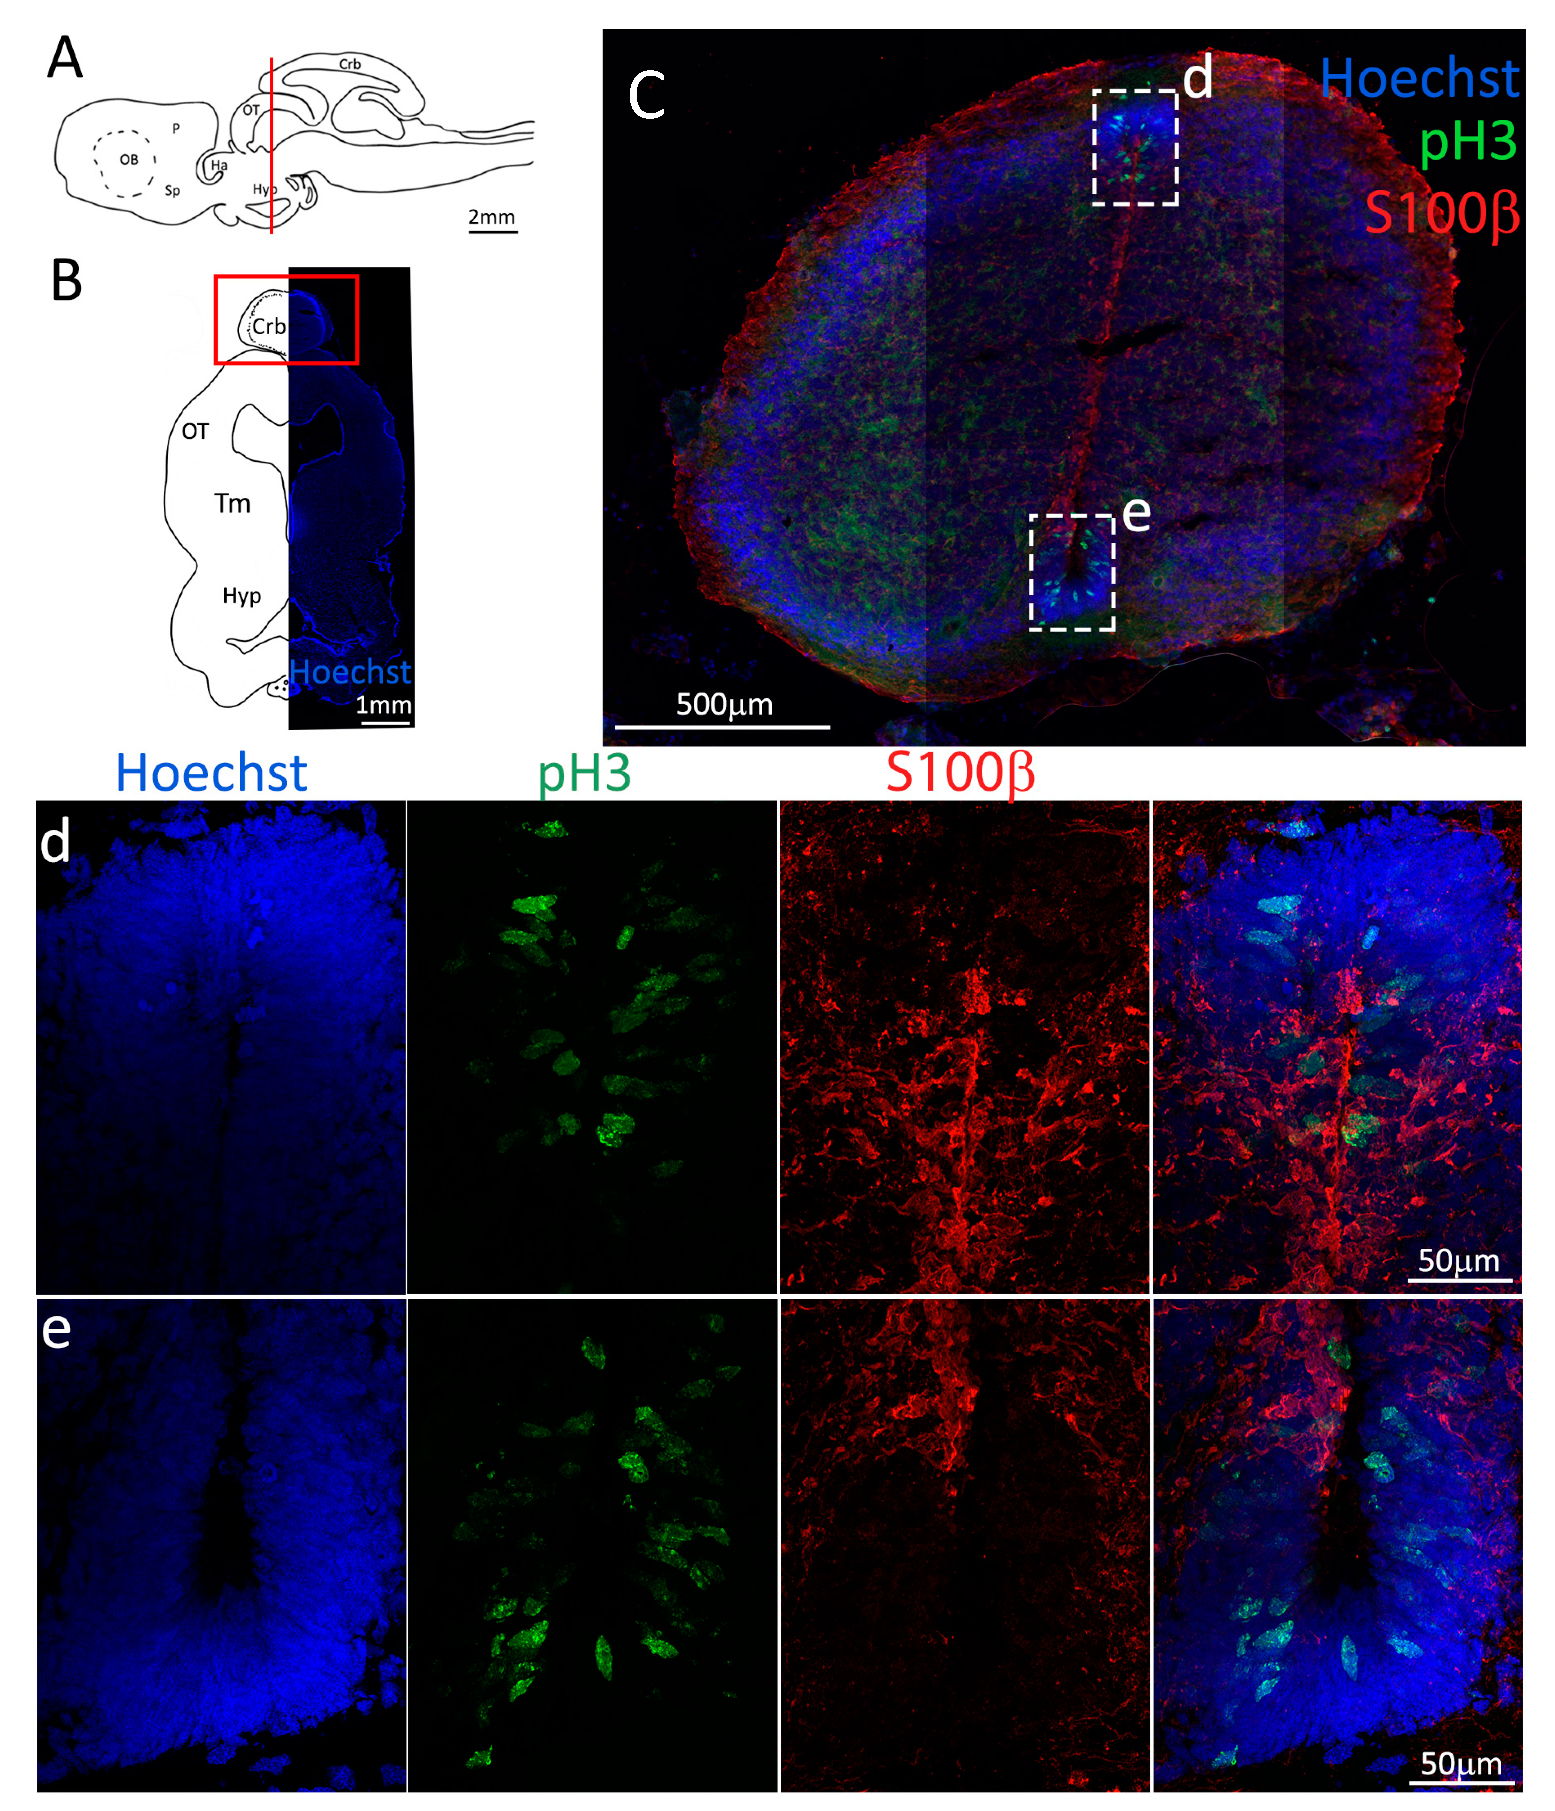
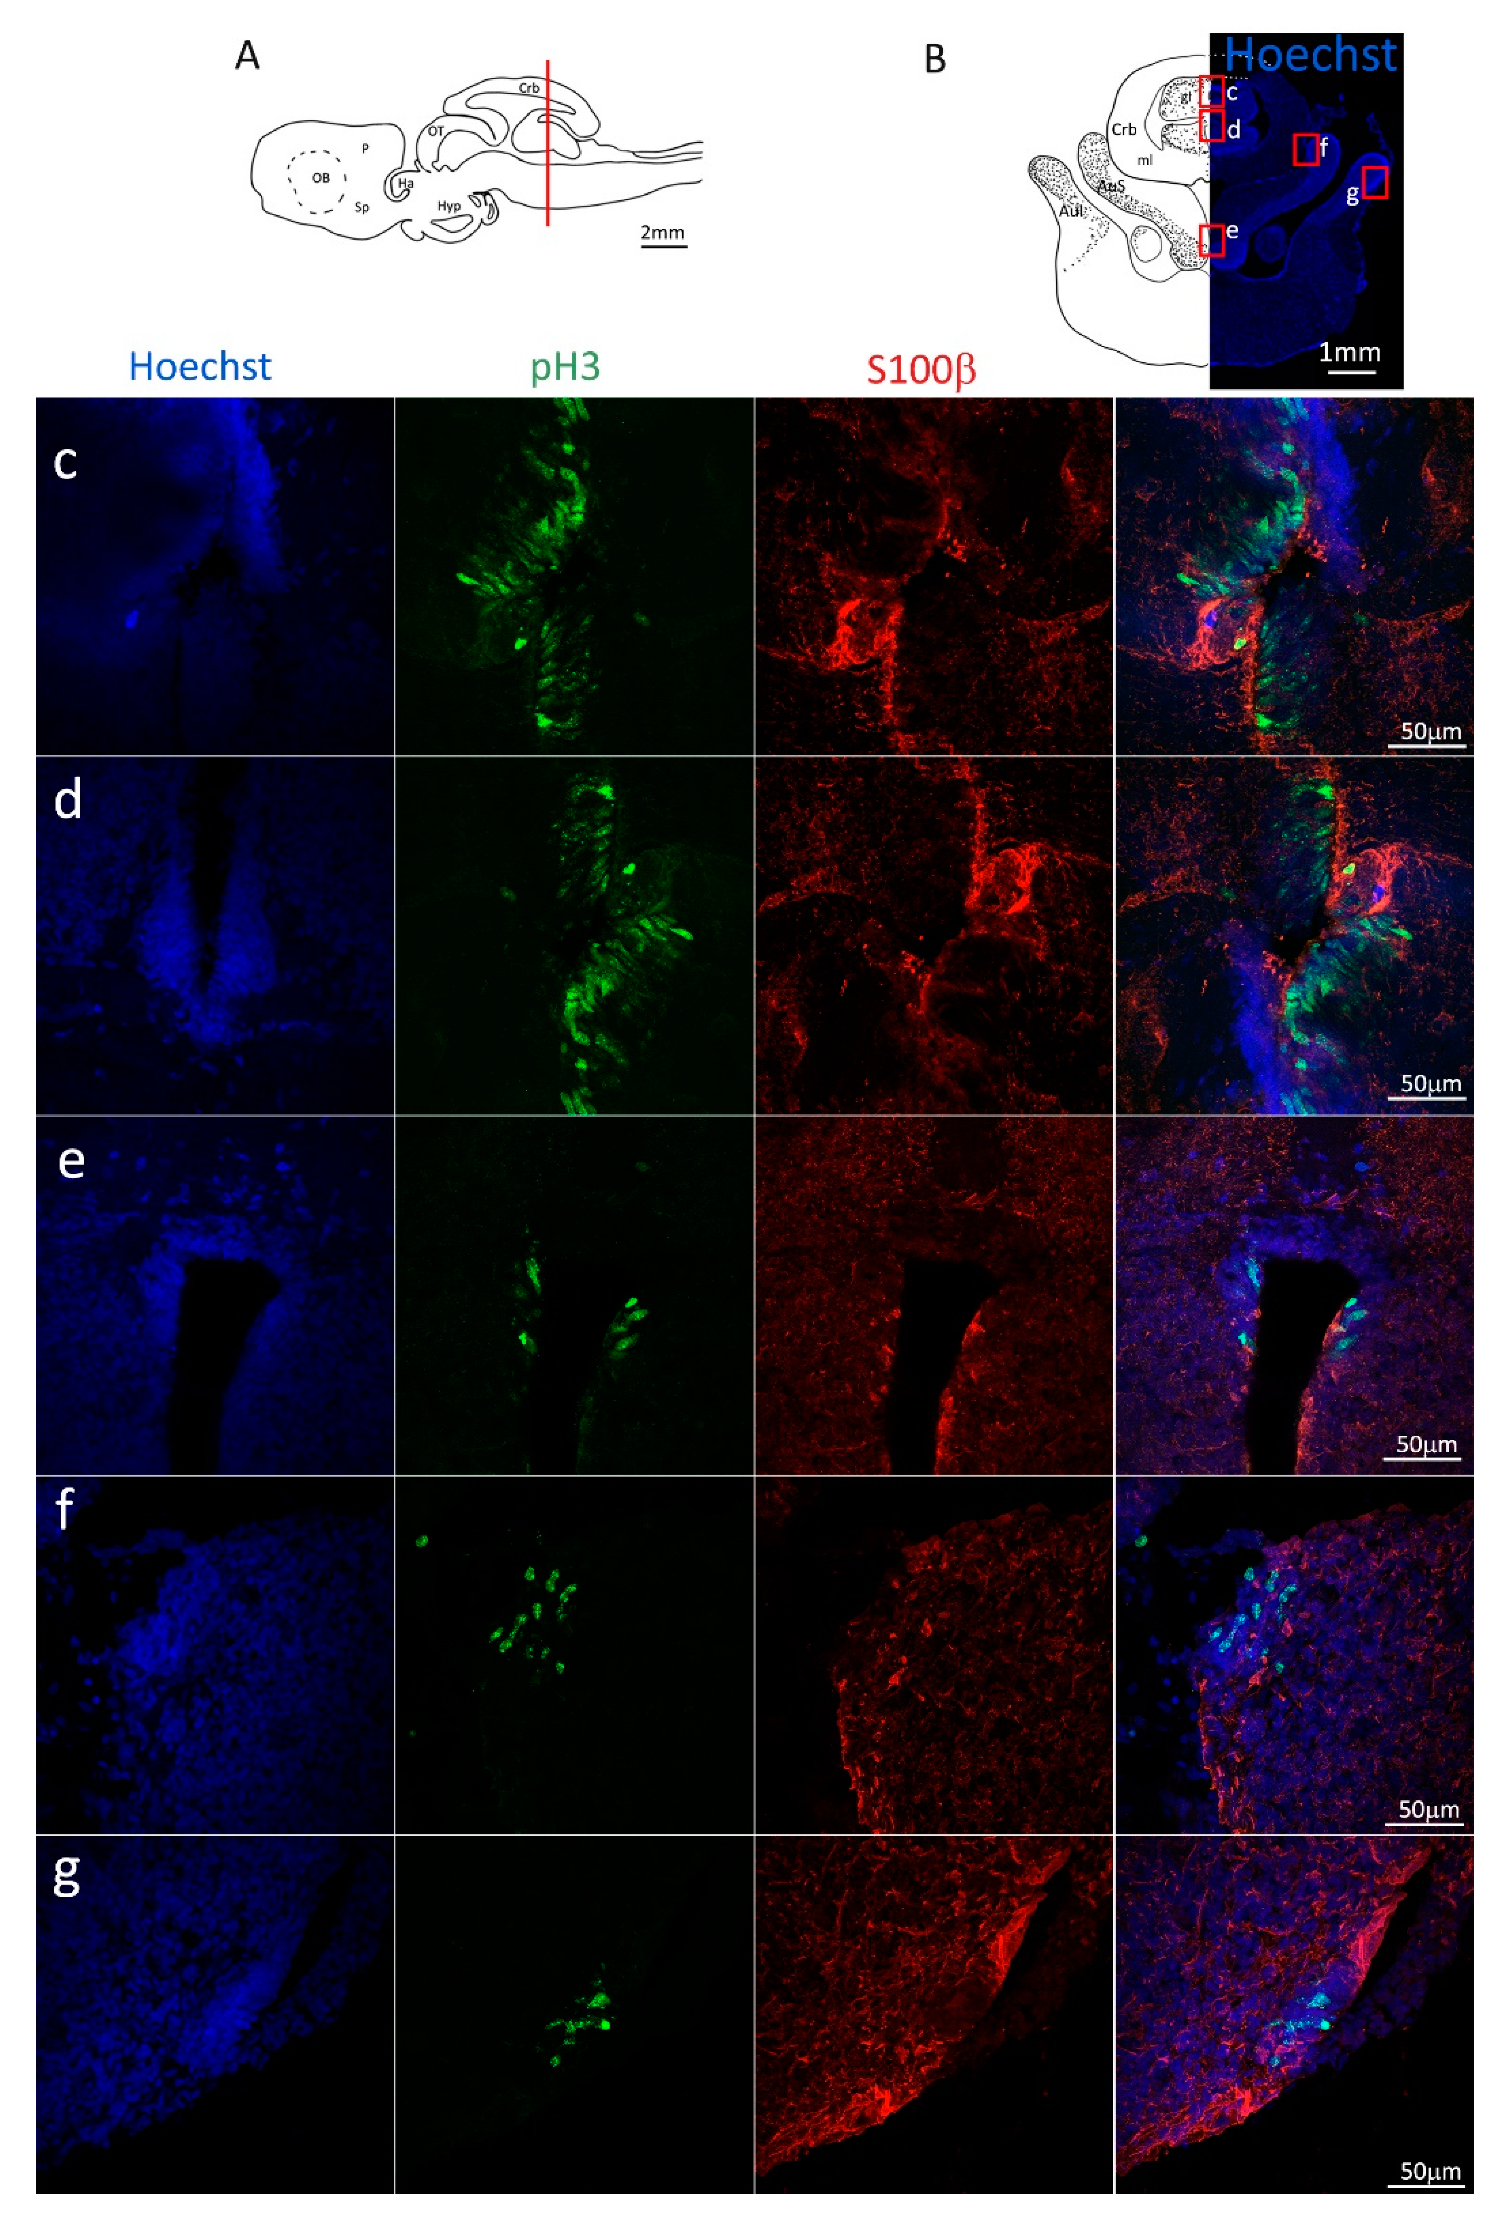
Localization of S100β (red) and pH3 (green) positive cells in the anterior telencephalon of S. canicula. (A) Sagittal representation of S. canicula brain. The red line indicates the rostro-caudal localization of the section represented in the panel. (B) Coronal map of the anterior telencephalon. On the right, a real coronal section is stained with Hoechst 33342 to show nuclei distribution; on the left, a cartoon is drawn to indicate anatomical references. Red rectangle identifies the general area from which images are taken. (C) Actively dividing cells (pH3+, green) in the anterior telencephalic neurogenic niche. (d) Magnification of the neurogenic niche localized in the dP. (e) Magnification of the neurogenic niche localized in the dP. (f) Magnification of the neurogenic niche localized in the mP. (g) Magnification of the neurogenic niche localized in the vP. Abbreviations: OB: olfactory bulb, P: pallium, Sp: subpallium, dP: dorsal pallium, mP: medial pallium, vP: ventral pallium, ChP: choroid plexus.
Figure 3.
Localization of S100β (red) and pH3 (green) positive cells in the anterior telencephalon of S. canicula. (A) Sagittal representation of S. canicula brain. The red line indicates the rostro-caudal localization of the section represented in the panel. (B) Coronal map of the anterior telencephalon. On the right, a real coronal section is stained with Hoechst 33342 to show nuclei distribution; on the left, a cartoon is drawn to indicate anatomical references. Red rectangle identifies the general area from which images are taken. (C) Actively dividing cells (pH3+, green) in the anterior telencephalic neurogenic niche. (d) Magnification of the neurogenic niche localized in the dP. (e) Magnification of the neurogenic niche localized in the dP. (f) Magnification of the neurogenic niche localized in the mP. (g) Magnification of the neurogenic niche localized in the vP. Abbreviations: OB: olfactory bulb, P: pallium, Sp: subpallium, dP: dorsal pallium, mP: medial pallium, vP: ventral pallium, ChP: choroid plexus.
![Ijms 24 03650 g003]()
Figure 4.
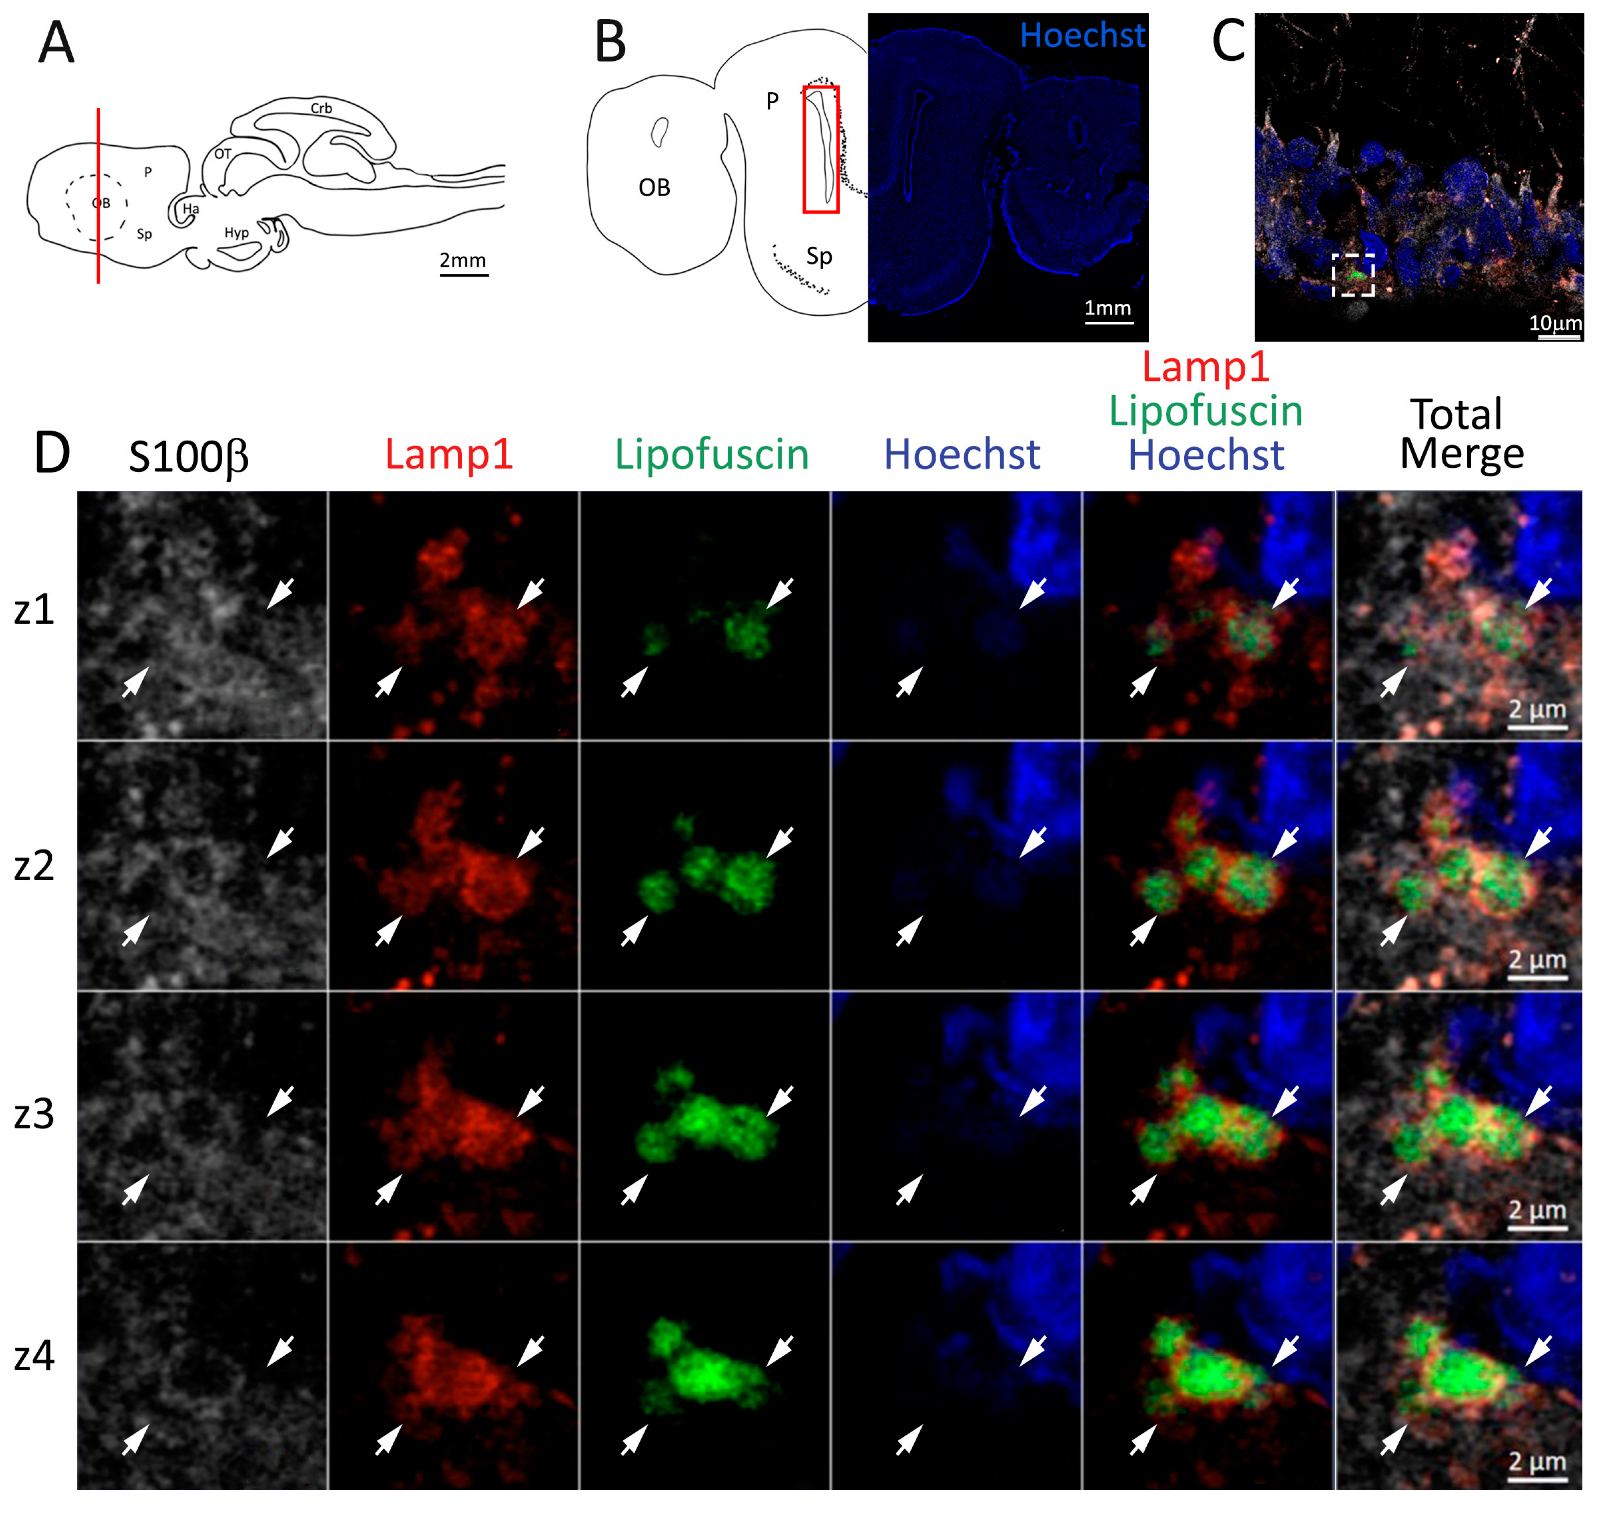
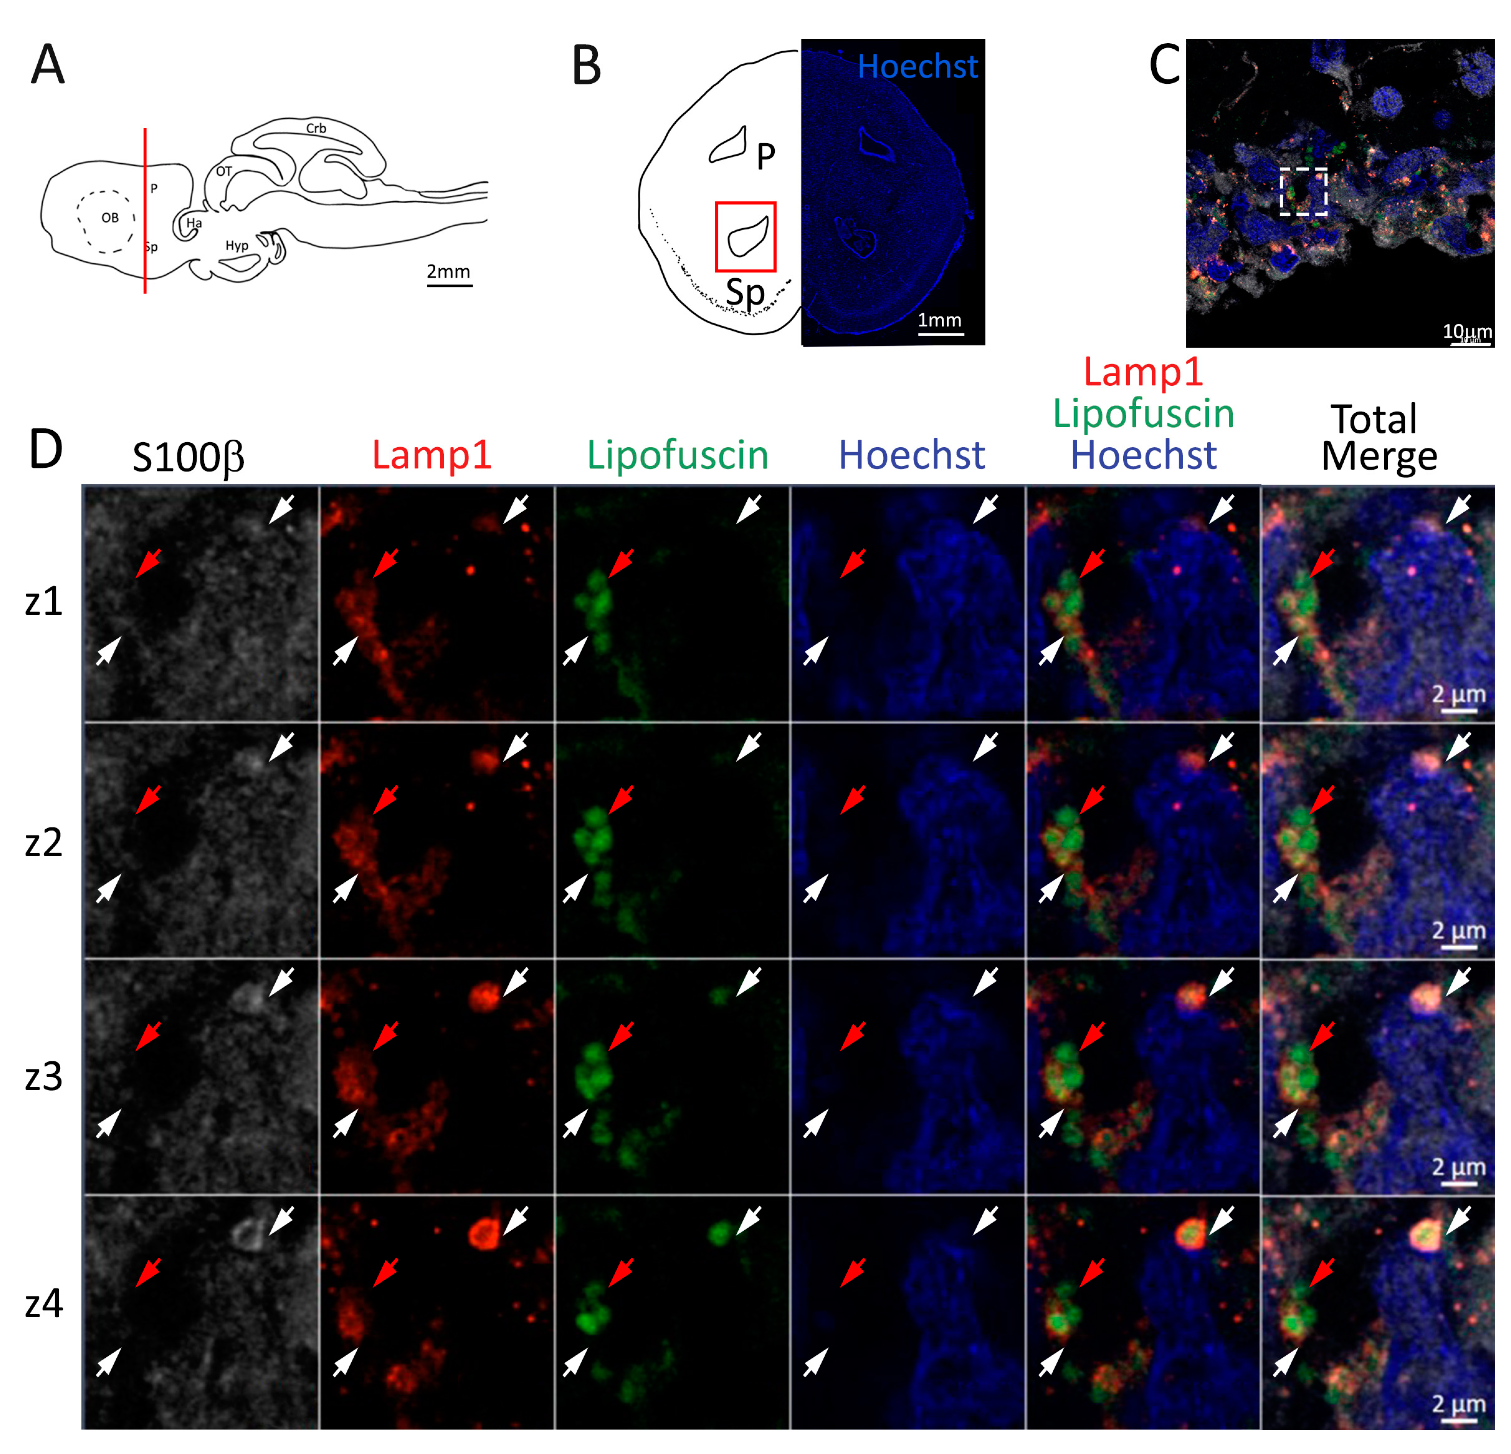
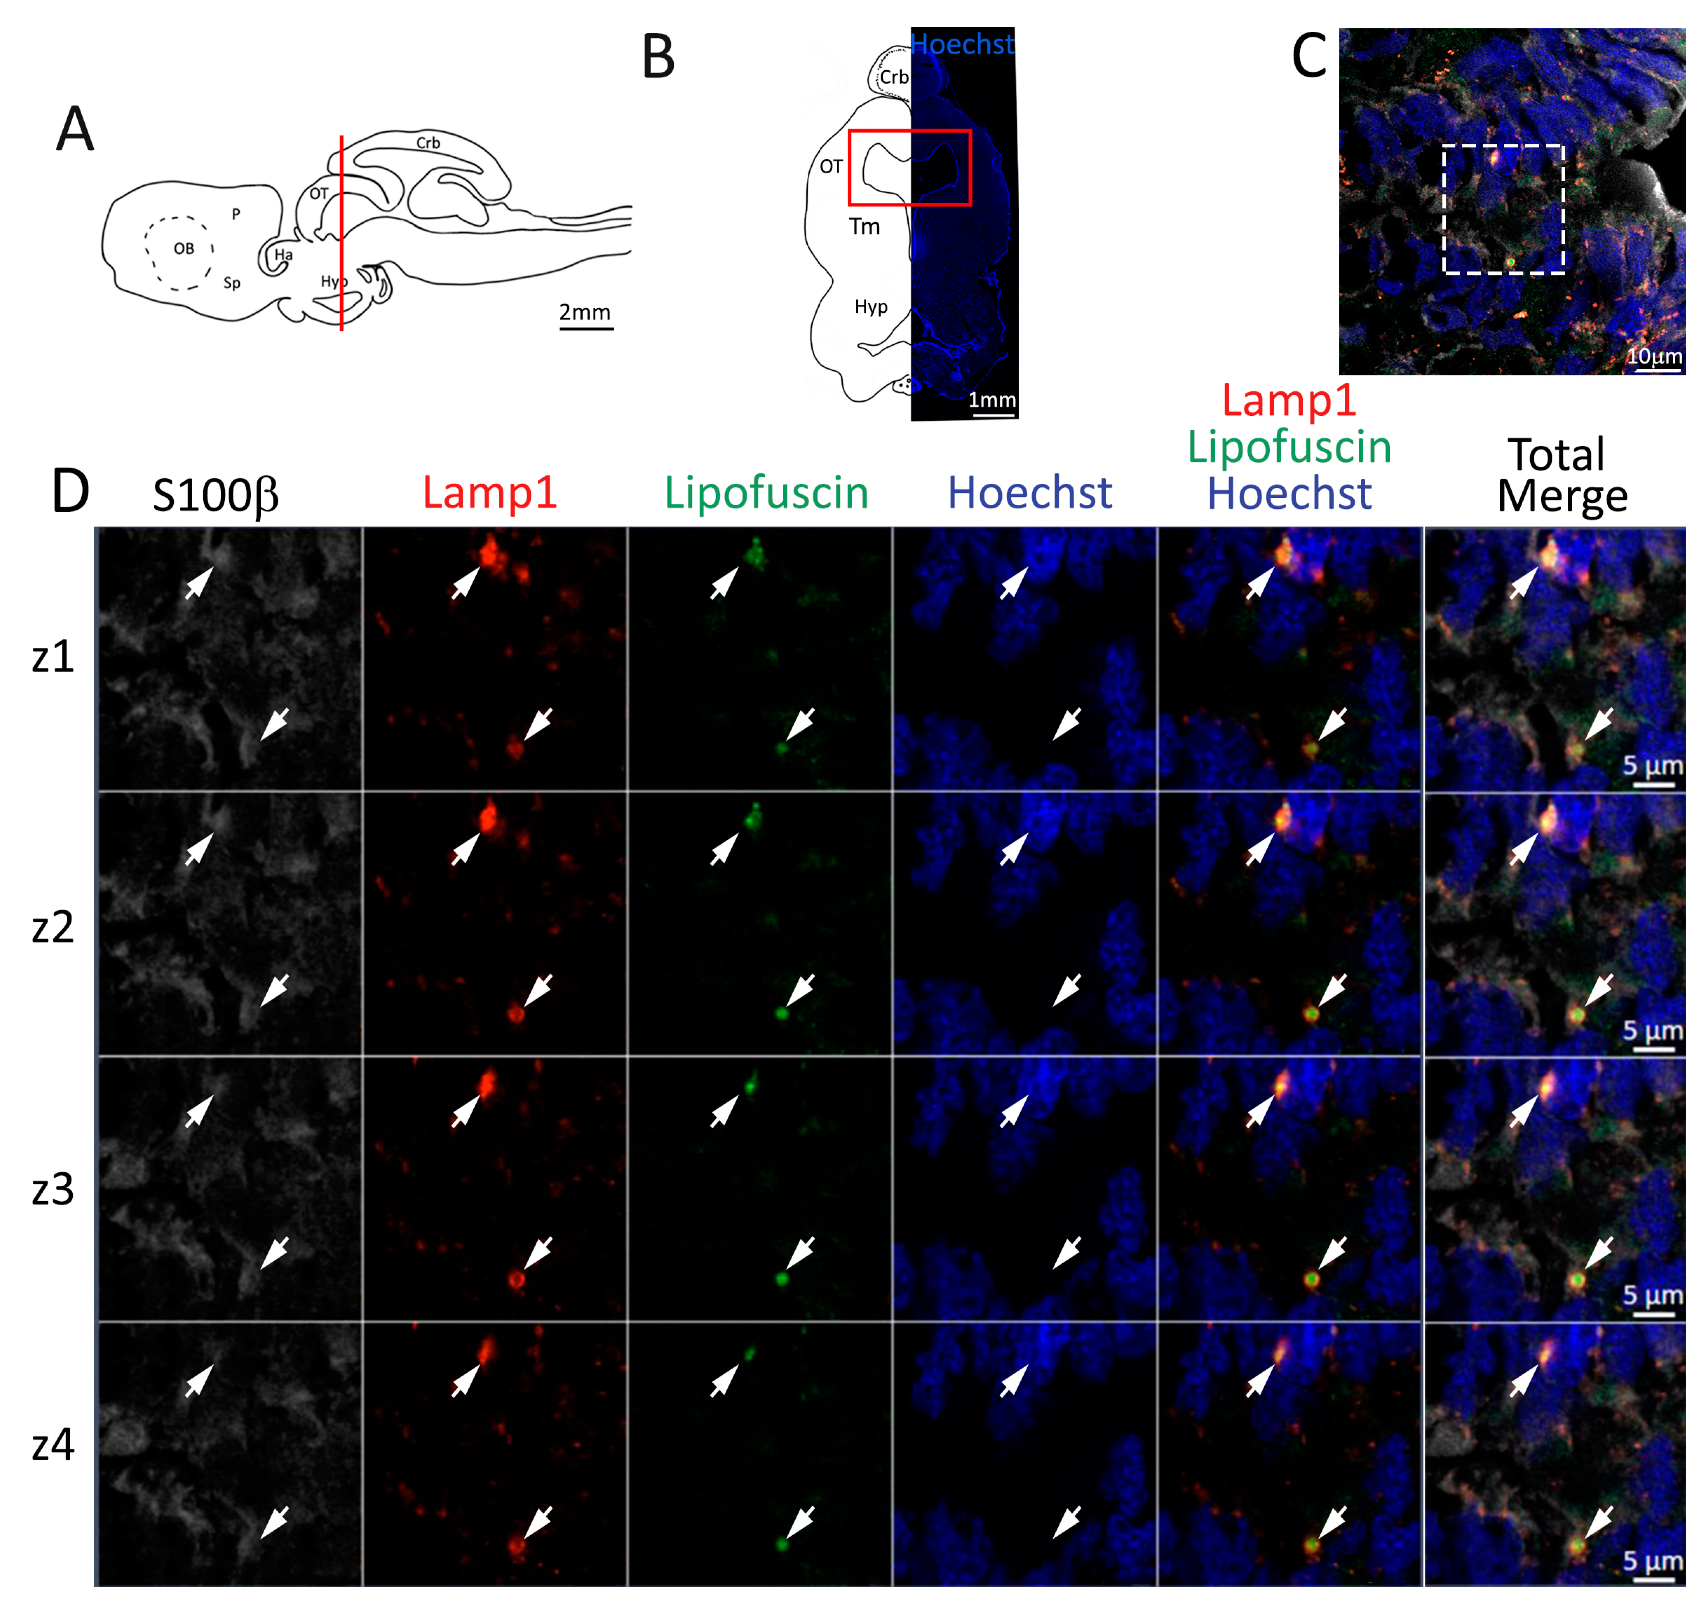
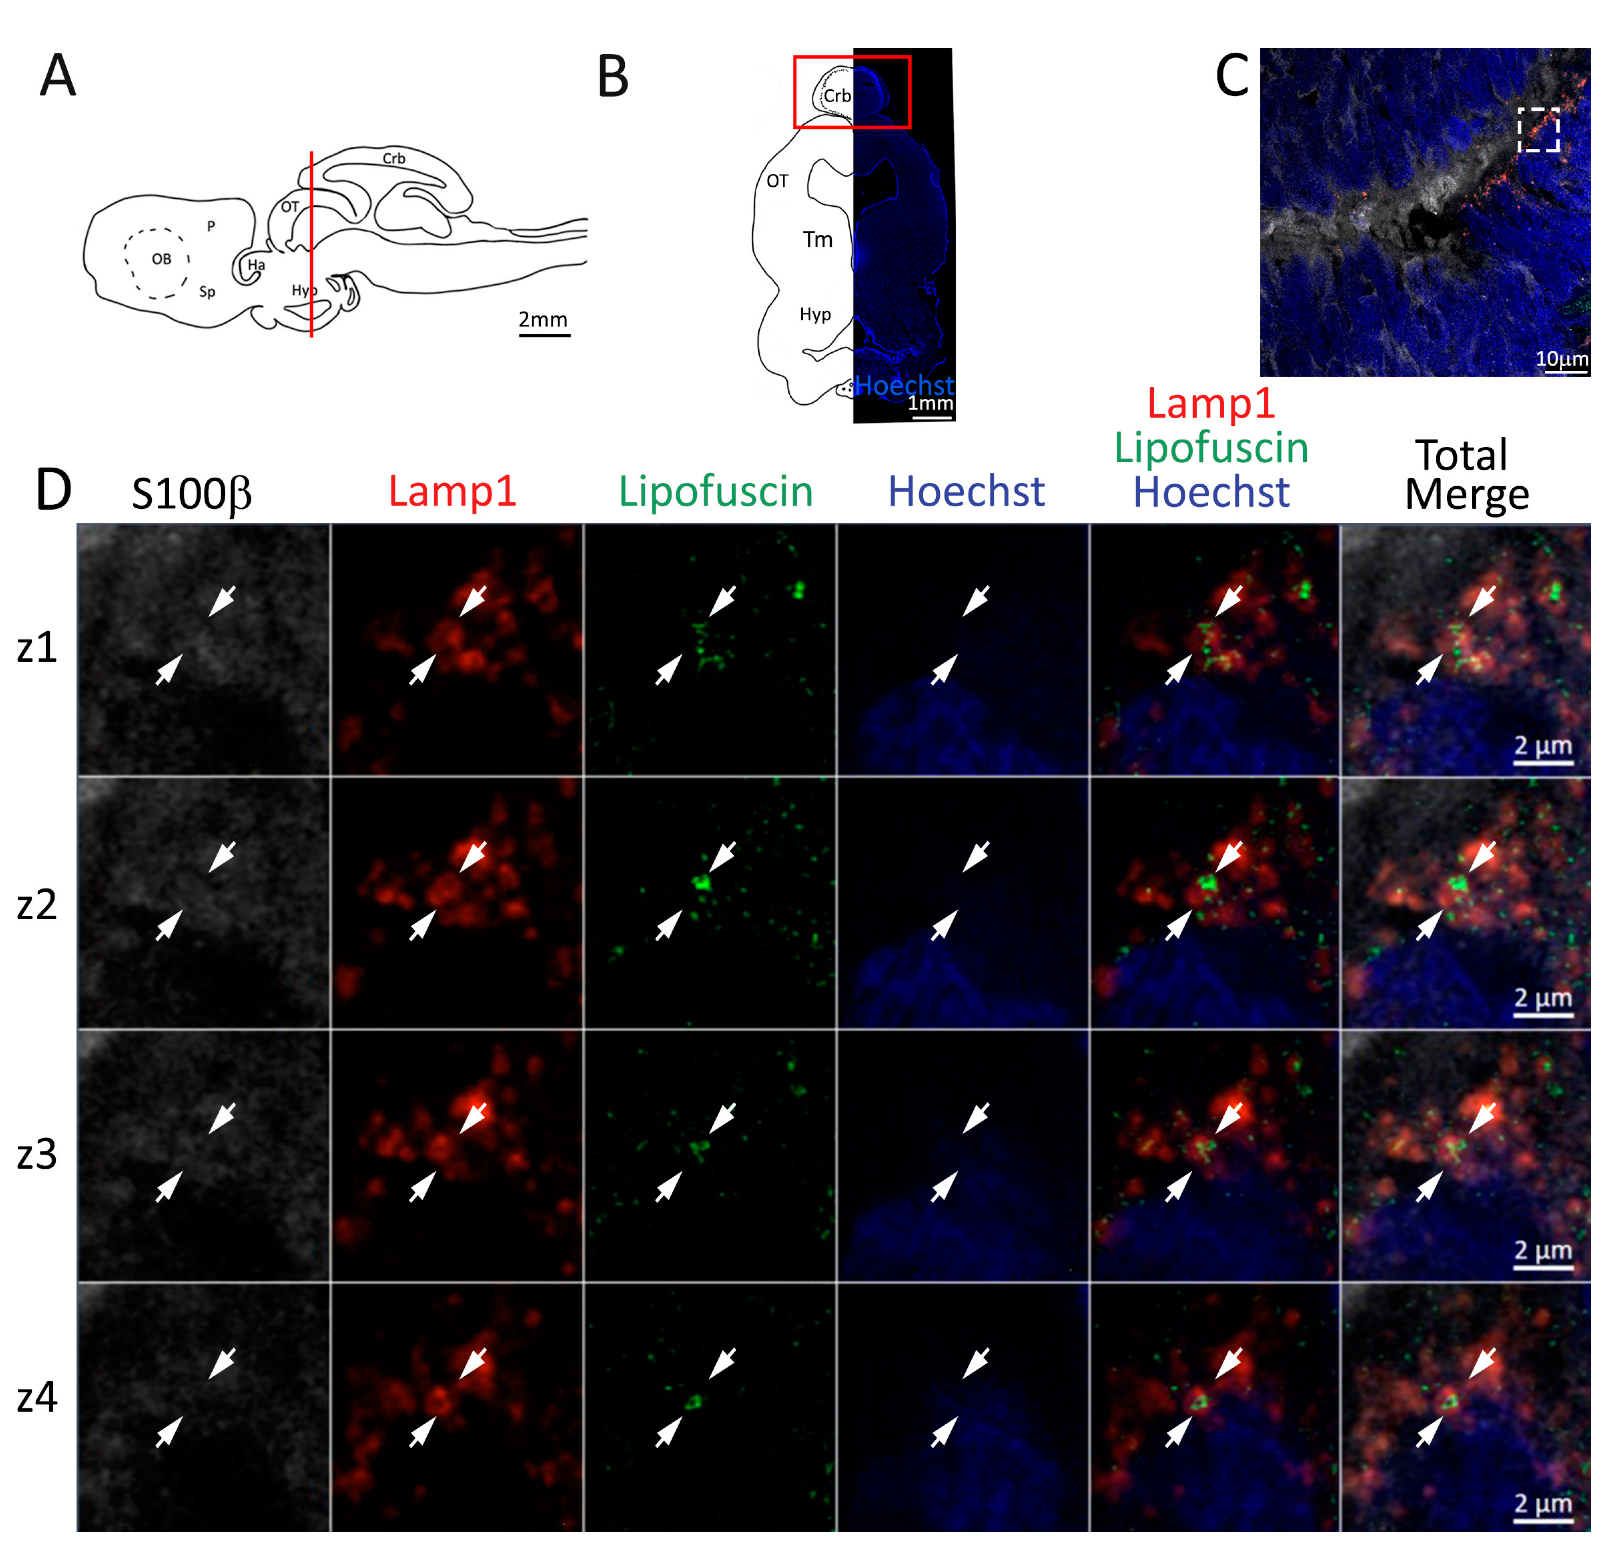
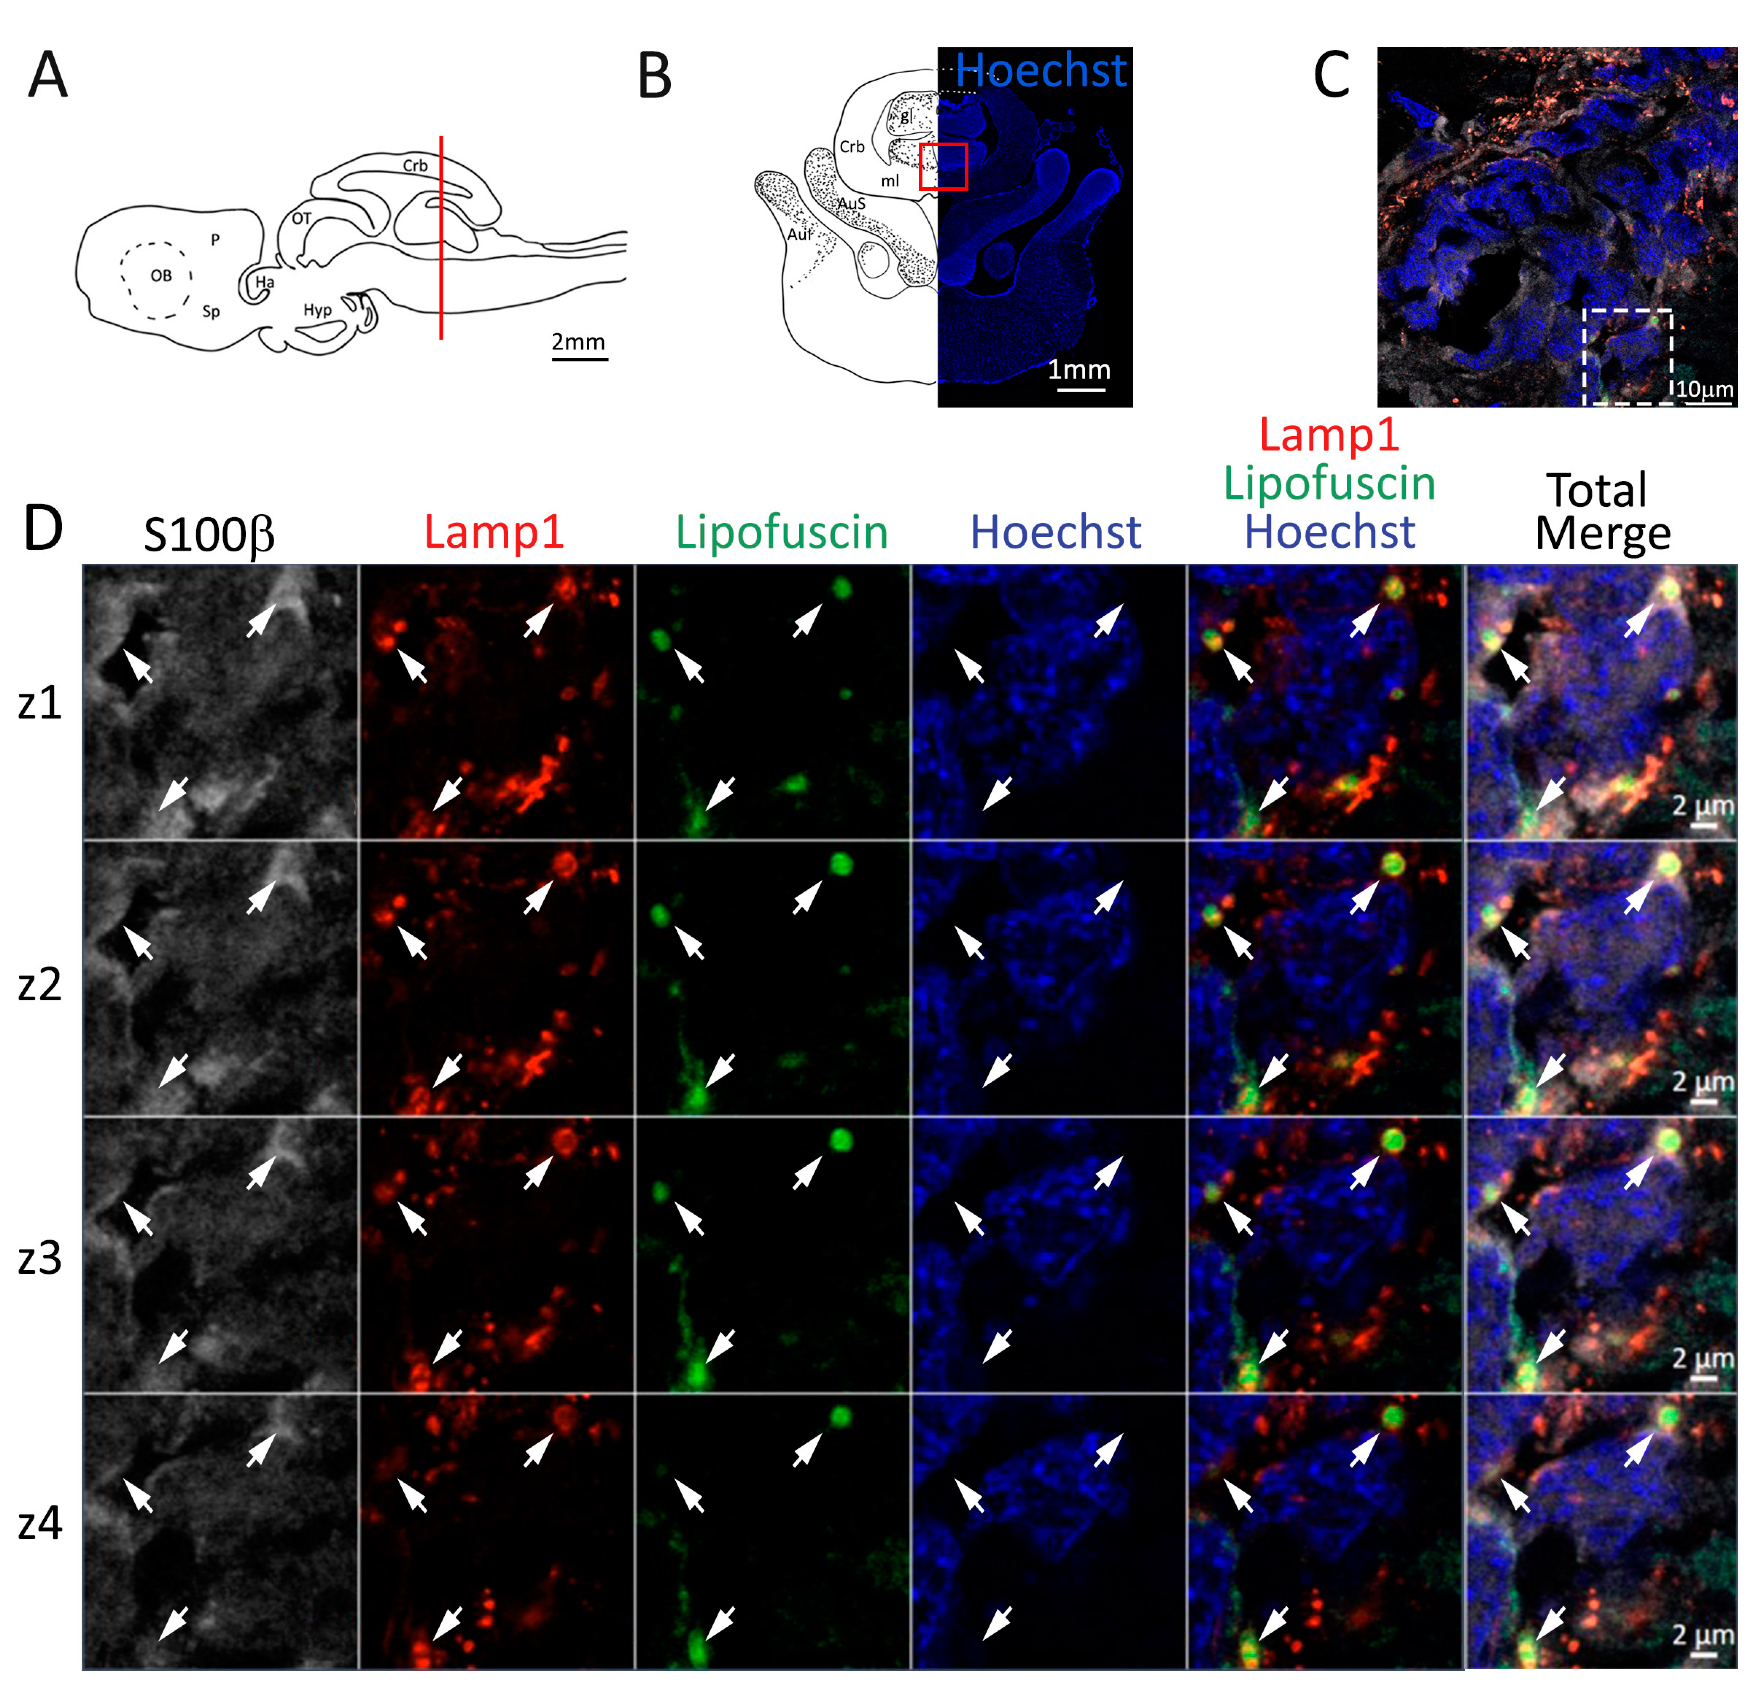
Presence of lipofuscin aggregates inside lysosomes in the anterior telencephalon of S. canicula. (A) Sagittal representation of S. canicula brain. The red line indicates the rostro-caudal localization of the section represented in the panel. (B) Coronal map of the anterior telencephalon. On the right, a real coronal section is stained with Hoechst 33342 to show nuclei distribution; on the left, a cartoon is drawn to indicate anatomical references. Red rectangle identifies the general area from which images are taken. (C) Area of the neurogenic niche where magnifications are taken from. (D) Lysosomes (Lamp1, red) containing lipofuscin (green) localized in radial glial cells (S100β+, white) and are localized around the nucleus (Hoechst, blue). In the panel, four consecutive z planes are represented (z1–z4) to render the three-dimensionality of the inclusion. Each plane is acquired at1 μm step in the z-axis from the previous. Last column represents the overlay of all four channels. White arrows indicate the localization of lysosomes containing lipofuscin. Abbreviations: OB: olfactory bulb, P: pallium, Sp: subpallium.
Figure 4.
Presence of lipofuscin aggregates inside lysosomes in the anterior telencephalon of S. canicula. (A) Sagittal representation of S. canicula brain. The red line indicates the rostro-caudal localization of the section represented in the panel. (B) Coronal map of the anterior telencephalon. On the right, a real coronal section is stained with Hoechst 33342 to show nuclei distribution; on the left, a cartoon is drawn to indicate anatomical references. Red rectangle identifies the general area from which images are taken. (C) Area of the neurogenic niche where magnifications are taken from. (D) Lysosomes (Lamp1, red) containing lipofuscin (green) localized in radial glial cells (S100β+, white) and are localized around the nucleus (Hoechst, blue). In the panel, four consecutive z planes are represented (z1–z4) to render the three-dimensionality of the inclusion. Each plane is acquired at1 μm step in the z-axis from the previous. Last column represents the overlay of all four channels. White arrows indicate the localization of lysosomes containing lipofuscin. Abbreviations: OB: olfactory bulb, P: pallium, Sp: subpallium.
![Ijms 24 03650 g004]()
Figure 5.
Localization of PCNA (red) and S100β (green) positive cells in the posterior telencephalon of S. canicula. (A) Sagittal representation of S. canicula brain. The red line indicates the rostro-caudal localization of the section represented in the panel. (B) Coronal map of the posterior telencephalon. On the right, a real coronal tissue section is stained with Hoechst 33342 to show nuclei distribution; on the left, a cartoon is drawn to indicate anatomical references. Red rectangles identify the general area from which images are taken. (C) Dorsal ventricle of the posterior telencephalon. This part of the ventricle is formed by dP, mP, and lP regions of the brain. Radial glial cells (S100β+, green) are tightly packed around the ventricle. (d) Magnification of the neurogenic niche localized in the dP. White arrowheads indicate PCNA+/S100β− cells. (e) Magnification of the neurogenic niche localized in the dorsolateral pallium. (f) Magnification of the neurogenic niche localized in the mP. White arrowheads indicate PCNA+/S100β− cells. (g) Magnification of the neurogenic niche localized in the mP. White arrowheads indicate PCNA+/S100β− cells. (H) Ventral ventricle of the posterior telencephalon. This part of the ventricle is formed by vP and Sp regions of the brain. (i,j) Magnification of the neurogenic niche localized in the vP. White arrowheads indicate PCNA+/S100β− cells. (k,l) Magnification of the neurogenic niche localized in the Sp. White arrowheads indicate PCNA+/S100β− cells. Abbreviations: P: pallium, Sp: subpallium, dP: dorsal pallium, mP: medial pallium, lP: lateral pallium, vP: ventral pallium, ChP: choroid plexus.
![Ijms 24 03650 g005]()
Figure 6.
Localization of PCNA (red) and Msi1 (green) positive cells in the posterior telencephalon of S. canicula. (A) Sagittal representation of S. canicula brain. The red line indicates the rostro-caudal localization of the section represented in the panel. (B) Coronal map of the posterior telencephalon. On the right, a real coronal section is stained with Hoechst 33342 to show nuclei distribution; on the left, a cartoon is drawn to indicate anatomical references. Red rectangle identifies the general area from which images are taken. (C) Dorsal ventricle of the posterior telencephalon. This part of the ventricle is formed by dP, mP, and lP regions of the brain. Progenitor cells (Msi1+, green) are localized around the ventricular wall. (d) Magnification of the neurogenic niche localized in the dP. White arrowheads indicate PCNA+/Msi1− cells. (e–g) Magnification of the neurogenic niche localized in the mP. White arrowheads indicate PCNA+/S100β− cells. (H) Ventral ventricle of the posterior telencephalon. This part of the ventricle is formed by vP and Sp regions of the brain. (i,j) Magnification of the neurogenic niche localized in the vP. White arrowheads indicate PCNA+/Msi1− cells. (k,l) Magnification of the neurogenic niche localized in the Sp. White arrowheads indicate PCNA+/S100β− cells. Abbreviations: P: pallium, Sp: subpallium, dP: dorsal pallium, mP: medial pallium, lP: lateral pallium, vP: ventral pallium, ChP: choroid plexus.
![Ijms 24 03650 g006]()
Figure 7.
Localization of S100β (red) and pH3 (green) positive cells in the posterior telencephalon of S. canicula. (A) Sagittal representation of S. canicula brain. The red line indicates the rostro-caudal localization of the section represented in the panel. (B) Coronal map of the posterior telencephalon. On the right, a real coronal section is stained with Hoechst 33342 to show nuclei distribution; on the left, a cartoon is drawn to indicate anatomical references. Red rectangle identifies the general area from which images are taken. (C) Actively dividing cells (pH3+, green) in the posterior telencephalic neurogenic niche localize in the neurogenic niche (S100β+, red). (d) Magnification of the neurogenic niche localized in the dP. (e) Magnification of the neurogenic niche localized in the dP. (f) Magnification of the neurogenic niche localized in the mP. (g) Magnification of the neurogenic niche localized in the Sp. Abbreviations: OB: olfactory bulb, P: pallium, Sp: subpallium, dP: dorsal pallium, mP: medial pallium, vP: ventral pallium, ChP: choroid plexus.
![Ijms 24 03650 g007]()
Figure 8.
Presence of lipofuscin aggregates inside lysosomes in the posterior telencephalon of S. canicula. (A) Sagittal representation of S. canicula brain. The red line indicates the rostro-caudal localization of the section represented in the panel. (B) Coronal map of the posterior telencephalon. On the right, a real coronal section is stained with Hoechst 33342 to show nuclei distribution; on the left, a cartoon is drawn to indicate anatomical references. Red rectangle identifies the general area from which images are taken. (C) Area of the neurogenic niche where magnifications are taken from. (D) Lysosomes (Lamp1, red) containing lipofuscin (green) localized in radial glial cells (S100β+, white) and are localized around the nucleus (Hoechst, blue). In the panel, four consecutive z planes are represented (z1–z4) to render the three-dimensionality of the inclusion. Each plane is acquired at 1 μm step in the z-axis from the previous. Last column represents the overlay of all four channels. White arrows indicate the localization of lysosomes containing lipofuscin, red arrows indicate lipofuscin granules not included into lysosomes. Abbreviations: P: pallium, Sp: subpallium.
![Ijms 24 03650 g008]()
Figure 9.
Localization of PCNA (red) and S100β (green) positive cells in the mesencephalon of S. canicula. (A) Sagittal representation of S. canicula brain. The red line indicates the rostro-caudal localization of the section represented in the panel. (B) Coronal map of the area imaged. On the right, a real coronal section is stained with Hoechst 33342 to show nuclei distribution; on the left, a cartoon is drawn to indicate anatomical references. Red rectangle identifies the general area from which images are taken. (C) Mesencephalic neurogenic niche. Radial glial cell bodies (S100β+, green) are localized around the ventricular wall and their processes spread into the surrounding tissue. Some S100β+ cells are also PCNA+ (red), indicating the proliferative state of the stem cells. (d,e) Magnification of the neurogenic niche localized in the tectal region. (f,g) Magnification of the neurogenic niche localized in the tegmental area. (h–k) In situ hybridization for S. canicula pcna in tectal and tegmental areas of the mesencephalic neurogenic niche. Abbreviations: Crb: cerebellum, OT: optic tectum, Tm: tegmentum, Hyp: hypothalamus.
![Ijms 24 03650 g009]()
Figure 10.
Localization of PCNA (red) and Msi1 (green) positive cells in the mesencephalon of S. canicula. (A) Sagittal representation of S. canicula brain. The red line indicates the rostro-caudal localization of the section represented in the panel. (B) Coronal map of the area imaged. On the right, a real coronal section is stained with Hoechst 33342 to show nuclei distribution; on the left, a cartoon is drawn to indicate anatomical references. Red rectangle identifies the general area from which images are taken. (C) Mesencephalic neurogenic niche. Progenitor cells (Msi1+, green) are localized around the ventricular wall. (d,e) Magnification of the neurogenic niche localized in the tectal region. (f,g) Magnification of the neurogenic niche localized in the tegmental area. Abbreviations: Crb: cerebellum, OT: optic tectum, Tm: tegmentum, Hyp: hypothalamus.
Figure 11.
Localization of pH3 (green) and S100β (red) positive cells in the mesencephalon of S. canicula. (A) Sagittal representation of S. canicula brain. The red line indicates the rostro-caudal localization of the section represented in the panel. (B) Coronal map of the area imaged. On the right, a real coronal section is stained with Hoechst 33342 to show nuclei distribution; on the left, a cartoon is drawn to indicate anatomical references. Red rectangle identifies the general area from which images are taken. (C) Mesencephalic neurogenic niche. (d,e) Magnification of the neurogenic niche localized in the tectal region. (f,g) Magnification of the neurogenic niche localized in the tegmental area. Abbreviations: Crb: cerebellum, OT: optic tectum, Tm: tegmentum, Hyp: hypothalamus.
Figure 12.
Presence of lipofuscin aggregates inside lysosomes in the mesencephalon of S. canicula. (A) Sagittal representation of S. canicula brain. The red line indicates the rostro-caudal localization of the section represented in the panel. (B) Coronal map of the area imaged. On the right, a real coronal section is stained with Hoechst 33342 to show nuclei distribution; on the left, a cartoon is drawn to indicate anatomical references. Red rectangle identifies the general area from which images are taken. (C) Area of the neurogenic niche where magnifications are taken from. (D) Lysosomes (Lamp1, red) containing lipofuscin (green) localized in radial glial cells (S100β+, white) and are localized around the nucleus (Hoechst, blue). In the panel, four consecutive z planes are represented (z1–z4) to render the three-dimensionality of the inclusion. Each plane is acquired at 1 μm step in the z-axis from the previous. Last column represents the overlay of all four channels. White arrows indicate the localization of lysosomes containing lipofuscin. Abbreviations: Crb: cerebellum, OT: optic tectum, Tm: tegmentum, Hyp: hypothalamus.
![Ijms 24 03650 g012]()
Figure 13.
Localization of PCNA (red) and S100β (green) positive cells in the anterior cerebellum of S. canicula. (A) Sagittal representation of S. canicula brain. The red line indicates the rostro-caudal localization of the section represented in the panel. (B) Coronal map of the area imaged. On the right, a real coronal section is stained with Hoechst 33342 to show nuclei distribution; on the left, a cartoon is drawn to indicate anatomical references. Red rectangle identifies the general area from which images are taken. (C) Neurogenic niches of the anterior cerebellum. All PCNA+ cells (red) appear to be S100β−, suggesting a neuroepithelial origin of the stem cells. (d) Magnification of the neurogenic niche localized in the dorsal cerebellum. (e) Magnification of the neurogenic niche localized in the ventral cerebellum. (f,g) In situ hybridization for S. canicula pcna in dorsal and ventral cerebellar neurogenic niches. Abbreviations: Crb: cerebellum, OT: optic tectum, Tm: tegmentum, Hyp: hypothalamus.
![Ijms 24 03650 g013]()
Figure 14.
Localization of PCNA (red) and Msi1 (green) positive cells in the anterior cerebellum of S. canicula. (A) Sagittal representation of S. canicula brain. The red line indicates the rostro-caudal localization of the section represented in the panel. (B) Coronal map of the area imaged. On the right, a real coronal section is stained with Hoechst 33342 to show nuclei distribution; on the left, a cartoon is drawn to indicate anatomical references. Red rectangle identifies the general area from which images are taken. (C) Neurogenic niches of the anterior cerebellum. All PCNA+ cells (red) appear to be Msi1+, confirming their stem-cell nature. (d) Magnification of the neurogenic niche localized in the dorsal cerebellum. (e) Magnification of the neurogenic niche localized in the ventral cerebellum. Abbreviations: Crb: cerebellum, OT: optic tectum, Tm: tegmentum, Hyp: hypothalamus.
Figure 15.
Localization of pH3 (green) and S100β (red) positive cells in the mesencephalon of S. canicula. (A) Sagittal representation of S. canicula brain. The red line indicates the rostro-caudal localization of the section represented in the panel. (B) Coronal map of the area imaged. On the right, a real coronal section is stained with Hoechst 33342 to show nuclei distribution; on the left, a cartoon is drawn to indicate anatomical references. Red rectangle identifies the general area from which images are taken. (C) Neurogenic niches of the anterior cerebellum. All pH3+ cells (red) appear to be S100β−. (d) Magnification of the neurogenic niche localized in the dorsal cerebellum. (e) Magnification of the neurogenic niche localized in the ventral cerebellum. Abbreviations: Crb: cerebellum, OT: optic tectum, Tm: tegmentum, Hyp: hypothalamus.
Figure 16.
Presence of lipofuscin aggregates inside lysosomes in the anterior cerebellum of S. canicula. (A) Sagittal representation of S. canicula brain. The red line indicates the rostro-caudal localization of the section represented in the panel. (B) Coronal map of the area imaged. On the right, a real coronal section is stained with Hoechst 33342 to show nuclei distribution; on the left, a cartoon is drawn to indicate anatomical references. Red rectangle identifies the general area from which images are taken. (C) Area of the neurogenic niche where magnifications are taken from. (D) Lysosomes (Lamp1, red) containing lipofuscin aggregates (green). In the panel, four consecutive z planes are represented (z1–z4) to render the three-dimensionality of the inclusion. Each plane is acquired at 1 μm step in the z-axis from the previous. Last column represents the overlay of all four channels. White arrows indicate the localization of lysosomes containing lipofuscin. Abbreviations: Crb: cerebellum, OT: optic tectum, Tm: tegmentum, Hyp: hypothalamus.
![Ijms 24 03650 g016]()
Figure 17.
Localization of PCNA (red) and S100β (green) positive cells in the cerebellum of S. canicula. (A) Sagittal representation of S. canicula brain. The red line indicates the rostro-caudal localization of the section represented in the panel. (B) Coronal map of the area imaged. On the right, a real coronal section is stained with Hoechst 33342 to show nuclei distribution; on the left, a cartoon is drawn to indicate anatomical references. Red rectangles identify the general area from which images are taken. (C) Neurogenic niche of the cerebellum and medial dorsal auricle. (d) Magnification of the neurogenic niche localized in the ventral cerebellum. (e) Magnification of the neurogenic niche localized in the medial superior cerebellar auricle. (F) Lateral neurogenic niches of the cerebellar auricles. (g) Lateral neurogenic niche of the superior auricle. (h) Neurogenic niche of the inferior auricle. (i–l) In situ hybridization for S. canicula pcna in the cerebellum and cerebellar auricles. Abbreviations: Crb: cerebellum, gl: granular layer, ml: molecular layer, AuS: superior cerebellar auricle, AuI: inferior cerebellar auricle.
![Ijms 24 03650 g017]()
Figure 18.
Localization of PCNA (red) and Msi1 (green) positive cells in the anterior cerebellum of S. canicula. (A) Sagittal representation of S. canicula brain. The red line indicates the rostro-caudal localization of the section represented in the panel. (B) Coronal map of the area imaged. On the right, a real coronal section is stained with Hoechst 33342 to show nuclei distribution; on the left, a cartoon is drawn to indicate anatomical references. Red rectangles identify the general area from which images are taken. (C) Neurogenic niche of the cerebellum and medial dorsal auricle. (d) Magnification of the neurogenic niche localized in the dorsal cerebellum. (e) Magnification of the neurogenic niche localized in the ventral cerebellum. (f) Magnification of the neurogenic niche localized in the medial superior cerebellar auricle. (G) Lateral neurogenic niches of the cerebellar auricles. (h) Lateral neurogenic niche of the superior auricle. (i) Neurogenic niche of the inferior auricle. Abbreviations: Crb: cerebellum, gl: granular layer, ml: molecular layer, AuS: superior cerebellar auricle, AuI: inferior cerebellar auricle.
![Ijms 24 03650 g018]()
Figure 19.
Localization of pH3 (green) and S100β (red) positive cells in the mesencephalon of S. canicula. (A) Sagittal representation of S. canicula brain. The red line indicates the rostro-caudal localization of the section represented in the panel. (B) Coronal map of the area imaged. On the right, a real coronal section is stained with Hoechst 33342 to show nuclei distribution; on the left, a cartoon is drawn to indicate anatomical references. Red rectangles identify the general area from which images are taken. (c) Magnification of the neurogenic niche localized in the dorsal cerebellum. (d) Magnification of the neurogenic niche localized in the ventral cerebellum. (e) Magnification of the neurogenic niche localized in the medial superior cerebellar auricle. (f) Lateral neurogenic niche of the superior auricle. (g) Neurogenic niche of the inferior auricle. Abbreviations: Crb: cerebellum, gl: granular layer, ml: molecular layer, AuS: superior cerebellar auricle, AuI: inferior cerebellar auricle.
![Ijms 24 03650 g019]()
Figure 20.
Presence of lipofuscin aggregates inside lysosomes in the cerebellum of S. canicula. (A) Sagittal representation of S. canicula brain. The red line indicates the rostro-caudal localization of the section represented in the panel. (B) Coronal map of the area imaged. On the right, a real coronal section is stained with Hoechst 33342 to show nuclei distribution; on the left, a cartoon is drawn to indicate anatomical references. Red rectangle identifies the general area from which images are taken. (C) Area of the neurogenic niche where magnifications are taken from. (D) Lysosomes (Lamp1, red) containing lipofuscin aggregates (green). In the panel, four consecutive z planes are represented (z1–z4) to render the three-dimensionality of the inclusion. Each plane is acquired at 1 μm step in the z-axis from the previous. Last column represents the overlay of all four channels. White arrows indicate the localization of lysosomes containing lipofuscin.
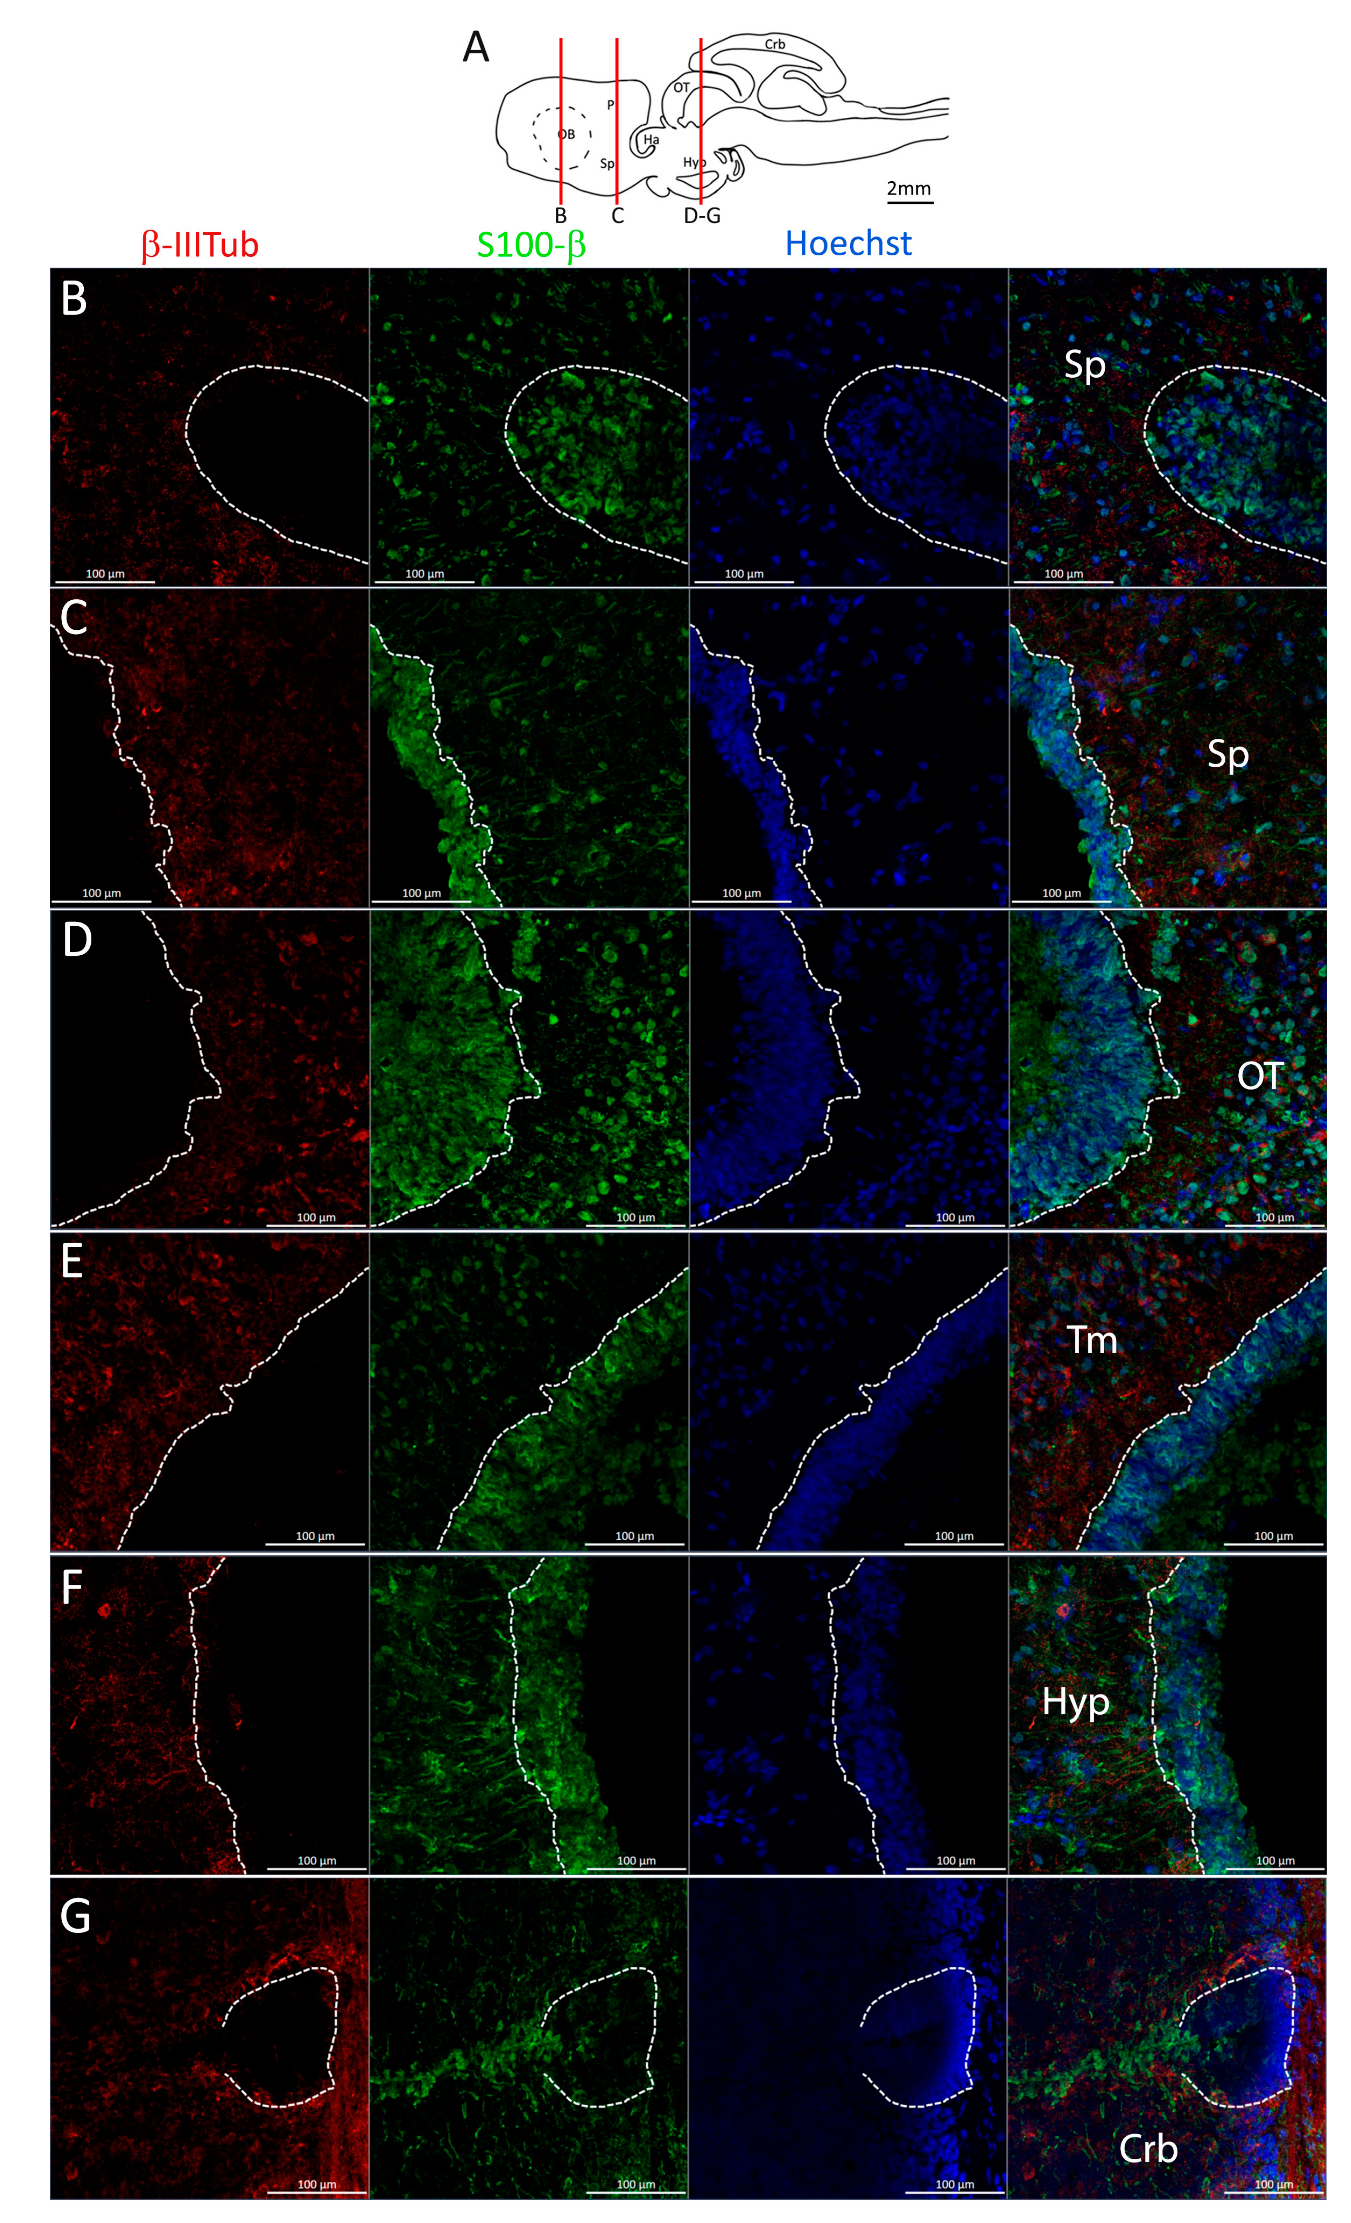
Figure 21.
Identification of newly differentiated neurons in Scyliorhinus canicula brain. (A) Sagittal representation of S. canicula brain. The red lines indicate the rostro-caudal localization of the sections from which magnifications are taken. (B) Magnification of the neurogenic niche localized in the ventral area of the anterior telencephalon. (C) Magnification of the neurogenic niche localized in the ventral area of the posterior telencephalon. (D) Magnification of the neurogenic niche localized in the optic tectum. (E) Magnification of the neurogenic niche localized in the tegmentum. (F) Magnification of the neurogenic niche localized in the hypothalamus. (G) Magnification of the neurogenic niche localized in the dorsal anterior cerebellum. In all panels, white dashed lines indicate the border of the neurogenic niche. Abbreviations: Sp: subpallium, OT: optic tectum, Tm: tegmentum, Hyp: hypothalamus, Crb: cerebellum.
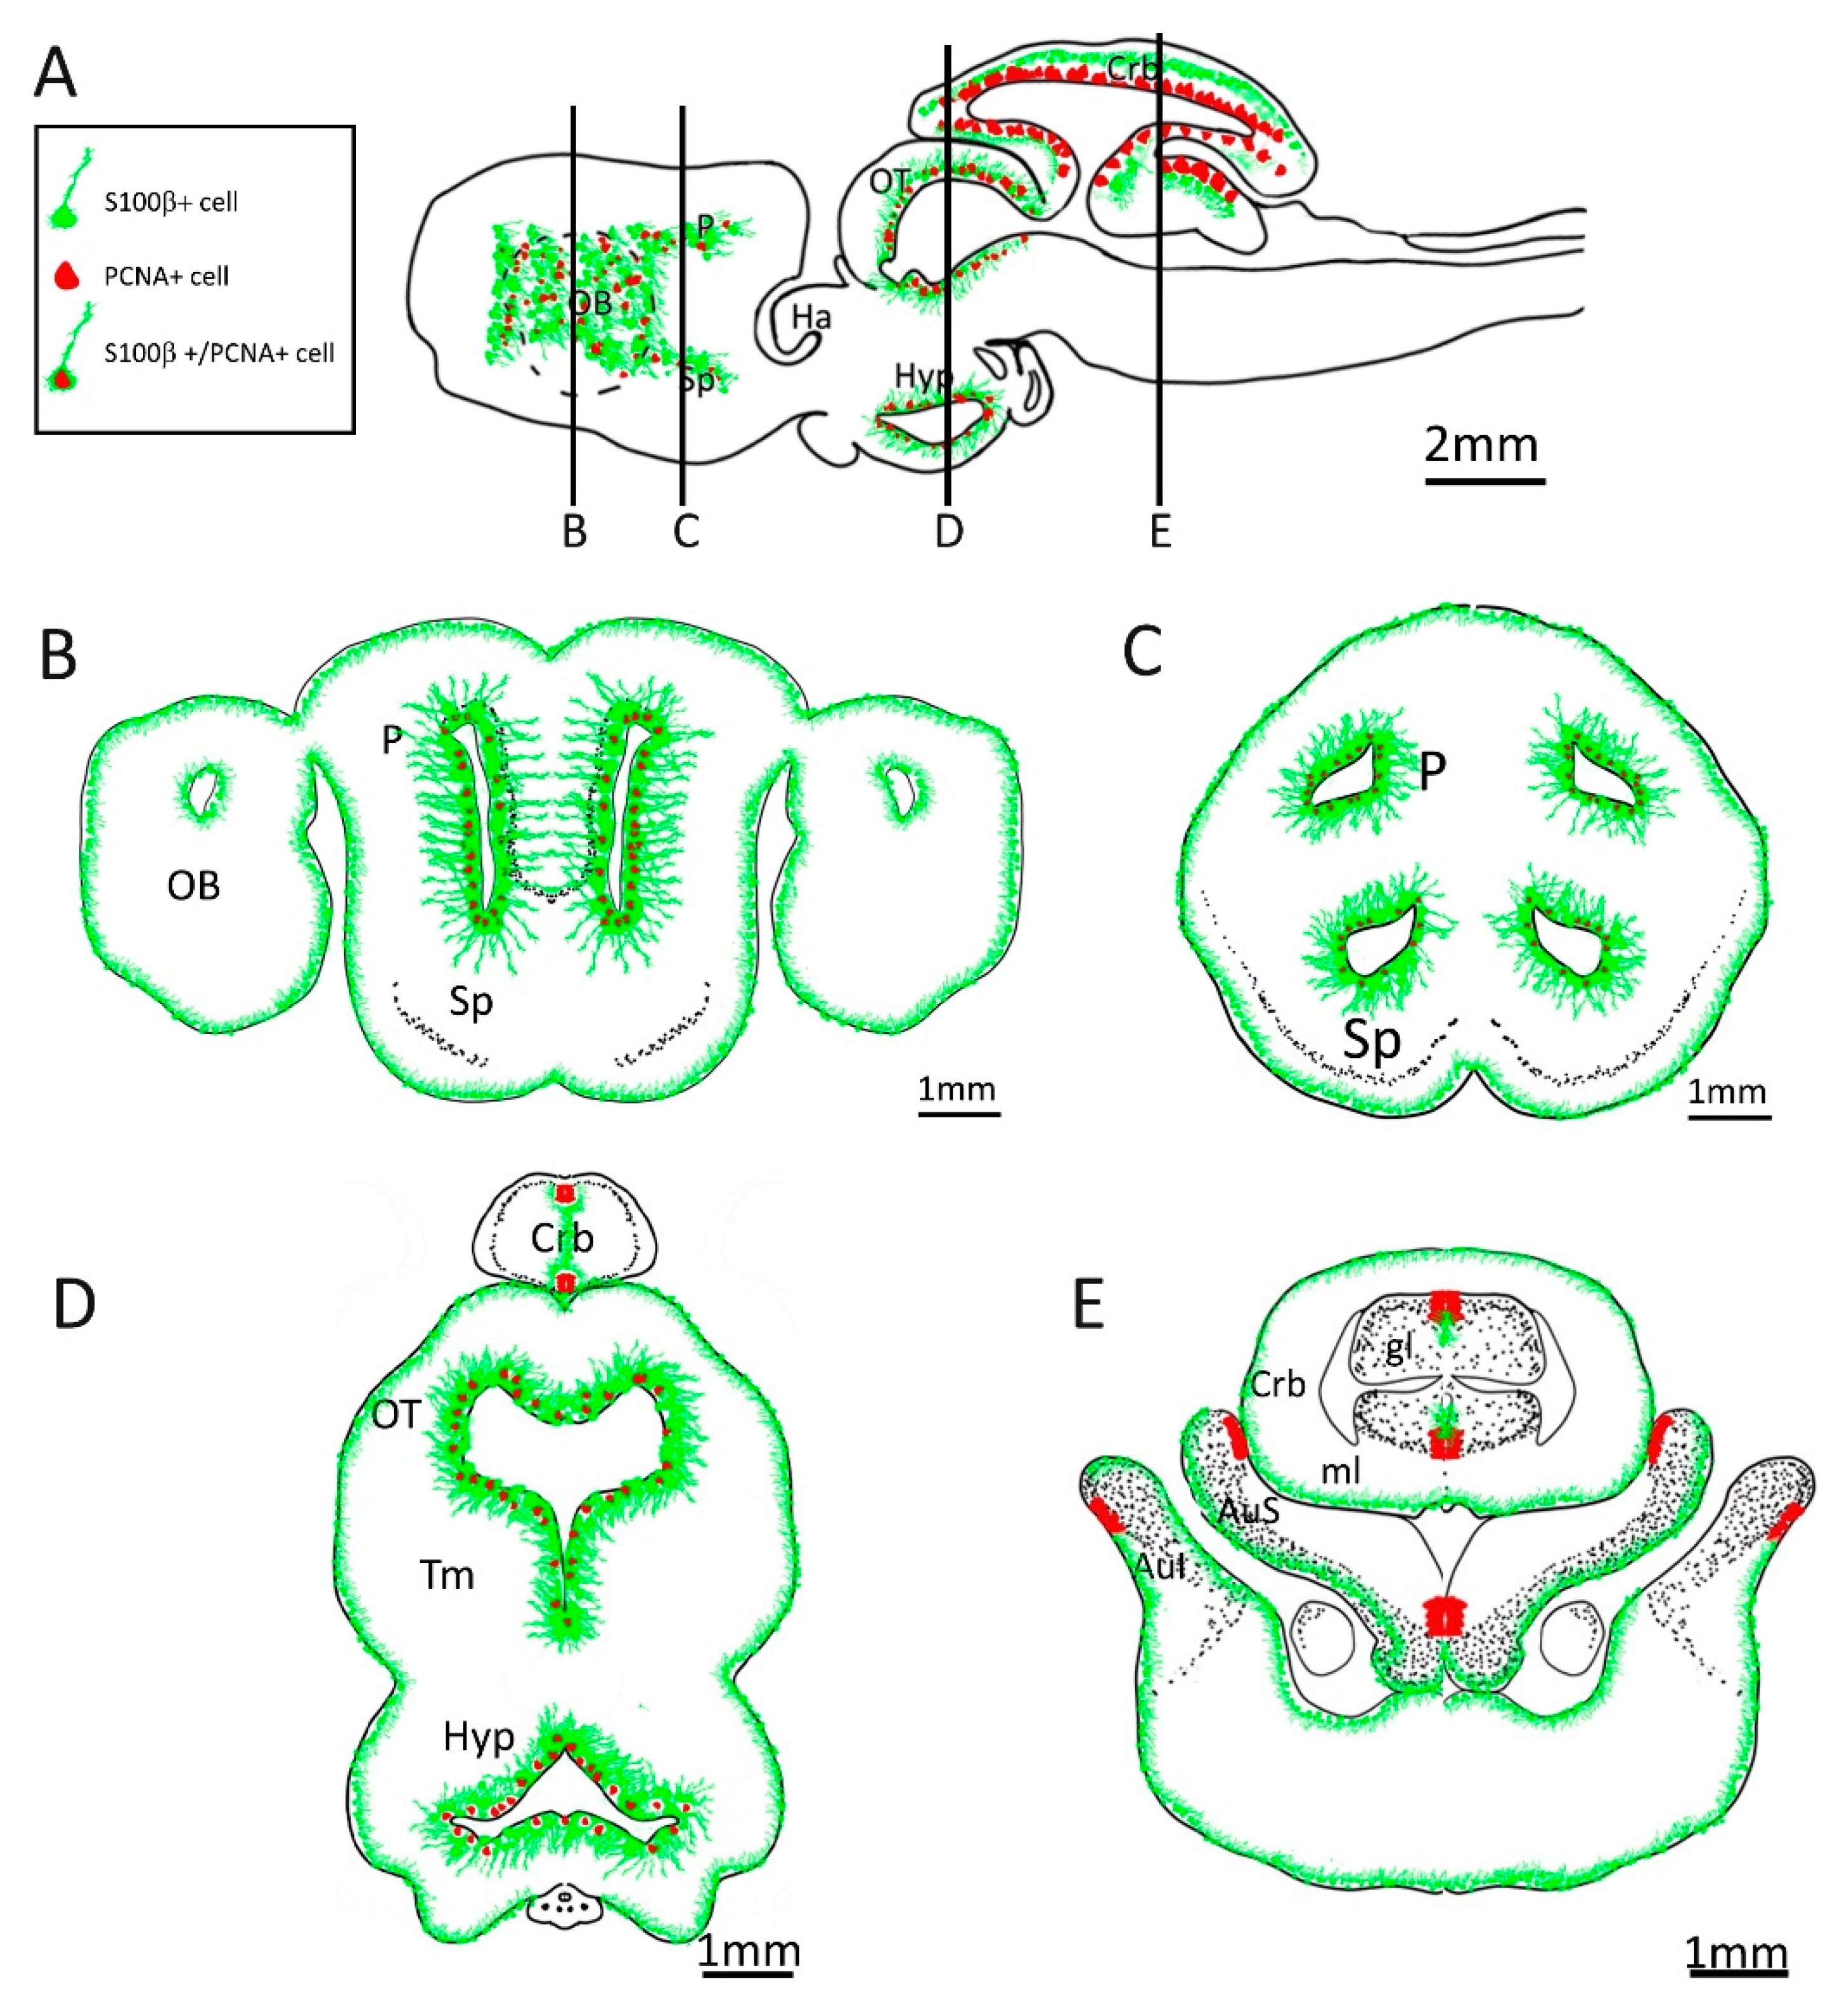
Figure 22.
Schematic representation of adult neurogenic niches in Scyliorhinus canicula brain. (A) Representation of a sagittal section of S. canicula brain, with indicative localization of S100β+ (green) and PCNA+ (red) cells. (B) Representation of a coronal section of S. canicula anterior telencephalon, with indicative localization of S100β+ (green) and PCNA+ (red) cells around the ventricular walls. (C) Representation of a coronal section of S. canicula posterior telencephalon, with indicative localization of S100β+ (green) and PCNA+ (red) cells around the ventricular walls. (D) Representation of a mesodiencephalic coronal section of S. canicula, with indicative localization of S100β+ (green) and PCNA+ (red) cells. (E) Representation of a posterior coronal section of S. canicula, with indicative localization of S100β+ (green) and PCNA+ (red) cells in the cerebellum and cerebellar auricles. Abbreviations: OB: olfactory bulb, P: pallium, Sp: subpallium, Ha, habenulae, OT: optic tectum, Tm: tegmentum, Hyp: hypothalamus, Crb: cerebellum, gl: granular layer, ml: molecular layer, AuS: superior cerebellar auricle, AuI: inferior cerebellar auricle.
![Ijms 24 03650 g022]()
Table 1.
List of all primary and secondary antibodies utilized in this work.
Table 1.
List of all primary and secondary antibodies utilized in this work.
| Primary Antibody | Producer | Catalog Number | Type | Working Dilution |
|---|
| Lamp-1 | Abcam | ab24170 | Polyclonal Rabbit | 1:500 |
| Msi-1 | Cell Signaling | D46A8 | Monoclonal Rabbit | 1:100 |
| NeuN | Abcam | Ab177487 | Monoclonal Rabbit | 1:500 |
| PCNA | Dako | M0879 | Monoclonal Mouse | 1:500 |
| pH3 | Abcam | ab47297 | Polyclonal Rabbit | 1:250 |
| β -IIITub | Abcam | ab78078 | Monoclonal Mouse | 1:2000 |
| S100β | Genetex | GTX129573 | Polyclonal Rabbit | 1:500 |
| Secondary Antibody | | | | |
| AlexaFluor 488 anti-Rabbit | Invitrogen | A11001 | Goat IgG | 1:500 |
| AlexaFluor 568 anti-Rabbit | Invitrogen | A11011 | Goat IgG | 1:500 |
| AlexaFluor 568 anti-Mouse | Invitrogen | A11004 | Goat IgG | 1:500 |
| AlexaFluor 635 anti-Rabbit | Invitrogen | A31576 | Goat IgG | 1:500 |
| Alexa Fluor 488 AffiniPure Fab Fragment anti-Rabbit | Jakson ImmunoResearch | 111547003 | Goat/IgG (H+L) | 1:400 |
| Rhodamine Red-X (RRX) AffiniPure Fab Fragment anti-Rabbit | Jakson ImmunoResearch | 111297003 | Goat/IgG (H+L) | 1:400 |


