Article

Atmospheric Propagation Modelling for Terrestrial Radio Frequency Communication Links in a Tropical Wet and Dry Savanna Climate

1
Department of Physics, Federal University Lokoja, Lokoja 260101, Nigeria
2
Department of Electrical and Electronics Engineering, Faculty of Engineering, University of Lagos, Akoka, Lagos 100213, Nigeria
3
Department of Electrical Engineering and Information Technology, Institute of Digital Communication, Ruhr University, 44801 Bochum, Germany
4
Department of Electrical and Computer Engineering, College of Engineering, Anderson University, Anderson, SC 29621, USA
5
Research and Development Center for Physical Education, Health, and Information Technology, Department of Library and Information Science, Fu Jen Catholic Univesity, New Taipei City 24205, Taiwan
6
Department of Computer Science and Information Engineering, Asia University, Taichung City 41354, Taiwan
7
Department of Information Management, Tainan University of Technology, 529 Zhongzheng Road, Tainan City 710, Taiwan
*
Authors to whom correspondence should be addressed.
Information 2022, 13(3), 141; https://doi.org/10.3390/info13030141
Submission received: 4 February 2022 / Revised: 22 February 2022 / Accepted: 3 March 2022 / Published: 7 March 2022
(This article belongs to the Special Issue Advances in Wireless Communications Systems)

Abstract

:
Atmospheric impairment-induced attenuation is the prominent source of signal degradation in radio wave communication channels. The computation-based modeling of radio wave attenuation over the atmosphere is the stepwise application of relevant radio propagation models, data, and procedures to effectively and prognostically estimate the losses of the propagated radio signals that have been induced by atmospheric constituents. This contribution aims to perform a detailed prognostic evaluation of radio wave propagation attenuation due to rain, free space, gases, and cloud over the atmosphere at the ultra-high frequency band. This aim has been achieved by employing relevant empirical atmospheric data and suitable propagation models for robust prognostic modeling using experimental measurements. Additionally, the extrapolative attenuation estimation results and the performance analysis were accomplished by engaging different stepwise propagation models and computation parameters often utilized in Earth–satellite and terrestrial communications. Results indicate that steady attenuation loss levels rise with increasing signal carrier frequency where free space is more dominant. The attenuation levels attained due to rain, cloud, atmospheric gases, and free space are also dependent on droplet depths, sizes, composition, and statistical distribution. While moderate and heavy rain depths achieved 3 dB and 4 dB attenuations, the attenuation due to light rainfall attained a 2.5 dB level. The results also revealed that attenuation intensity levels induced by atmospheric gases and cloud effects are less than that of rain. The prognostic-based empirical attenuation modeling results can provide first-hand information to radio transmission engineers on link budgets concerning various atmospheric impairment effects during radio frequency network design, deployment, and management, essentially at the ultra-high frequency band.

1. Introduction

In terrestrial cellular communication networks, the electromagnetic waves radiate through the space communication channels [1,2,3]. Generally, the transmitted electromagnetic waves, the primary information carrier, spread out via the transmitting and receiver antennae, employing different propagation mechanisms such as scattering, diffraction, reflection, and refraction [4]. These occur when all forms of manmade and natural obstacles impede the communication paths and amplitudes. Some obstacles include atmospheric gases, cloud, snow, rain, trees, houses, etc. The resultant effects of these natural and manmade blockades are high attenuation, slow/fast deterioration and steady losses in the intensities of the transmitted waves in space [5,6,7,8]. For example, slow fluctuations occur due to atmospheric precipitation particles, particularly rain water droplets, which often absorb, disperse, and scatter the amplitude and energy of transmitted electromagnetic signals in the Earth–satellite and terrestrial communication links [9,10,11]. Non-spherical droplets of rain stimulate the signal depolarization effect over the atmosphere. If flattened rain droplets impinge on propagated radio signal waves, the signal waves become depolarized [12]. The resultant depolarization effects on the signal waves are cross-talk that hamper efficient communication.
In addition, oxygen, cloud and snow particles in space are some of the key atmospheric variables that have huge and drastic effects on the energies of transmitted electromagnetic signals, reducing their reliability and availability at the user equipment terminals [13]. In practice, ambient radio wave beam refraction in the ionosphere is another key attenuation factor that requires investigation.
However, the signals’ attenuation and impairment effects from various natural atmospheric phenomena depend on the transmission frequency, transmission links, and particularly, the location of the signal transmission. Rainfall attenuation impairments are more pronounced in tropical regions than others due to the high presence of heavy and thunderous rain droplets and depths that characterize the region [13,14,15,16]. Precipitation is exceptionally inconstant over time intervals and between different localities; both factors make it somewhat challenging to measure. Thus, the need for specific location-based estimation of such effects is self-evident. In order to address this problem, several techniques have been proposed in the current literature. One of the most promising technologies is the Reconfigurable Intelligent Surface (RIS), a key enabler for beyond-5G and -6G wireless communication systems.
In recent times, RIS has been widely projected as the critical enabling technology for beyond-5G and -6G wireless networks. RISs pose great potential in improving the performance of wireless communication networks [17,18]. Passive elements are used in RIS design to mitigate interference in harsh environmental conditions [19]. Figure 1 presents an implementable RIS-assisted wireless communication system. Here, signals are reflected from the RIS to facilitate effective communication between the base station and the mobile terminal [20,21]. However, real-time control of the reflection amplitude and phase shift of RIS pose enormous computational complexity [22]. Recently, machine learning, deep learning, and federated learning models have been provided to address the limitations of RIS [23,24,25]. However, testing and training data pose severe limitations to applying machine learning-based RIS schemes.
Due to some major propagation impairments in the atmosphere at different frequencies using measurement and simulated data, various attenuation studies have been reported for different regions. These regions comprise the tropical region [14,15,16,26,27,28,29,30,31,32], sub-tropical region [33,34,35,36,37,38], temperate regions [39,40], semi-temperate region [41], and Mediterranean region [42,43,44], among others. However, clear, robust attenuation studies are lacking due to significant propagation impairments over the investigated environment, with a tropical wet and dry savanna climate. The Nigeria Communication Commission (NCC) has already concluded plans with the local cellular network providers to deploy 5G radio networks at a 3.5-GHz transmission frequency [45]. The proposed 5G network deployment also necessitated a prognostic evaluation of the total propagation attenuation for accurate link power margin analysis, especially in dense urban environments [46].
To this end, the focus of this contribution is to carry out a detailed prognostic evaluation of the total radio wave propagation losses due to rain, free space, gases, and cloud over the atmosphere at the ultra-high frequency band, leveraging experimental measurements. In particular, the main contributions of this study are outlined as follows:
We propose a prognostic-based empirical attenuation model for terrestrial radio frequency communication links in tropical wet and dry savanna climates based on experimental data.
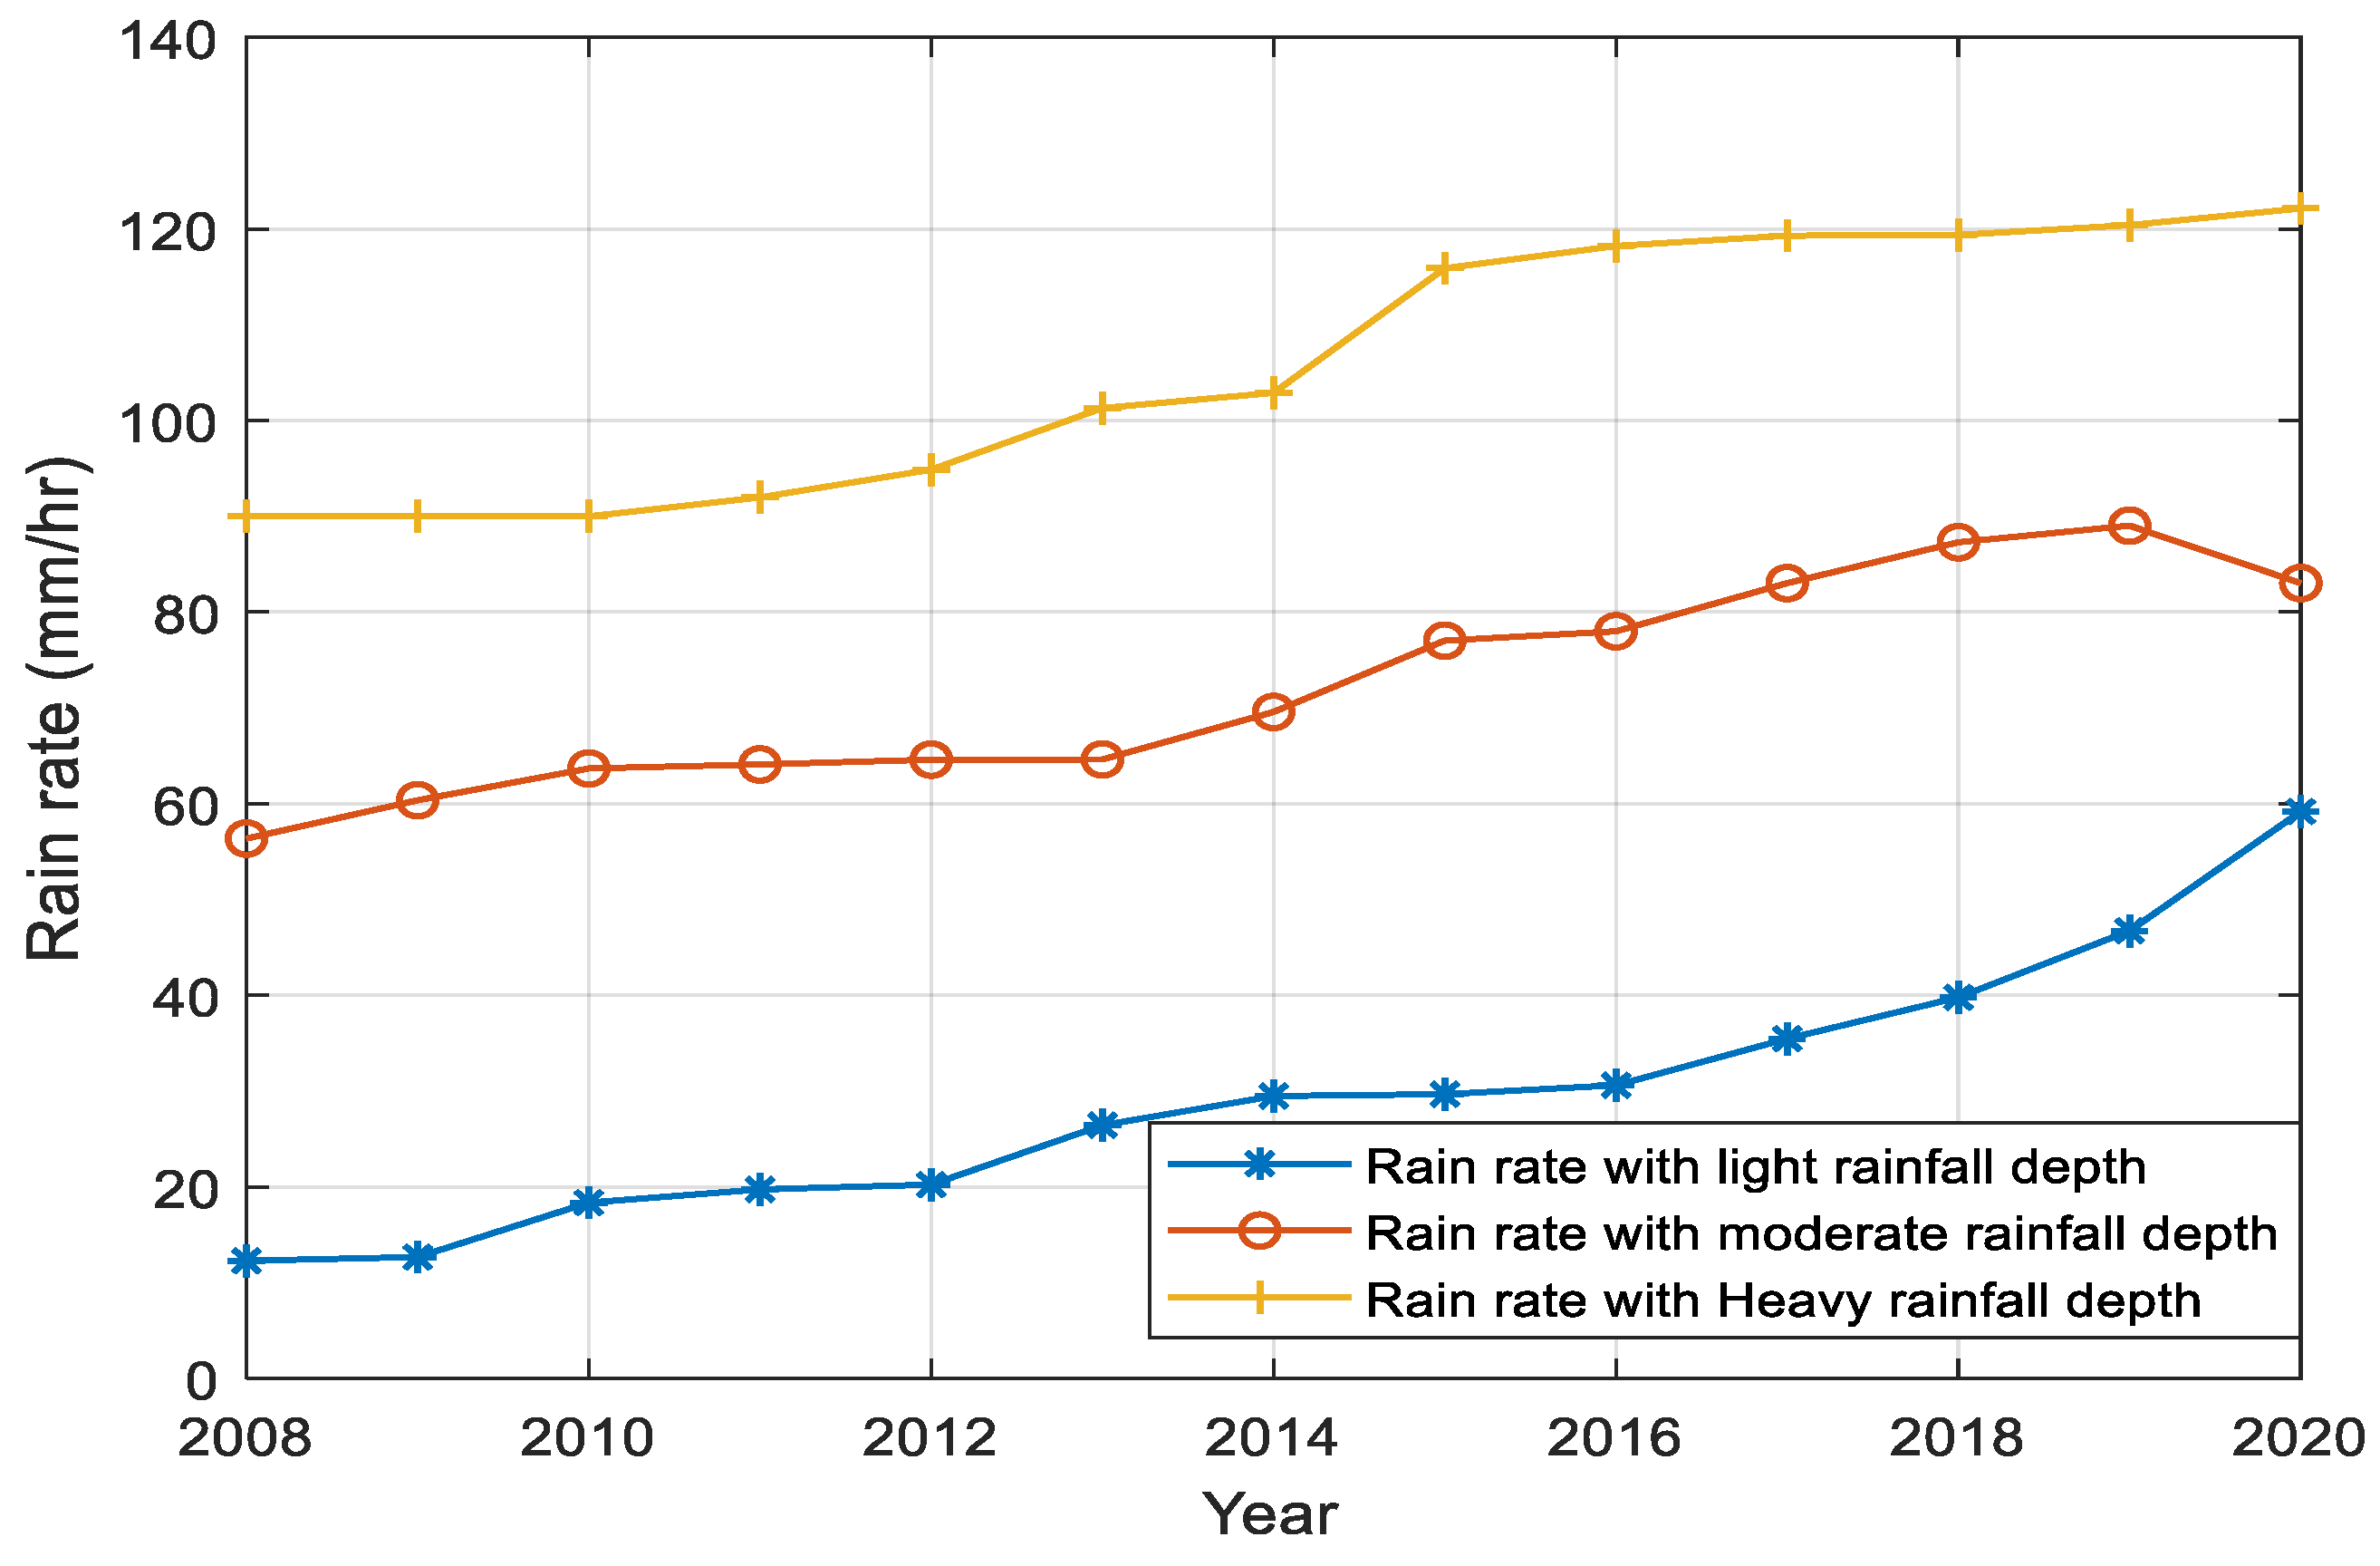
We present a classification of rain rate values based on rainfall depth levels obtained from experimental measurements.
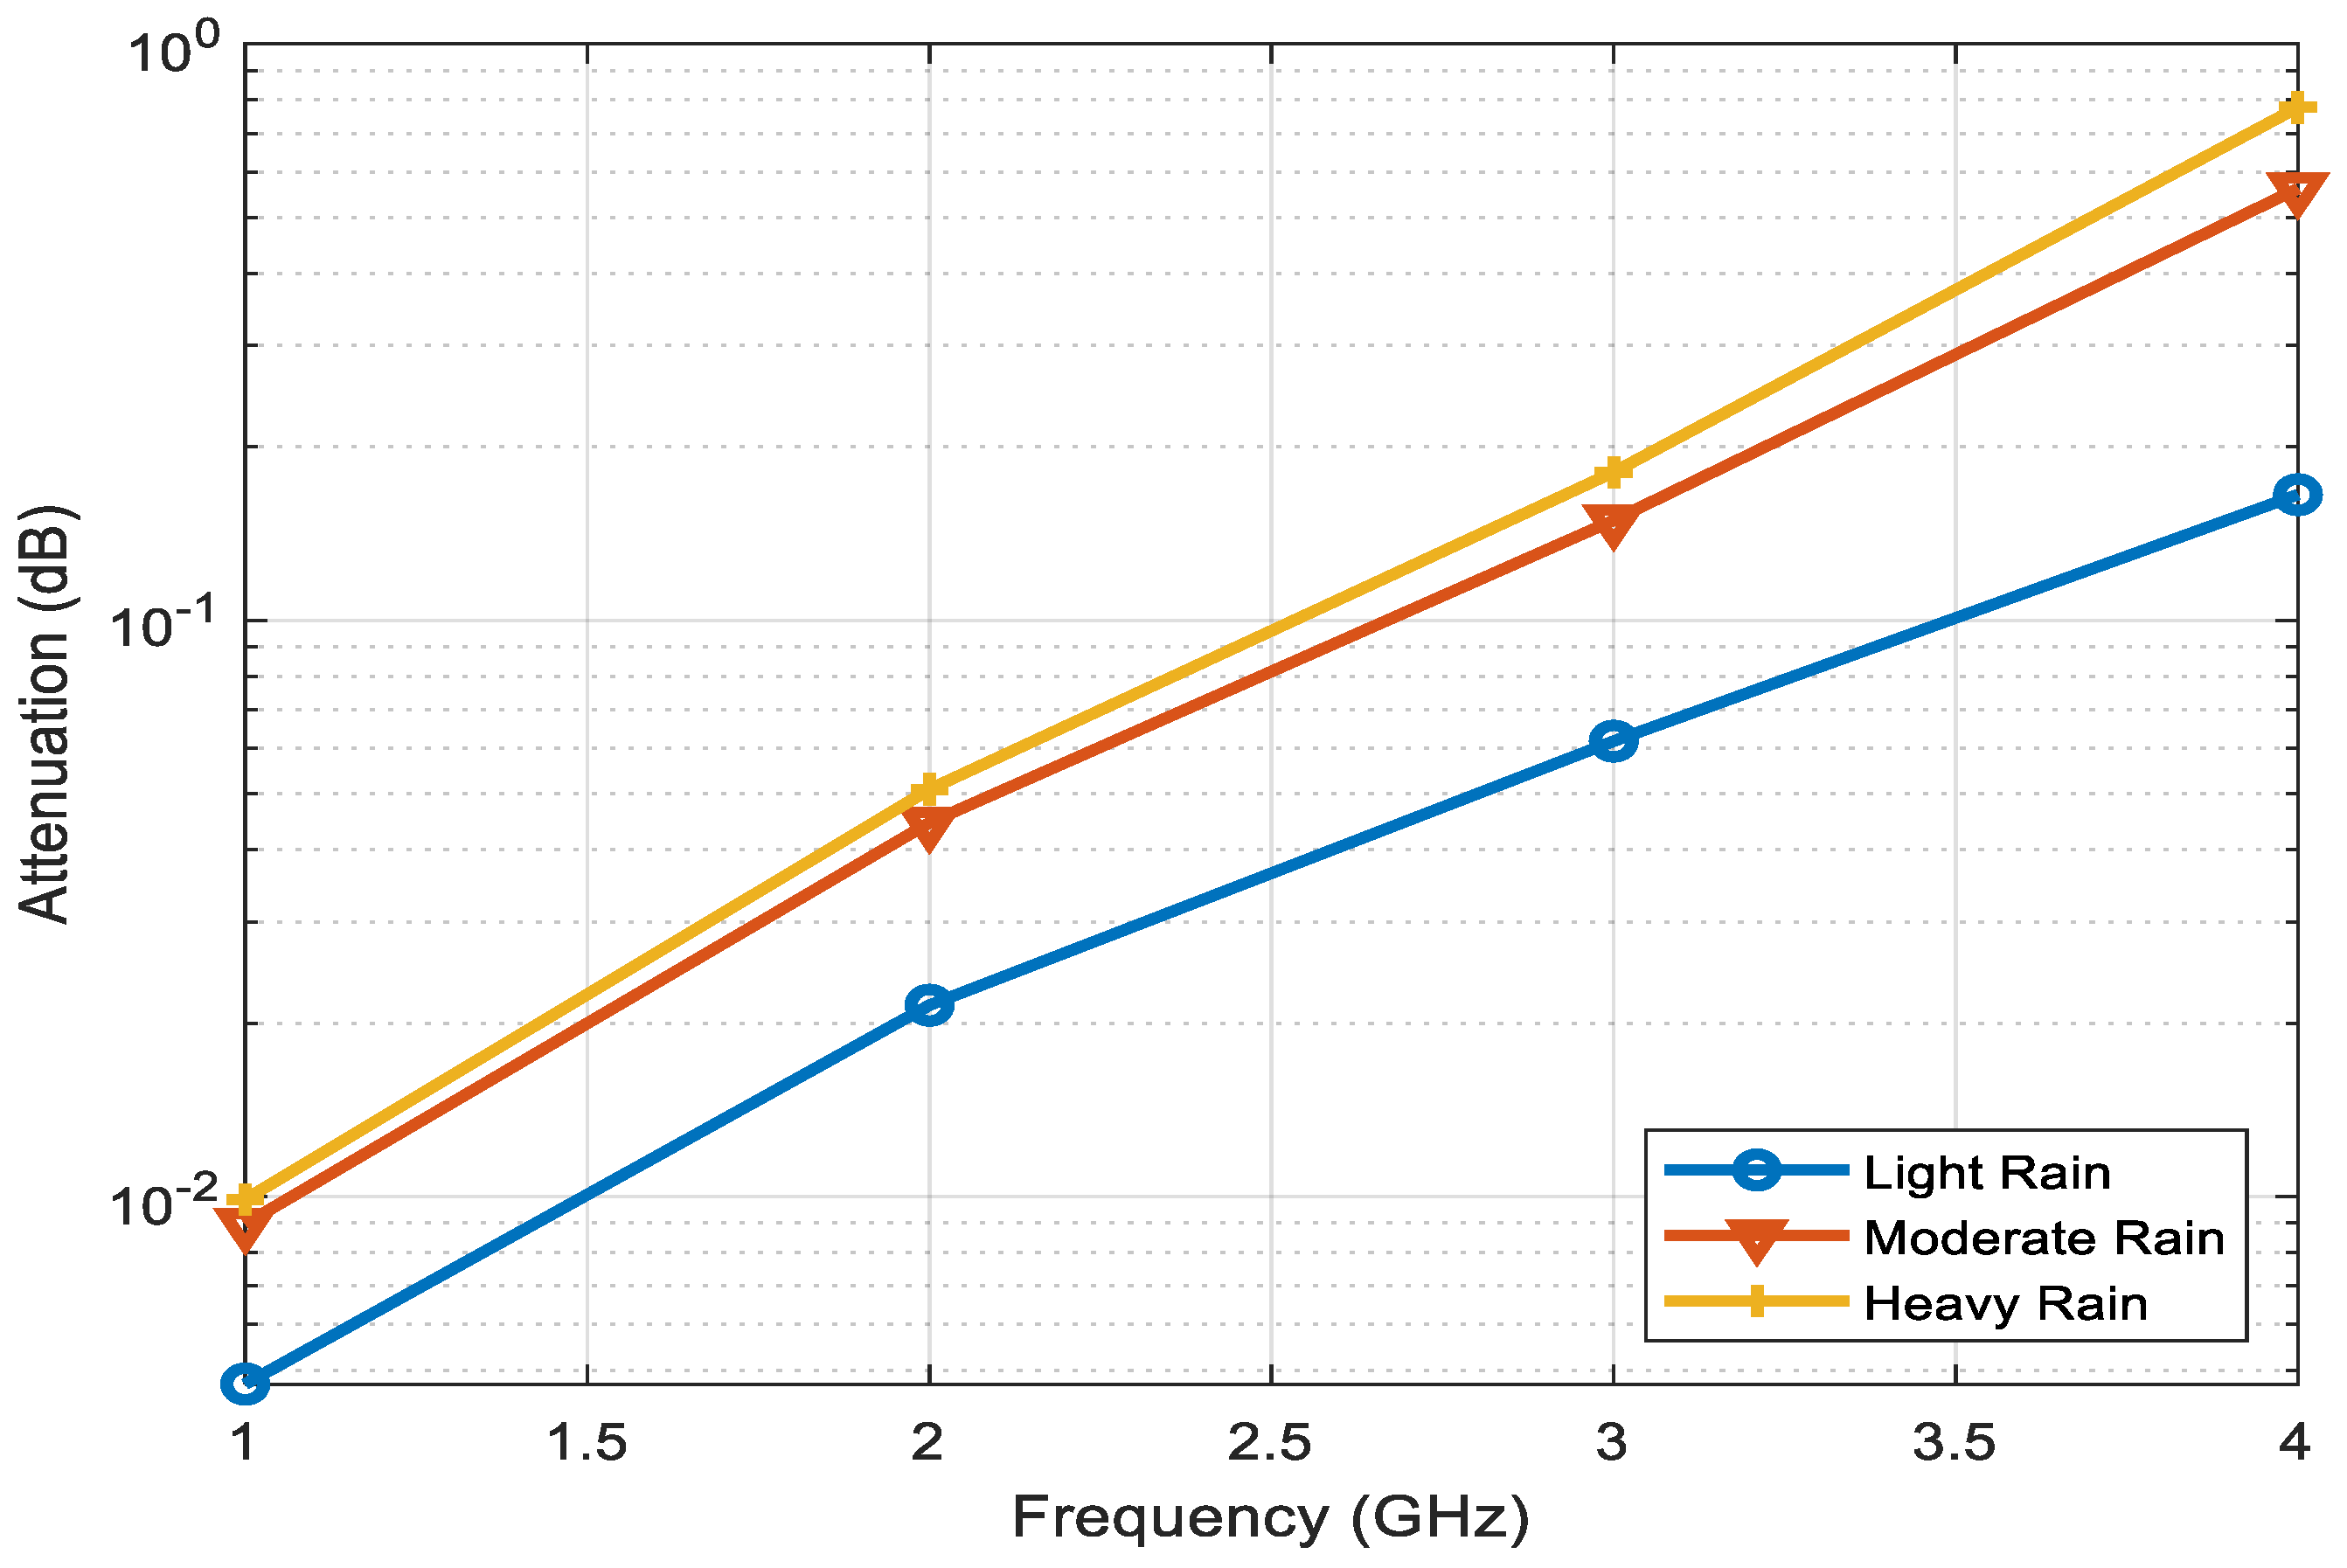
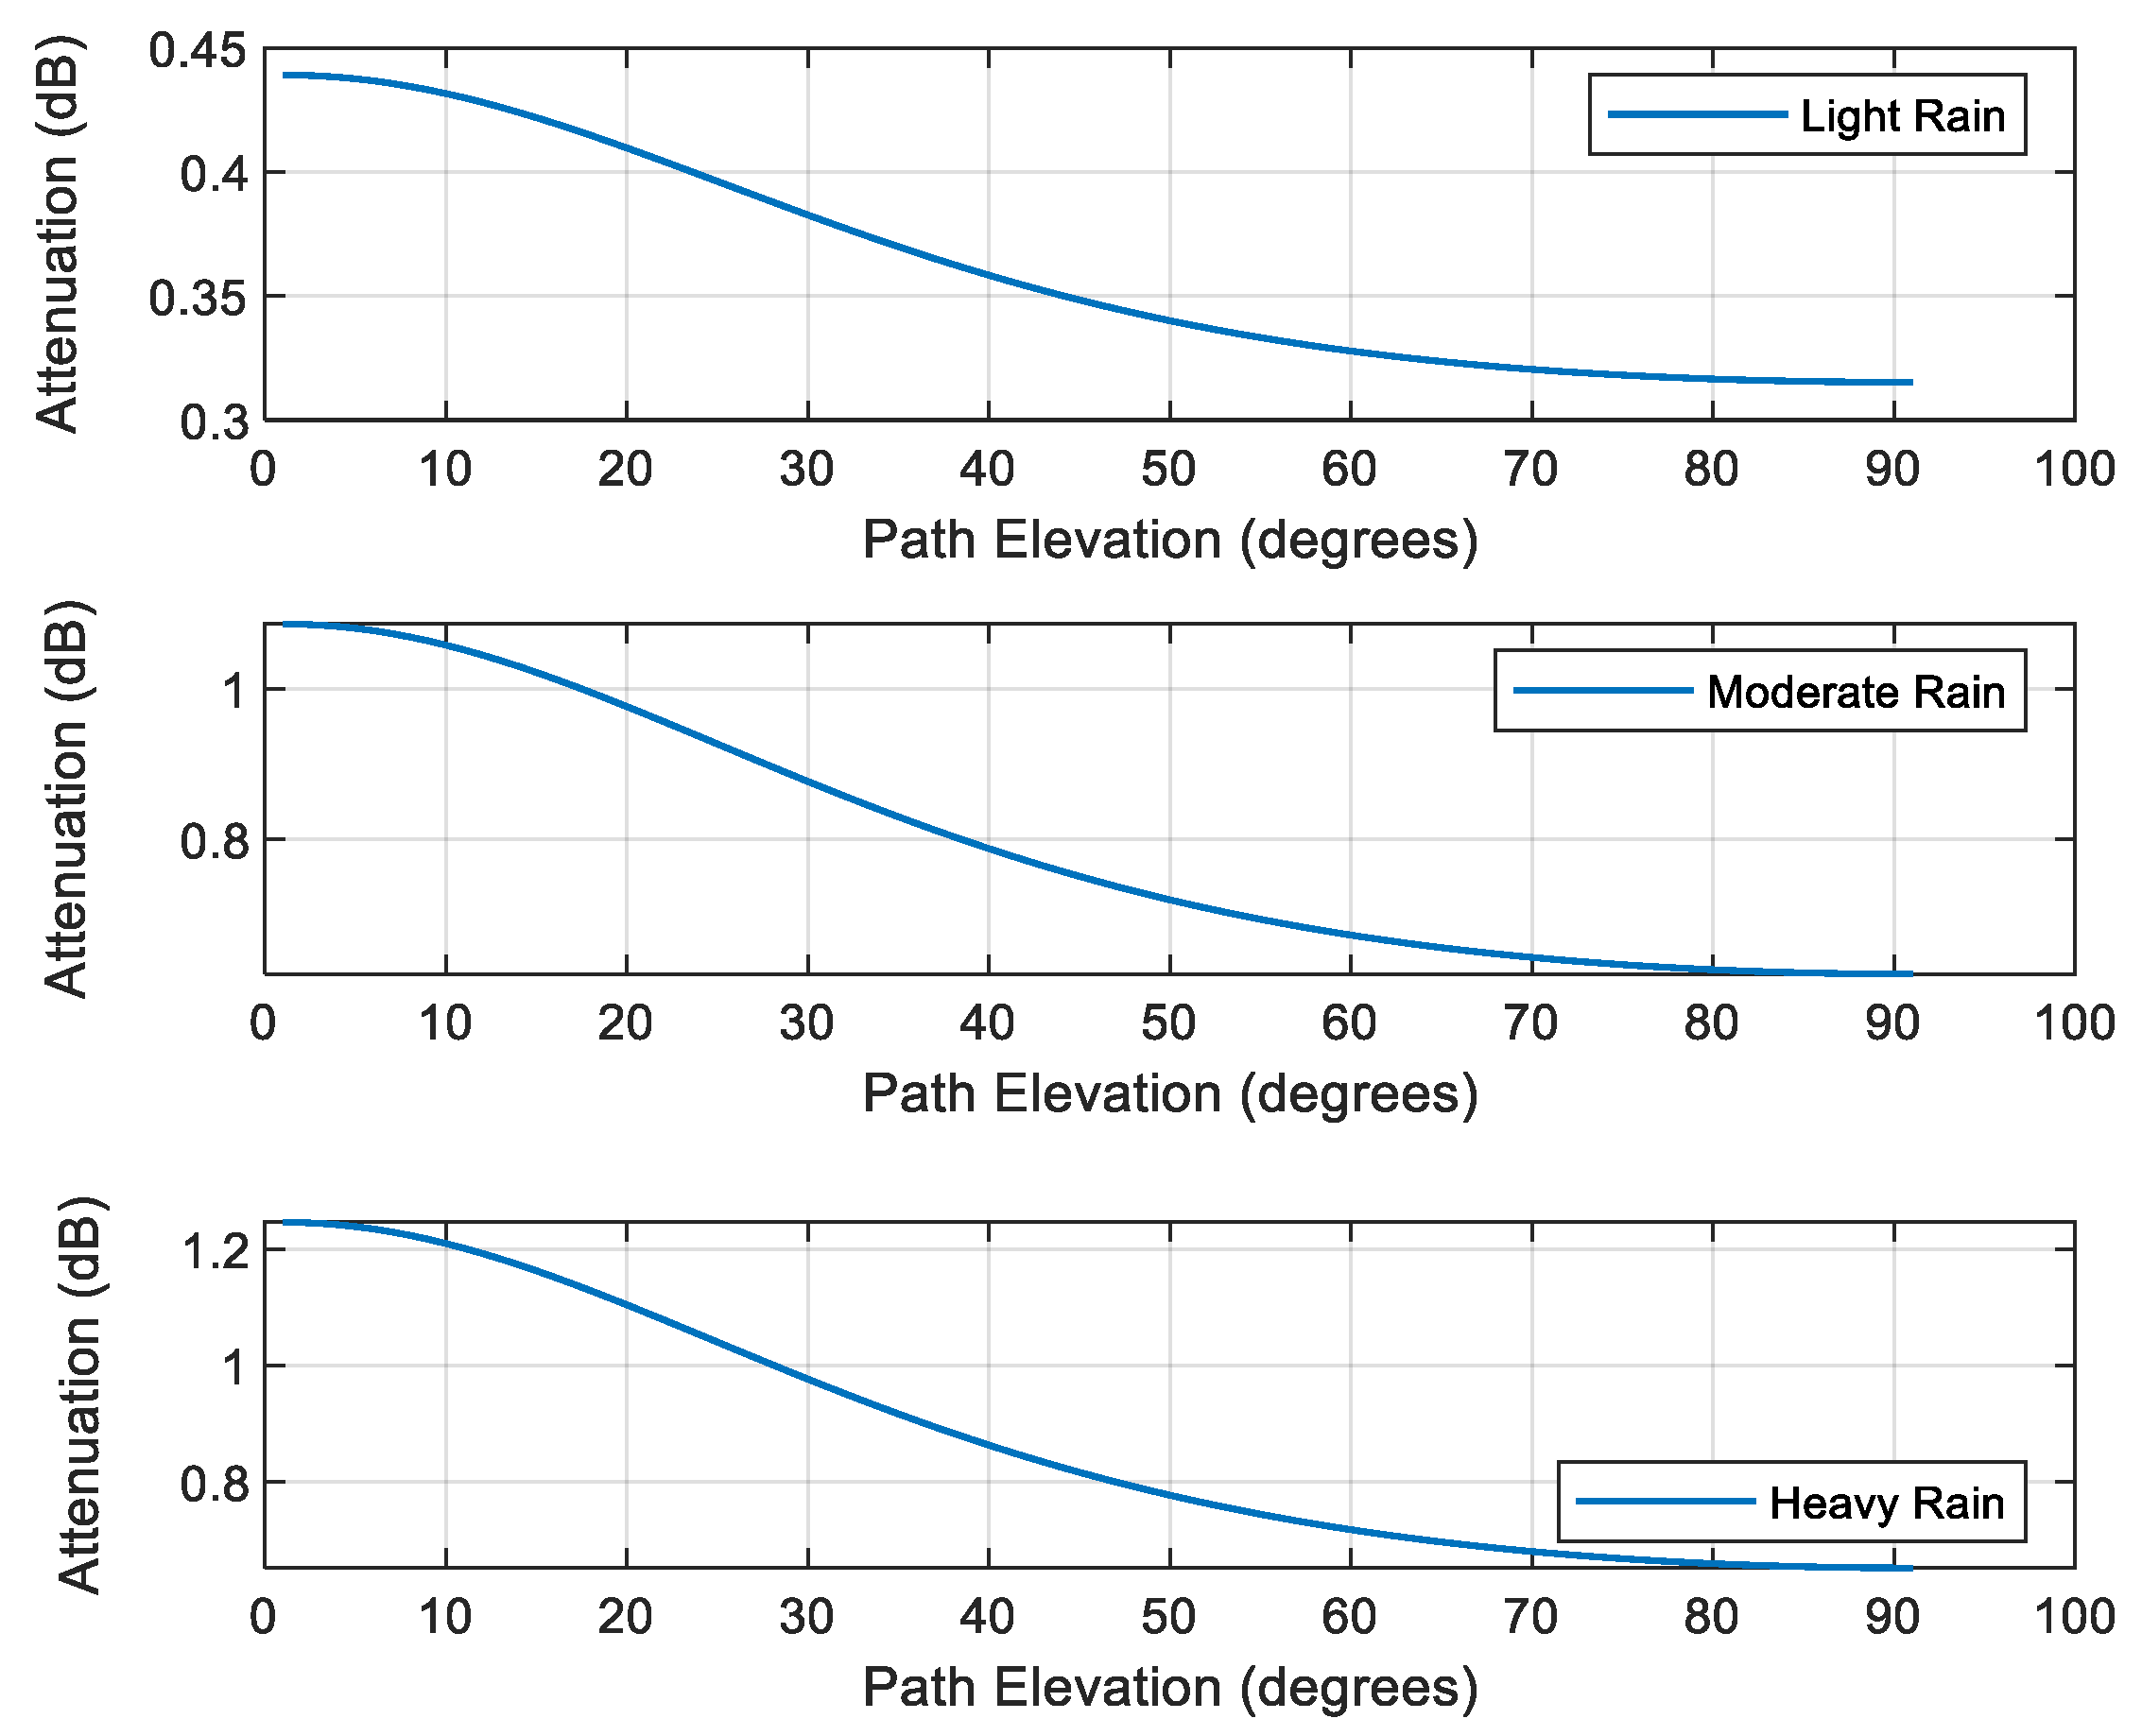
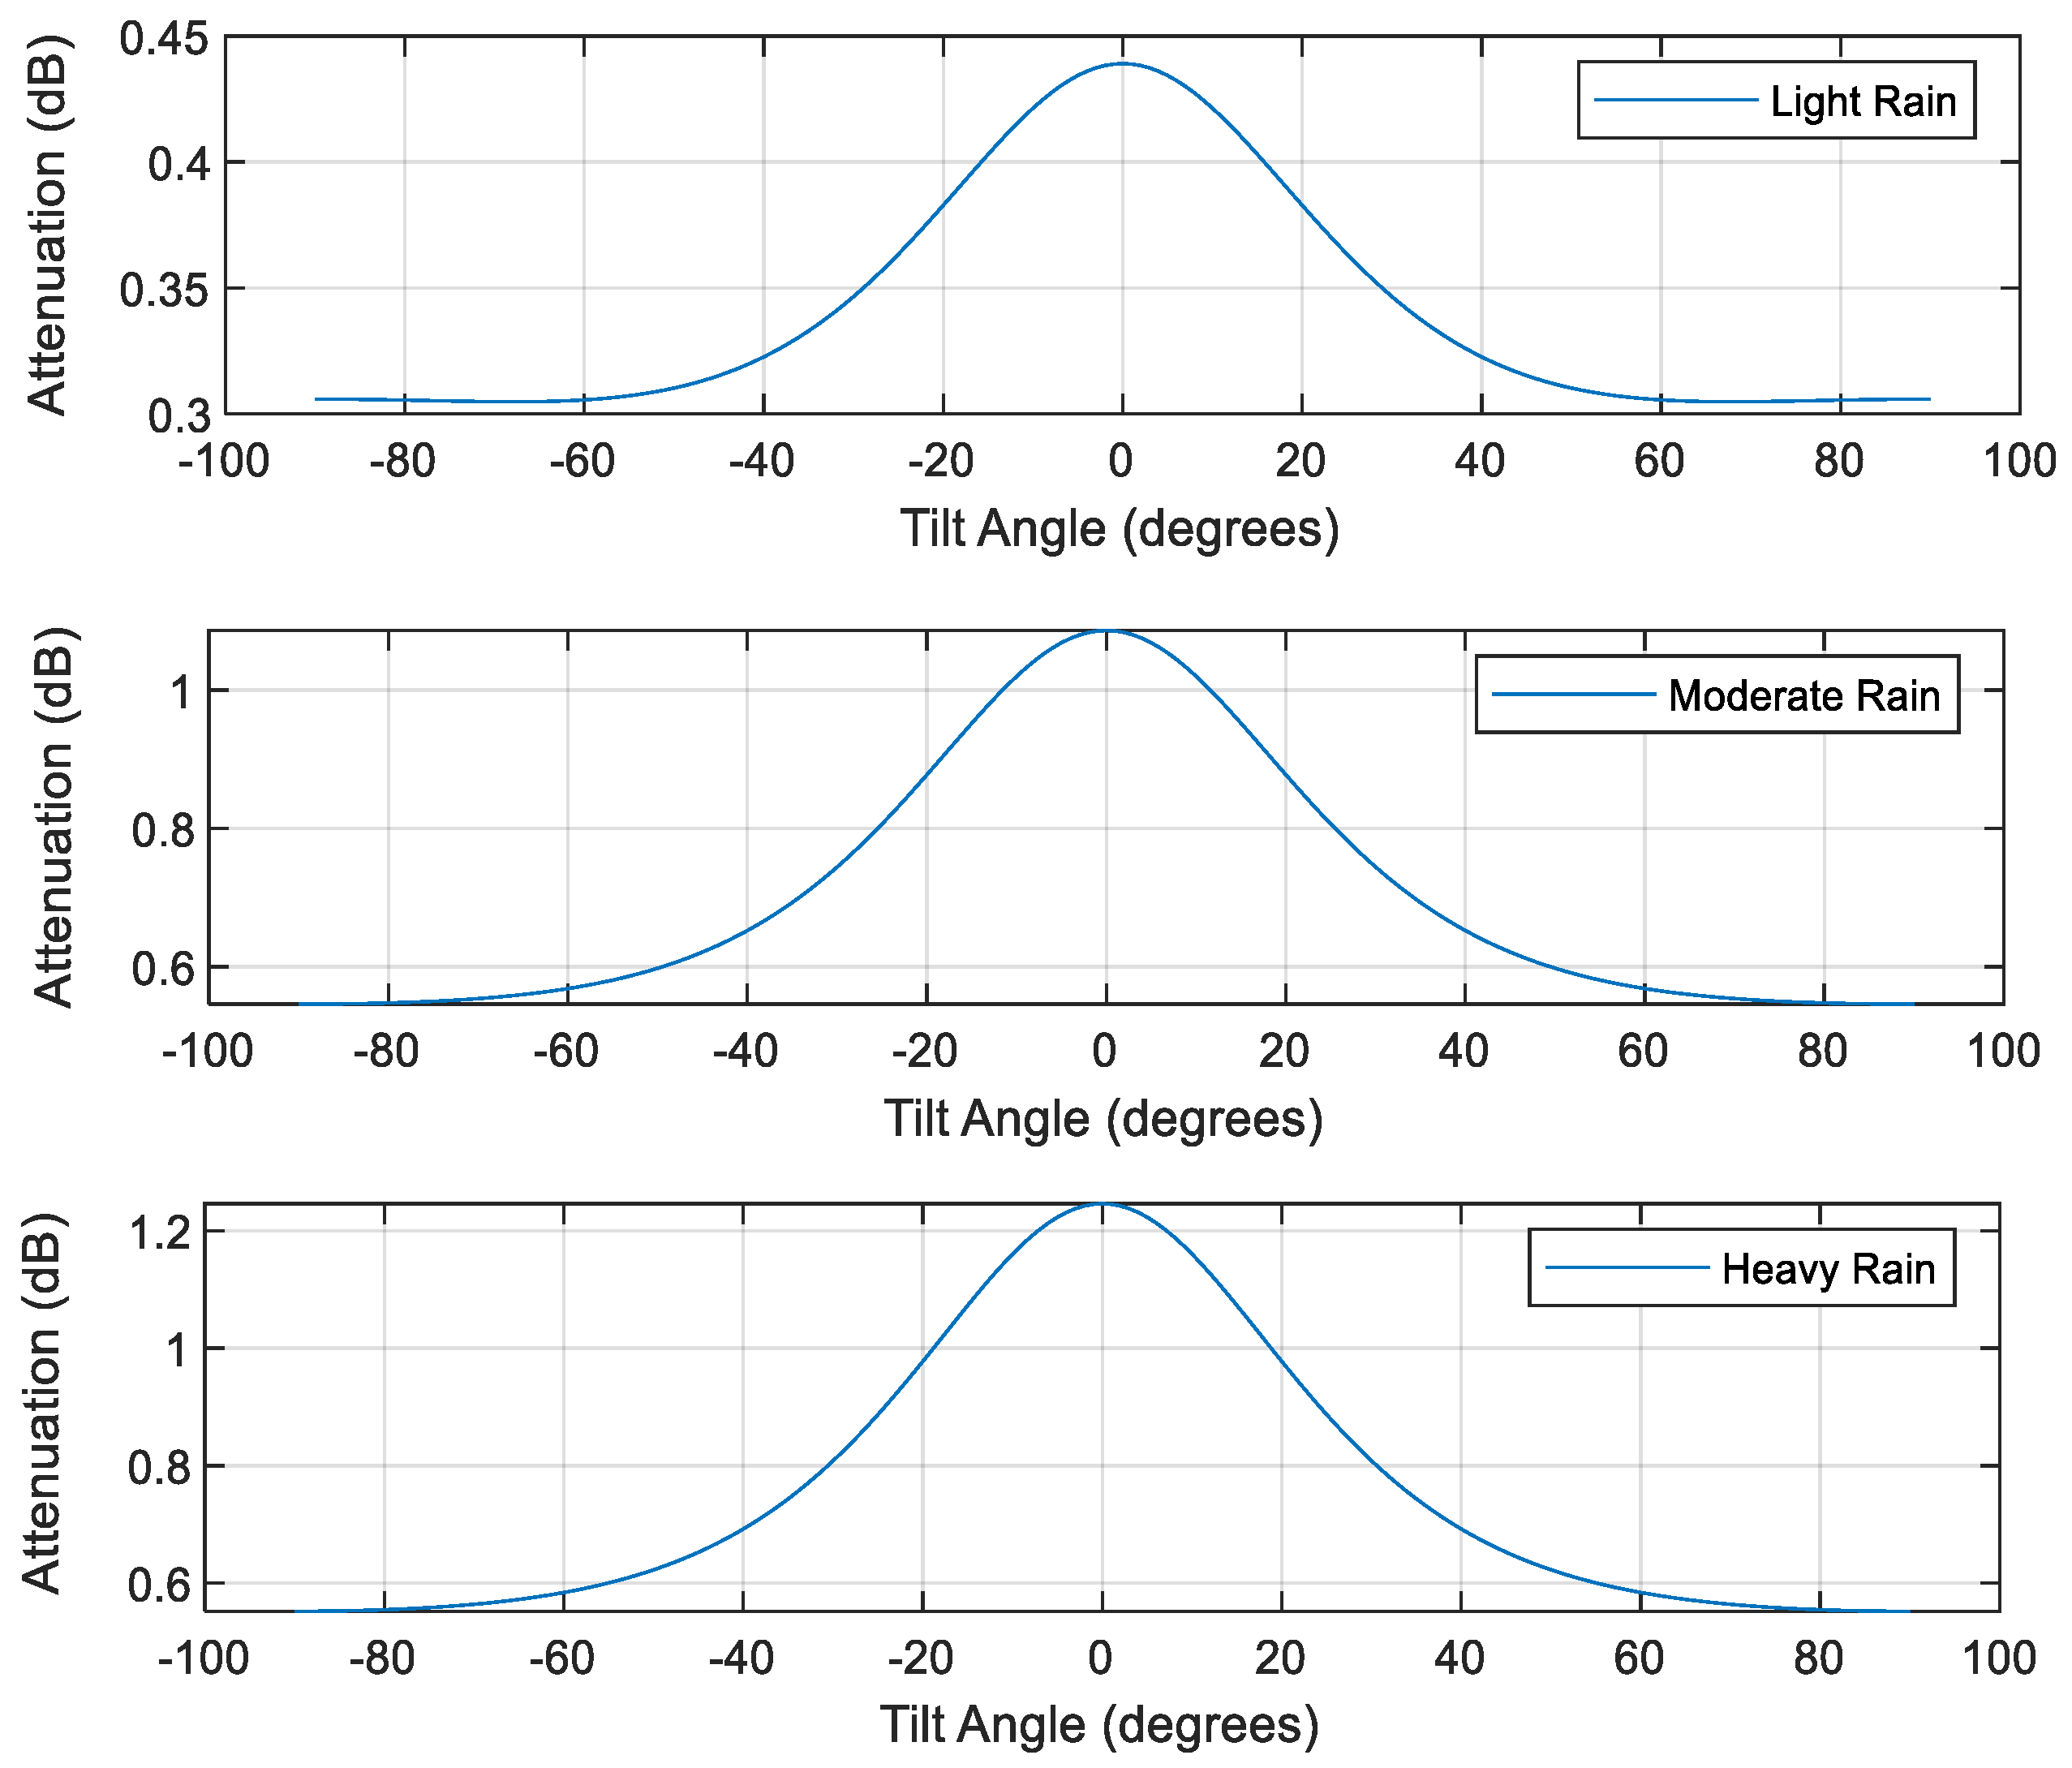
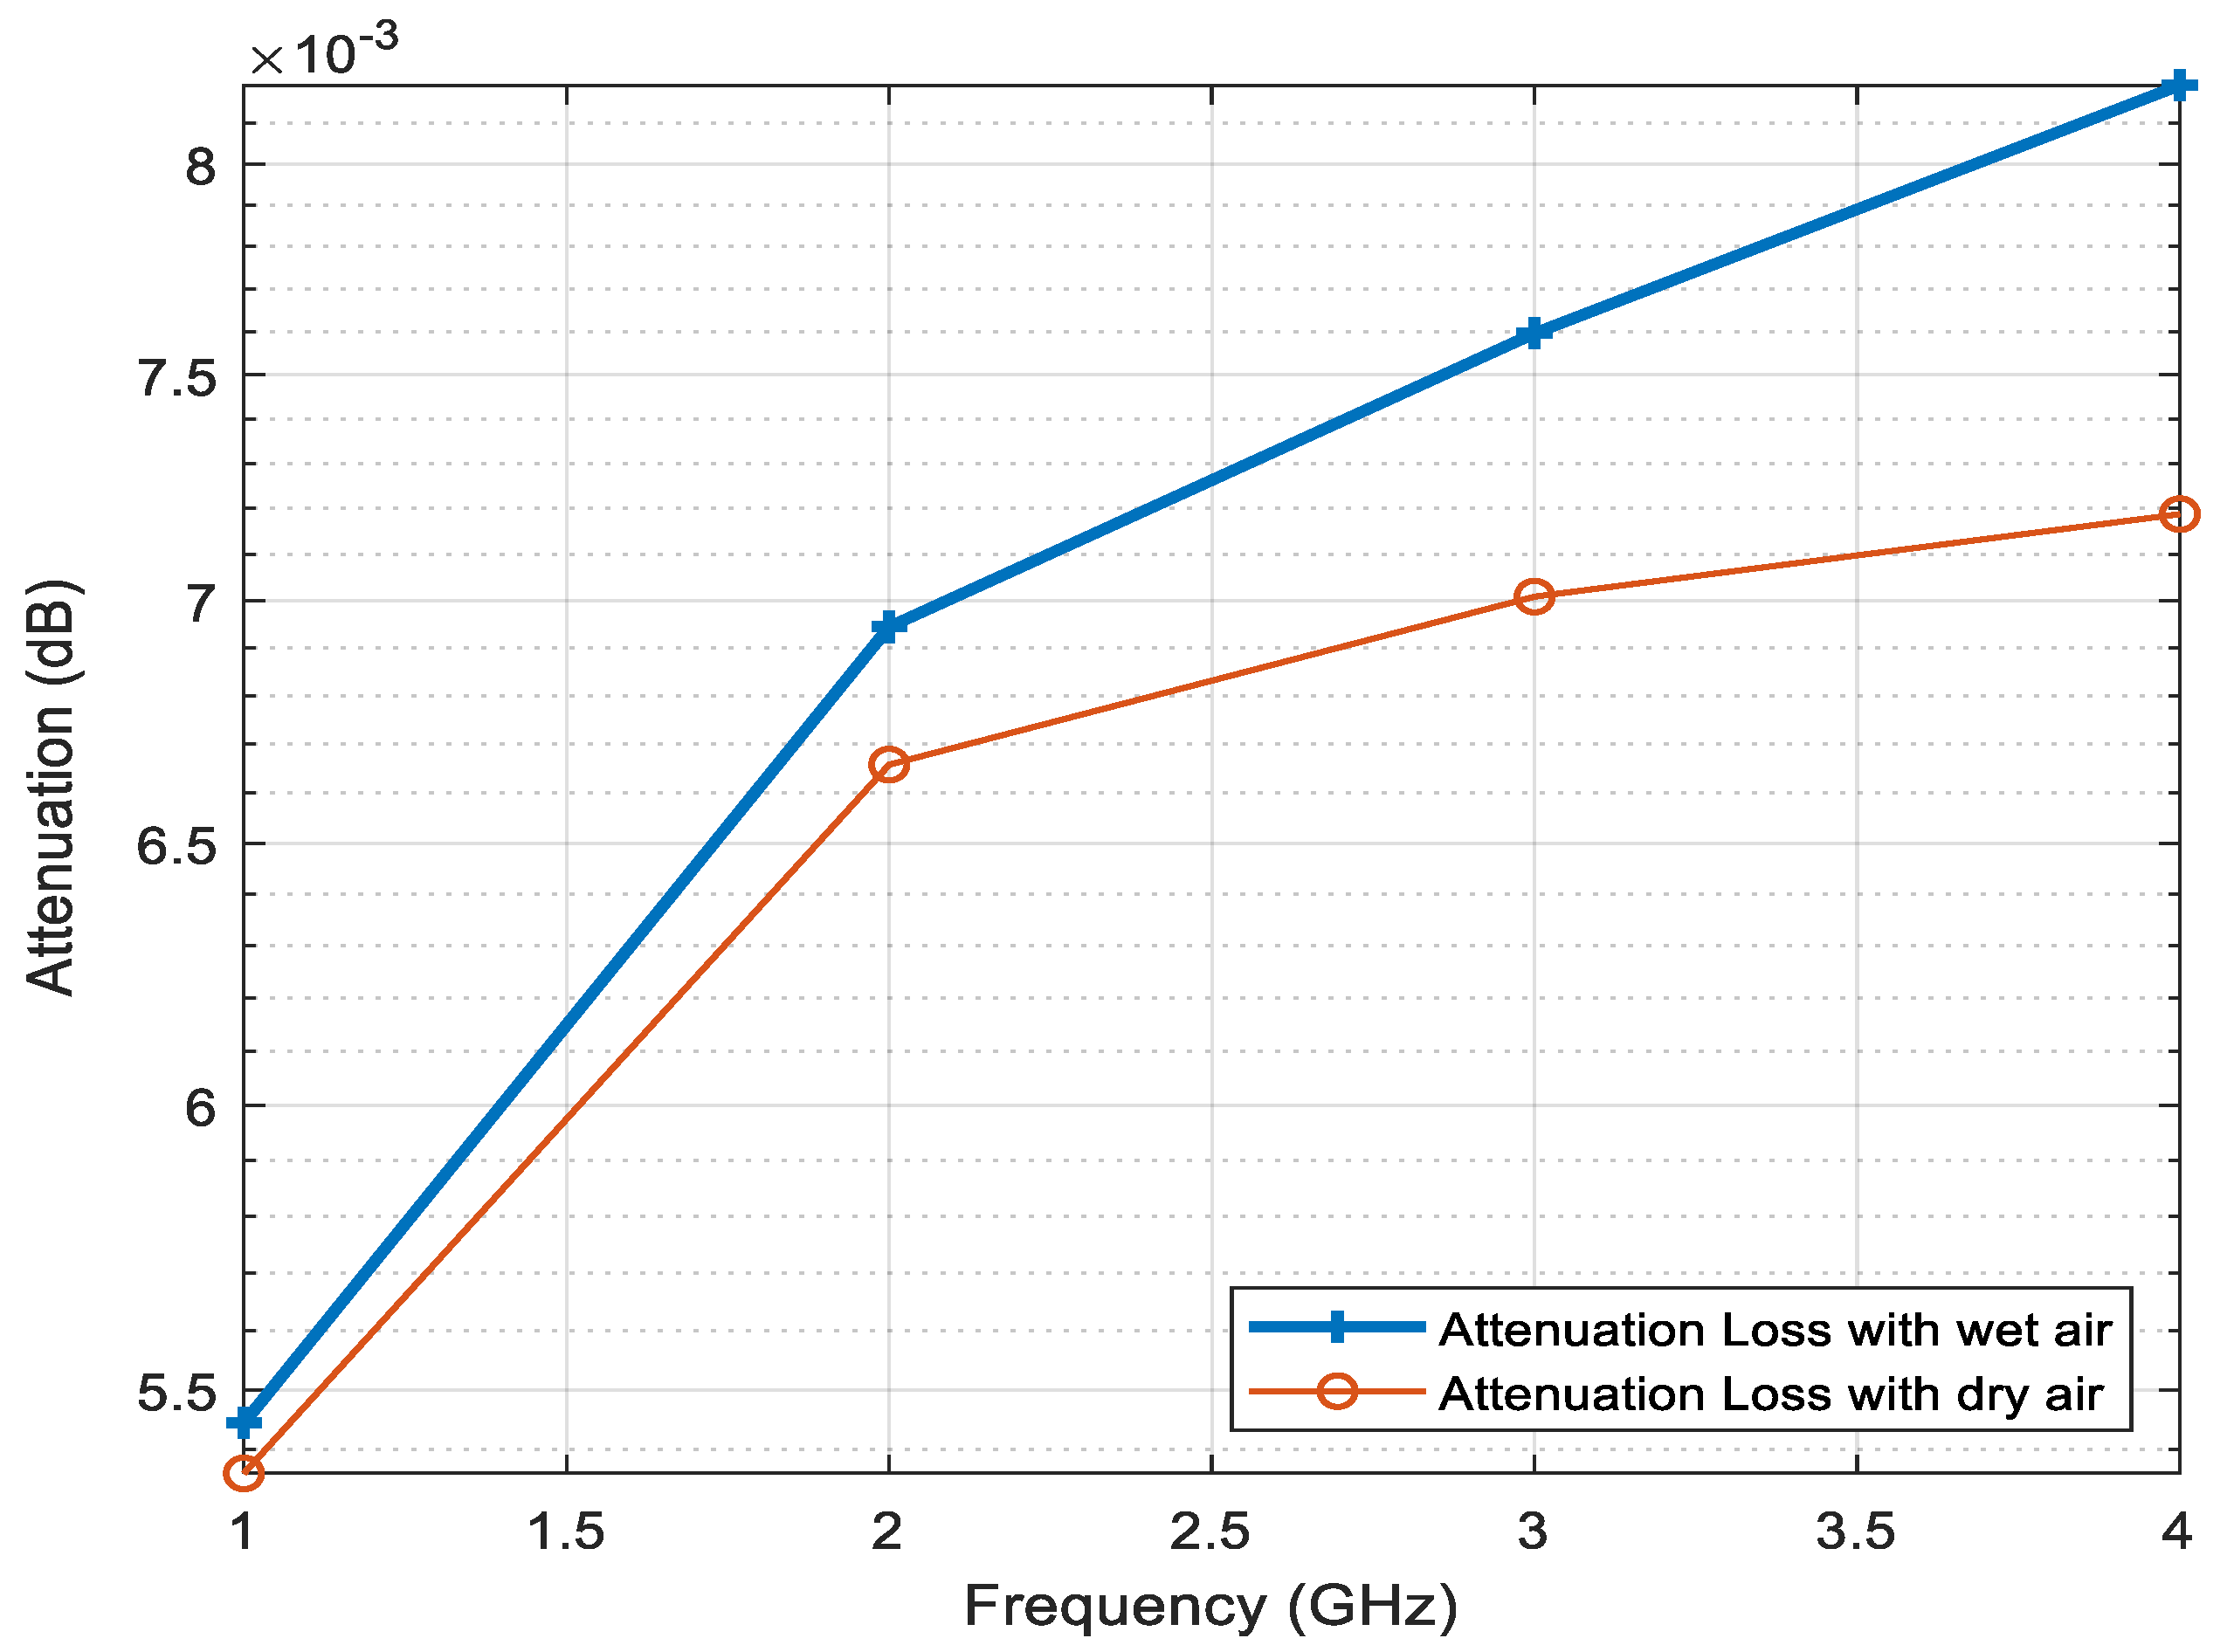
We determine the propagation loss due to attenuation from atmospheric variables obtained from experimental measurements.
The remaining part of this paper is organized as follows. Section 2 presents the theoretical framework. Section 3 describes the materials and methods. Section 4 presents the results and discussion. Finally, Section 5 offers a concise conclusion to the study.

2. Theoretical Framework

The theoretical framework covers radio wave propagation through free space, rain, cloud, gases, and the total attenuation propagation loss.

2.1. Propagation through Free Space

In free-space propagation modeling, the signal transmission between a receiving and transmitting antenna is assumed to be located in an empty environmental setting devoid of obstructions [47,48,49,50,51]. Neither reflecting surfaces nor absorbing stumbling blocks or the like are considered. The power density w p at a given transmitting distance d with power pT in correspondence with the antenna gain G a t is given by Equation (1) [52]:
w p = P T G a t 4 π d 2
The received power P R that can be accessed at the receiving antenna with Gain G a r is given in Equation (2) as:
P R = P T G a t 4 π d 2 . A e f
and the effective aperture area A e f is given by Equation (3):
A e f = G a r λ 2 4 π .
With reference to Equation (3), the received power P R can be rewritten as Equation (4):
P R = P T G a t 4 π d 2 . A = λ 2 ( 4 π d ) 2 . G a t P T G a r
where λ = transmission wavelength.
Thus, the attenuation propagation γ a t t ( f ) (in dB) due to free space can be determined from Equation (4) as given in Equation (5):
γ a t t ( f ) = 20 log ( 4 π d λ ) . = 20 log ( 4 π f c d C s )
where f c and C s are the transmission frequency and light speed, respectively.

2.2. Propagation through the Rain

Rainfall through drops of liquid water is one key dynamic natural occurrence that undesirably attenuates the amplitudes of propagated microwave radio frequency signals in the atmosphere. The attenuation is initiated via scattering and absorption when the propagated electromagnetic waves encounter the showered liquid water droplets of different intensities, natures, and concentrations [53]. While the scattering disseminates the propagated microwave signals, the absorption result rises in molecular energy in correspondence with the atmospheric temperature, which causes a comparable loss of electromagnetic signal energies, particularly at higher frequencies.
The universal power–law model that describes attenuation due to rain is given by Equation (6) [54]:
γ a t t ( r ) = γ r L p a t h
γ r = β ( R r e ) α
where L p a t h (in km) and γ r express the propagation path length and rain rate in Equation (7), respectively. The real channel length ( l ) is related with the distance parameter d s in Equation (8) [55,56]:
d s = 1 0.477 l 0.633 R r e 0.073 ν f c 0.123 10.579 ( 1 exp ( 0.024 l ) ) α
The power-law parameters β and α can be obtained by Equations (9) and (10), respectively:
log β = j = 1 4 ( x j exp [ ( log f c y j z j ) 2 ] ) + m k log f c + z k
log α = j = 1 5 ( x i exp [ ( log f c y i z i ) 2 ] ) + m n log f c + z n
Implementation of rain and gaseous R r e ( mm / h ) expresses the received depth of total water droplets due to rainfall (in mm) divided by the entire shower duration (in hours). It is given by Equation (11):
R r e ( mm / h ) = Total depth of rainfall Entire rainfall duration

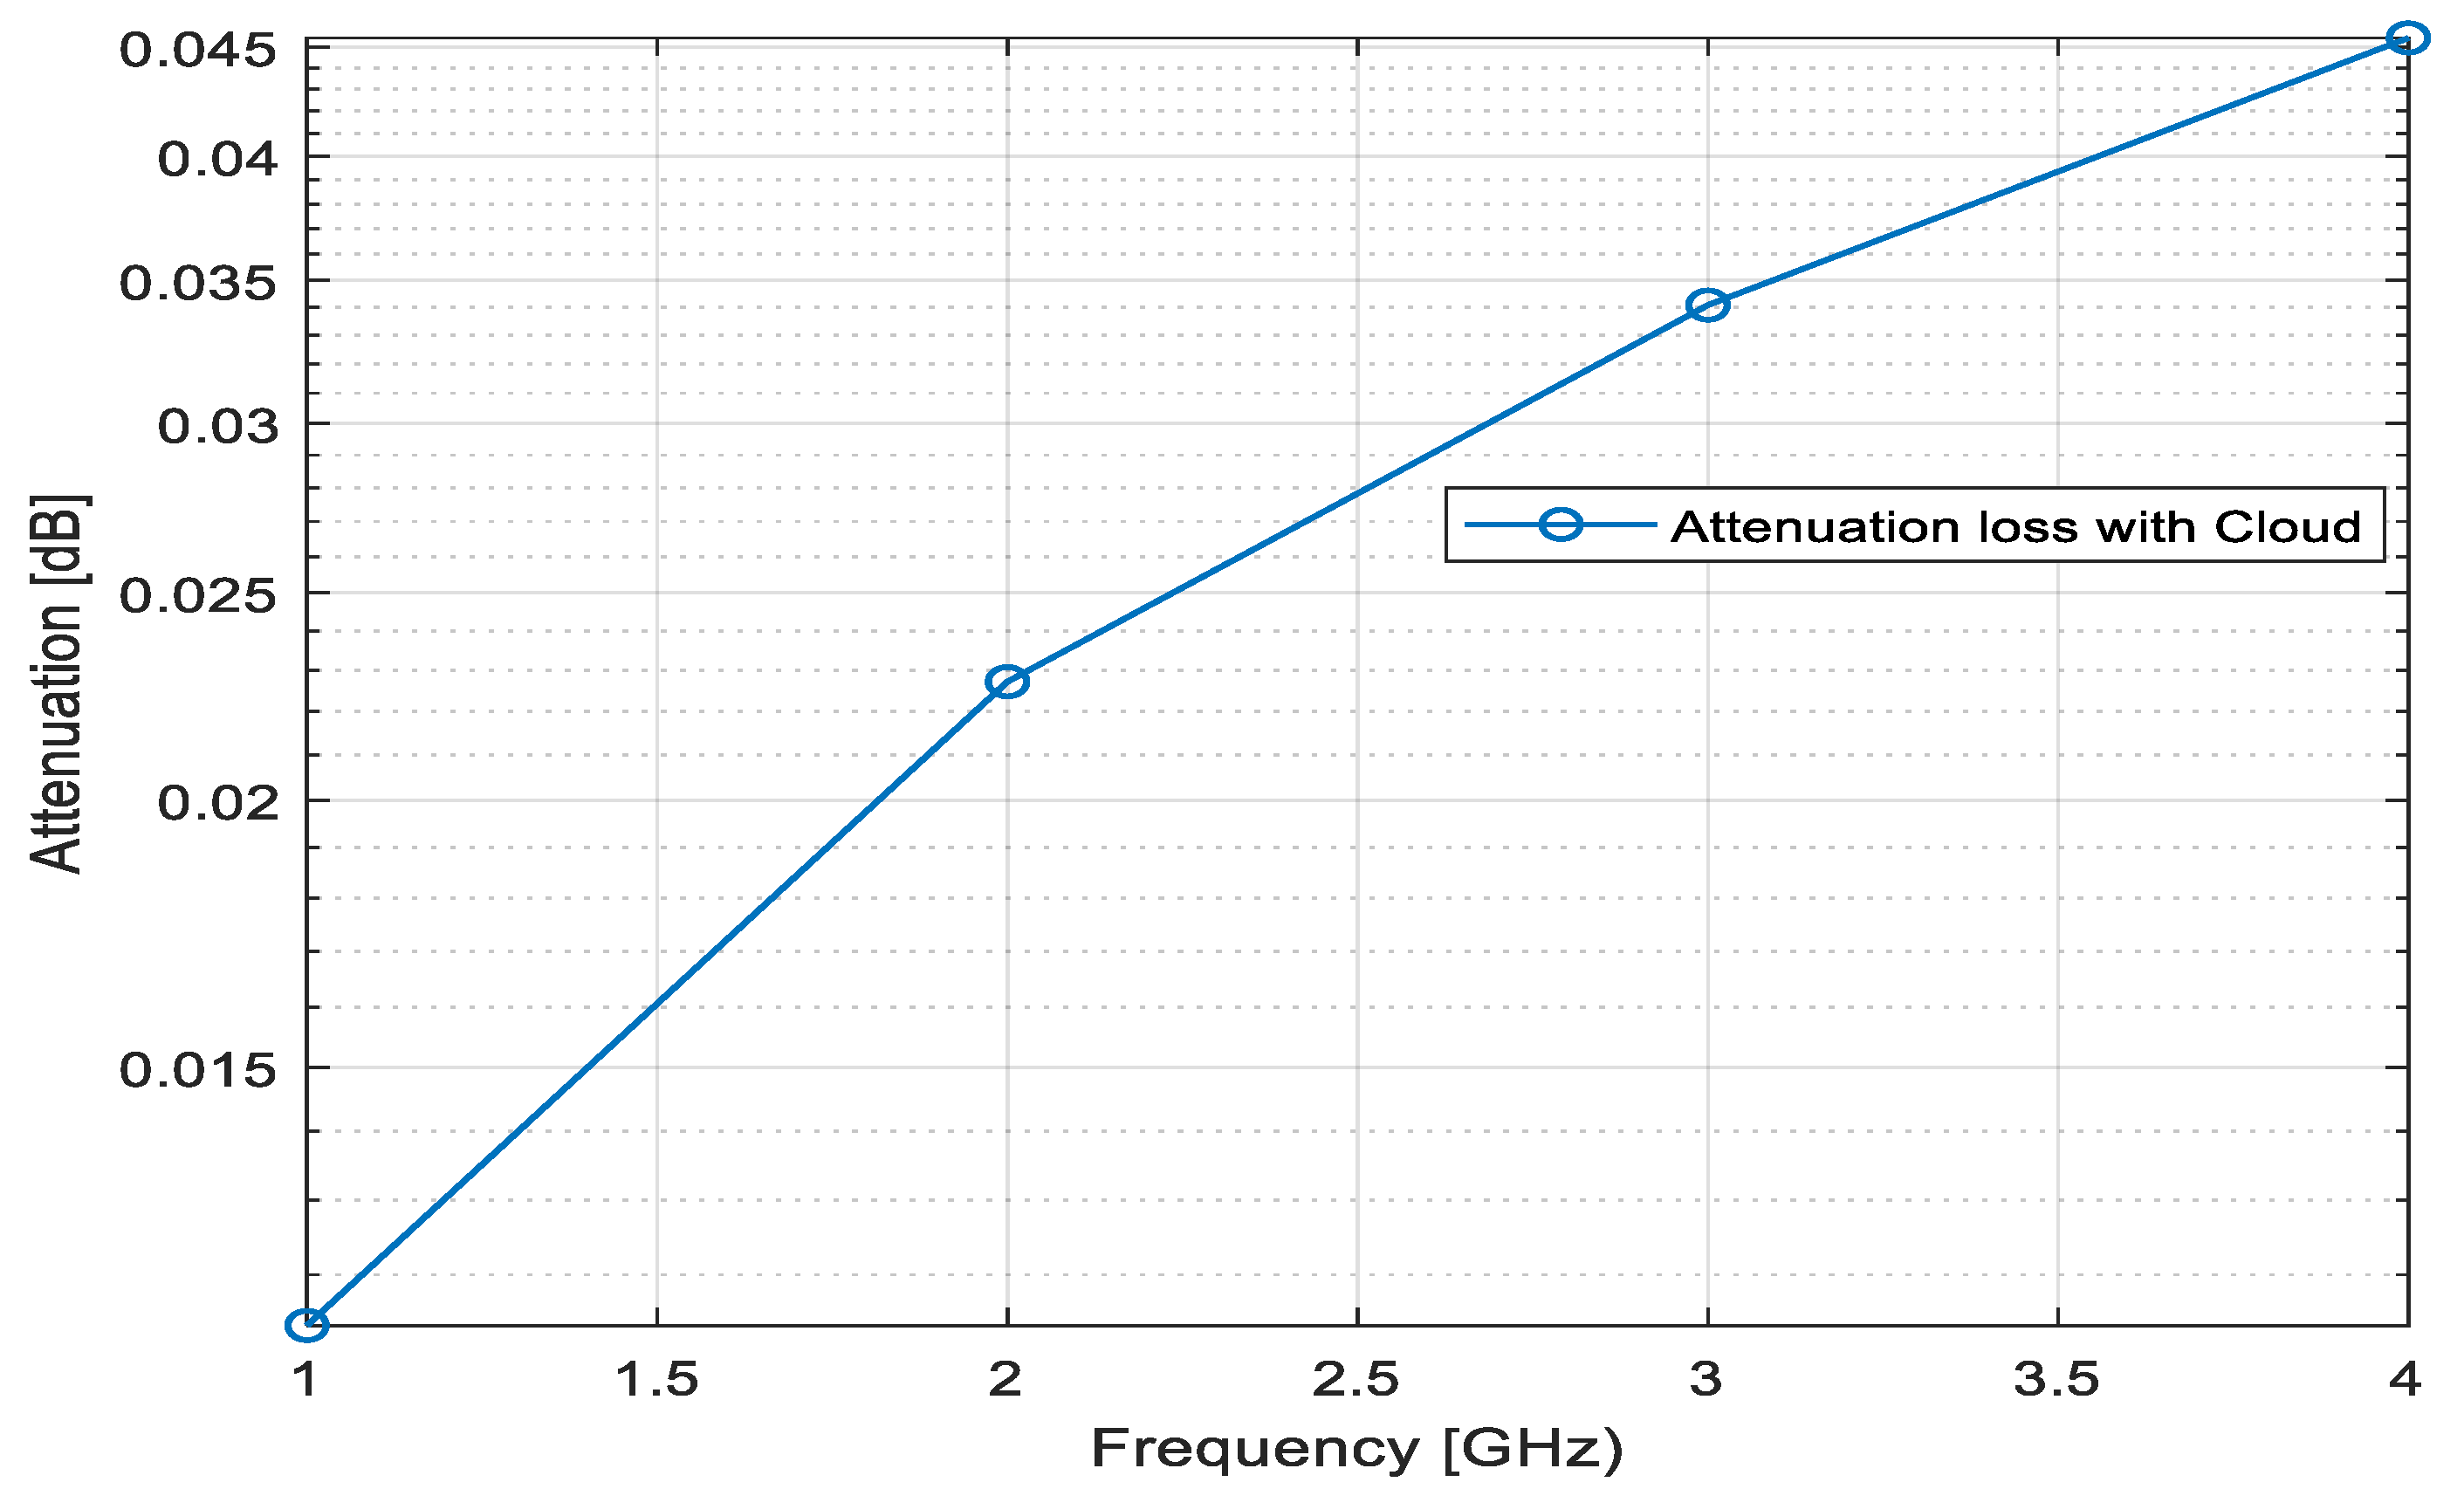
2.3. Propagation through Cloud

Apart from the rain, cloud is another key atmospheric parameter that attenuate the amplitudes of propagated microwave via reflection, absorption, scattering, refraction, and spreading phenomena. It is possible to reliably articulate or quantify attenuation due to a cloud utilizing its liquid contents. Mathematically, it can be conveyed by [57] in Equation (12):
γ a a ( c ) = γ C [ L W C sin ( θ ) ]
where L W C indicates the liquid water content and γ c is given by Equation (13), and its parameters are defined in Equations (14)–(18) as follows.
γ C = 0.819 f c ε [ 1 ( 2 + ε ε ) 2 ]
where:
ε = ε 0 ε 1 1 + ( f c f r p r i ) 2 + ε 1 ε 2 ( f c f r sec ) 2 + ε 2
ε = f c ( ε 0 ε 1 ) f r p r i [ 1 + ( f c f r p r i ) 2 ] + f c ( ε 1 ε 2 ) f r sec [ 1 + ( f c f r sec ) 2 ] + ε 2
ε 0 = 77.6 + 103.3 ( Λ 1 )
f r p r i = 20.09 + 142 ( Λ 1 ) + 294 ( Λ 1 ) 2
f r sec = 590 1500 ( Λ 1 )
where Λ = 330 / T , ε 1 = 5.48 and ε 2 = 3.51 .

2.4. Propagation through Gases

Key components of the atmospheric make-ups are the distribution of various gases at various altitudes, loftiness, and breadths, which also cause some levels of multipath attenuation. The electromagnetic wave attenuation due to atmospheric gases can be estimated for water vapour and dry air using the expressions in Equations (19) and (20) [58]:
γ w p = [ 3.27 x 10 2 r t + 1.67 x 10 3 ρ r t 7 r p + 7.7 x 10 4 f c 0.5 + 3.79 ( f 22.235 ) 2 + 9.8 l r p 2 r t + 3.79 ( f 183.31 ) 2 + 11.85 l r p 2 r t + 4.0 l r t ( f 325.153 ) 2 + 10.44 r p 2 r t ] f c 2 ρ r p r t x 10 4
γ o x = [ 7.27 r t ( f c 2 0.35 l r p 2 r t 2 ) 2 + 4.0 l r t ( f 5.7 ) 2 + 2.44 r p 2 r t 5 ] × f c 2 ρ r p r t x 10 3
where r p = p / 1013 and r t = 288 ( 273 + T ) , T and f c being the temperature and frequency.
The total attenuation due to water vapour and oxygen for up/downlink communication is given by Equation (21):
γ a t t ( g ) = [ h w p γ w p + h o x γ o x sin ( θ ) 2 ]
where θ indicates the elevation angle in the range of: 10 θ 90 .

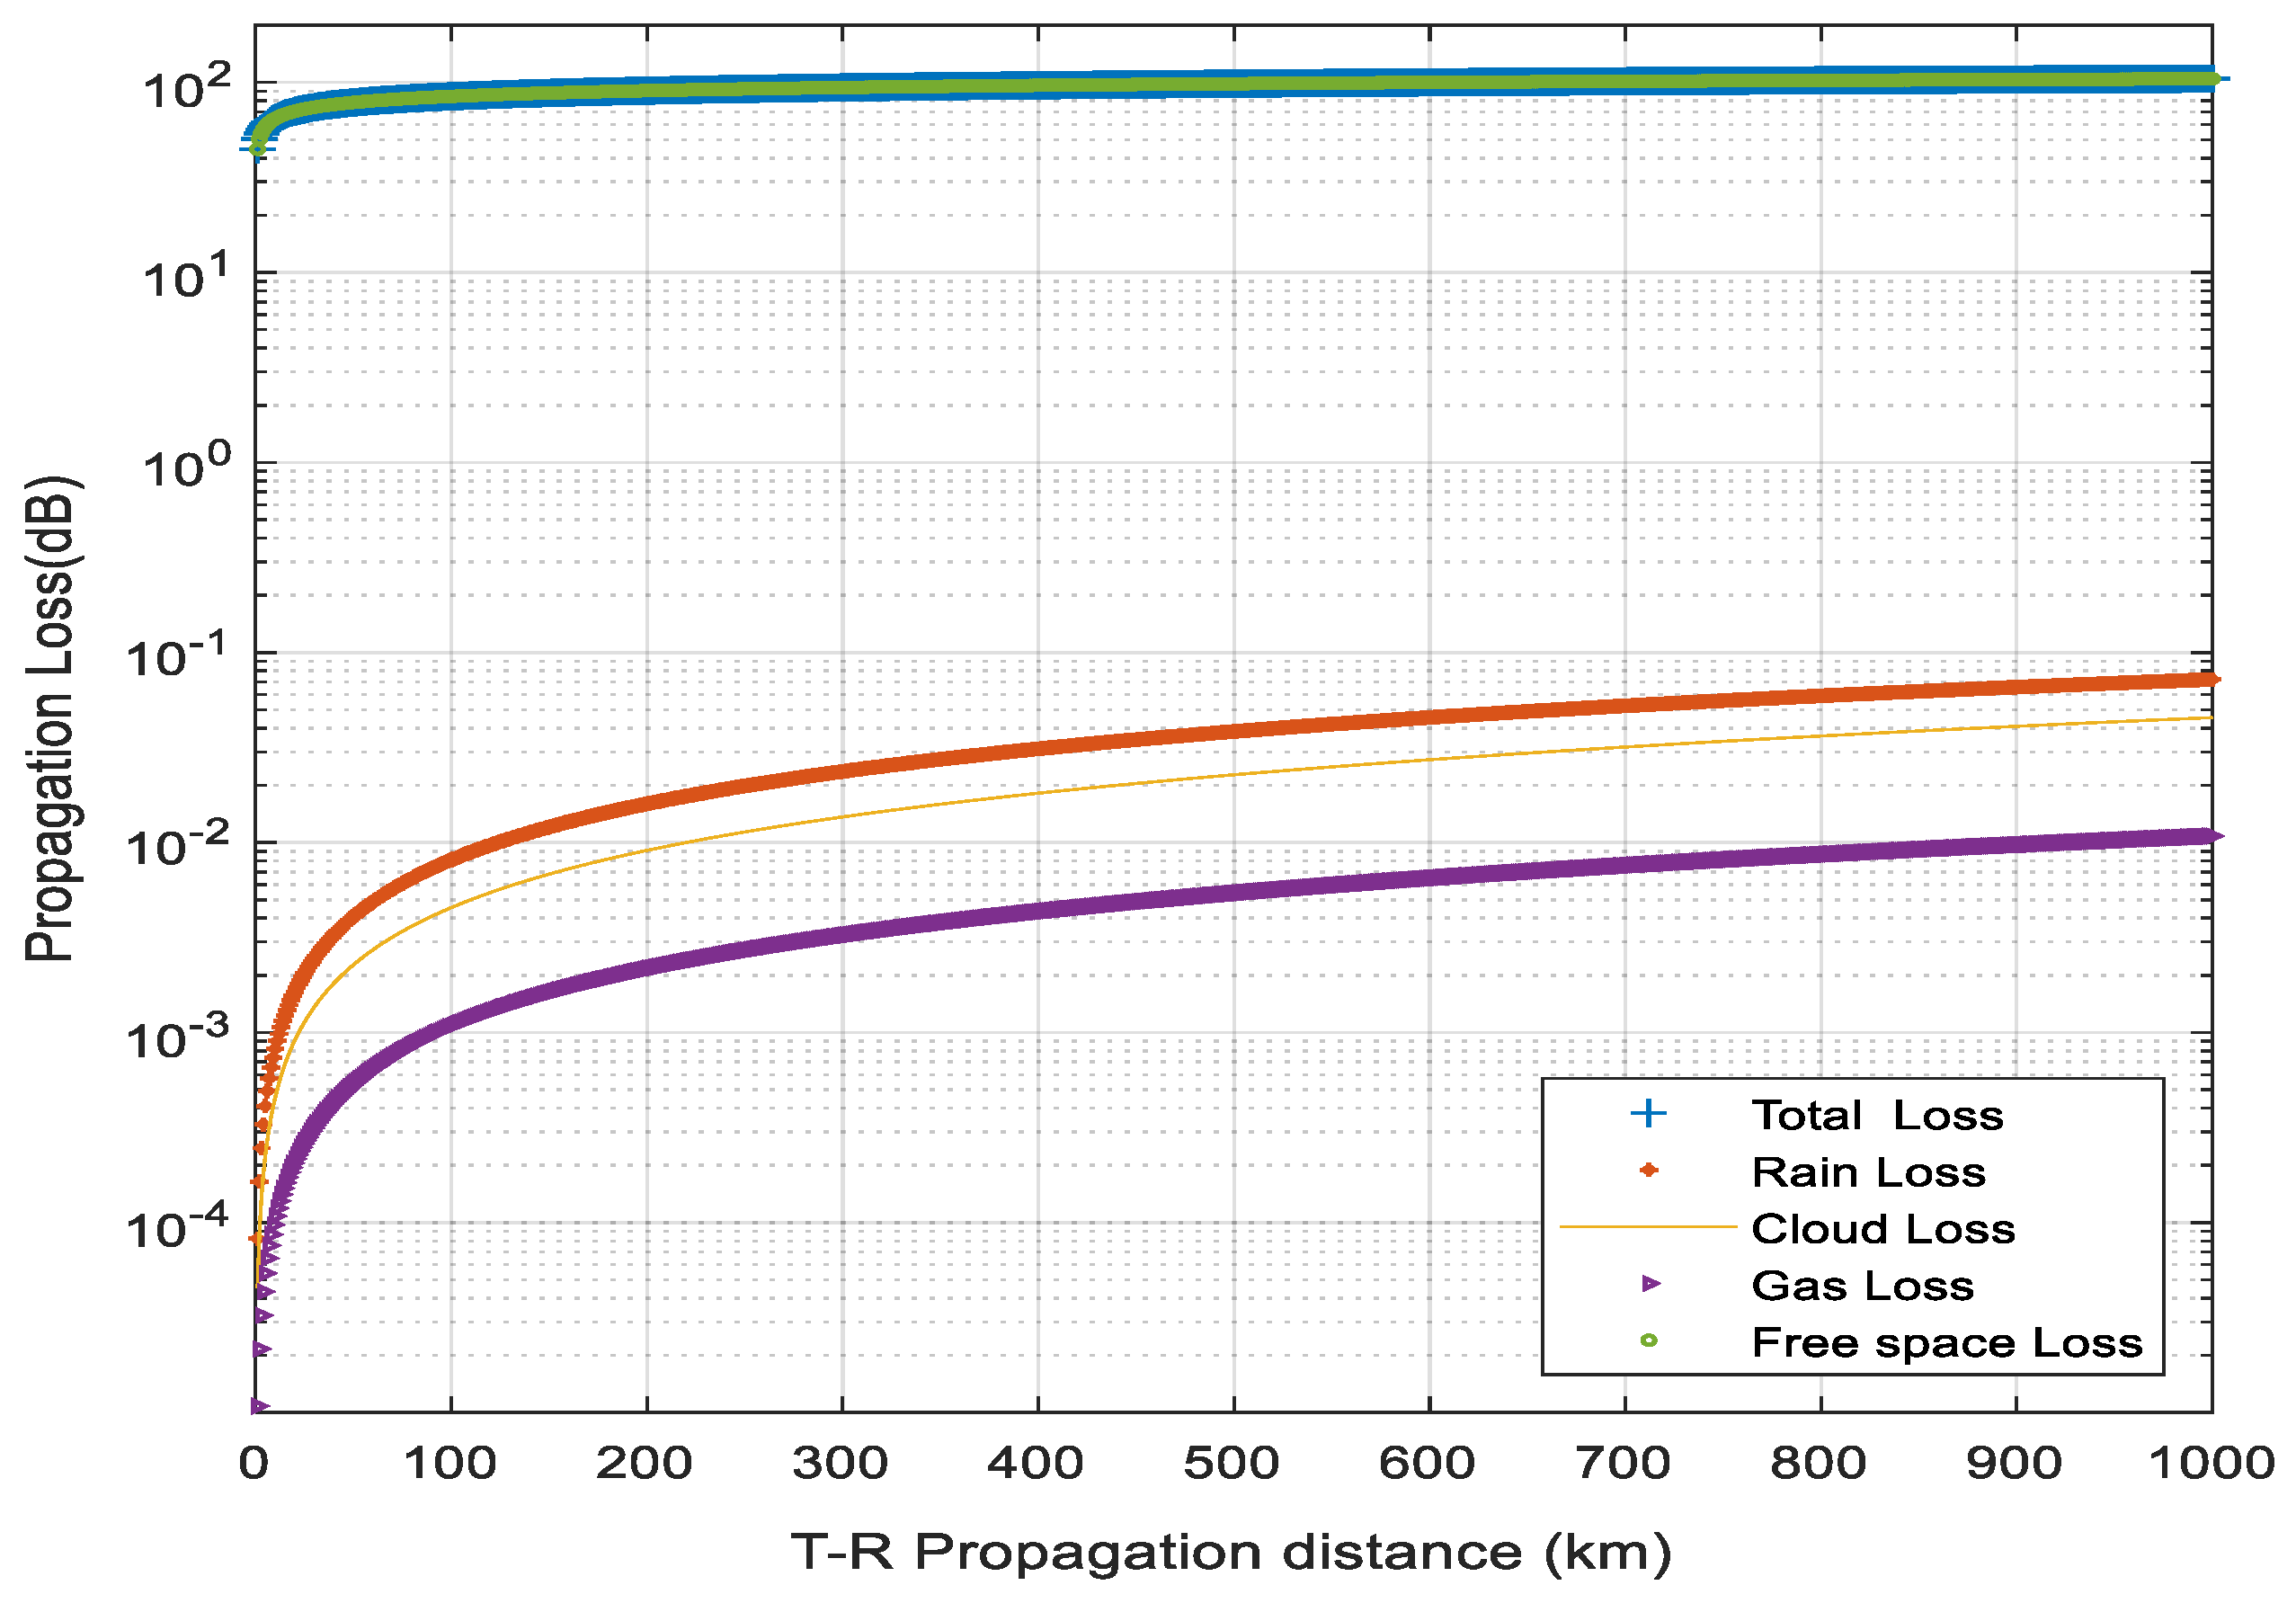
2.5. Total Attenuation Propagation Loss

Total attenuation propagation loss statistics over Earth-satellite and terrestrial communication links are also fundamental in providing the necessary information for the effective design of such links. ITU-R P.618 [44] specifies that the relevant propagation parameters required to compute total attenuation loss also comprise individual attenuations. They are attenuations due to rain, atmospheric gases, cloud, free space, etc. Mathematically, the total attenuation propagation loss γ t o t a l ( a t t ) can be expressed by Equation (22):
γ t o t a l ( a t t ) = γ a t t ( f ) + γ a t t ( r ) + γ a t t ( c ) + γ a t t ( g )
where γ a t t ( f ) , γ a t t ( r ) , γ a t t ( c ) , γ a t t ( g ) are the respective individual attenuation losses due to free space, rain, gases, and cloud, all of which are defined in the expressions in Equations (5), (6), (12) and (21).

2.6. The Computational Complexity of the Proposed Framework

A computational modelling framework is not considered intrinsically difficult if its solution or implementation requires fewer essential resources (e.g., amount of time, storage) needed for implementation, regardless of the algorithm being used.
Generally, all propagated radio wave and microwave attenuation modelling is implemented using long-distance models [5,13]. Thus, the computational semi-empirically based models employed in this paper, as revealed in Equations (5)–(22), are mainly long-distance models, in the form of the expression in (23):
log 10 F ( n ) = a log 10 n
where the a expresses the modelling coefficients and n indicates the parameters of input size.
In terms of time computation complexity estimation, the expression in (23) follows the rule defined in (24):
t n = a log 10 n O log ( n )
Here, the big-0 notation in Equation (24) is used to explain the upper bound running time or memory usage (space) of the implementation algorithm employed in this paper. The O log ( n ) means that the complexity running time of the implementation algorithm grows in proportion to the logarithm of the given input size n. This result is in line with the parameterized complexity estimation technique explored in [59], wherein complexity analysis depends on various parameters of the given output or input.

3. Materials and Methods

The computation-based modeling of radio wave attenuation over the atmosphere is the stepwise application of relevant radio propagation models, data, and procedures to effectively and prognostically estimate the losses of the propagated radio signals that have been induced by the atmospheric constituents.
A semi-empirically based method that combines empirical atmospheric data and appropriate signal attenuation propagation models has been engaged in this study. The MATLAB software interface platform has been explored to accomplish the computerized coding of scripts, computations, and extrapolative graphical display of the results obtained from experimental measurements. Moreover, the extrapolative attenuation estimation results and the performance analysis have been accomplished by engaging different computation and modeling parameters from those often utilized in Earth–satellite and terrestrial communications.

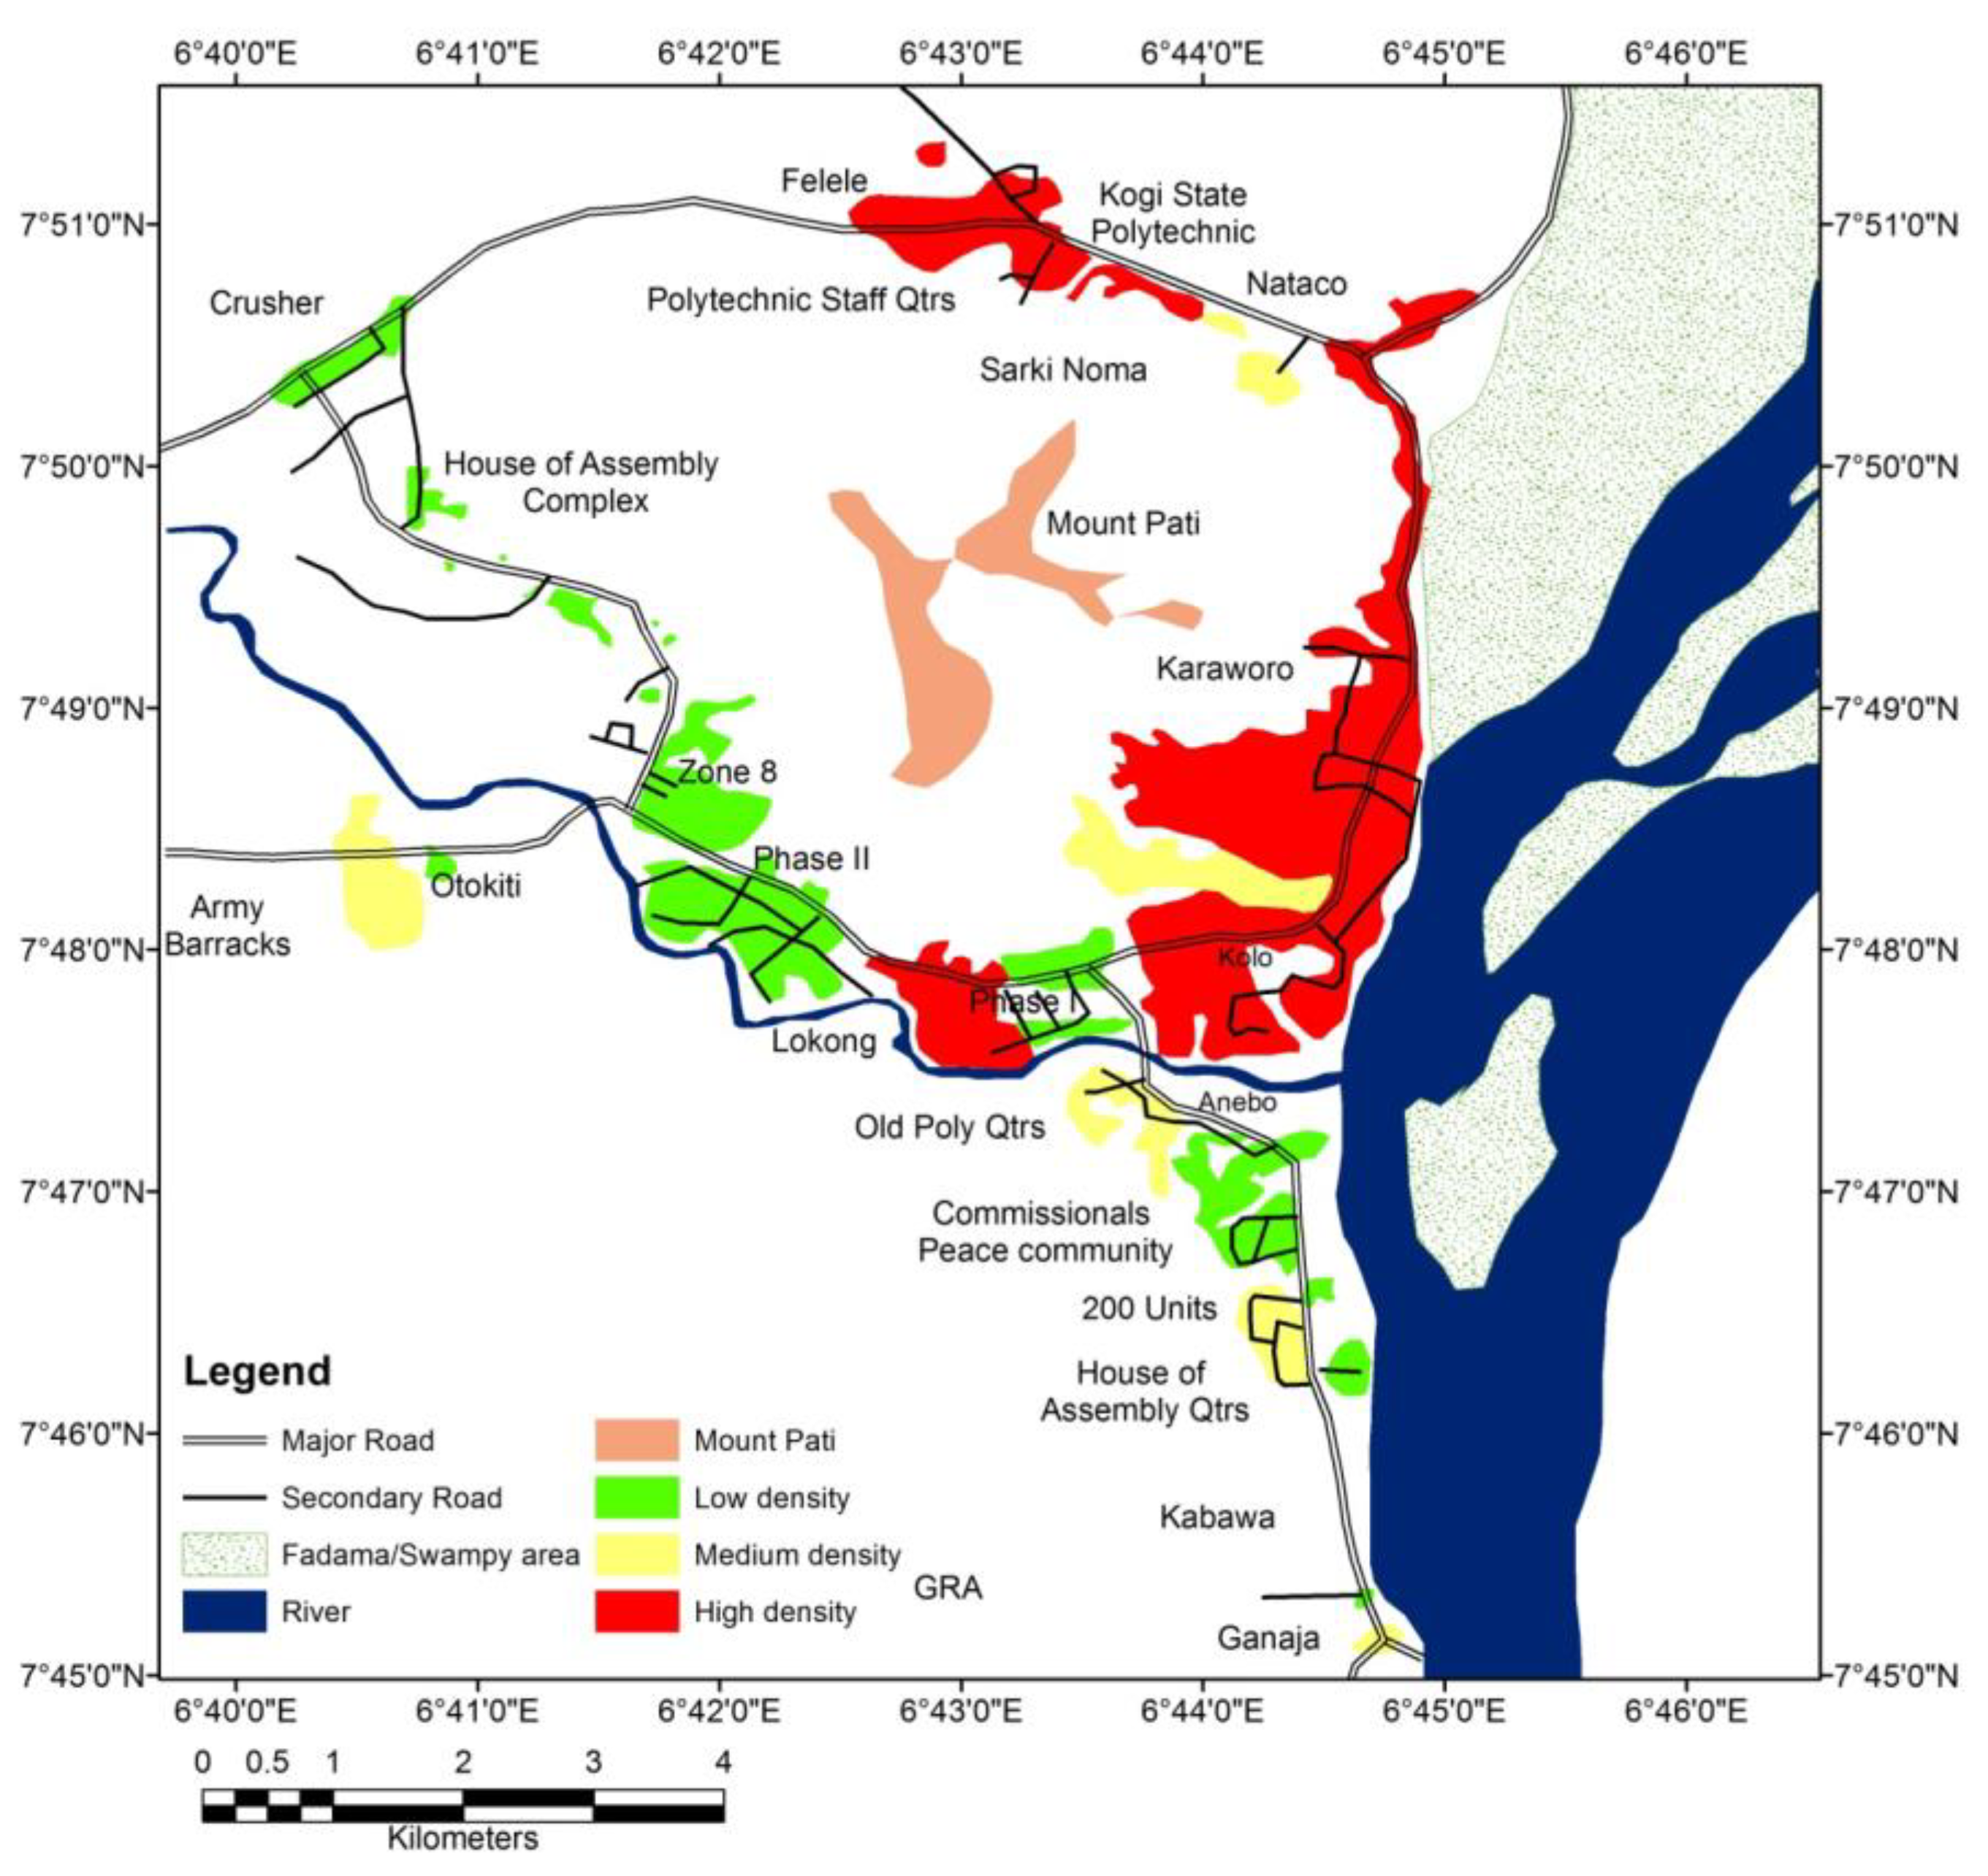
3.1. Description of Study Location

Lokoja, the river port and capital city of Kogi State in south-central (middle-belt) Nigeria, was used as a study location. The Kogi state capital is located on longitude and latitude 6°44′25″ E and latitude 7°47′48″ N of the Greenwich Meridian. Lokoja has a tropical wet and dry savanna climate. Additionally, Lokoja is bounded by the two main big rivers, Niger and Benue, as displayed in Figure 2. Historically, Lokoja was founded in 1860 by the Scottish explorer William Balfour Baikie after the British merchants established a trading post at the river Benue-Niger confluence. The city has 63.82 sq. km of total land coverage area [60] and has become the core hub of migration between southern and northern Nigeria.
Most times, the city’s foremost stresses and shocks are unrestrained rain, the constant rise in water levels, floods with gully erosions, and wind storms. In 2012 and 2018, several deaths were recorded, with about 2000 displaced persons due to excessive flooding from the Niger and Benue rivers. In addition, transportation along some major roads and highways was affected, thus resulting in interruption of the movement of people and distribution of goods and services in the surrounding cities, particularly Abuja and Benin. The region is also exceptionally hot during the dry season, with temperatures ranging between 37–41 °C. Mountains and hills surround the area. One well-known mountain in the heart of the built-up Lokoja city is Mount Pati, and it is about 750 m above sea level. This study location is appropriate for atmospheric raw data collection due to its geographical location with tropical wet and dry seasons in Nigeria.

3.2. Method of Data Collection

The raw rainfall, cloud and atmospheric gases dataset, and other parameters used to conduct the detailed prognostic evaluation of total radio wave propagation attenuation losses in this study, were collected entirely from the Nigerian Meteorological Agency (NIMET). It is the leading Nigerian government agency equipped with the appropriate facilities and charged with the responsibility to robustly monitor and collect data on all areas of meteorology for policy formulation, planning, guidance, and decision making. The agency also prepares, projects, and provides weather (and climate) information needed for aircraft safety and related operations.
Specifically, the 12-year atmospheric datasets from 2008 to 2020 contain monthly rainfall depth, rainy days, minimum temperature, average temperature, maximum temperature, average snowfall, average pressure, wind speed, and average temperature and humidity. Figure 3 and Figure 4 show the mean yearly rainfall depths and the humidity percentage values for the study location.
The agency has workstations over the country. The average precipitation data in depth is collected yearly using an electronic data logger such as the tipping-bucket rain gauge and weather radar, which measure the rainfall millimetres and other atmospheric variables over twenty hours. Remarkably, the tipping-bucket is a specialized automatic mechanical device used by this agency to measure the amount of rainfall in increments of approximately 0.25 mm, on one tip and at a detached point with a collection pail and funnel, which is usually positioned at an uncluttered geographical point. With the aid of a connecting wireless transceiver, the rainfall depth can be recorded at each ‘tip’. The tipping bucket rain gauge is designed to measure the depth of the rainfall in terms of precipitated water height accumulated by the gauge per given time. Once an equivalent of about 0.25 mm of rainfall has been collected employing the bucket at the pivot level, it is emptied (i.e., tipped off).

4. Results and Discussion

The computations and extrapolative graphical display of the results are implemented and highlighted briefly in this section. During rainfall incidents, the depth of rainfall, strength, and amount can continually change from very heavy to light or vice versa. The amount of rain that falls per unit of time can sometimes be light and for a long duration. Sometimes, it can be moderate, with a very long duration, and moderate or long in duration and heavy. It can also be short in duration and very heavy, or long in duration and heavy. When long-lasting and heavy rainfall, it can lead to rapid attenuations and total degradation of radio and microwave signals, which is usually very unpleasant at the user equipment terminal. Rainfall rate value plots in Figure 5 reveal the quantity of rain that has fallen in depth levels per the duration of fall in mm/h in the study location from 2008 to 2020. The rain rate values were classified as light, moderate and very heavy based on the acquired depths of the rainfall data. As expected, the plots show a one-to-one relationship as greater rain depths result in greater rain rates. Greater rain depths mean greater rain rate intensities due to larger shower droplets. The moderate and heavy rain intensities are recorded for the wetter and wettest months, between April to June and July to September.
The displayed results of Figure 6 show that rain attenuation levels increase in correspondence with an increase in the frequency values. This result reveals that the most severe attenuation effects during rainfall are at a higher percentage at higher frequencies. The attenuation levels are seen in each graph. Additionally, results reveal that rain depth due to different water droplets during fall is a significant factor. While moderate and heavy rain depths achieved a mean of 3 dB and 4 dB attenuations, respectively, the attenuation due to light rainfall attained a 2.5 dB level.
The signal propagation degradation versus path elevation angle for light, moderate and heavy rain rates are shown in Figure 7. The graphical plot discloses higher attenuations at lower path elevation angles, but particularly for heavy rain rates compared to others. This trend implies that the attained attenuation intensities from the atmospheric impairment effects due to rain are directly proportional to the signal quality degradation, especially as the depth of rainwater droplets increases. Still, there is an exception to the angle of elevation, which is inversely proportional.
Figure 8 shows the various attenuation intensities achieved owing to the respective acquired mean rain rates of 29.27, 73.71, and 105.39 mm/h versus varied tilt angles. The tilt angle expresses the polarization ellipse between the x-axis and semi-major axes. It is observed that a 0.35 dB attenuation loss is obtained for 29.27 mm/h rain rates at the range of −90° to −61° tilt angles. For rain rates of 73.71 and 105.39 mm/h, the attenuation values increased to 0.5.6 and 0.58, respectively, at the same tilt angle range. The highest attenuations value attainment can be for mean rain rates of 29.27, 73.71, and 105.39 mm/h at a 0° tilt angle. However, the attenuation level decreases drastically as the tilt angle increases from 0° to higher values.
The specific attenuation values resulting from atmospheric gases and cloud impairment effects versus carrier transmission in the range of 1GHz to 4 GHz are shown in Figure 9 and Figure 10. The plotted results were achieved by employing the following atmospheric parameters: T = 293 K, P = 101.300 kPa, water vapour density = 3, and p = 7.5/gm. An increasing attenuation loss trend can be seen in each figure at higher frequencies. This result implies fewer atmospheric impairments at lower frequencies. Generally, the lower the frequency of radio signal transmission, the higher the communication distance due to higher wavelength.
Total propagated electromagnetic signal attenuation losses over various atmosphere components, including cloud, gases, rain, and free space versus varied transmission distances, are shown in Figure 11. The graphs reveal that attenuation loss due to free space is more dominant from the total computed loss values. This result is followed by rain rate attenuation, then atmospheric gases and cloud values. These results also revealed that attenuation intensity levels induced by atmospheric gases, rain, and cloud effects are less than levels induced by free space. For example, while moderate and heavy rain depths achieved 3 dB and 4 dB attenuations, the attenuation due to light rainfall attained a 2.5 dB level. Even at a lower T-R distance, the acquired attenuation values are as high as 78.23 dB in free space.
As stated earlier, the resultant effects of totally natural and artificial blockades are high attenuation, slow/fast deterioration and steady losses in the intensities of the transmitted waves in space. For a carrier frequency of 3.5 GHz, a transmission power of 43 dB, receiver/transmitter cable losses of 5 dB, and a transmitter and receiver gain of 15 dB, the high attenuation and slow deteriorating power attained due to the natural and manufactured blockades, particularly atmospheric impairment-induced ones, versus distance plot is revealed in Figure 11. For example, slow fluctuations (attenuation) occur when atmospheric precipitation particles, particularly rainwater droplets, absorb, disperse, and scatter the amplitude and energy of transmitted electromagnetic signals in the Earth–satellite and terrestrial communication links. The received signal power quality at the user equipment reduces when the attenuation losses over the communication link also increase. The attenuated signal power plot versus T-R propagation distance is depicted in Figure 12.

5. Conclusions

Cellular mobile network operators often explore point-to-area radio wave connections in the telecom industry for their terrestrial network deployment. The focus of this research contribution was geared towards conducting a robust empirically based prognostic modeling of different attenuation impacts on key atmospheric impairment variables. These variables are mainly cloud, rain, gases, and free space at ultra-high frequencies over terrestrial cellular communication links. Firstly, the motivation was to employ relevant empirical atmospheric data and their appropriate propagation models for prognostic modeling. Secondly, the extrapolative attenuation estimation results and the performance analysis were accomplished by engaging different stepwise propagation models and computation parameters often utilized in Earth–satellite and terrestrial communications. Steady attenuation loss levels rise in correspondence with increasing signal carrier frequency, and free space is more dominant. The results noticeably showed that the attenuation levels attained due to rain, cloud, atmospheric gases, and free space depend on droplet depths, sizes, composition, and statistical distributions. The results also revealed that the attained attenuation intensities from the atmospheric impairment effects are directly proportional to the signal quality degradation at increasing propagation distances. This trend defines the trend of results except for an angle of elevation, which is inversely proportional. Generally, the results revealed that atmospheric impairment-induced attenuation is the prominent source of signal degradations on the microwave communication channels, particularly at higher frequencies of operations. Our future work would focus on optimizing the projected models for optimal performance.

Author Contributions

The manuscript was written through the contributions of all authors. J.I. was responsible for the conceptualization of the topic; article gathering and sorting were carried out by J.I., A.L.I. and S.O.; manuscript-writing and original drafting and formal analysis were carried out by J.I., A.L.I., S.O., C.-C.L. and C.-T.L.; writing of reviews and editing were carried out by J.I., A.L.I., S.O., C.-C.L. and C.-T.L.; and J.I. led the overall research activity. All authors have read and agreed to the published version of the manuscript.

Funding

This research received no external funding.

Institutional Review Board Statement

Not applicable.

Informed Consent Statement

Not applicable.

Data Availability Statement

The data that supports the findings of this paper is available from the corresponding author upon reasonable request.

Acknowledgments

The work of Agbotiname Lucky Imoize is supported by the Nigerian Petroleum Technology Development Fund (PTDF) and the German Academic Exchange Service (DAAD) through the Nigerian–German Postgraduate Program under grant 57473408.

Conflicts of Interest

The authors declare no conflict of interest related to this work.

References

  1. Furqan, M.; Goswami, B. Satellite Communication Networks. In Handbook of Real-Time Computing; Tian, Y.-C., Levy, D.C., Eds.; Springer: Singapore, 2020; pp. 1–22. [Google Scholar] [CrossRef]
  2. Zhang, C.; Jiang, C.; Kuang, L.; Jin, J.; He, Y.; Han, Z. Spatial Spectrum Sharing for Satellite and Terrestrial Communication Networks. IEEE Trans. Aerosp. Electron. Syst. 2019, 55, 1075–1089. [Google Scholar] [CrossRef]
  3. Schirru, L.; Ledda, F.; Lodi, M.B.; Fanti, A.; Mannaro, K.; Ortu, M.; Mazzarella, G. Electromagnetic Field Levels in Built-up Areas with an Irregular Grid of Buildings: Modeling and Integrated Software. Electronics 2020, 9, 765. [Google Scholar] [CrossRef]
  4. Yang, F.; Duan, X.; Guo, Q.; Lu, S.; Hsu, K. The spatiotemporal variations and propagation of droughts in Plateau Mountains of China. Sci. Total Environ. 2022, 805, 150257. [Google Scholar] [CrossRef] [PubMed]
  5. Isabona, J.; Imoize, A.L. Terrain-based adaption of propagation model loss parameters using non-linear square regression. J. Eng. Appl. Sci. 2021, 68, 1–19. [Google Scholar] [CrossRef]
  6. Ojuh, D.O.; Isabona, J. Field Electromagnetic Strength Variability Measurement and Adaptive Prognostic Approximation with Weighed Least Regression Approach in the Ultra-high Radio Frequency Band. Int. J. Intell. Syst. Appl. 2021, 13, 14–23. [Google Scholar] [CrossRef]
  7. Isabona, J. Wavelet Generalized Regression Neural Network Approach for Robust Field Strength Prediction. Wirel. Pers. Commun. 2020, 114, 3635–3653. [Google Scholar] [CrossRef]
  8. Ebhota, V.C.; Isabona, J.; Srivastava, V.M. Environment-Adaptation Based Hybrid Neural Network Predictor for Signal Propagation Loss Prediction in Cluttered and Open Urban Microcells. Wirel. Pers. Commun. 2018, 104, 935–948. [Google Scholar] [CrossRef]
  9. Moupfouma, F. Rain induced attenuation prediction model for terrestrial and satellite-Earth microwave links. Ann. Telecommun. 1987, 42, 539–550. [Google Scholar] [CrossRef]
  10. Afahakan, I.; Udofia, K.; Umoren, M. Analysis of Rain Rate and Rain Attenuation for Earth-Space Communication Links over Uyo-Akwa Ibom State. Niger. J. Technol. 2015, 35, 137. [Google Scholar] [CrossRef] [Green Version]
  11. Hassan, N.U.L.; Huang, C.; Yuen, C.; Ahmad, A.; Zhang, Y. Dense small satellite networks for modern terrestrial communication systems: Benefits, infrastructure, and technologies. IEEE Wirel. Commun. 2020, 27, 96–103. [Google Scholar] [CrossRef]
  12. Barclay, L. Propagation of Radiowaves; IET: London, UK, 2003; Volume 502. [Google Scholar]
  13. Ekpenyong, M.; Umoren, E.; Isabona, J. A Rain Attenuation Model for Predicting Fading Effect on Wireless Communication Systems in the Tropics. Niger. J. Sp. Res. 2009, 6, 21–32. [Google Scholar]
  14. Linga, P.; Iddi, H.; Kissaka, M. Contour Mapping for Rain Rate and Rain Attenuation in Microwave and Millimetre Wave Earth-Satellite Link Design in Tropical Tanzania. Tanzania J. Sci. 2020, 46, 886–902. [Google Scholar]
  15. Abdulrahman, A.Y.; Rahman, T.B.A.; Rahim, S.K.B.A.; Islam, R.U. A new rain attenuation conversion technique for tropical regions. Prog. Electromagn. Res. B 2010, 26, 53–67. [Google Scholar] [CrossRef] [Green Version]
  16. Rimven, G.R.; Paulson, K.S.; Bellerby, T. Estimating One-Minute Rain Rate Distributions in the Tropics from TRMM Satellite Data (October 2017). IEEE J. Sel. Top. Appl. Earth Obs. Remote Sens. 2018, 11, 3660–3667. [Google Scholar] [CrossRef]
  17. Han, H.; Zhao, J.; Niyato, D.; Di Renzo, M.; Pham, Q.-V. Intelligent Reflecting Surface Aided Network: Power Control for Physical-Layer Broadcasting. In Proceedings of the ICC 2020-2020 IEEE International Conference on Communications (ICC), Dublin, Ireland, 7–11 June 2020. [Google Scholar] [CrossRef]
  18. Wu, Q.; Zhang, R. Intelligent Reflecting Surface Enhanced Wireless Network via Joint Active and Passive Beamforming. IEEE Trans. Wirel. Commun. 2019, 18, 5394–5409. [Google Scholar] [CrossRef] [Green Version]
  19. Wu, Q.; Zhang, R. Towards Smart and Reconfigurable Environment: Intelligent Reflecting Surface Aided Wireless Network. IEEE Commun. Mag. 2020, 58, 106–112. [Google Scholar] [CrossRef] [Green Version]
  20. Imoize, A.; Adedeji, O.; Tandiya, N.; Shetty, S. 6G Enabled Smart Infrastructure for Sustainable Society: Opportunities, Challenges, and Research Roadmap. Sensors 2021, 21, 1709. [Google Scholar] [CrossRef]
  21. Diamanti, M.; Charatsaris, P.; Tsiropoulou, E.E.; Papavassiliou, S. The Prospect of Reconfigurable Intelligent Surfaces in Integrated Access and Backhaul Networks. IEEE Trans. Green Commun. Netw. 2021. [Google Scholar] [CrossRef]
  22. Zhou, S.; Xu, W.; Wang, K.; Di Renzo, M.; Alouini, M.-S. Spectral and Energy Efficiency of IRS-Assisted MISO Communication with Hardware Impairments. IEEE Wirel. Commun. Lett. 2020, 9, 1366–1369. [Google Scholar] [CrossRef]
  23. Taha, A.; Alrabeiah, M.; Alkhateeb, A. Enabling Large Intelligent Surfaces with Compressive Sensing and Deep Learning. IEEE Access 2021, 9, 44304–44321. [Google Scholar] [CrossRef]
  24. Qin, Z.; Ye, H.; Li, G.Y.; Juang, B.-H.F. Deep Learning in Physical Layer Communications. IEEE Wirel. Commun. 2019, 26, 93–99. [Google Scholar] [CrossRef] [Green Version]
  25. Yang, Z.; Chen, M.; Wong, K.-K.; Poor, H.V.; Cui, S. Federated Learning for 6G: Applications, Challenges, and Opportunities. Engineering 2021, 8, 33–41. [Google Scholar] [CrossRef]
  26. Kestwal, M.C.; Joshi, S.; Garia, L.S. Prediction of Rain Attenuation and Impact of Rain in Wave Propagation at Microwave Frequency for Tropical Region (Uttarakhand, India). Int. J. Microw. Sci. Technol. 2014, 2014, 1–6. [Google Scholar] [CrossRef] [Green Version]
  27. Linga, P.H.; Iddi, H.U.; Kissaka, M. Rain attenuation distribution for satellite microwave links application in Tanzania. Indones. J. Electr. Eng. Comput. Sci. 2020, 17, 982–987. [Google Scholar] [CrossRef] [Green Version]
  28. Marzuki, D.K.H.; Harysandi, D.K.; Oktaviani, R.; Meylani, L.; Vonnisa, M.; Harmadi, H.; Hashiguchi, H.; Shimomai, T.; Luini, L.; Nugroho, S.; et al. ITU-R P. 837-6 and ITU-R P. 837-7 performance to estimate indonesian rainfall. TELKOMNIKA (Telecommun. Comput. Electron. Control.) 2020, 18, 2292–2303. [Google Scholar] [CrossRef]
  29. Bhattacharya, R.; Das, R.; Guha, R.; Barman, S.D.; Bhattacharya, A.B. Variability of millimetrewave rain attenuation and rain rate prediction: A survey. Indian J. Radio Space Phys. 2007, 36, 325–344. [Google Scholar]
  30. Maitra, A.; Chakraborty, S. Cloud Liquid Water Content and Cloud Attenuation Studies with Radiosonde Data at a Tropical Location. J. Infrared Millim. Terahertz Waves 2009, 30, 367–373. [Google Scholar] [CrossRef]
  31. Adhikari, A.; Bhattacharya, A.; Maitra, A. Rain-Induced Scintillations and Attenuation of Ku-Band Satellite Signals at a Tropical Location. IEEE Geosci. Remote Sens. Lett. 2012, 9, 700–704. [Google Scholar] [CrossRef]
  32. Huang, J.; Gong, S.; Cai, B. The frequency scaling ratio factor of rain attenuation in Ka waveband along earth-space path in China. In Proceedings of the 2011 Second International Conference on Mechanic Automation and Control Engineering, Inner Mongolia, China, 15–17 July 2011; pp. 7831–7833. [Google Scholar]
  33. Ahuna, M.N.; Afullo, T.; Alonge, A. 30-Second and One-Minute Rainfall Rate Modelling and Conversion for Millimetric Wave Propagation in South Africa. SAIEE Afr. Res. J. 2016, 107, 17–29. [Google Scholar] [CrossRef]
  34. Owolawi, P.A.; Malinga, S.J.; Afullo, T.J.O. Estimation of terrestrial rain attenuation at microwave and millimeter wave signals in South Africa using the ITU-R model. In Proceedings of the Progress in Electromagnetic Research Symposium, PIERS, Kuala Lumpur, Malaysia, 27–30 March 2012.
  35. Ojo, J.; Owolawi, P. Development of one-minute rain-rate and rain-attenuation contour maps for satellite propagation system planning in a subtropical country: South Africa. Adv. Space Res. 2014, 54, 1487–1501. [Google Scholar] [CrossRef]
  36. Sumbiri, D.; Afullo, T.J.O.; Alonge, A. Rain attenuation prediction for terrestrial links at microwave and millimeter bands over Rwanda. In Proceedings of the 2016 Progress in Electromagnetic Research Symposium (PIERS), Shangai, China, 8–11 August 2016; pp. 4233–4236. [Google Scholar]
  37. Sumbiri, D.; Afullo, T.J.; Alonge, A.A. Rainfall Zoning and Rain Attenuation Mapping for Microwave and Millimetric Applications in Central Africa. Int. J. Commun. Antenna Propag. (IRECAP) 2016, 6, 198. [Google Scholar] [CrossRef]
  38. Shrestha, S.; Choi, D.-Y. Rain Attenuation Study over an 18 GHz Terrestrial Microwave Link in South Korea. Int. J. Antennas Propag. 2019, 2019, 1–16. [Google Scholar] [CrossRef] [Green Version]
  39. Rose, T.; Czekala, H. RPG-RATPRO Radiometer Operating Manual (Version 7.70); Technical Report; Radiometer Physics GmbH: Meckenheim, Germany, 2009. [Google Scholar]
  40. Grábner, M.; Kvicera, V.; Kostelecky, J. Application of Water Vapour Profiling for Gaseous Attenuation Estimation–Radiometer versus Radiosonde Results. Radio Science. 2009. Available online: https://agupubs.onlinelibrary.wiley.com/doi/10.1029/2020RS007093 (accessed on 10 February 2022).
  41. Ben-Daoud, A.; Ben-Daoud, M.; Moroșanu, G.A.; Rabet, S.M. The use of low impact development technologies in the attenuation of flood flows in an urban area: Settat city (Morocco) as a case. Environ. Chall. 2021, 6, 100403. [Google Scholar] [CrossRef]
  42. Christofilakis, V.; Tatsis, G.; Chronopoulos, S.K.; Sakkas, A.; Skrivanos, A.G.; Peppas, K.P.; Nistazakis, H.E.; Baldoumas, G.; Kostarakis, P. Earth-to-Earth Microwave Rain Attenuation Measurements: A Survey On the Recent Literature. Symmetry 2020, 12, 1440. [Google Scholar] [CrossRef]
  43. Christofilakis, V.; Tatsis, G.; Lolis, C.J.; Chronopoulos, S.K.; Kostarakis, P.; Bartzokas, A.; Nistazakis, H.E. A rain estimation model based on microwave signal attenuation measurements in the city of Ioannina, Greece. Meteorol. Appl. 2020, 27, 1932. [Google Scholar] [CrossRef]
  44. Papatsoris, K.; Polimeris, A.D.; Lazou, A.A. Development of rain attenuation and rain rate maps for satellite communications system design in Greece. In Proceedings of the 2008 IEEE Antennas and Propagation Society International Symposium, San Diego, CA, USA, 5–8 July 2008; pp. 1–4. [Google Scholar]
  45. Salami, G.; Faruk, N.; Surajudeen-Bakinde, N.; Ngobigha, F. Challenges and Trends in 5G Deployment: A Nigerian Case Study. In Proceedings of the 2019 2nd International Conference of the IEEE Nigeria Computer Chapter (NigeriaComputConf), Zaria, Nigeria, 14–17 October 2019; pp. 1–6. [Google Scholar]
  46. Fanti, A.; Schirru, L.; Casu, S.; Lodi, M.B.; Riccio, G.; Mazzarella, G. Improvement and Testing of Models for Field Level Evaluation in Urban Environment. IEEE Trans. Antennas Propag. 2020, 68, 4038–4047. [Google Scholar] [CrossRef]
  47. Ajose, S.; Imoize, A.L. Propagation measurements and modelling at 1800 MHz in Lagos Nigeria. Int. J. Wirel. Mob. Comput. 2013, 6, 165. [Google Scholar] [CrossRef]
  48. Ibhaze, A.E.; Imoize, A.L.; Ajose, S.O.; John, S.N.; Ndujiuba, C.U.; Idachaba, F.E. An Empirical Propagation Model for Path Loss Prediction at 2100MHz in a Dense Urban Environment. Indian J. Sci. Technol. 2017, 10, 1–9. [Google Scholar] [CrossRef]
  49. Imoize, A.L.; Ajose, O.S.; Ibhaze, A.; Akingbogun, O.O.; Denwigwe, I.H. Experimental Determination of Penetration Loss into Multi-Storey Buildings at 900 and 1800 MHz. Indones. J. Electr. Eng. Informatics (IJEEI) 2019, 7, 494–507. [Google Scholar] [CrossRef]
  50. Imoize, A.L.; Ibhaze, A.E.; Nwosu, P.O.; Ajose, S.O. Determination of Best-fit Propagation Models for Pathloss Prediction of a 4G LTE Network in Suburban and Urban Areas of Lagos, Nigeria. West Indian J. Eng. 2019, 41, 13–21. [Google Scholar]
  51. Ojo, S.; Imoize, A.; Alienyi, D. Radial basis function neural network path loss prediction model for LTE networks in multitransmitter signal propagation environments. Int. J. Commun. Syst. 2021, 34, 1–26. [Google Scholar] [CrossRef]
  52. Ojuh, O.; Isabona, J. Radio Frequency EMF Exposure due to Gsm Mobile Phones Base Stations: Measurements and Analysis in Nigerian Environment. Niger. J. Technol. 2015, 34, 809. [Google Scholar] [CrossRef] [Green Version]
  53. Imoize, A.L.; Ogunfuwa, T.E. Propagation measurements of a 4G LTE network in Lagoon environment. Niger. J. Technol. Dev. 2019, 16, 1–9. [Google Scholar] [CrossRef] [Green Version]
  54. Mandeep, J.S.; Hui, O.W.; Abdullah, M.; Tariqul, M.; Ismail, M.; Suparta, W.; Yatim, B.; Menon, P.S.; Abdullah, H. Modified ITU-R rain attenuation model for equatorial climate. In Proceedings of the 2011 IEEE International Conference on Space Science and Communication (IconSpace), Penang, Malaysia, 12–13 July 2011; pp. 89–92. [Google Scholar]
  55. Series, R.P. Propagation data and prediction methods required for the design of terrestrial line-of-sight systems. Recomm. ITU-R 2015, 7, 512–530. [Google Scholar]
  56. Diba, F.D.; Afullo, T.J.; Alonge, A. Rainfall Rate and Attenuation Performance Analysis at Microwave and Millimeter Bands for the Design of Terrestrial Line-of-Sight Radio Links in Ethiopia. SAIEE Afr. Res. J. 2016, 107, 177–186. [Google Scholar] [CrossRef]
  57. Ananya, S.T.; Islam, S.; Mahmud, A.R.; Podder, P.K.; Uddin, J. Atmospheric Propagation Impairment Effects for Wireless Communications. Int. J. Wirel. Mob. Netw. 2020, 12, 45–61. [Google Scholar] [CrossRef]
  58. Gataullin, Y.; Kozlowski, R. Implementation of rain and gaseous attenuation models for 26–30 GHz Ka-Band Communication. In Proceedings of the 6th IASTED International Conference Antennas, Radar, and Wave Propagation (ARP 2009), Banff, AL, USA, 6–8 July 2009. [Google Scholar]
  59. Chen, J.; Kanj, I.A.; Xia, G. Improved upper bounds for vertex cover. Theor. Comput. Sci. 2010, 411, 3736–3756. [Google Scholar] [CrossRef] [Green Version]
  60. Adeoye, N.O. Spatio-temporal analysis of land use/cover change of Lokoja-a confluence town. J. Geogr. Geol. 2012, 4, 40. [Google Scholar] [CrossRef]
Figure 1. Implementation of an RIS-Assisted Wireless Communication System.
Information 13 00141 g001
Figure 2. Map of the study location showing the geographical coordinates.
Information 13 00141 g002
Figure 3. Mean yearly rainfall depths of study location.
Information 13 00141 g003
Figure 4. Mean yearly percentage of cloud and humidity of the study location.
Information 13 00141 g004
Figure 5. Classified rain rates values based on rainfall depth levels.
Information 13 00141 g005
Figure 6. Rain attenuation plot versus frequency based on rainfall depth levels.
Information 13 00141 g006
Figure 7. Rain attenuation plot versus elevation angle and rainfall depth levels.
Information 13 00141 g007
Figure 8. Rain attenuation plot versus tilt angle and rainfall depth levels.
Information 13 00141 g008
Figure 9. Attenuation loss plot versus frequency of wet and dry air.
Information 13 00141 g009
Figure 10. Attenuation due to cloud plot versus frequency.
Information 13 00141 g010
Figure 11. Plot of propagation loss due to attenuation from atmospheric variables.
Information 13 00141 g011
Figure 12. Attenuated signal power plot versus T-R propagation distance.
Information 13 00141 g012
Publisher’s Note: MDPI stays neutral with regard to jurisdictional claims in published maps and institutional affiliations.

