
Splitting Tensile Strength of Fly Ash-Modified Sand at Various Saturations and Curing Times
 , ,
, ,  and
and
Abstract
:1. Introduction
2. Materials and Methods
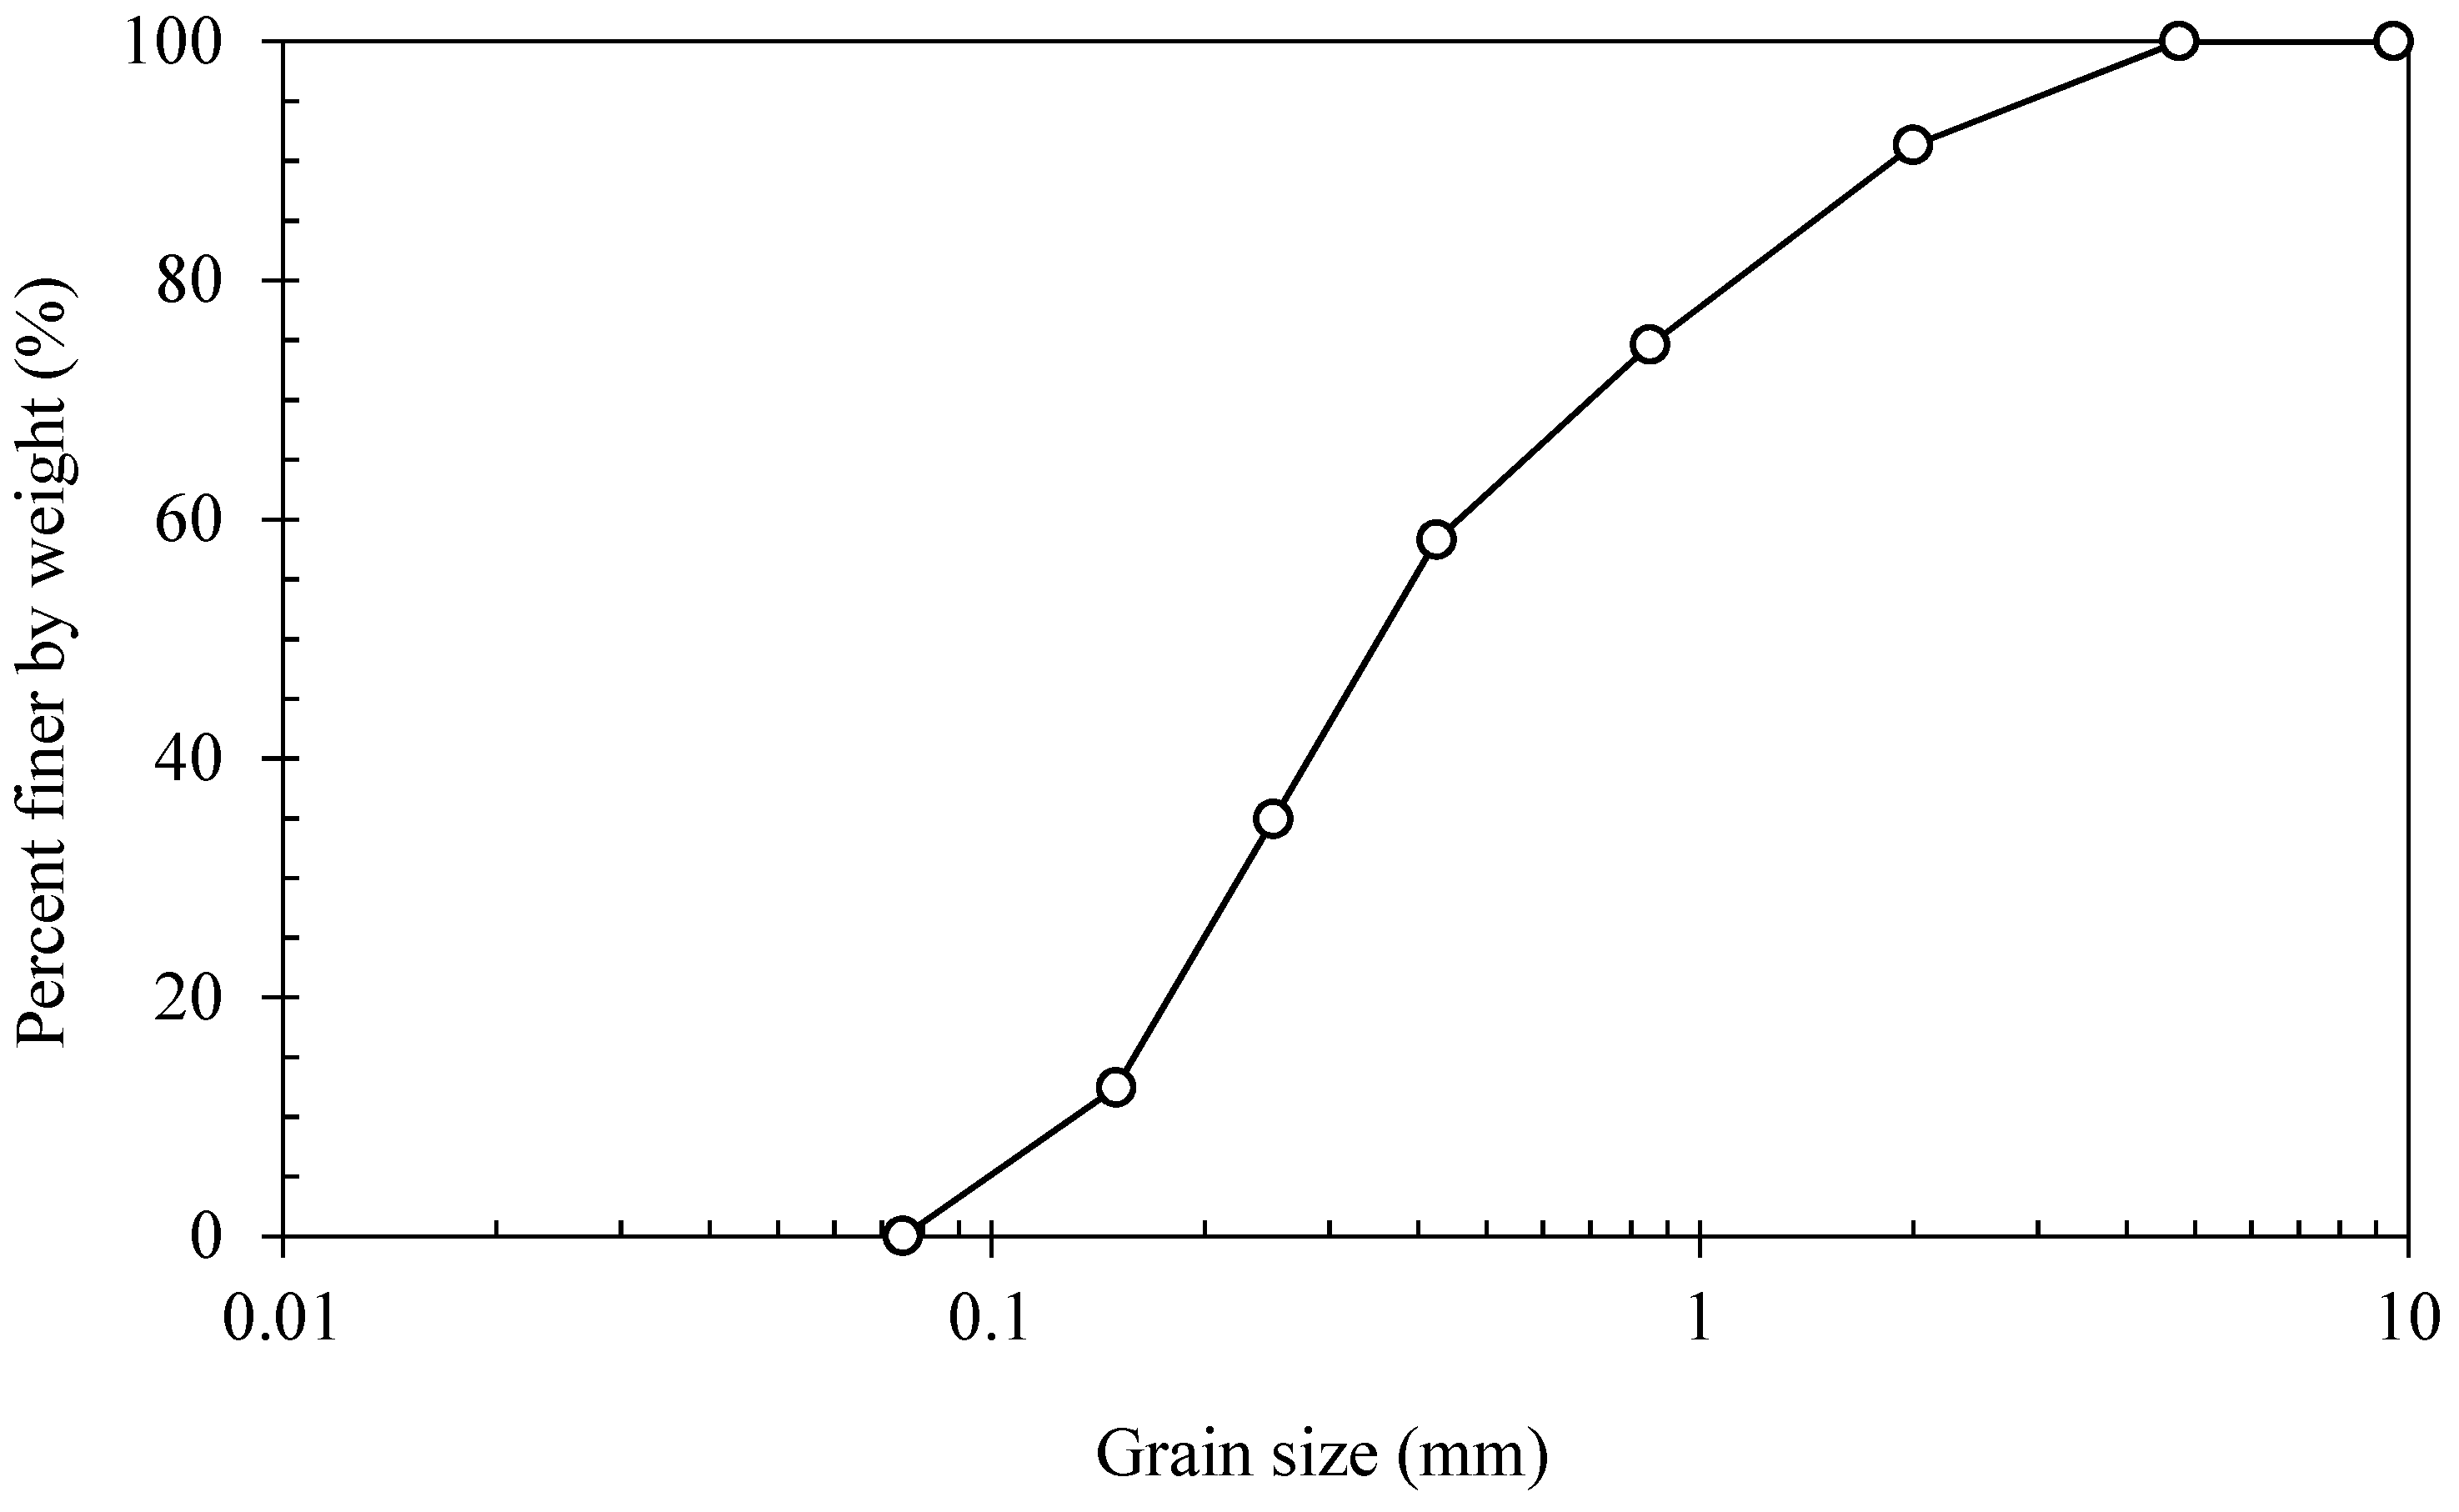
2.1. Materials
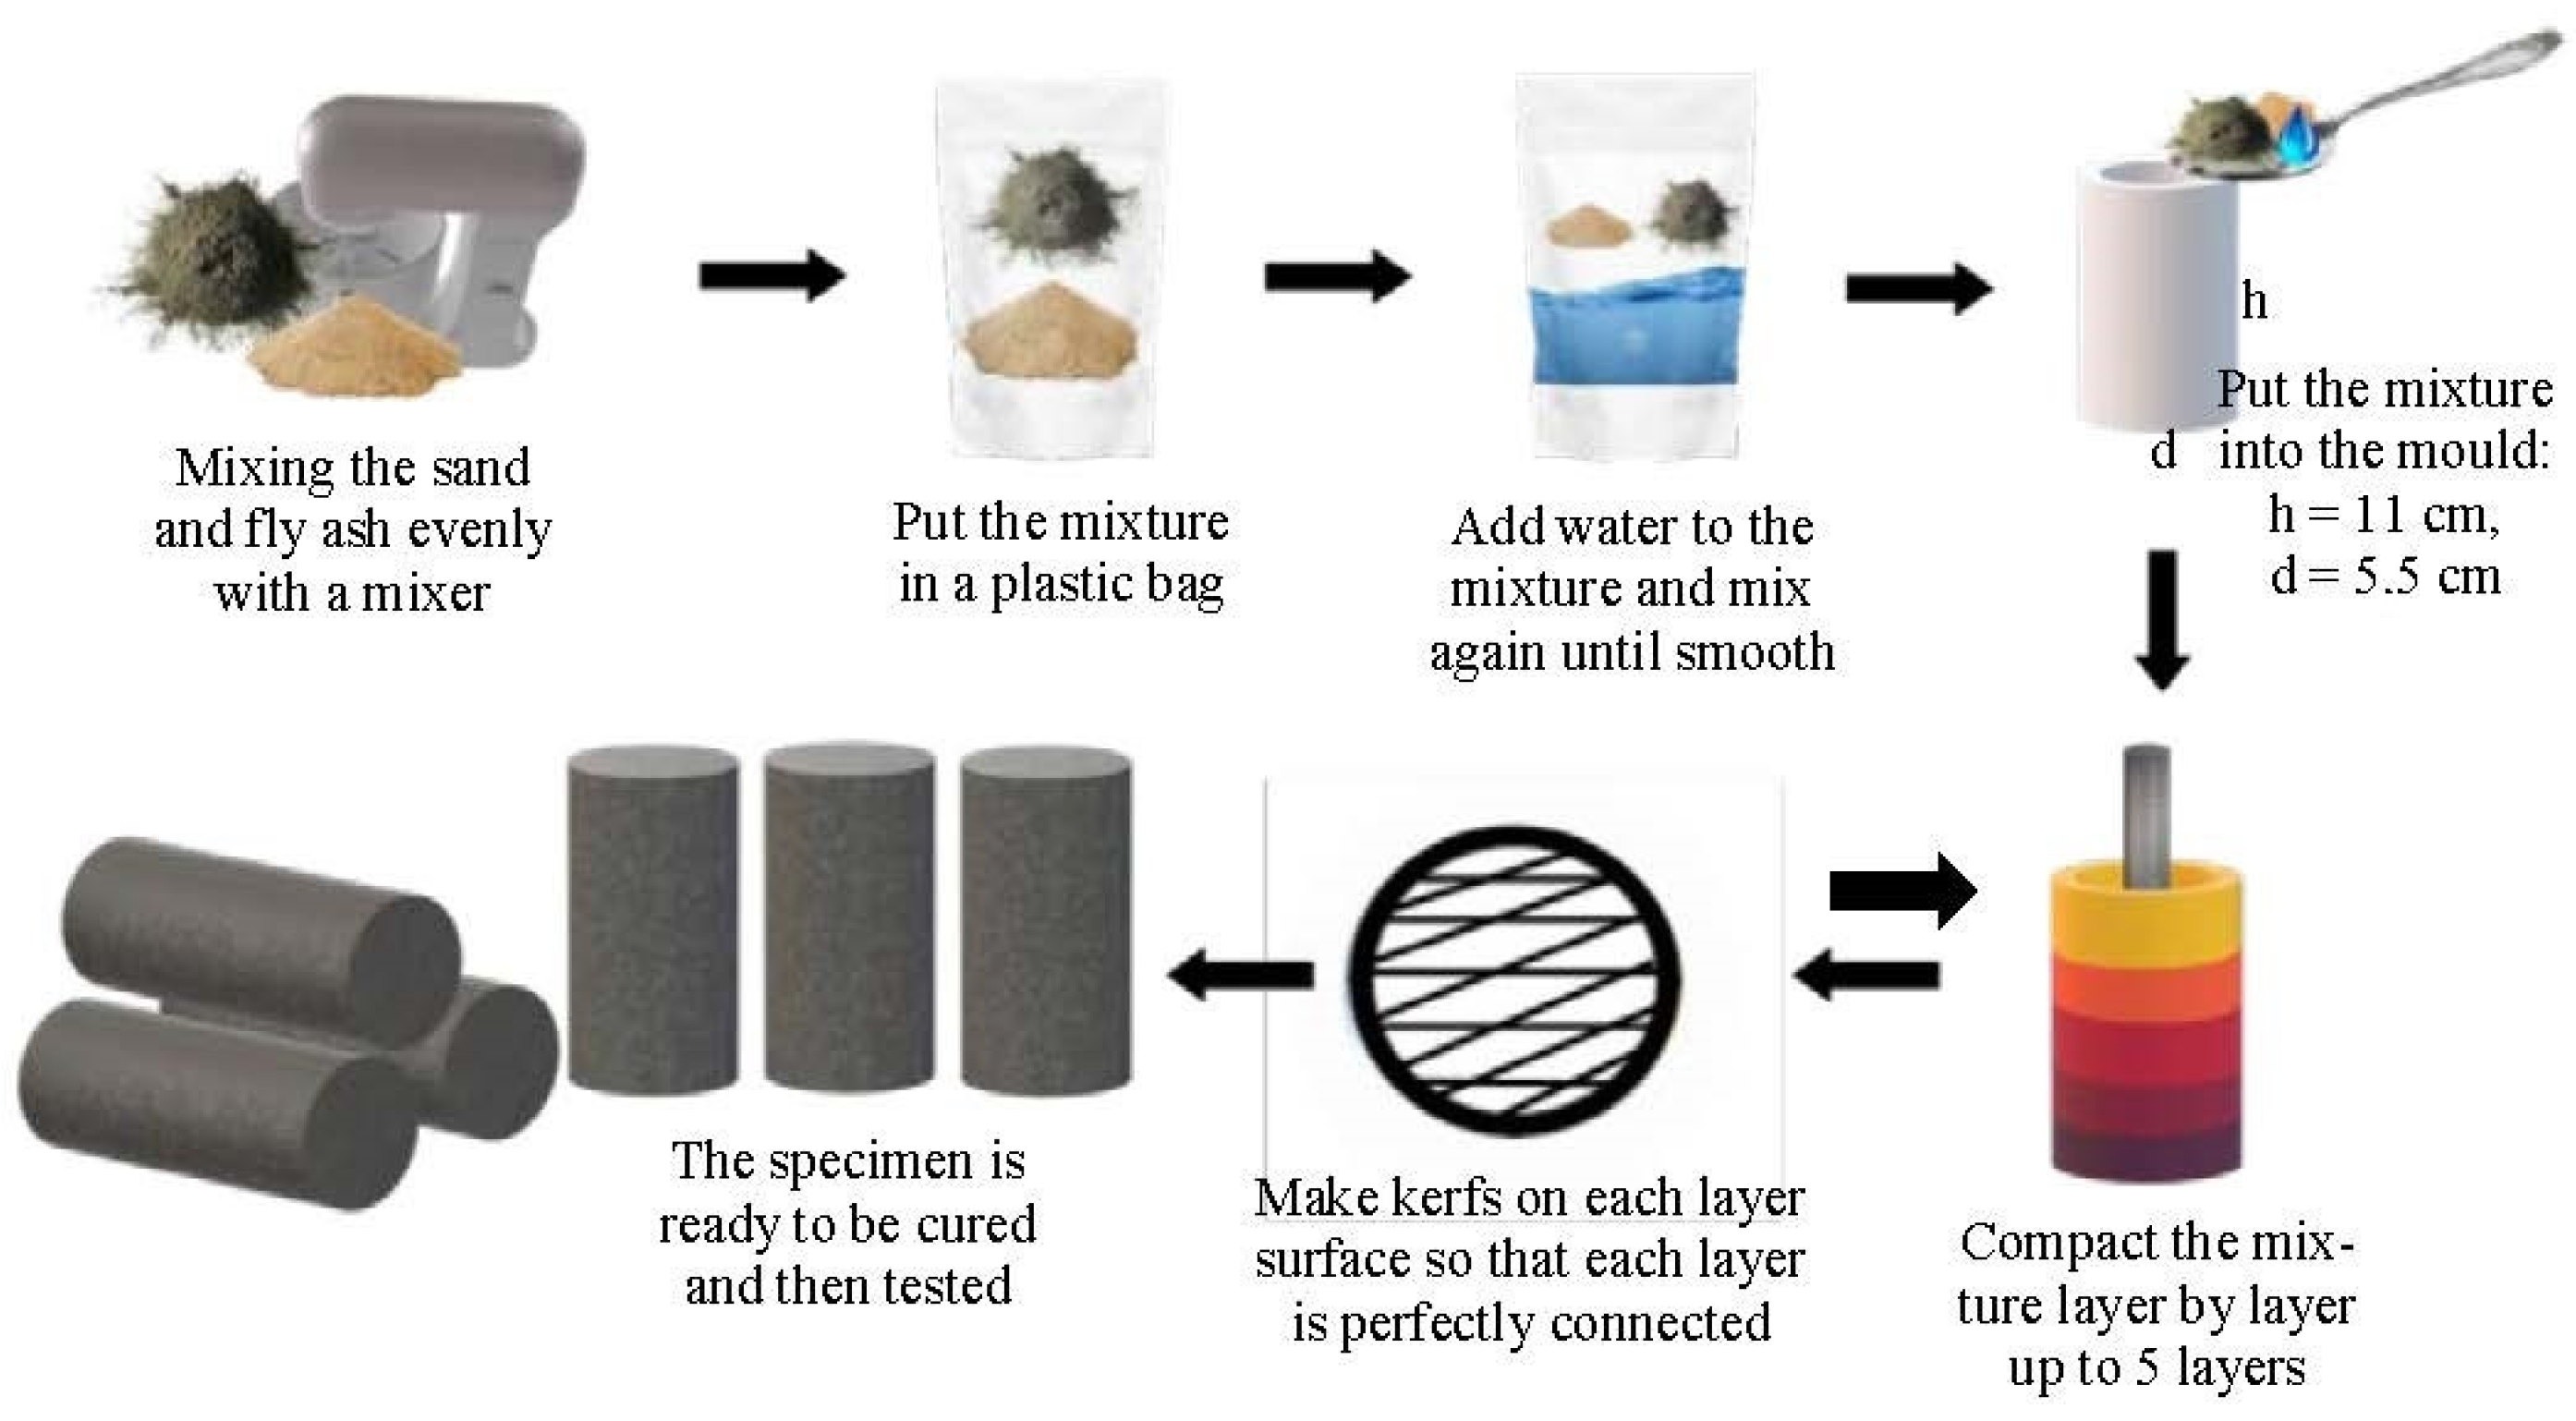
2.2. Methods
2.2.1. Material Testing
2.2.2. Mix Design
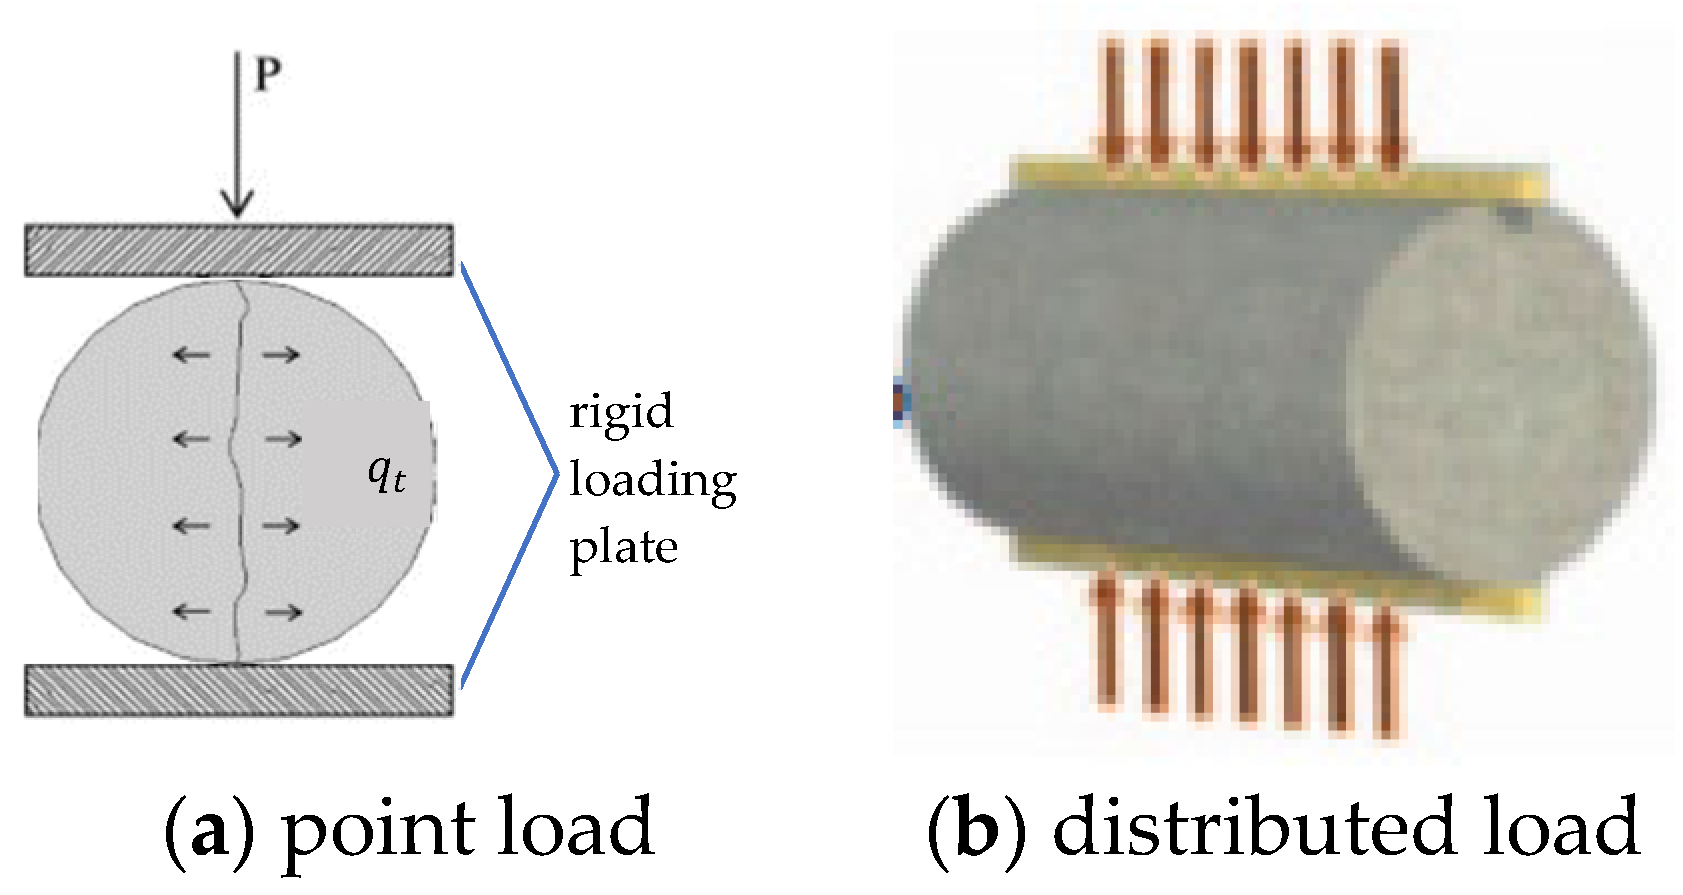
2.2.3. Sample Testing
2.2.4. Testing Conditions
3. Results and Discussion
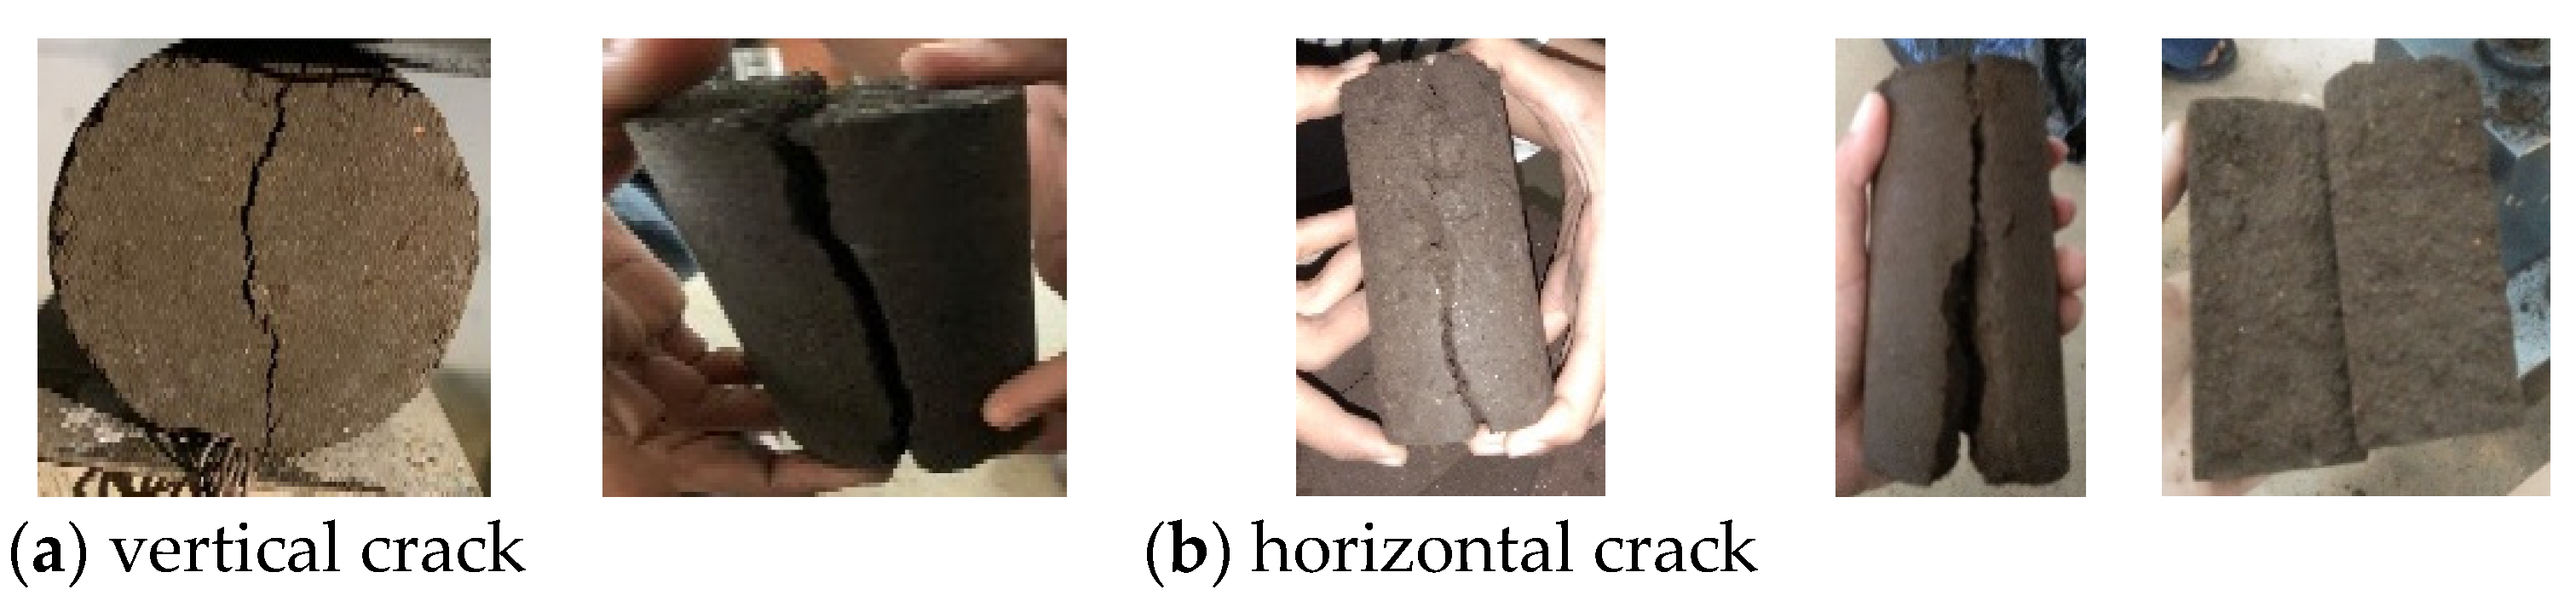
3.1. Failure Mode of the Specimen
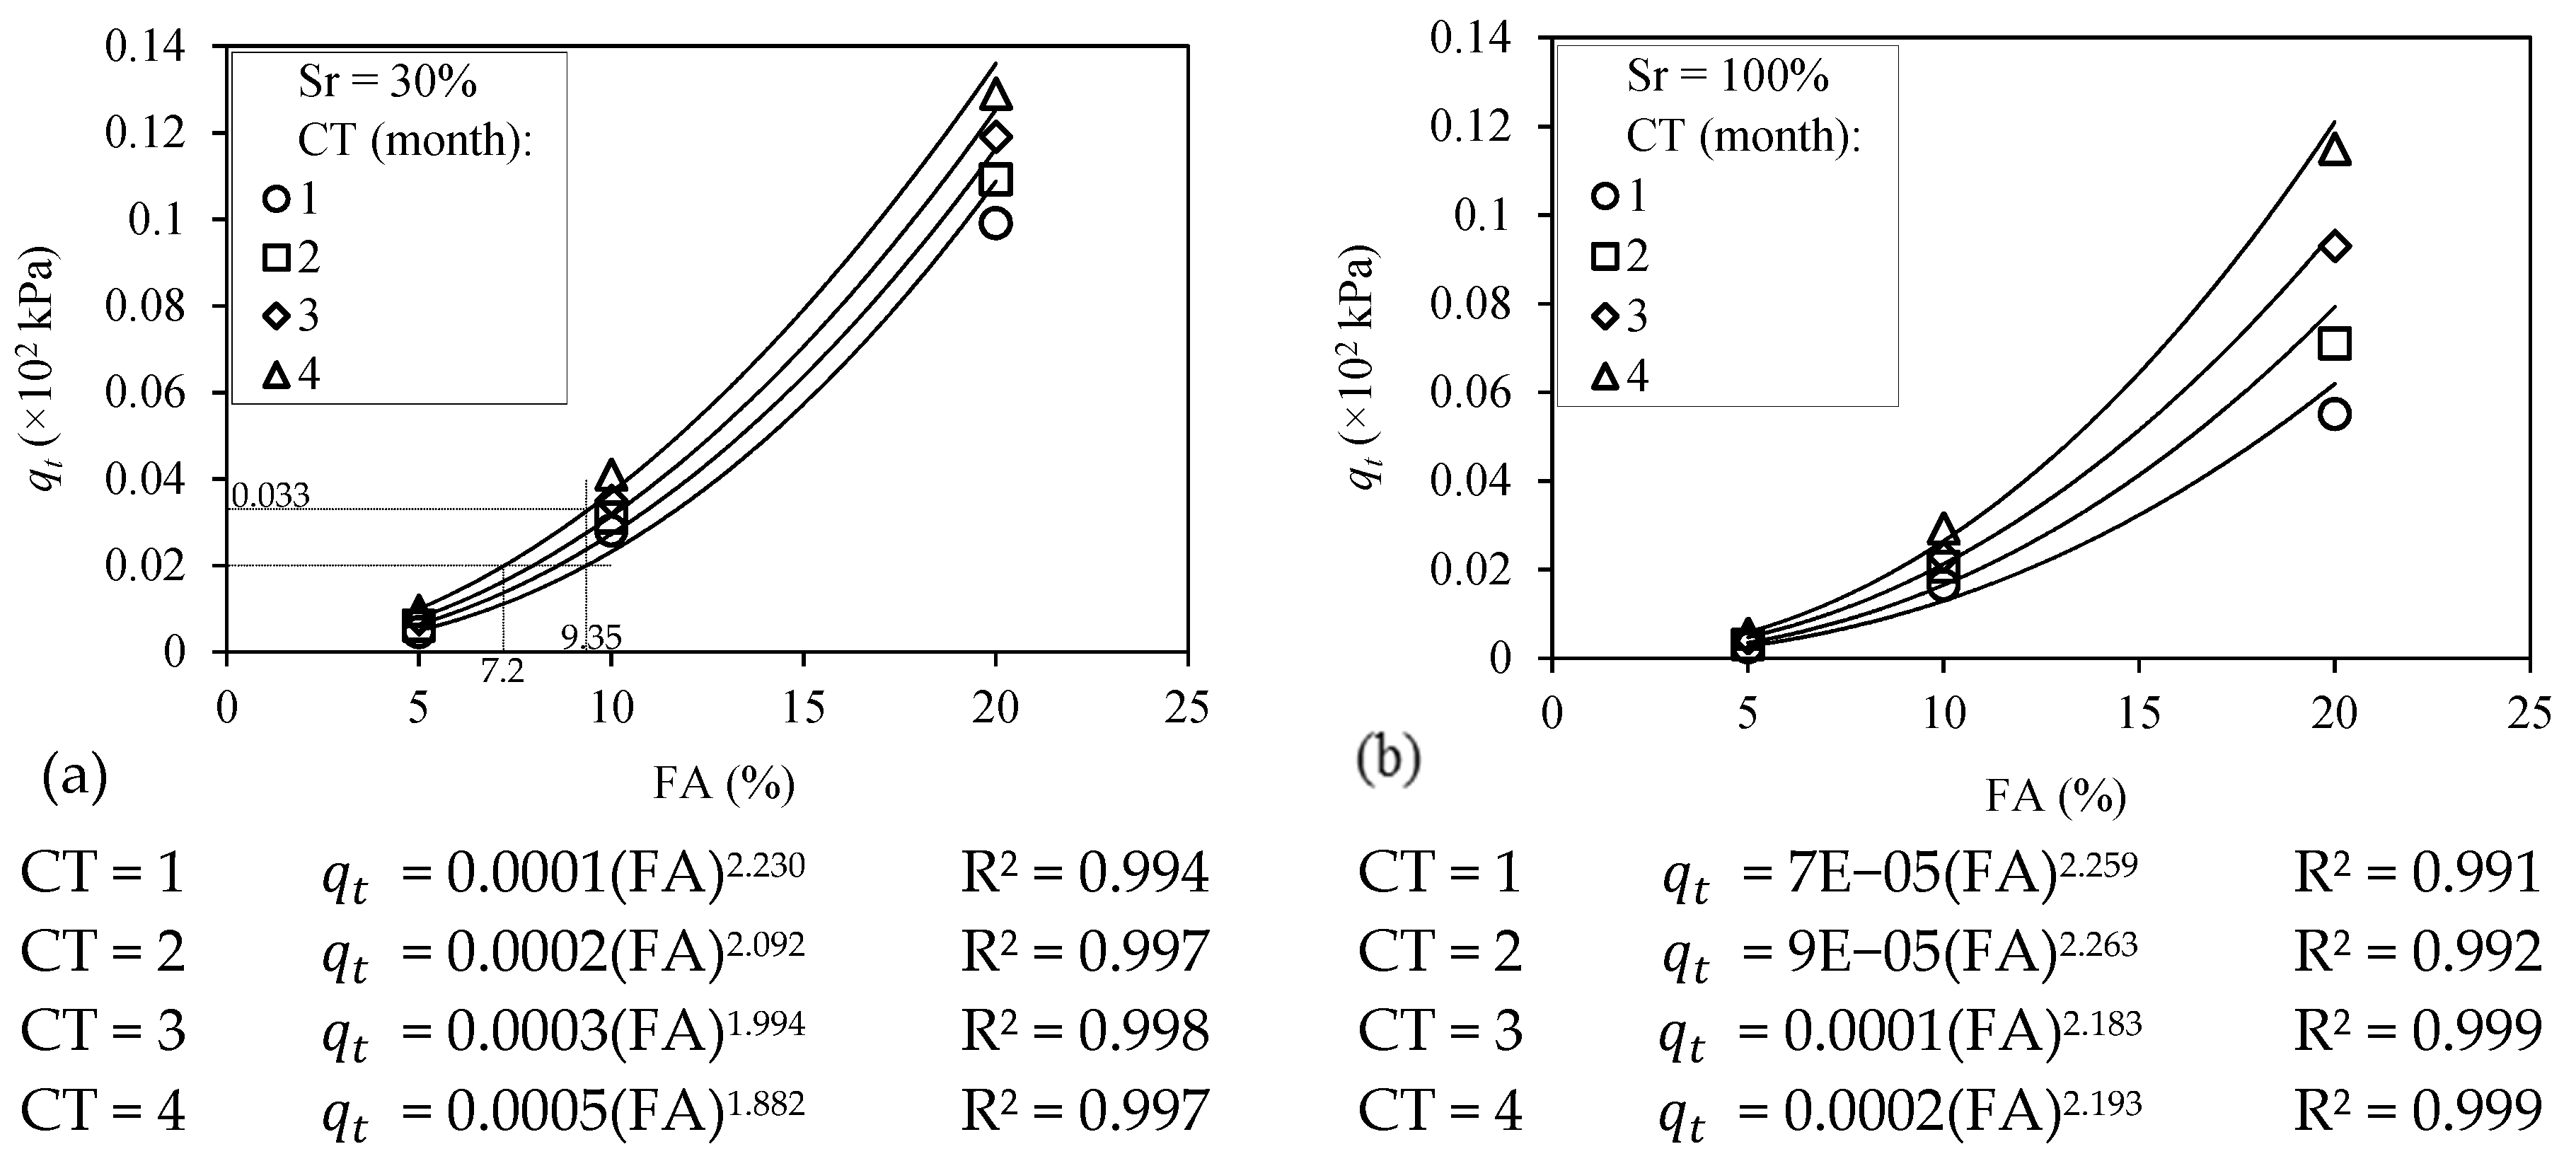
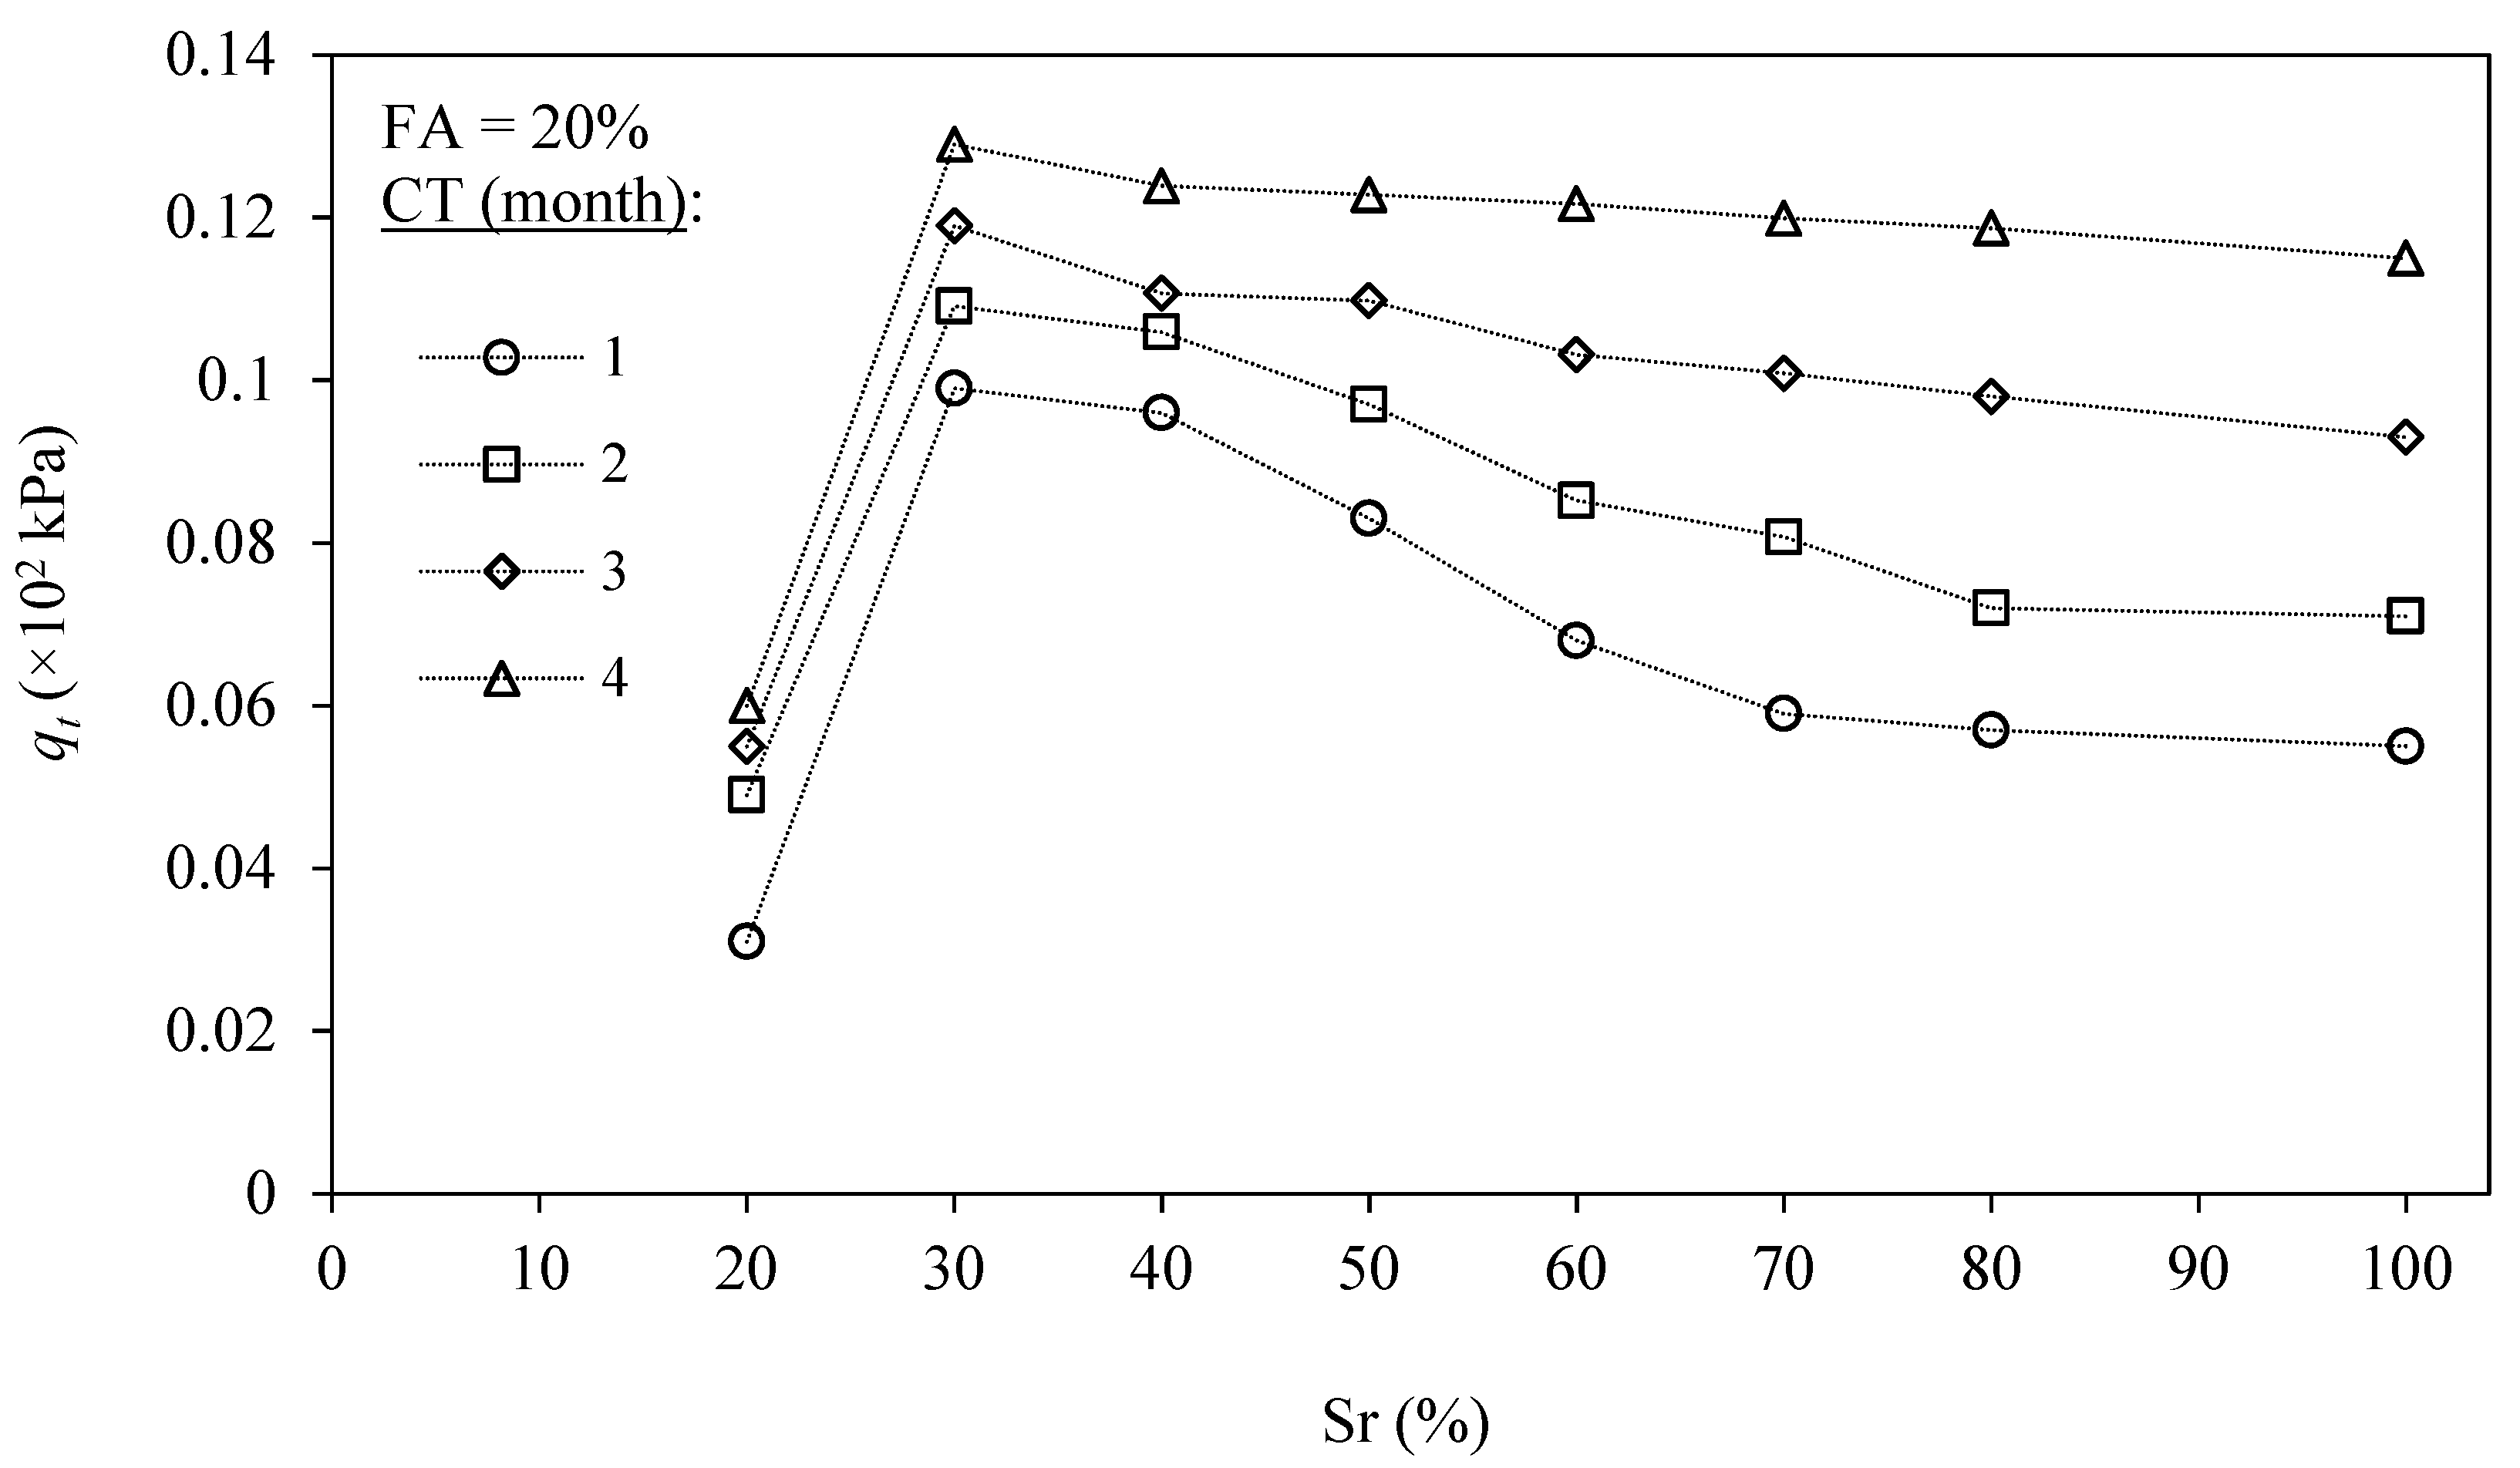
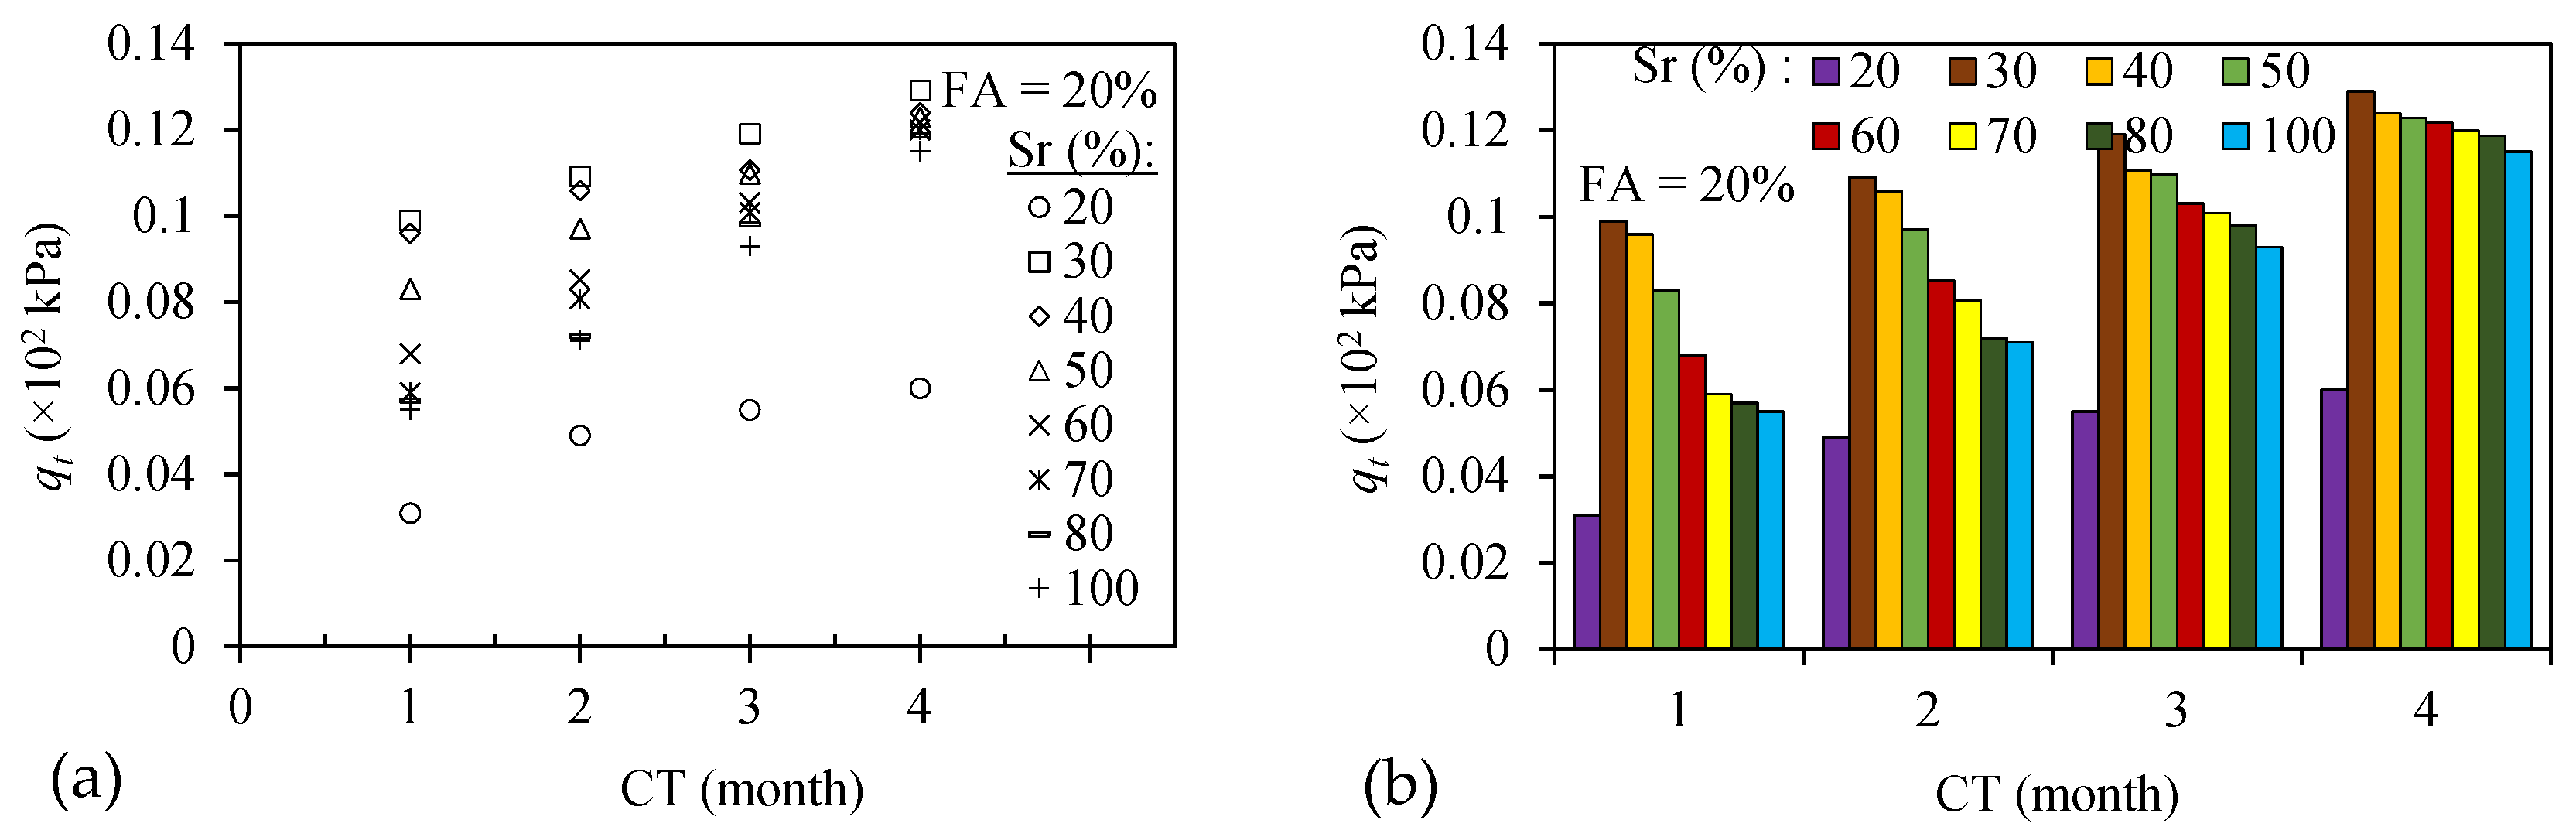
3.2. Splitting Tensile Strength of the FA-Modified Sand
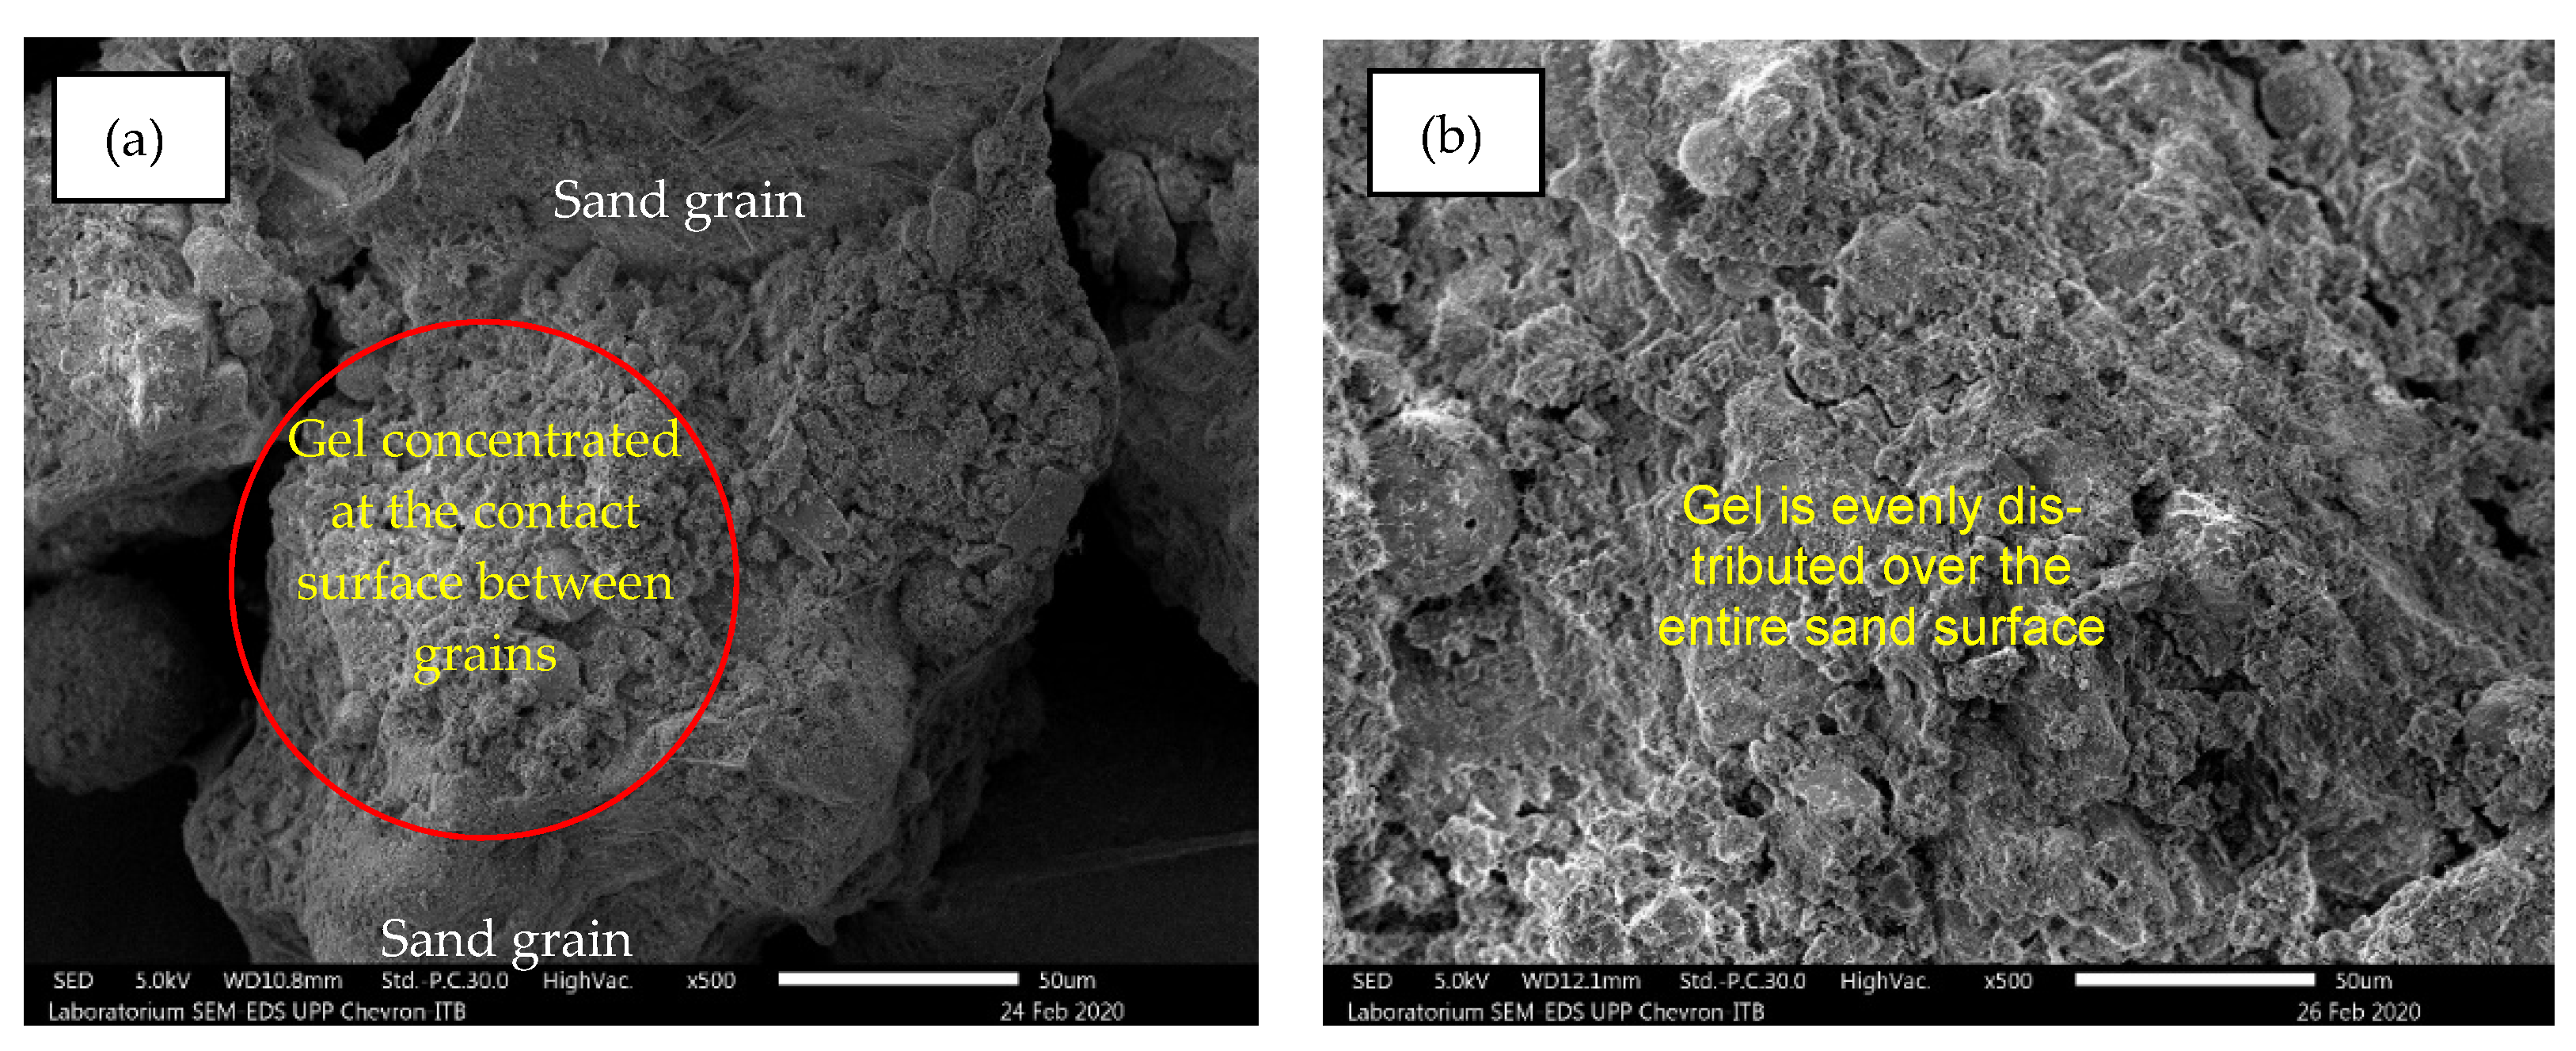
3.3. Microscopic Images of the FA-Modified Sand
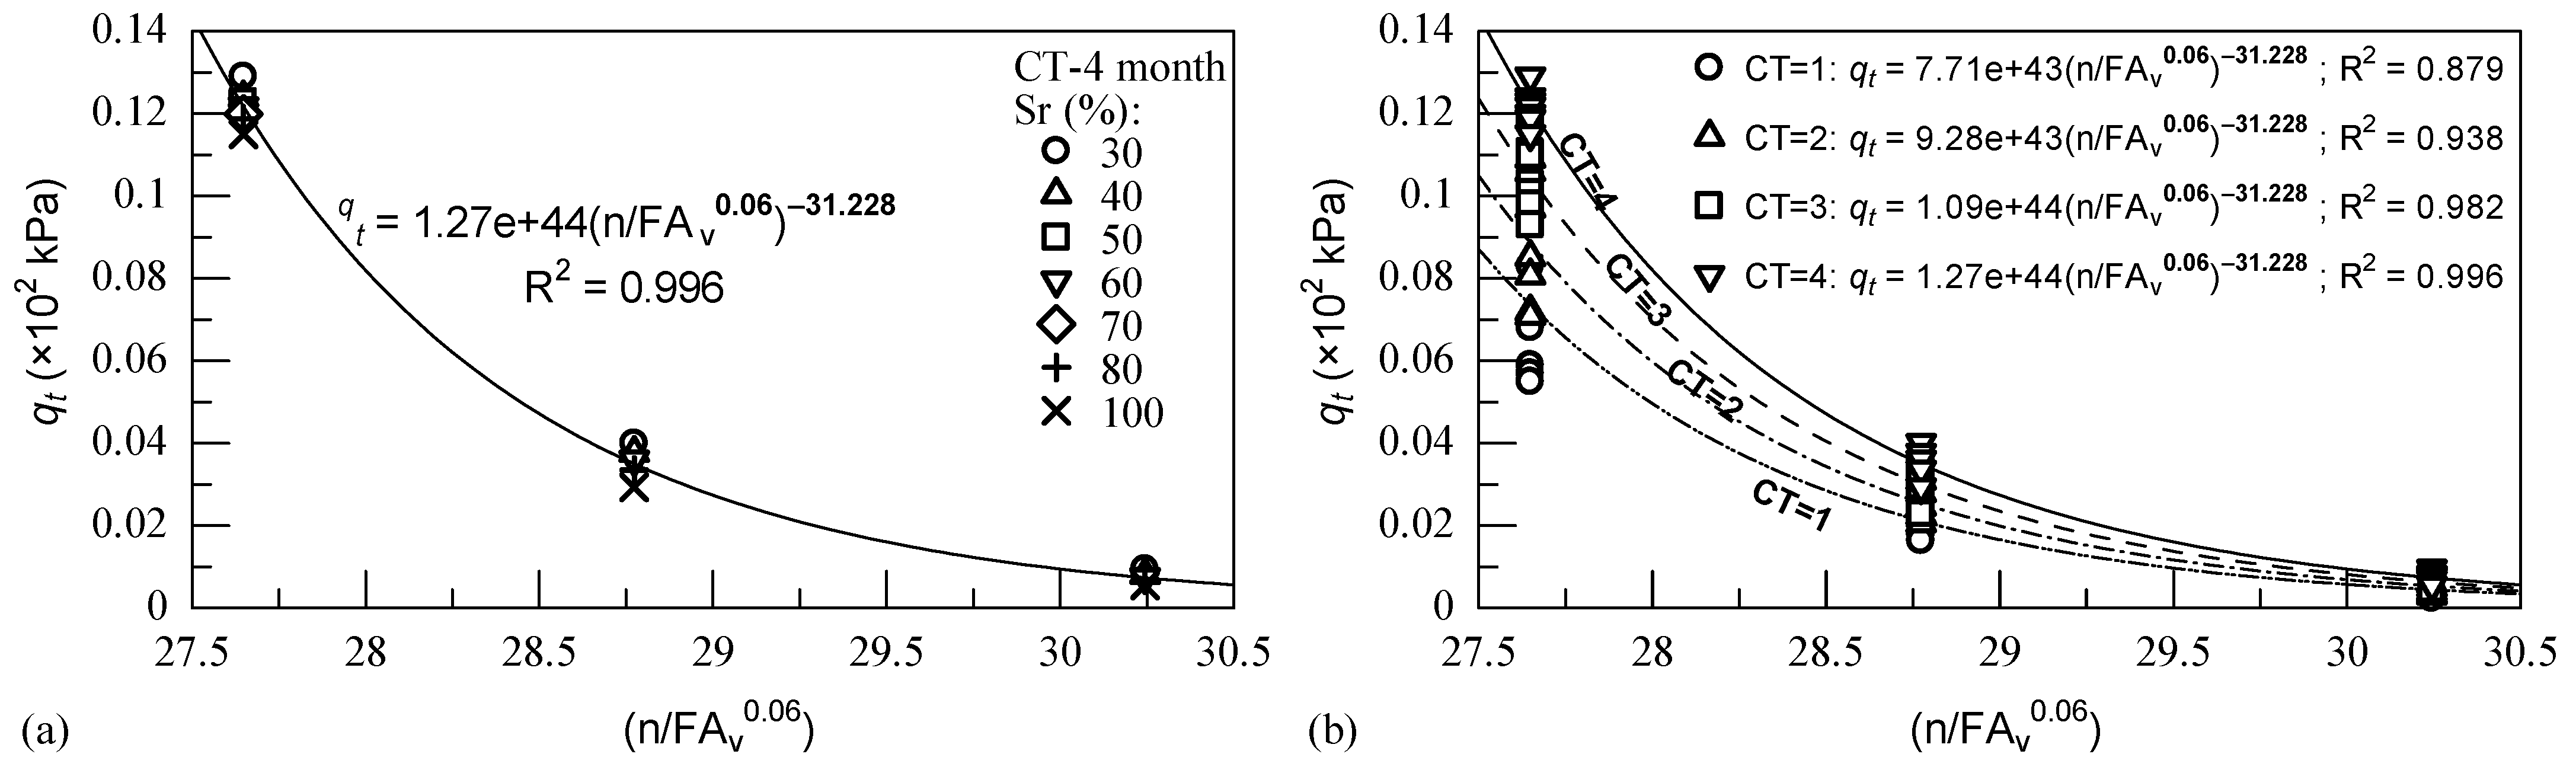
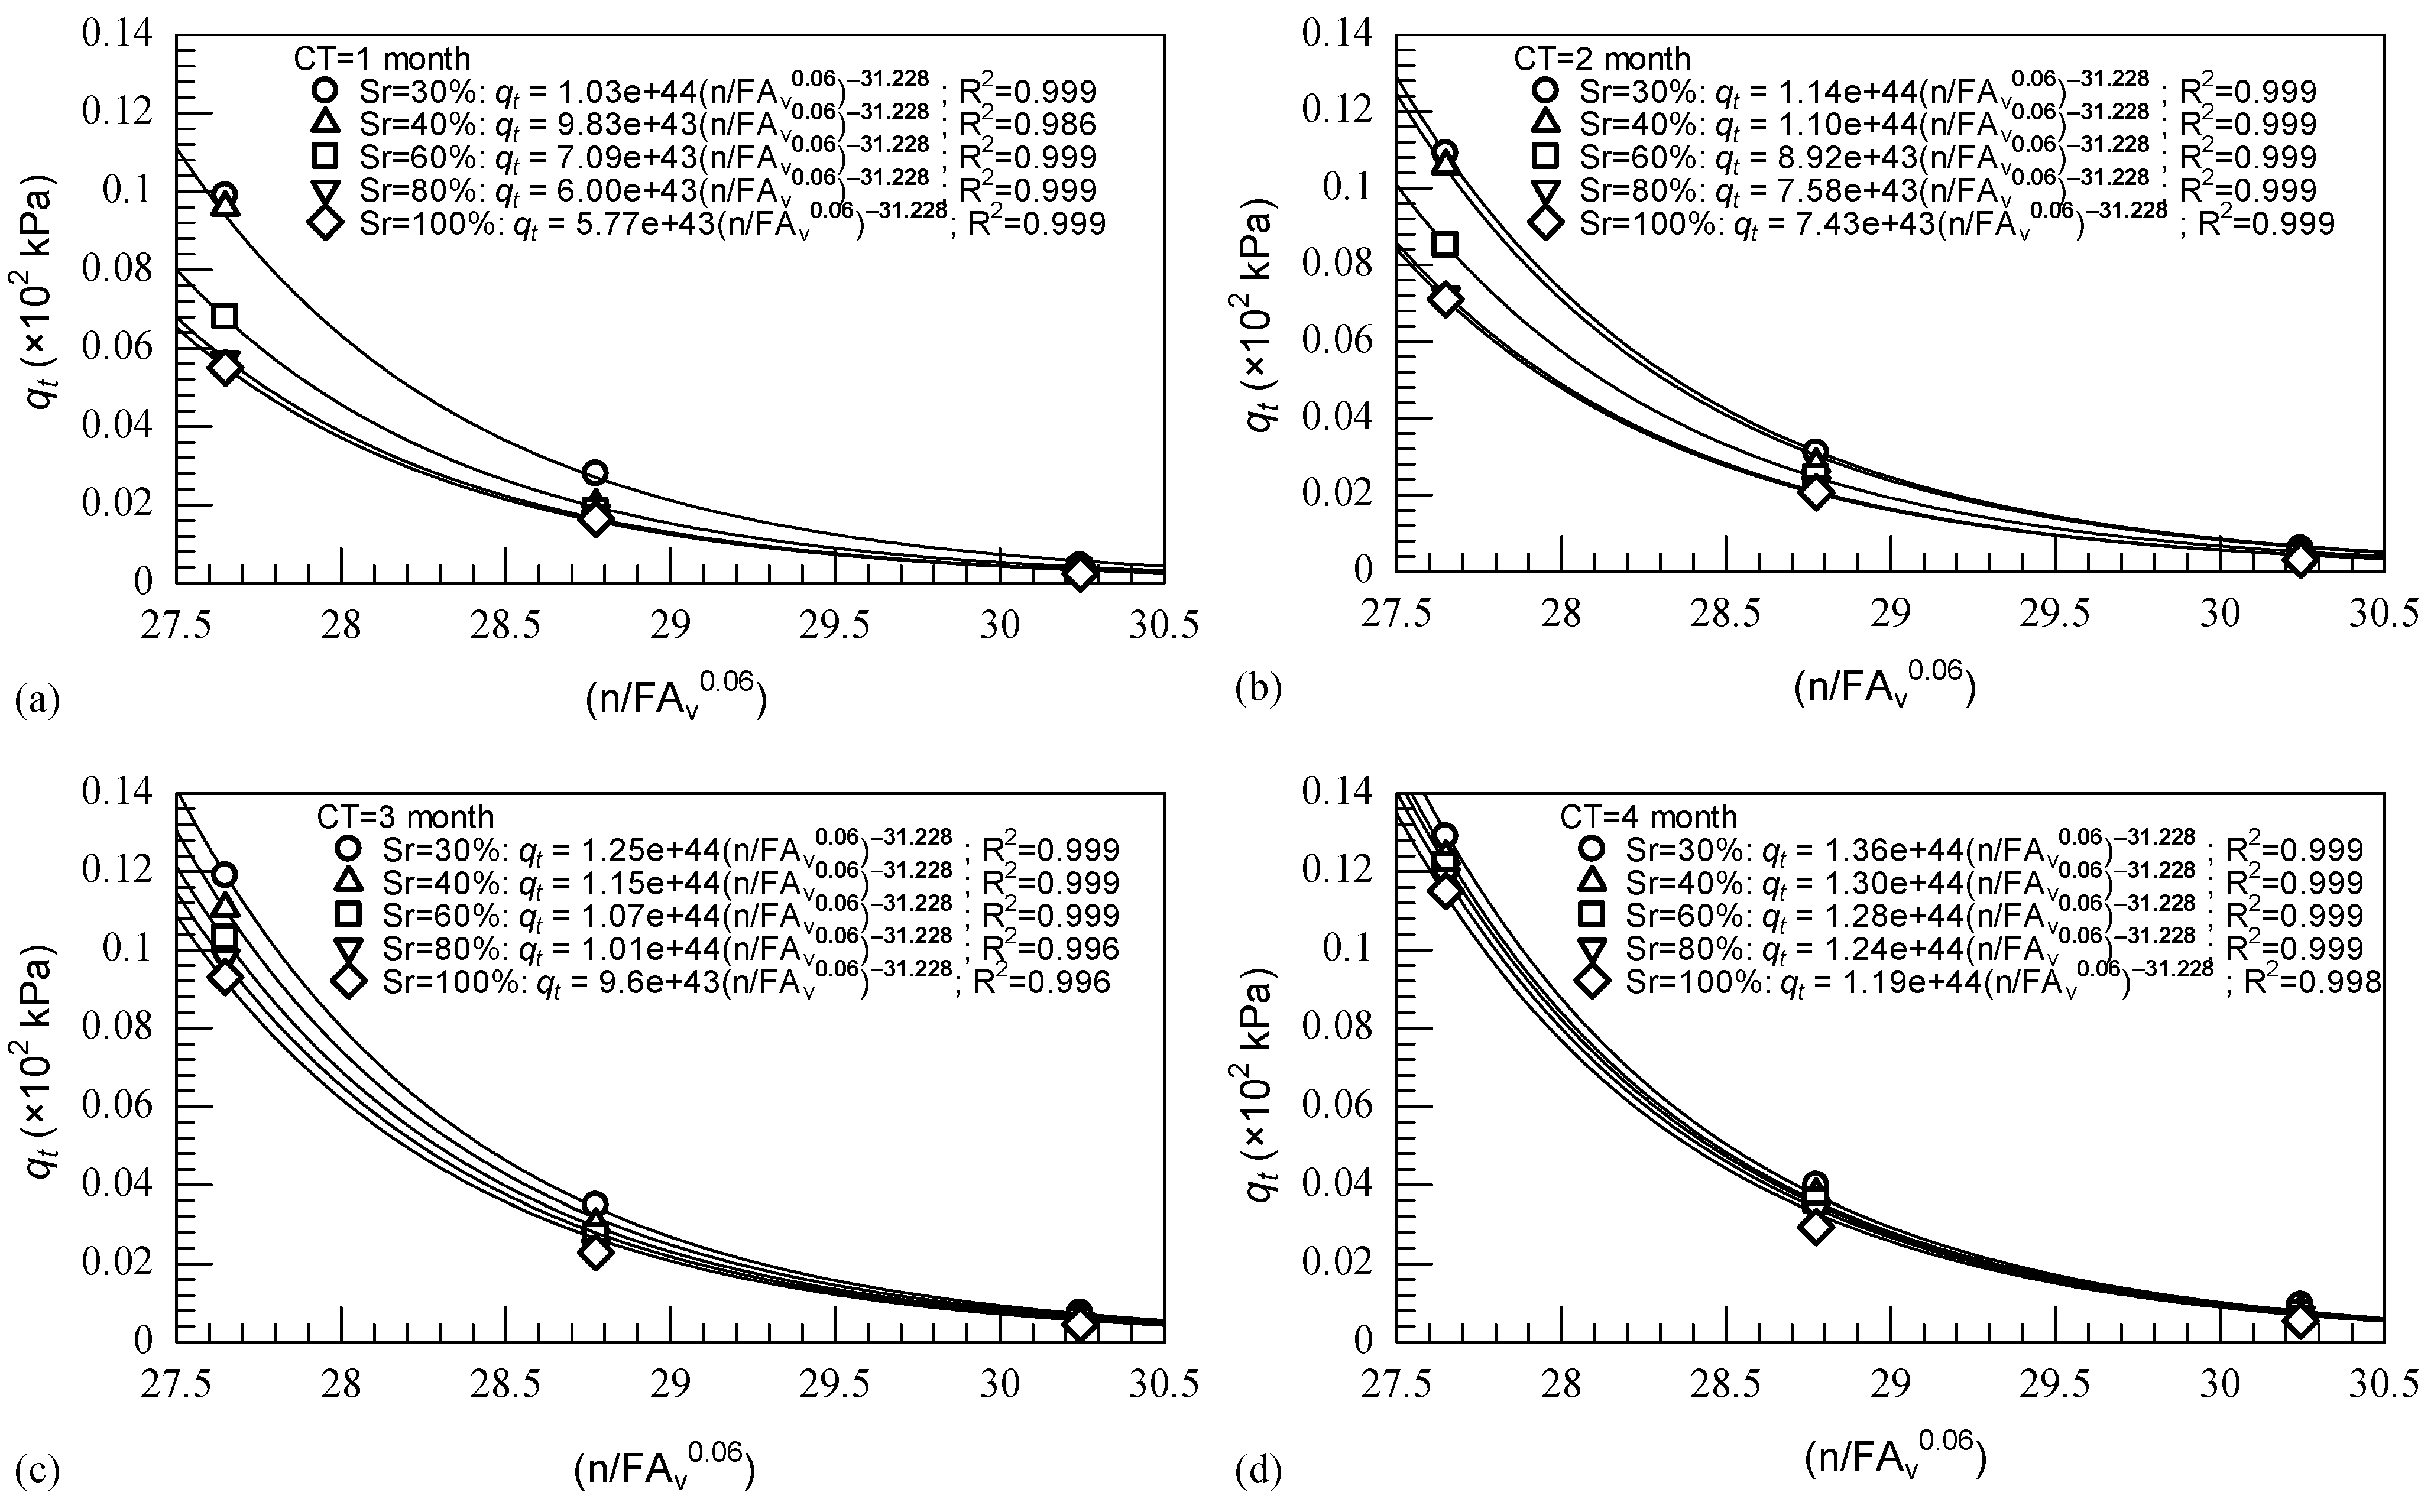
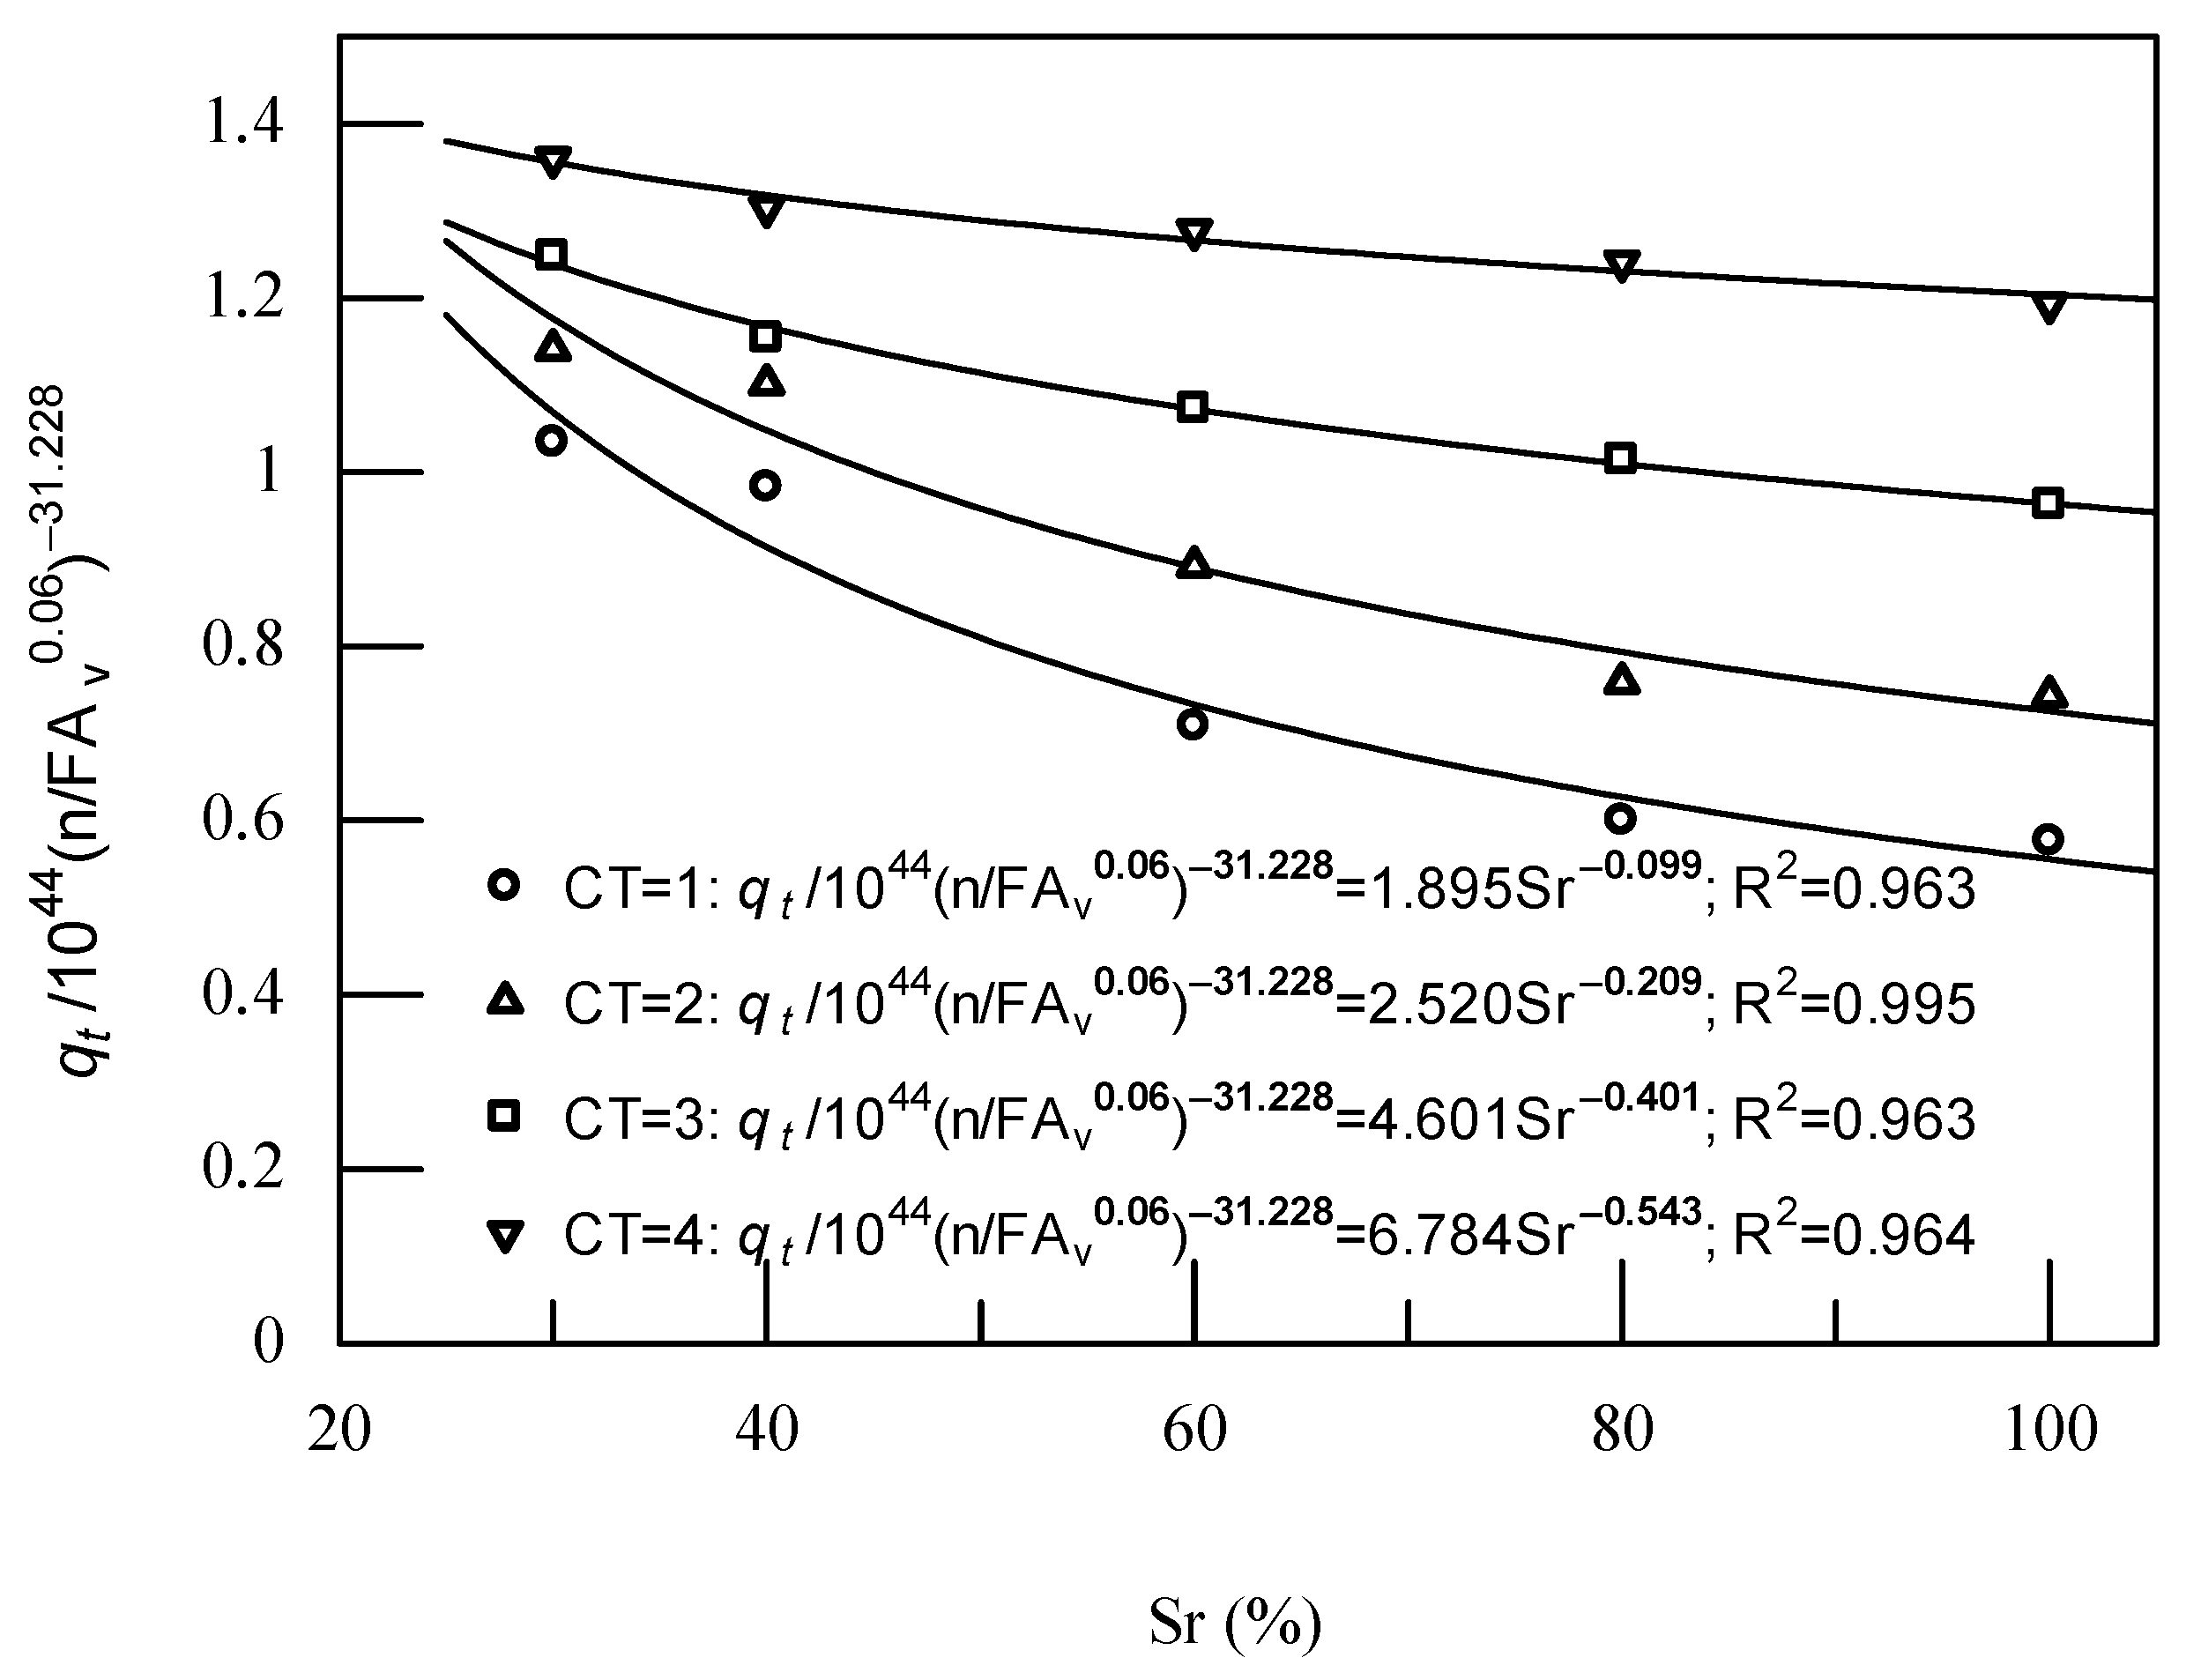
3.4. The Empirical Strength Formulation of the FA-Modified Sand
4. Conclusions
Author Contributions
Funding
Data Availability Statement
Acknowledgments
Conflicts of Interest
References
- Kitazume, M.; Okamura, M. Contributions to “Soils and Foundations”: Ground Improvement. Soils Found. Jpn. Geotech. Soc. 2010, 50, 965–975. [Google Scholar] [CrossRef]
- El Mohtar, C.S.; Bobet, A.; Santagata, M.C.; Drnevich, V.P.; Johnston, C.T. Liquefaction Mitigation Using Bentonite Suspensions. J. Geotech. Geoenviron. Eng. 2013, 139, 1369–1380. [Google Scholar] [CrossRef]
- Simatupang, M.; Okamura, M. Liquefaction Resistance of Sand Remediated with Carbonate Precipitation at Different Degrees of Saturation during Curing. Soils Found. 2017, 57, 619–631. [Google Scholar] [CrossRef]
- Simatupang, M.; Okamura, M.; Hayashi, K.; Yasuhara, H. Small-Strain Shear Modulus and Liquefaction Resistance of Sand with Carbonate Precipitation. Soil Dyn. Earthq. Eng. 2018, 115, 710–718. [Google Scholar] [CrossRef]
- Simatupang, M.; Sukri, A.S.; Nasrul; Sulha; Putri, T.S. Effect of Confining Pressures on the Shear Modulus of Sand Treated with Enzymatically Induced Calcite Precipitation. IOP Conf. Ser. Mater. Sci. Eng. 2019, 615, 012042. [Google Scholar] [CrossRef]
- Montoya, B.M.; DeJong, J.T.; Boulanger, R.W. Dynamic Response of Liquefiable Sand Improved by Microbial-Induced Calcite Precipitation. Géotechnique 2013, 63, 302–312. [Google Scholar] [CrossRef]
- El Mohtar, C.S.; Bobet, A.; Drnevich, V.P.; Johston, C.T.; Santagat, M.C. Pore Pressure Generation in Sand with Bentonite: From Small Strains to Liquefaction. Géotechnique 2014, 64, 108–117. [Google Scholar] [CrossRef]
- Prabakar, J.; Dendorkar, N.; Morchhale, R.K. Influence of Fly Ash on Strength Behavior of Typical Soils. Constr. Build. Mater. 2004, 18, 263–267. [Google Scholar] [CrossRef]
- Trzebiatowski, B.B.D.; Edil, T.B.; Benson, C.H. Case Study of Subgrade Stabilization Using Fly Ash: State Highway 32, Port Washington, Wisconsin. Benef. Reuse Waste Mater. Geotech. Transp. Appl. GSP 2004, 127, 123–136. [Google Scholar]
- Amadi, A.A.; Osu, A.S. Effect of Curing Time on Strength Development in Black Cotton Soil – Quarry Fines Composite Stabilized with Cement Kiln Dust (CKD). J. King Saud Univ.-Eng. Sci. 2018, 30, 305–312. [Google Scholar] [CrossRef]
- Oriola, F.O.P.; Moses, G. Compacted Black Cotton Soil Treated with Cement Kiln Dust as Hydraulic Barrier Material. Am. J. Sci. Ind. Res. 2011, 2, 521–530. [Google Scholar] [CrossRef]
- Salahudeen, A.B.; Eberemu, A.; Osinubi, K.J. Assessment of Cement Kiln Dust-Treated Expansive Soil for the Construction of Flexible Pavements. Geotech. Geol. Eng. 2014, 32, 923–931. [Google Scholar] [CrossRef]
- Brooks, R.M. Soil Stabilization With Flyash and Rice Husk Ash. Int. J. Res. Rev. Appl. Sci. 2009, 1, 2076–7366. [Google Scholar]
- Edil, T.B.; Acosta, H.A.; Benson, C.H. Stabilizing Soft Fine-Grained Soils with Fly Ash. J. Mater. Civ. Eng. 2006, 18, 283–294. [Google Scholar] [CrossRef]
- Simatupang, M.; Mangalla, L.K.; Edwin, R.S.; Putra, A.A.; Azikin, M.T.; Aswad, N.H.; Mustika, W. The Mechanical Properties of Fly-Ash-Stabilized Sands. Geosciences 2020, 10, 132. [Google Scholar] [CrossRef]
- Simatupang, M. Effectiveness of Lowering Saturation on Residual Shear Strength of Sand Stabilized with Fly-Ash. IOP Conf. Ser. Earth Environ. Sci. 2021, 622, 012003. [Google Scholar] [CrossRef]
- Simatupang, M.; Mangalla, L.K.; Muhaimin, L.O.; Aldy, M.; Aji, I.C.; Jalbanirah; Jamin, M.; Marteni, L.O.A.; Rahmat; Ardiyansyah. The Ultimate Shear Strength of the Fly Ash-Improved Sands. IOP Conf. Ser. Earth Environ. Sci. 2021, 871, 012061. [Google Scholar] [CrossRef]
- Tastan, E.O.; Edil, T.B.; Benson, C.H.; Aydilek, A.H. Stabilization of Organic Soils with Fly Ash. J. Geotech. Geoenviron. Eng. ASCE 2011, 137, 819–833. [Google Scholar] [CrossRef]
- Cetin, B.; Aydilek, A.H.; Guney, Y. Stabilization of Recycled Base Materials with High Carbon Fly Ash. Resour. Conserv. Recycl. 2010, 54, 878–892. [Google Scholar] [CrossRef]
- Senol, A.; Edil, T.B.; Bin-Shafique, M.S.; Acosta, H.A.; Benson, C.H. Soft Subgrades Stabilization by Using Various Fly Ashes. Resour. Conserv. Recycl. 2006, 46, 365–376. [Google Scholar] [CrossRef]
- Consoli, N.C.; Rosa, F.D.; Fonini, A. Plate Load Tests on Cemented Soil Layers Overlaying Weaker Soil. J. Geotech. Geoenviron. Eng. 2009, 135, 1846–1856. [Google Scholar] [CrossRef]
- Consoli, N.C.; da Rocha, C.G.; Silvani, C. Devising Dosages for Soil-Fly Ash-Lime Blends Based on Tensile Strength Controlling Equations. Constr. Build. Mater. 2014, 55, 238–245. [Google Scholar] [CrossRef]
- Consoli, N.C.; da Rocha, C.G.; Silvani, C. Effect of Curing Temperature on the Strength of Sand, Coal Fly Ash, and Lime Blends. J. Mater. Civ. Eng. 2014, 26, 06014015. [Google Scholar] [CrossRef]
- Baldovino, J.A.; Moreira, E.B.; dos Santos Izzo, R.L.; Rose, J.L. Empirical Relationships with Unconfined Compressive Strength and Split Tensile Strength for the Long Term of a Lime-Treated Silty Soil. J. Mater. Civ. Eng. 2018, 30, 06018008. [Google Scholar] [CrossRef]
- SNI 03-1964-2008; How to Test the Specific Gravity of the Soil. BSN: Jakarta, Indonesia, 2008; (In Bahasa Indonesia).
- SNI 03-3637-1994; Soil Unit Weight Test Method. BSN: Jakarta, Indonesia, 1994; (In Bahasa Indonesia).
- ASTM C496-11; Standard Test Method for Splitting Tensile Strength of Cylindrical Concrete Specimens. ASTM: West Conshohocken, PA, USA, 2011.
- Basu, A.; Mishra, D.A.; Roychowdhury, K. Rock Failure Modes under Uniaxial Compression, Brazilian, and Point Load Tests. Bull. Eng. Geol. Environ. 2013, 72, 457–475. [Google Scholar] [CrossRef]
- Consoli, N.C.; Cruz, R.C.; Floss, M.F.; Festugato, L. Parameters Controlling Tensile and Compressive Strength of Artificially Cemented Sand. J. Geotech. Geoenviron. Eng. 2010, 136, 759–763. [Google Scholar] [CrossRef]
- Cheng, L.; Cord-Ruwisch, R.; Shahin, M.A. Cementation of Sand Soil by Microbially Induced Calcite Precipitation at Various Degrees of Saturation. Can. Geotech. J. 2013, 50, 81–90. [Google Scholar] [CrossRef]
- Amadi, A.A. Enhancing Durability of Quarry Fines Modified Black Cotton Soil Subgrade with Cement Kiln Dust Stabilization. Transp. Geotech. 2014, 1, 55–61. [Google Scholar] [CrossRef]
- Consoli, N.C.; Quiñónez, R.A.; González, L.E.; Lopez, R.A. Influence of Molding Moisture Content and Porosity/Cement Index on Stiffness, Strength, and Failure Envelopes of Artificially Cemented Fine-Grained Soils. J. Mater. Civ. Eng. ASCE 2016, 29, 04016277. [Google Scholar] [CrossRef]
- Consoli, N.C.; Rosa, D.A.; Cruz, R.C.; Rosa, A.D. Water Content, Porosity and Cement Content as Parameters Controlling Strength of Artificially Cemented Silty Soil. Eng. Geol. 2011, 122, 328–333. [Google Scholar] [CrossRef]
- Saldanha, R.B.; Consoli, N.C. Accelerated Mix Design of Lime Stabilized Materials. J. Mater. Civ. Eng. 2016, 28, 06015012. [Google Scholar] [CrossRef]


| FA (%) | e at DR = 50% | ||||
|---|---|---|---|---|---|
| 5 | 2.51 | 0.72 | 0.36 | 0.54 | 1.63 |
| 10 | 2.45 | 0.72 | 0.34 | 0.53 | 1.60 |
| 20 | 2.34 | 0.75 | 0.30 | 0.525 | 1.53 |
| FA | Dry Sand | Water Volume (mL) | |||||||
|---|---|---|---|---|---|---|---|---|---|
| (%) | (gr) | Sr(%) = 20 | 30 | 40 | 50 | 60 | 70 | 80 | 100 |
| 5 | 425.875 | 27.431 | 36.574 | 54.862 | 73.149 | 91.436 | |||
| 10 | 418.610 | 27.087 | 36.115 | 54.173 | 72.231 | 90.289 | |||
| 20 | 400.657 | 18.025 | 26.992 | 35.989 | 45.245 | 53.984 | 63.606 | 71.979 | 89.974 |
Publisher’s Note: MDPI stays neutral with regard to jurisdictional claims in published maps and institutional affiliations. |
© 2022 by the authors. Licensee MDPI, Basel, Switzerland. This article is an open access article distributed under the terms and conditions of the Creative Commons Attribution (CC BY) license (https://creativecommons.org/licenses/by/4.0/).
Share and Cite
Simatupang, M.; Edwin, R.S.; Sulha; Mustika, W.; Putra, H.; Yanto, D.H.Y. Splitting Tensile Strength of Fly Ash-Modified Sand at Various Saturations and Curing Times. Infrastructures 2022, 7, 126. https://doi.org/10.3390/infrastructures7100126
Simatupang M, Edwin RS, Sulha, Mustika W, Putra H, Yanto DHY. Splitting Tensile Strength of Fly Ash-Modified Sand at Various Saturations and Curing Times. Infrastructures. 2022; 7(10):126. https://doi.org/10.3390/infrastructures7100126
Chicago/Turabian StyleSimatupang, Minson, Romy Suryaningrat Edwin, Sulha, Wayan Mustika, Heriansyah Putra, and Dede Heri Yuli Yanto. 2022. "Splitting Tensile Strength of Fly Ash-Modified Sand at Various Saturations and Curing Times" Infrastructures 7, no. 10: 126. https://doi.org/10.3390/infrastructures7100126