Article

Engineering and Analytical Method for Estimating the Parametric Reliability of Products by a Low Number of Tests

by
Alexey G. Amosov
1,
Vladislav A. Golikov
1,
Mikhail V. Kapitonov
1,
Fedor V. Vasilyev
2,* and
Oleg K. Rozhdestvensky
3
1
Department of Engineering Graphics, Moscow Aviation Institute, National Research University, 125993 Moscow, Russia
2
Department of Digital Technologies and Information Systems, Moscow Aviation Institute, National Research University, 125993 Moscow, Russia
3
Faculty of Teacher Education, Daugavpils University, LV-5401 Daugavpils, Latvia
*
Author to whom correspondence should be addressed.
Inventions 2022, 7(1), 24; https://doi.org/10.3390/inventions7010024
Submission received: 6 December 2021 / Revised: 28 January 2022 / Accepted: 31 January 2022 / Published: 7 February 2022
(This article belongs to the Section Inventions and Innovation in Advanced Manufacturing)

Abstract

:
The paper provides an overview of methods for determining reliability indicators and, on the basis of the analysis, proposes a new method for assessing the parametric reliability of products based on a small number of tests. The determination of the parameters and double logistic distribution based on the test results is considered, a statistical experiment was carried out, which was based on the method of statistical modeling of Monte Carlo. An example of evaluating parametric reliability by a new method is also given, on the basis of which an engineering technique is proposed. In the conclusion, remarks are made regarding the advantages of the novel method.

1. Introduction

The constant increase in the number of equipment in operation and the increase in the cost of repair and maintenance work for its maintenance are forcing manufacturers to increase the reliability of the most complex and expensive elements. A low level of reliability leads to an increase in operating costs and downtime of faulty equipment. At the same time, economic losses are the result of a decrease not only in the physical properties of individual parts, but also a decrease in the efficiency of the functioning of the entire system as a whole. There is a need to develop such methods for evaluating the effectiveness of functioning, which would allow us to evaluate indicators of parametric reliability.
A number of processes in the system can lead to failures that are not associated with the failure of individual parts, but with a deterioration in the characteristics of the equipment and their going beyond the permissible limits. In this case, one speaks of the parametric reliability of products. Parametric reliability of products is the main object of consideration of theory and practice, since it determines the state of individual mechanisms and the machine as a whole.
This work is based on the methodology developed by the authors for assessing the parametric reliability and general models of the formation of a failure and loss of machine performance, methods for calculating and predicting the parametric reliability of complex products, the theory of calculating interfaces and mechanisms, methods for studying the technological reliability of equipment, and theoretical foundations for operating machines.
The aim of the work is to obtain an engineering-analytical technique for assessing parametric reliability, taking into account possible limiting factors. The practical significance of the work can be expressed in its further application in calculating the probability of failure-free operation when designing new complex technical systems, each iteration of which is a step in the space of controlled parameters. The main characteristics of the estimation method should be the methods for determining the direction in which a step is made in space and the moment when the search for characteristics ends, along with the features of mathematical models of the objects being optimized and the formulation of problems.
In the theory and practice of reliability, an important task is to determine reliability indicators based on test results. This challenge is compounded by the high cost and short lead times for product development, which do not allow for high volume testing. Statistical methods developed for products produced in large series are not suitable in this case [1]. In a number of works [2,3], to solve this problem, it is proposed to use methods based on functional models of reliability. The main one is the parametric method, which makes it possible to take into account the physical nature of the phenomena occurring in the products. According to this method, the object is characterized by certain output parameters X i , i = 1 , n ¯ . The totality of the values of these parameters determines the performance of the object. The condition of failure-free operation is as follows:
X 1 l < X 1 < X 1 u X 2 l < X 2 < X 2 u X n l < X n < X n u ,
where X 1 l and X 1 u are, respectively, the lower and upper tolerances for the i parameter. When at least one parameter goes out of tolerance, the object will fail. Consider the performance of an object in one parameter X of continuous type. The reliability indicator is taken as the probability of the facility’s trouble-free operation.
P = p X l < X < X u = X l X u f x d x = F X u F X l .
To determine the value of the reliability indicator, based on the test results, it is required to find the distribution law of the parameter X and its numerical characteristics. Application without sufficient justification as a distribution law of normal, exponential and other typical distributions often leads to large errors [2,3]. To improve the accuracy of assessing the reliability indicator, it is advisable to apply laws that by following requirements should be:
1.
“Flexible” and covered the area of existence of known typical distribution laws;
2.
Possible to find effective, consistent and unbiased estimates of the parameters of the law with a small number of tests;
3.
Non-required for distribution function when using special functions or the compilation of tables.
With this in mind, the task can be formulated as follows: develop a methodology for assessing the product reliability indicator with a small number of tests, if the distribution law of the determining parameter is unknown a priori.
To solve this problem, we need:
  • To choose the type of distribution law that meets the requirements;
  • To develop a method for calculating effective, unbiased and consistent estimates of the parameters of the selected distribution law with a small number of tests.
When choosing a method, as a rule, two possibilities for obtaining the fastest information compete—through accelerated tests or by supplementing conventional tests with forecasting. When testing complex products for parametric reliability, in many cases, a greater distortion of the results will be due to forcing the modes and operating conditions of the machine than due to predicting the course of the process.
Thus, in the study of methods for improving the reliability of equipment, the tasks associated with reliability testing and analysis of operational data are of particular importance, on the basis of which the choice of parametric methods is carried out, indicating the best algorithms for processing the observed values, allowing to evaluate the unknown parameters of the failure model or make a decision on compliance. These parameters by given technical conditions, and the random nature of the time of occurrence of failures, the complexity of objects allows us to conclude that the mathematical apparatus of the theory of reliability can be the theory of probability and mathematical statistics, as well as the theory of queuing.

2. Procedure for Determining the Law of Distribution of the Definitive Parameter

To solve the formulated problem, we take the double logistic distribution described in [4] as a distribution that satisfies the requirements. A double logistic distribution is a distribution for which the integral function of a random value X has the next form:
F x = 1 + e x p π 3 j + ( ln x a b x 1 ,
where a and b are the limits of variation of the random variable X;
η is a parameter characterizing the peakedness of the distribution, η > 0 ;
j is a parameter characterizing the asymmetry of the distribution, < j < .
Parameters η and j depend on the limits of a and b, as well as on the mathematical expectation and variance of the random value of X.
The double logistic distribution (DLD) has a number of advantages in comparison with the known typical distributions:
1.
Forms a family of distributions corresponding to the set of values of the parameters η and j and covers the region of existence of a significant number of theoretical distributions;
2.
Contains only elementary functions and does not require the calculation of special functions or the compilation of tables;
3.
Allows you to find the inverse function, for example, to calculate quantiles;
4.
Has finite limits of variation of a random variable, which better corresponds to the values encountered in practice, which always have a limited range of possible values;
5.
Do not require the calculation of moments higher than the second order; with a small number of tests, high-order moments are determined with large errors [5];
6.
In comparison with the “flexible” Pearson distributions (of different types and types), DLD has a single form, which is convenient for practical use.
These advantages allow us to conclude that DLD is expedient to use to calculate the reliability index of an object with a small number of tests, when the distribution law of the determining parameter is a priori unknown.

2.1. Determination of the Parameters η and j of the Double Logistic Distribution from the Test Results

Let N tests of the object be carried out. Let us denote x i as the value of the parameter X in the i test. From the analysis of the results of tests or operation of similar objects (prototypes), component parts, requirements for a given object and the results of its tests, the boundaries of variation of the determining parameter a;b are identified. It is required to determine the value of the parameters η and j according to the test data. This task can be solved by the following methods.
1.
Calculate the estimates of the mathematical expectation and variance of a random variable X:
m x = 1 N i = 1 N x i ,
D x = 1 N 1 N 1 N x i m x 2 ,
and then, using the known formulas for DLD [4], calculate the estimates of the parameters:
η = 3 π 1 sin π D x 2 m x a b m x + 1 1 2 ,
j = 3 π π η 2 3 + 1 1 2 ln b m x m x a .
The method based on the use of formulas (3) and (4) is usually called classical [1]. The estimates of the parameters η and j, calculated by this method, will be denoted by η N * and j N * .
2.
The estimates of the parameters η and j are calculated by the maximum likelihood method. According to this method [6], the likelihood function is compiled:
l = i = 1 N ln f x 1 , x 2 , , x N , η , j .
Differentiating function (7) with respect to the unknown parameters η and j, we obtain the system of equations:
η = N π 3 i = 1 N ln x i a b x i 2 i = 1 N ln x i a b x i e x p π 3 j + η ln x i a b x i + 1 , j = 3 π ln 2 N i = 1 N 1 e x p π η 3 ln x i a b x i e x p π j 3 .
Solving this system, we obtain estimates of the unknown parameters, let us denote them as η M * and j M * . To compare the efficiency of methods for calculating the parameters of η and j of the selected distribution, a statistical experiment was carried out.

2.2. Statistical Experiment

The experiment was based on the method of statistical modeling (Monte Carlo method) [7]. The essence of the experiment was as follows:
1.
Using a random number generator, a sample of a given object N was generated;
2.
Targeted processing of the sample was carried out;
3.
The processing efficiency was determined by calculating the values of the corresponding estimates.
Multiple repetition of these actions allows you to obtain a set of values of estimates, which is used in the future to compare methods for efficiency.
As a purposeful processing of the sample, we considered the calculation of estimates of the parameters η and j, the construction of a distribution function corresponding to these estimates, and the calculation of the confidence zone for the distribution function.
The processing efficiency was assessed by the value of the variance of the estimates of the parameters η and j, as well as the value of the confidence distribution function.
For the study, a double logistic distribution was chosen with the parameters:
η = 0.6 ; 1.15 ; 1.8 ; 2.5 ;
j = 0.0 ; 0.5 ; 1.0 ; 1.5 ; 2.0 .
The combination of these parameters makes it possible to obtain a family of distributions covering the domain of existence of known typical distributions.
As the boundaries of variation of the random variable X were taken a = 0, b = 1. This approach made it possible to significantly shorten the experiment, since only two parameters vary η and j, in addition, from a random variable with a distribution f x , a , b , η , j , it is easy to pass to a quantity whose distribution has parameters a = 0, b = 1. The opposite is also true—the result obtained for a random variable with distribution f x , 0 , 1 , η , j , can be extended to a random variable with distribution with other parameters a and b [8].
The studies were carried out for the sample size N = 4 , 6 , 9 , 11 , 13 , 18
The experiment involves the sequential execution of the following actions:
1.
The sample size N is set;
2.
Parameters η and j of the random number generator are set;
3.
A random number generator generates a sample of size N:
x 1 , x 2 , , x N ;
4.
The sample (9) is used to calculate the estimates η N * and j N * by the classical method;
5.
The maximum likelihood method for the sample (9) calculates the estimates η M * and j M * ;
6.
The values of statistics are calculated to determine the confidence zones of the distribution functions corresponding to the estimates η N * , j N * and η M * , j M * ;
7.
Actions according to paragraphs 3–6 are repeated a sufficiently large number of L times;
8.
The mathematical expectations and variances of estimates η N * , j N * , η M * , j M * and statistics, and also builds the laws of their distribution in the form of histograms are also calculated;
9.
Actions according to clauses 2–3 are repeated for all selected values of η and j;
10.
Actions according to p. 1–9 are repeated for N = 4 , 6 , 9 , 11 , 13 , 18 . The results of performing these actions allow us to compare the methods for calculating the estimates of the parameters η and j in terms of efficiency and to develop a method for calculating the estimates of the DLD parameters for a small number of tests.

3. Results of a Statistical Experiment

3.1. Estimates of the Parameters η and j of the Double Logistic Distribution

Consider the experimental results for the η parameter. Some values of the mathematical expectation M estimates of the parameter η for the sample size N = 6 are shown below (Table 1).
Analysis of the results presented shows that the methods used give a biased estimate of the parameter η . However, the bias of the estimate η M * depends only on the sample size N and does not depend on the parameters of the distribution law. Therefore, it can be easily eliminated by introducing a bias correction. The unbiased estimate (ub) of the parameter η is equal to:
η u b * = η M * / K η M ,
where K η M is the bias coefficient of the estimate η M * , depending on the sample size N.
The bias of the estimate j N * depends both on the sample size N, and on the parameters of the distribution law. This circumstance does not allow obtaining an unbiased estimate of the parameter η by the classical method.
In addition, it turned out that the minimum and maximum values of the estimate η M * for a given sample size N are proportional to the mathematical expectation of this estimate and can be calculated by the formulas:
a η M = M η u b * K a η ,
b η M = M η u b * K b η .
where a η M and b η M are the minimum and maximum values of the estimate η u b * ;
K a η and K b η are coefficients depending on the sample size N.
The efficiency of the estimates of the parameter η will be characterized by the value of the variance. Table 2 shows some values of the variance of estimates of the parameter η for the sample N = 6.
It is seen from Table 2 that in all the above cases, the estimate η u b * is more effective than the estimate η N * , since it has less variance. The calculation results showed that the ratio of the standard deviation of the estimate η u b * to the mathematical expectation for a fixed sample size N is a constant value:
D η u b * M η u b * = c o n s t = K b η M ,
D η u b * = K b η M M η u b * 2 .
The results are shown in Table 1 and Table 2 indicate the effectiveness of the estimate obtained by the maximum likelihood method. For a complete characteristic, we will find the distribution law of the estimate η u b * . Since the number of realizations in the experiment is large enough, i.e., value L = 1000 
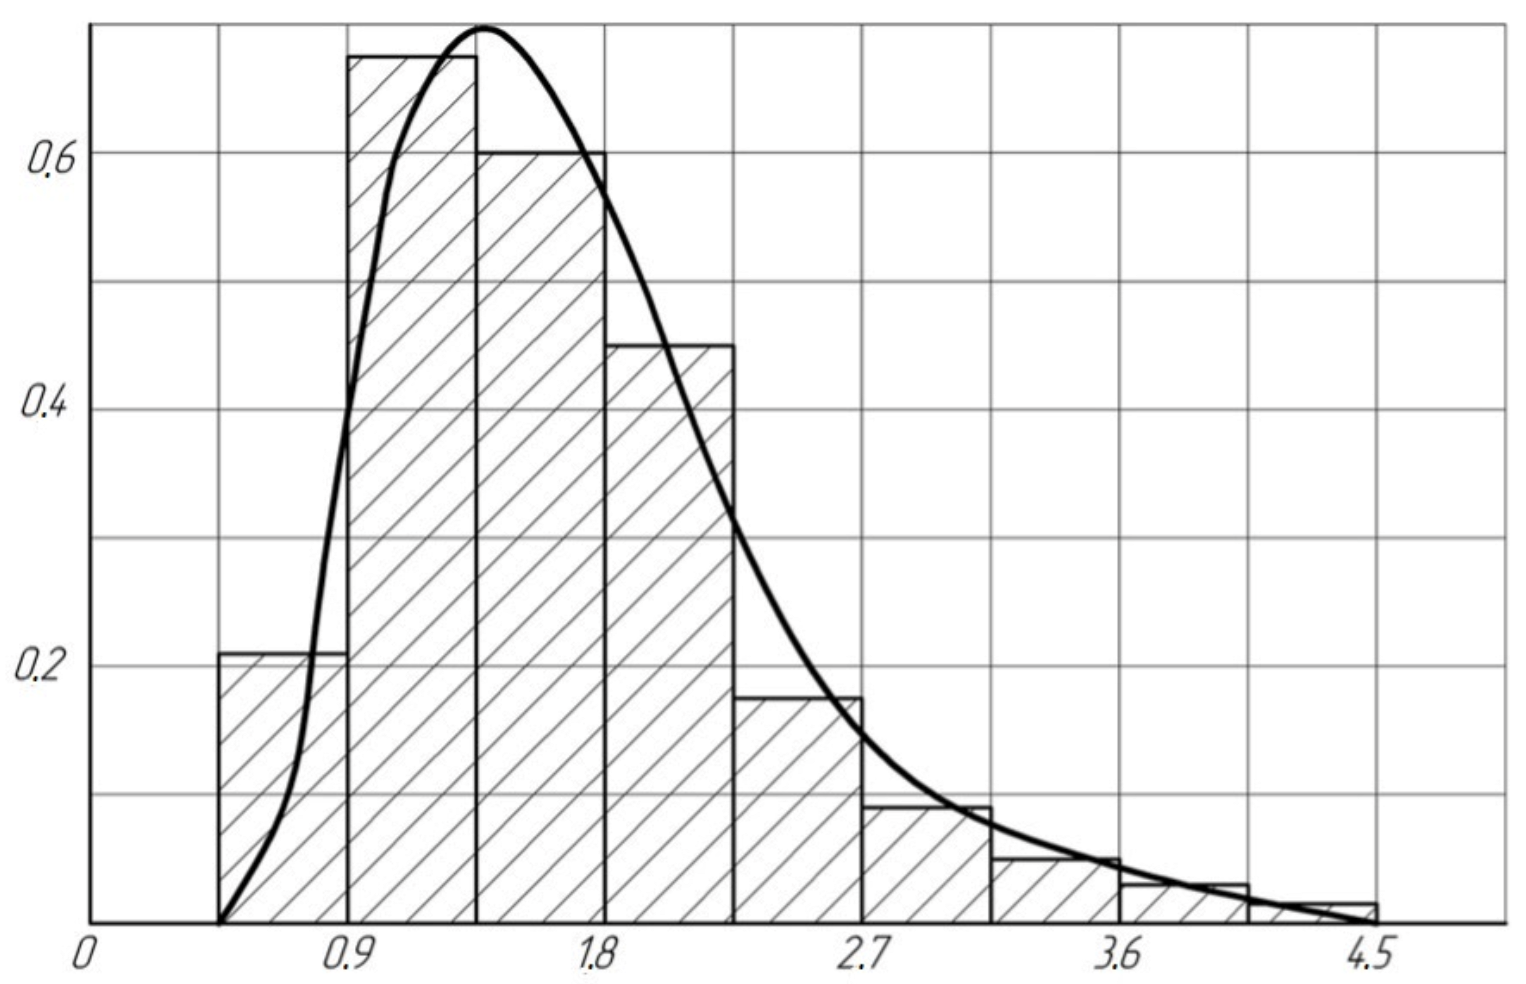
more, then it is advisable to use the histogram method. In Figure 1, as an example, a histogram is shown for assessing η u b * with a sample size N = 6 and the value of the parameters of the law under study η = 1.712 and j = 0 .
Analysis of the obtained histograms showed that the distribution of the estimate η u b * with a sufficient degree of accuracy can be described by DLD with the parameters η η * , j j * , a η * and b η * . Parameters η η * and j η * are calculated by formulas (5) and (6) taking into account (9), and the parameters a η * and b η * by formulas (11) and (12).
Taking into account that the DLD density function is reversible, for a given confidence probability β we can calculate interval estimates of the parameter η :
η ̲ * = a η * + b j * 1 + β 1 β 3 π η η * e x p j η * η η * 1 + 1 + β 1 β 3 π η η * e x p j η * η η * ,
η ¯ * = a η * + b η * 1 β 1 + β 3 π η η * e x p j η * η η * 1 + 1 β 1 + β 3 π η η * e x p j η * η η * ,
where η ̲ * and η ¯ * are the lower and upper bounds of the confidence interval of the estimate η u b * .
To calculate the boundaries of the confidence interval of the estimate η u b * , calculated from a small number of tests, the value of this estimate is substituted into formulas (11), (12) and (14) instead of the mathematical expectation.
The values of the coefficients K η M , K σ η , K a η and K b η , obtained experimentally, for all studied N are given in Table 3.
Studies have shown that to calculate the coefficients K η M , K σ η , K a η and K b η , for any sample size N you can use the following formulas:
K η M = N a k η + b k η N a k η + c k η ,
K σ η = a σ η e x p b σ η N c σ η ,
K a η = N a a η + b a η N a a η + c a η ,
K b η = N a b η + b b η N b b η + c b η .
The values a i , b i and c i are constants.
Let us consider the experimental results for the parameter j. Table 4 shows some values of the mathematical expectation of estimates of the parameter j for a sample size of N = 6.
Analysis of the results obtained shows that both methods used give a biased estimate of the parameter j. Moreover, as for the parameter η , the bias of the estimate j M * depends only on the sample size N and it can be taken into account by introducing a similar correction. Unbiased estimate of the parameter j:
j u b * = j M * / K j M ,
where K j M is the estimate bias coefficient j M * , depending on the sample size N.
The bias of the estimate j N * depends on the parameters of the distribution law and it is not possible to take it into account for this method.
The minimum a j * and maximum b j * estimates j u b * can be calculated using the formulas:
a j * = a a j M j u b * 2 n a + b a j N + c a j ,
a j * = a a j M j u b * 2 n a + b a j N + c a j .
The efficiency of estimates of the parameter j, as well as for the parameter η , will be characterized by the value of the variance. Table 5 shows some values of the variance of estimates of the parameter j for the sample size N = 6.
Table 5 shows that in all the cases considered, the j u b * estimate is more effective than the j N * estimate, since it has a lower variance.
The variance of the j u b * estimate for any sample size is calculated by the formula:
D j u b * = K D j M j u b * + 0.671875 ,
where K D j is a coefficient depending on the sample size N.
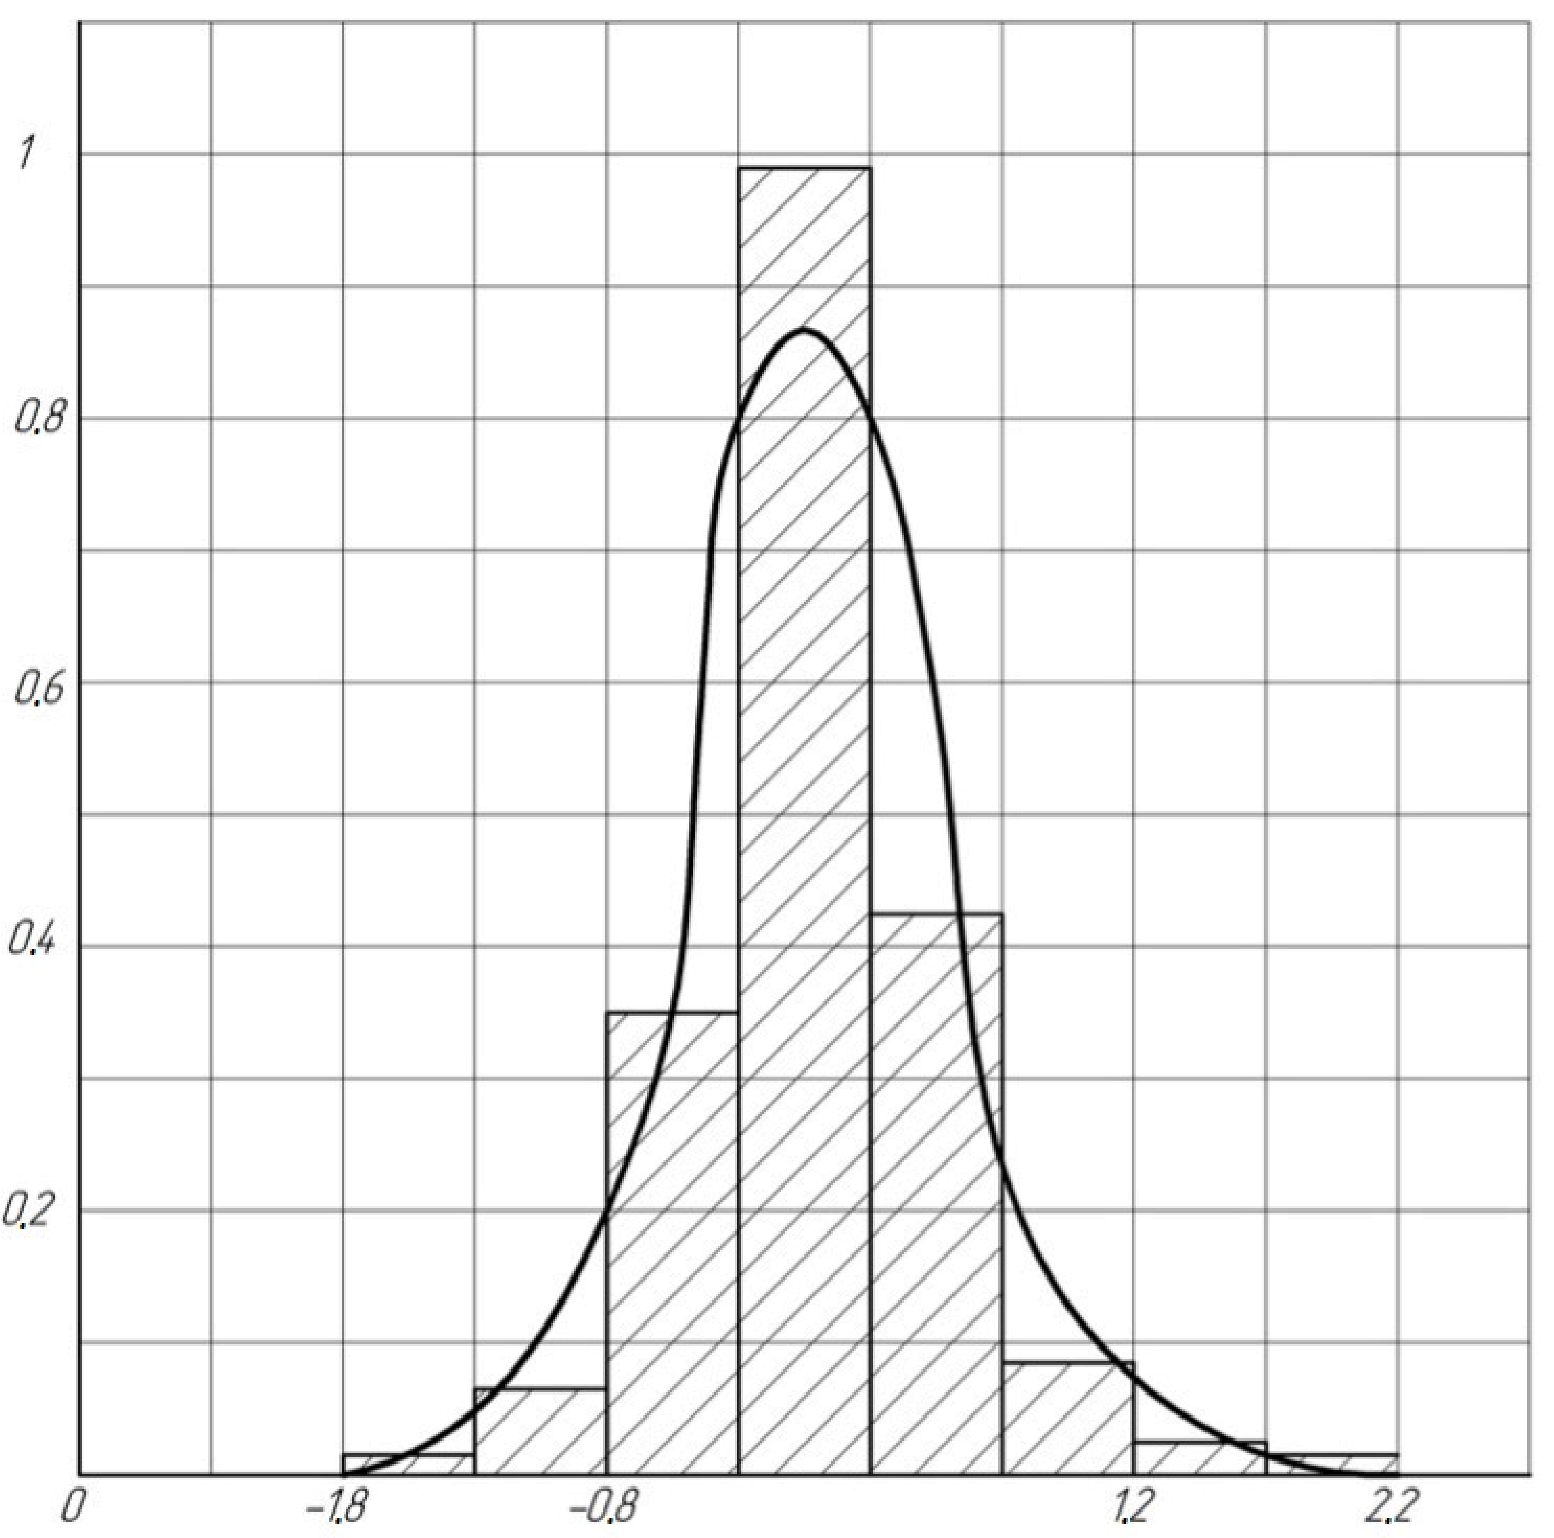
To fully characterize the estimate j u b * we find the law of its distribution using the histogram method. In Figure 2, as an example, a histogram is shown for evaluating j u b * with a sample size N = 6 and the values of the parameters of the law under study η = 1.712 , j = 0 .
The analysis of the obtained histograms showed that the distribution of the j u b * estimate with a sufficient degree of accuracy can be described by DLD with the parameters n j * , j j * , a j * and b j * . Parameters n j * and j j * are calculated by formulas (5) and (6) taking into account (21) and (24), and the parameters a j * and b j * by formulas (22) and (23). The numeric values a i , b i and c i are constant.
Using the obtained distribution law of the estimate j u b * , for a given confidence probability β we can calculate the interval estimates:
j ̲ * = a j * + b j * 1 + β 1 β 3 π η j * e x p j j * n j * 1 + 1 + β 1 β 3 π η j * e x p j j * n j * ,
j ¯ * = a j * + b j * 1 β 1 + β 3 π η j * e x p j j * n j * 1 + 1 β 1 + β 3 π η j * e x p j j * n j * ,
where j ̲ * and j ¯ * are, respectively, the lower and upper bounds of the confidence interval of the j u b * estimate.
To calculate the boundaries of the confidence interval of the j u b * e s t i m a t e calculated from a small number of tests, the value of this estimate is substituted into formulas (22)–(24) instead of the mathematical expectation.
The values of the coefficients K j M and K D j , obtained experimentally, for all studied N, are given in Table 6.
Studies have shown that the following formulas can be used to calculate the coefficients K j M and K D j for any sample size:
K j M = N a K j + b K j N a K j + c K j ,
K D j = a D j e x p b D j N c D j .
The numeric values a i , b i and c i are constant.
Thus, the analysis of the results of a statistical experiment for estimates η and j of the selected distribution law allows us to draw the following conclusions:
  • The maximum likelihood method allows you to calculate unbiased estimates of the parameters η and j, with minimum variance; the effectiveness of estimates η u b * and j u b * compared to estimates η N * and j N * , for example, with a sample size N = 6 and the parameters of the law under study η = 1.712 and j = 0 are higher:
    • by parameter η by 1.157 0.829 0.829 = 40 % ;
    • by parameter j by 0.289 0.209 0.209 = 38 % ;
  • It was established by statistical modeling that the estimates η u b * and j u b * follow a double logistic distribution, therefore it is possible to calculate the exact confidence intervals for these parameters;
  • To calculate the point and interval estimates of the parameters η and j, it is not required to draw up special tables.

3.2. Distribution Function Prediction

The parameters η u b * and j u b * calculated by the maximum likelihood method allow finding an estimate of the distribution function of a random variable x F M * x . For practical calculations with a small sample size, in addition, it is necessary to calculate the confidence zone of the distribution function. For this purpose, various well-known statistics can be used, for example, x 2 , ω 2 (Mises), the maximum absolute divergence of the distribution functions D N . The selection of statistics is based on the following requirements:
  • It should be independent of the parameters of the adopted distribution law and be determined only by the sample size N;
  • the value of the statistics should not depend on any additional parameters, for example, on the number of intervals for dividing the domain of existence of the estimate;
  • Allowed calculating the confidence bounds of the distribution function [9].
During the experiment, the three previously indicated statistics were investigated: x 2 , ω 2 and D N . Analysis of the results of the experiment showed that the listed requirements are satisfied only by statistics calculated by the formula: D N M = F M * x F x .
Table 7, for example, shows some values of the mathematical expectation and variance of the statistics D N M with a sample size of N = 6 , as well as its largest value.
The above data confirm that the statistics D N M meet the requirements [10].
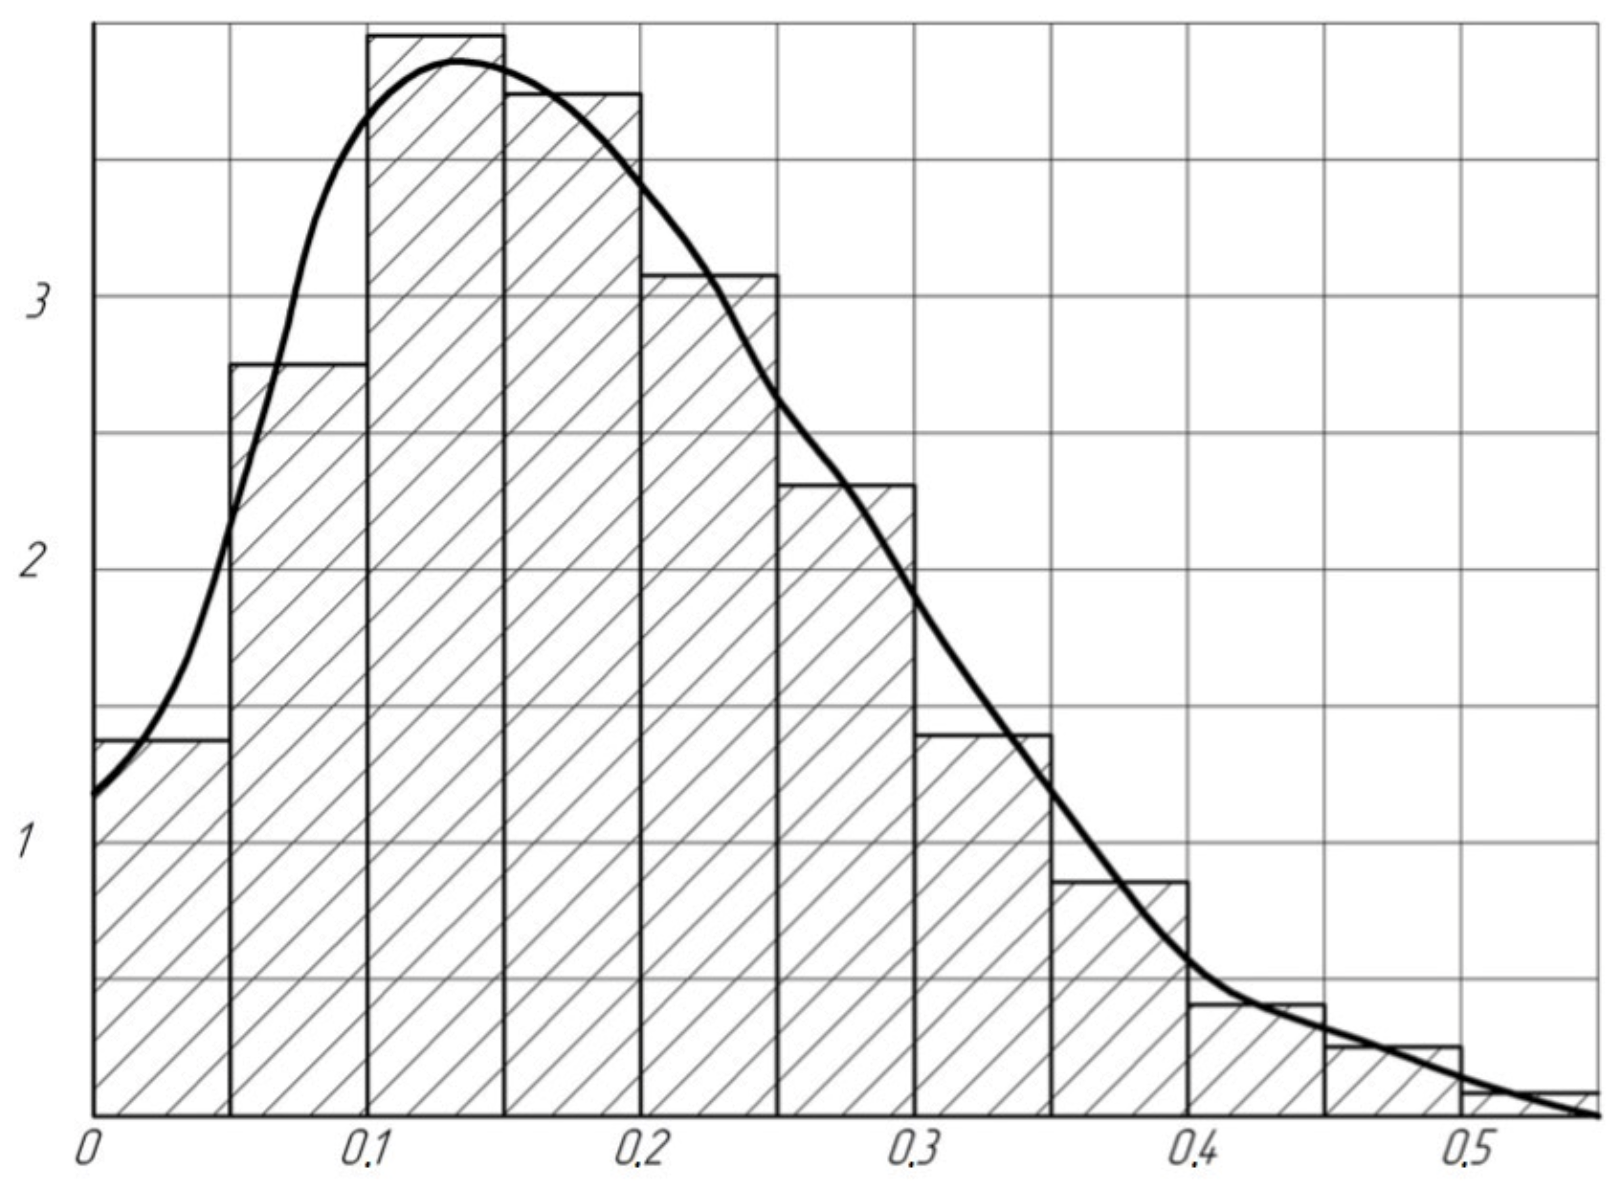
To fully characterize the statistics D N M let us find its distribution law using the histogram method. In Figure 3 shows a histogram for statistics D N M with a sample size of N = 6 .
Studies have shown that the distribution of statistics D N M with a sufficient degree of accuracy can be described by DLD with the parameters η D N , j D N , a D N = 0 , b D N [11,12]. The parameters η D N and j D N are calculated by formulas (5) and (6). To calculate them, you need to know M D N M and D D N M . Table 8 shows the values of M D N M and D D N M depending on the sample size.
Calculations have established that M D N M , D D N M and b D N for any sample size can be calculated by the formulas:
M D N M = a M e x p b M N c M ,
D N M = a D e x p b D N c D ,
b D N = a b e x p b b N c b .
The values a i , b i and c i are constants.
Using the obtained distribution law of statistics D N M , interval estimates of the distribution function for a given confidence probability β , are calculated by the formulas:
F ̲ M * x = 0 , i f D N M β > F M * x ; F M * x D N M β , i f D N M β < F M * x ;
F ¯ M * x = F M * x + D N M β , i f F M * x < 1 D N M β ; 1 , i f F M * x + D N M β > 1 .
where the value of the statistic D N M β defined as follows:
D N M β = b D N 1 β β 3 π η D N e x p j D N η D N 1 + 1 β β 3 π η D N e x p j D N η D N .
The effectiveness of the proposed method for predicting the distribution law of a random variable x will be estimated by the width of the confidence zone for the distribution function. Table 9 shows the values of the statistics D N M β for different confidence probabilities β and sample sizes.
The first lines of this table give the values D N M β , calculated by (34), the second lines—borrowed from [13] and corresponding to the classical method of estimating the distribution law.
For comparison, let us calculate the required test volume N k , which ensures the accuracy D N k ( 0.8 ) = 0.283 . The same accuracy was obtained by the proposed method for a sample of N = 6 . To do this, we compose the equation:
D N β N = D N k β N k ,
solving which, we get:
N k = N D N β D N k β 2 = 5 0.447 0.283 2 11 .

3.3. The Resulting Engineering and Analytical Methodology for Assessing the Parametric Reliability of Products by a Small Number of Tests

In the process of developing a new product N tests were carried out. In each i test, the value of the output parameter x, was measured, let us denote it by x i . It is required to determine the likelihood of failure-free operation of the facility.
It is proposed to solve the problem in the following sequence.
1.
Analyze products and requirements for them, test results and operation of analogs (prototypes), component parts, physical and mechanical properties of structural materials in order to establish the boundaries of variation of the parameter x a ; b ;
2.
Solve the system of Equation (6) and calculate the unbiased estimates η u b * and j u b * DLD using formulas (10) and (21). Calculate interval estimates for the parameters η and j, using formulas (15), (16), (25) and (26);
3.
Calculate the distribution function F M * x at n points of the interval a ; b and build its graph. It is recommended to take n = 10 + 30 depending on the required accuracy of plotting for the analysis of the calculation results;
4.
Determine the boundaries of the confidence interval of the distribution function by formulas (32) and (33) at n points of the interval a ; b and plot them on the same graph;
5.
Calculate a point estimate of the probability of no-failure operation of the facility (1) based on the test results:
P = 1 1 + e x p π 3 j u b * + η u b * ln x b a b x b 1 1 + e x p π 3 j u b * + η u b * ln x M a b x M ;
6.
Find interval estimates of the probability of no-failure operation:
P ̲ = 0 , i f P D N M β 0 ; P D N M β , i f P D N M β > 0 ;
P ¯ = 1 , i f P + D N M β 1 ; P + D N M β , i f P + D N M β < 1 ;
7.
Analyze the results obtained and compare them with the required values. If necessary, develop measures to improve reliability. Repeat the assessment of the reliability indicator again.

4. Discussion

Modern methods for calculating and evaluating parametric reliability do not always give accurate values of the determined quantities. They describe only full and clear links between parameters. Empirical coefficients and characteristics are widely used in engineering calculations. Consider an example of modeling the aging process of power equipment insulation [14]. The calculation in this article is based on fundamental physical laws and empirical patterns obtained for a narrow range of reliability parameters. The normal distribution hypothesis of the output parameter is often used to determine the probability of the absence of a parametric failure. As can be seen from the study [14], in order to more accurately determine the probability of the absence of a parametric failure in this way, there is a need to increase the number of realizations. It can also be seen that the technique applies only to the output parameter, which is scattered by 10% or more. However, in this work, it is necessary to increase the accuracy of the output parameter because the initial selection does not provide the required accuracy.
In [15], the results are presented in the form of models that refine the technical information available in the reference and scientific literature in processing techniques. The information contains specific reliability parameters that apply to the technological system. The evaluation of parametric reliability is carried out in a narrow area of factor analysis and depends on the conditions of a particular production. And for this very reason, the adequacy of the models obtained after diagnostics is higher than the adequacy of the models obtained in idealized laboratory conditions.
In [16], various destabilizing factors influence on elements of a twisted-pair cable during operation. The simultaneous influence of complex actions leads to changes in the semiconductor materials properties and their reliability parameters. The change in parameters can occur both abruptly and gradually. In view of the foregoing, reliability in operation is estimated by the probability of fail-free operation of all the systems [17]. There are also sudden failures models based on the study of statistical and probabilistic patterns of behavior of similar elements set. At the same time, the authors divide the possible states of elements mainly into two types of states (serviceability and malfunction), described by reliability indicators. However, the study revealed limited application of bootstrap methods with and without restoration, as well as assessment method of restored systems and experimental data processing method and so forth due to the lack of connection between the determined indicators of reliability, the physical characteristics of the materials of the equipment elements and the factors affecting them. In this regard, boundary, matrix, and dynamic test methods are used to assess the reliability indicators of the “twisted pair” cable.
According to operational data of twisted pair cable obtained in [18] the probability begins to decrease sharply with decreasing shape factor. Thus, the Weibull distribution describes in detail the behavior of the probability of failure-free operation function depending on time and data rate fall. This fact indicates that when calculating the reliability of elements and sudden failures, it is also necessary to consider the parametric reliability.
All these works have one drawback. They do not have a procedure for conducting an engineering analysis of the parametric reliability assessment, which is given in our study.
Of course, the developed method may have some limitations, but to confirm its efficiency, we propose to consider an example:
Some product has been tested N = 5 times. No modifications were made between tests. The tests were carried out under the same conditions. Known initial data are shown in the Table 10.
We get the results of the calculation.
1.
From the analysis of the structure of the object and tests of the prototype, the boundaries of the parameter x change, we establish: a = 0 ; b = 1.0 .
2.
By solving the system of Equation (13), we obtain biased estimates of the parameters of the distribution law:
η M * = 1.702 ; j M * = 1.118 .
The unbiased estimates will be:
η u b * = 1.702 / 1.381 = 1.232 ,
j u b * = 1.118 / 1.360 = 0.822 ,
η ̲ * = 0.645 , η ¯ * = 2.257 ,
j ̲ * = 0.047 , j ¯ * = 2.150 .
3.
The values of the distribution function calculated at n = 10 points are summarized in Table 11.
4.
Point estimate of the probability of no-failure operation:
P = 0.990 0.0 = 0.990 .
5.
We calculate interval estimates of the probability of no-failure operation at β = 0.8 :
P ̲ = 0.990 0.283 = 0.707 ,
P ¯ = 0.990 + 0.283 = 1 .
These values are valid due to fulfilling the conditions described in Section 3.3:
P ̲ = 0 , i f P D N M β 0 ; P D N M β , i f P D N M β > 0 ;
P ¯ = 1 , i f P + D N M β 1 ; P + D N M β , i f P + D N M β < 1 .
Let us determine the number of samples by reverse recalculation for the classical scheme according to Equation (36):
N k = N D N β D N k β 2 = 10 0.447 0.283 2 25 .
By the classical method, the sample size N should be more than doubled to achieve accuracy.
The fulfillment of the conditions confirms that the achieved level of reliability meets the requirements. Therefore, further refinement of the product is not required. That proves the efficiency of the engineering and analytical methodology.

5. Conclusions

Statistical information on failures would be useful for a reasonable choice of the theoretical distribution of time between failures. Furthermore, the selected theoretical distribution of operating time between failures must correspond to a specific model of product approach to failure.
Analysis of the statistical experiment results allows us to conclude that the distribution laws of the parameters estimate η and j are calculated by the maximum likelihood method. Therefore, they can only be determined by the sample size and when they are independent of each other.
From the data given in Section 3.2, it can be seen that the prediction of the distribution function by the proposed method allows one to obtain a more accurate result than the classical method of mathematical statistics.
The analysis of the statistical experiment results proves the new method’s effectiveness for predicting the distribution law of the determining parameter. An engineering technique was created based on this method.
The obtained methodical approach can be used for testing products on parametric reliability and for studying the distribution law of the output parameter under known operation laws. Due to the impossibility of accurately predicting a failure as a random event in time and place of occurrence, it follows that it is impossible to prevent failures completely. However, steps can be taken to reduce their frequency.
The application of the methodological approach also confirms the previous studies, calculation of reliability indicators according to the model can be carried out by the method of statistical modeling, but it is necessary to consider the uniform distribution law of factors over randomly chosen confidential intervals [19].
The authors’ experience in the operation of complex technical systems shows that the operational reliability is almost always lower than the level obtained from the calculation results. The inaccuracy is explained by the production technology’s imperfection and the low reliability of reference information.

Author Contributions

Conceptualization, A.G.A. and F.V.V.; data curation, M.V.K.; formal analysis, V.A.G.; funding acquisition, A.G.A. and F.V.V.; investigation, A.G.A. and V.A.G.; methodology, M.V.K.; project administration, A.G.A.; software, V.A.G. and M.V.K.; validation, F.V.V. and O.K.R.; visualisation, F.V.V.; writing—original draft preparation, A.G.A.; writing—review and editing, F.V.V. and O.K.R. All authors have read and agreed to the published version of the manuscript.

Funding

This research received no external funding.

Conflicts of Interest

The authors declare no conflict of interest.

References

  1. Obraztsova, I.F.; Volmira, A.S. (Eds.) Problems of Aircraft Reliability; Mechanical Engineering; Mashinostroenie: Moscow, Russia, 1985; 280p. [Google Scholar]
  2. Ostreykovsky, V.A. Multi-Factor Reliability Tests; Energiya: Moscow, Russia, 1978; 152p. [Google Scholar]
  3. Novetsky, P.V.; Zograf, I.A. Estimation of Errors of Measurement Results; Energoatomizdat: Saint Petersburg, Russia, 1985; 248p. [Google Scholar]
  4. Kotelnikov, V.P. Investigation of the Laws of Distribution of Random Processes; Rostov Military Institute of Missile Forces: Rostov-on-Don, Russia, 1982; 24p. [Google Scholar]
  5. Wentzel, E.S. Probability Theory; Fizmatgiz: Moscow, Russia, 1962; 564p. [Google Scholar]
  6. Ayvazyan, S.A.; Enyukov, I.S.; Meshalkin, L.D. Applied Statistics: Basics of Modeling and Primary Data Processing; Finance and Statistics: Moscow, Russia, 1983; 487p. [Google Scholar]
  7. Orlov, A.I. Interrelation of limit theorems and the Monte Carlo method. Sci. J. KubSAU 2015, 114, 27–41. [Google Scholar]
  8. Syrykh, N.N.; Kabdin, N.E. Application of the Monte Carlo Method in Determining the Reliability of Electrical Equipment. Agroengineering 2013, 2, 7–10. [Google Scholar]
  9. Golikov, V.A. Classification of indicators of reliability of systems in heavy engineering. J. Phys. Conf. Ser. 2021, 1889, 042069. [Google Scholar] [CrossRef]
  10. Ziha, K. Uncertainty of integral system safety in engineering. ASCE-ASME J. Risk Uncertain. Eng. Syst. Part B Mech. Eng. 2021, 8, 021201. [Google Scholar] [CrossRef]
  11. Kuatov, B.Z.; Kusainov, A.B.; Suleimenov, E.A.; Nurzhanov, D.K. Complex indicators of the reliability of aviation equipment. In Proceedings of the International Symposium “Reliability and Quality”; Penza State University: Penza, Russia, 2016; Volume 2, pp. 253–257. [Google Scholar]
  12. Kashkovsky, V.V.; Tikhiy, I.I. A systematic approach to the state of the society of technical products in terms of reliability characteristics. Mod. Technol. Syst. Anal. Model. 2016, 4, 143–150. [Google Scholar]
  13. Bolshev, L.N.; Smirnov, N.V. Mathematical Statistics Tables; Nauka: Moscow, Russia, 1965; 464p. [Google Scholar]
  14. Pronikov, A.S. Parametric Reliability of Machines; MGTU im. N.E. Bauman: Moscow, Russia, 2019; 590p. [Google Scholar]
  15. Suslov, A.G.; Fedorov, V.P.; Nagorkin, M.N.; Pyrikov, I.L. An integrated approach to experimental research of metalworking technological systems to ensure reliability parameters and operational properties of machine parts. Sci.-Intensive Technol. Mech. Eng. 2018, 10, 3–13. [Google Scholar]
  16. Polesskiy, S.N.; Mayakova, O.Y.; Aleinikov, A.V.; Vostrikov, A.V. Calculation of the parametric reliability of the “twisted pair” cable. Syst. Adm. 2020, 169, 73–79. [Google Scholar]
  17. Kozlov, B.A.; Ushakov, I.A. Handbook for Calculating the Reliability of Radio Electronics and Automation Equipment; Radio: Moscow, Russia, 2017; 472p. [Google Scholar]
  18. Rogozhin, A.A.; Drimba, S.A.; Gerba, Y.A. Assessment of the structural and parametric reliability of integrated security systems of protected objects. In Bulletin of the Voronezh State University, Series: System Analysis and Information Technologies; Voronezh State University: Voronezh, Russia, 2018; Volume 3, pp. 127–135. [Google Scholar]
  19. Mikhailova, E.V. Application of Parametric Models and Systems to Identify Test Reliability. Innov. Invest. 2021, 8, 108–111. [Google Scholar]
Figure 1. Histogram for evaluation η u b * .
Inventions 07 00024 g001
Figure 2. Histogram for evaluation j u b * .
Inventions 07 00024 g002
Figure 3. Histogram for statistics D N M .
Inventions 07 00024 g003
Table 1. Mean values.
j01
η 0.61.151.82.500.61.151.82.50
M η M * 1.0361.5192.3643.4521.0361.5192.3643.452
M η N * 0.8641.2691.9772.8891.0471.3962.0592.983
K η M 1.3811.3811.3811.3811.3811.3811.3811.381
K η N 1.1521.1541.1551.1561.3961.2691.2031.193
K a η 0.2940.2940.2940.2940.2940.2940.2940.294
K b η 6.2906.2906.2906.2906.2906.2906.2906.290
Table 2. Variance values of parameter estimates η .
j01
η 0.61.151.82.500.61.151.82.50
D η u b * 0.1590.3420.8291.7670.1590.3420.8291.767
D η N * 0.2450.4911.1572.4450.4600.6471.2832.573
K b η M 0.5320.5320.5320.5320.5320.5320.5320.532
K b η N 0.6600.6370.6280.6250.9040.7310.6620.642
Table 3. Experimental values of the coefficients K η M , K σ η , K a η and K b η .
N469111318
K η M 2.0201.3811.2371.1351.0781.063
K σ η 1.1180.5320.4030.3100.2280.197
K a η 0.1550.2940.3860.4960.5430.575
K b η 15.6956.2903.9083.0741.9701.870
Table 4. The effective values of the mathematical expectation of the parameter estimates j.
η 1.151.8
j 01.01.52.001.01.52.0
M j M * −0.0161.3652.0562.746−0.0161.3652.0562.746
M j N * −0.0161.2872.1512.914−0.0141.2051.9042.715
K j M 1.3651.3701.373 1.3651.3701.373
K j N 1.2871.4341.457 1.2051.2691.356
Table 5. Variance values of parameter estimates j.
η 1.101.712
j01.01.52.001.01.52.0
D j u b * 0.2090.5430.9281.4600.2090.5430.9281.460
D j N * 0.3011.1182.6013.2410.2870.8681.6983.138
Table 6. Experimental values of the coefficients K j M and K D j .
N469111318
K j M 1.9331.3651.2161.1251.0711.062
K D j 0.8010.3200.1840.1200.0720.057
Table 7. Values of mathematical expectation and variance of statistics D N M .
j01
η 0.61.151.80.61.151.8
M D N M 0.1910.1910.1900.1910.1900.190
D D N M 0.01120.01120.01110.01120.01110.0111
b D N M 0.5610.5610.5610.5610.5610.561
Table 8. Values of M D N M and D D N M depending on the sample size.
η 469111318
M D N M 0.2540.1900.1640.1370.1120.097
D D N M 0.01480.01110.00750.00410.00410.0031
b D N 0.850.560.450.370.310.28
Table 9. Statistics values D N M β .
N β Line Number
0.990.980.950.900.80
40.6260.5730.4930.4260.3541
0.8290.7850.7080.6360.5652
60.4840.4540.4000.3470.2831
0.6690.6270.5630.5090.4472
90.3970.3740.3340.2930.2431
0.5760.5380.4830.4360.3812
110.3340.3170.2840.2500.2061
0.4890.4570.4090.3690.3232
130.2800.2660.2380.2090.1711
0.4040.3770.3380.3040.2662
180.2490.2340.2080.1810.1481
0.3520.3290.2940.2650.2322
Table 10. Values of M D N M and D D N M depending on the sample size.
P = 0.985 ; P 3 ̲ = 0.630 ; P 3 ¯ = 0.999 ;
x 1 = 0.2997 ; x 2 = 0.5176 ; x 3 = 0.5195 ;
x 4 = 0.5002 ; x 5 = 0.7715 ;
x H = 0.0 ; x 6 = 0.8 .
β = 0.8 .
Table 11. Distribution function values.
12345678910
β i 0.10.20.30.40.50.60.70.80.91.0
P M * β i 0.0320.1670.4010.6420.8160.9170.9670.9900.9981.000
P ¯ M * β i 0.3150.4500.6840.9251.0001.0001.0001.0001.0001.000
P ̲ M * β i 0.0000.0000.1180.3590.5330.6340.6840.7070.7150.717
Publisher’s Note: MDPI stays neutral with regard to jurisdictional claims in published maps and institutional affiliations.

