Patient-Related Risk Factors for Unplanned 30-Day Hospital Readmission Following Primary and Revision Total Knee Arthroplasty: A Systematic Review and Meta-Analysis

 , , ,
, , ,
Abstract
:1. Introduction
Objectives
2. Methods
2.1. Protocol and Registration
2.2. Eligibility Criteria
2.3. Information Sources, Search Strategy, and Study Inclusion
2.4. Data Collection Process
2.5. Data Items
2.6. Risk of Bias of Individual Studies
2.7. Risk of Bias across Studies
2.8. Synthesis of Results
2.9. Sensitivity Analyses Were Conducted, Based on the Following Criteria
- Removal of studies with lower methodological quality, i.e., higher risk of bias.
- Removal of studies of mixed cohorts, i.e., a combined cohort of primary and revision TKA patients.
- Removal of studies with substantially different patient eligibility criteria to other studies, for example, those that restricted their analysis to patients over 80 years old where other studies placed no restriction on age.
3. Results
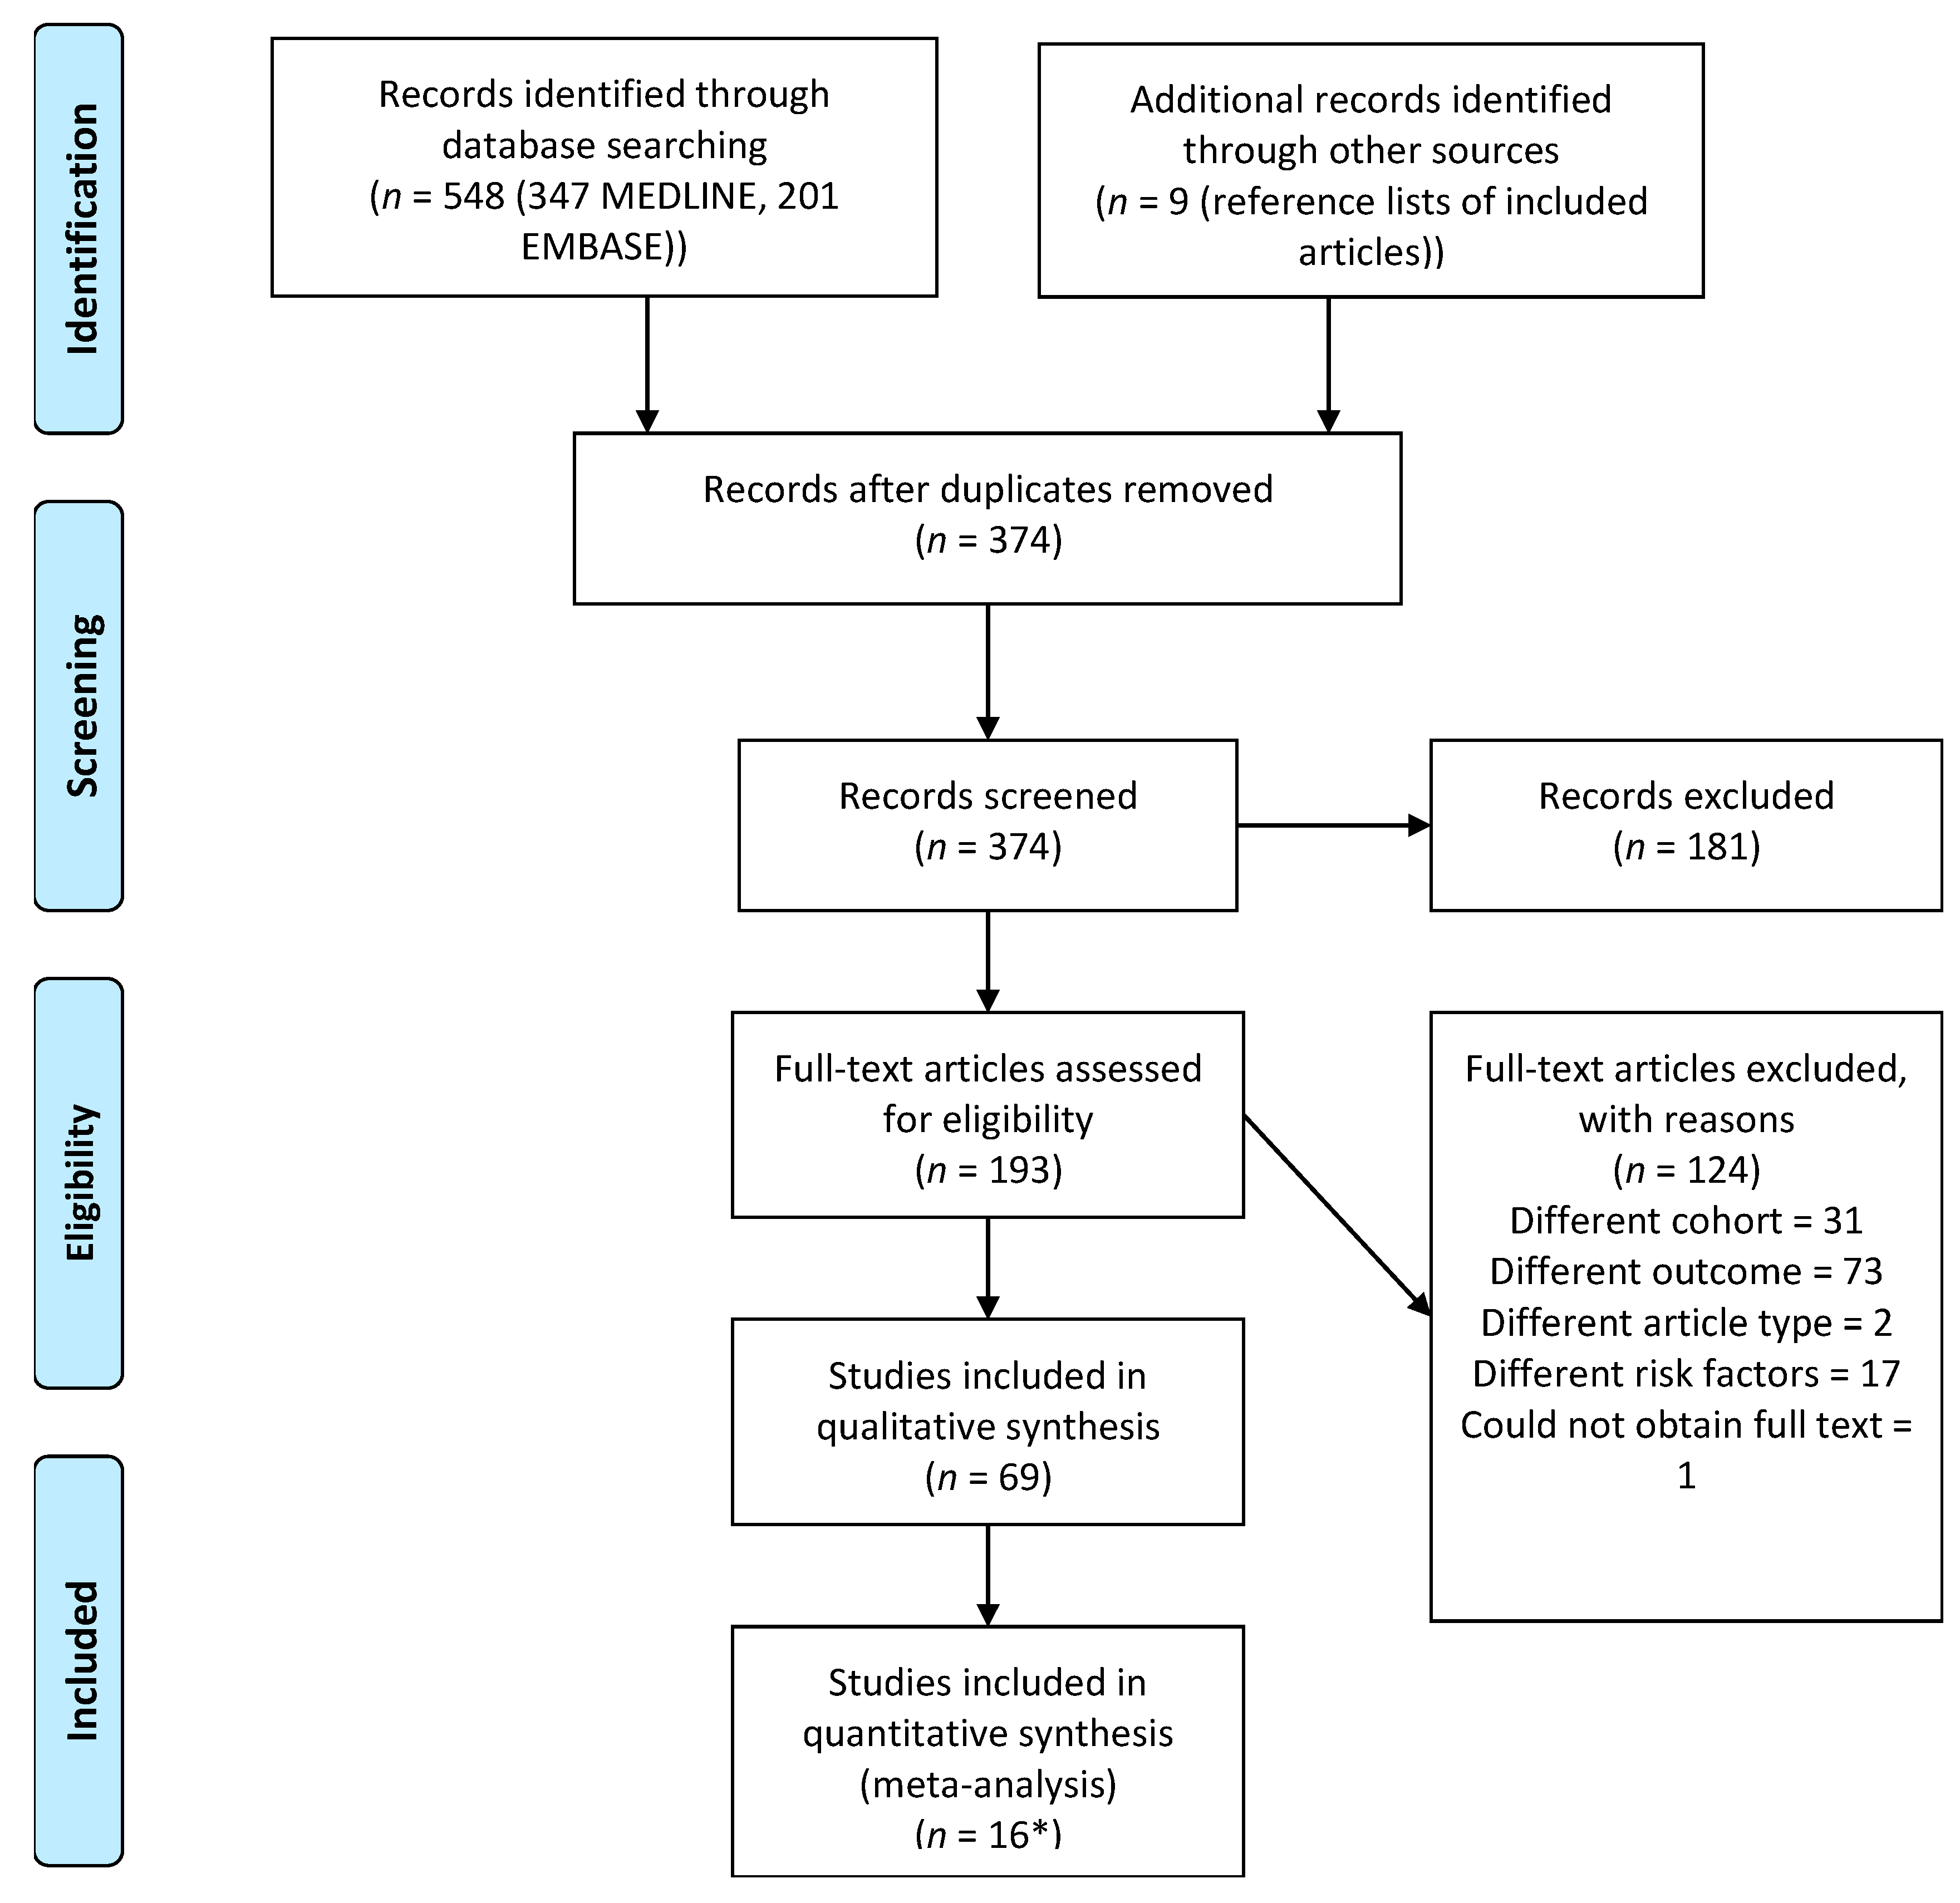
3.1. Study Selection
3.2. Risk of Bias of Individual Studies
3.3. Risk of Bias across Studies
3.4. Synthesis of Evidence
3.4.1. Comorbidities
3.4.2. Demographics
3.4.3. Other
3.4.4. Revision-Only Cohorts
3.4.5. Different Types of Readmission
4. Discussion
Strengths and Limitations
5. Conclusions
Supplementary Materials
Author Contributions
Funding
Institutional Review Board Statement
Informed Consent Statement
Data Availability Statement
Acknowledgments
Conflicts of Interest
References
- Ethgen, O.; Bruyere, O.; Richy, F.; Dardennes, C.; Reginster, J.Y. Health-related quality of life in total hip and total knee arthroplasty. A qualitative and systematic review of the literature. J. Bone Joint Surg. Am. Vol. 2004, 86-a, 963–974. [Google Scholar] [CrossRef] [PubMed]
- Association, A.O. Annual Report 2017; Australian Orthopaedic Association - South Australian Health and Medical Research Institute: Adelaide, Australia, 2017. [Google Scholar]
- Kurtz, S.; Ong, K.; Lau, E.; Mowat, F.; Halpern, M. Projections of primary and revision hip and knee arthroplasty in the United States from 2005 to 2030. J. Bone Joint Surg. Am. Vol. 2007, 89, 780–785. [Google Scholar] [CrossRef]
- Rucco, V.; Zanetti, R.; Colonnello, V. Complications after total knee arthroplasty. Eur. J. Phys. Rehabil. Med. 2001, 37, 115. [Google Scholar]
- Ramkumar, P.N.; Chu, C.; Harris, J.; Athiviraham, A.; Harrington, M.; White, D.; Berger, D.; Naik, A.; Li, L. Causes and rates of unplanned readmissions after elective primary total joint arthroplasty: A systematic review and meta-analysis. Am. J. Orthop. 2015, 44, 397–405. [Google Scholar] [PubMed]
- Schairer, W.W.; Vail, T.P.; Bozic, K.J. What are the rates and causes of hospital readmission after total knee arthroplasty? Knee. Clin. Orthop. Relat. Res. 2014, 472, 181–187. [Google Scholar] [CrossRef] [Green Version]
- Fischer, C.; Lingsma, H.F.; Marang-van de Mheen, P.J.; Kringos, D.S.; Klazinga, N.S.; Steyerberg, E.W. Is the readmission rate a valid quality indicator? A review of the evidence. PLoS ONE 2014, 9, e112282. [Google Scholar] [CrossRef] [Green Version]
- Joynt, K.E.; Jha, A.K. Thirty-day readmissions--truth and consequences. New Engl. J. Med. 2012, 366, 1366–1369. [Google Scholar] [CrossRef] [Green Version]
- Fonarow, G.C. Unintended Harm Associated With the Hospital Readmissions Reduction Program. Jama 2018, 320, 2539–2541. [Google Scholar] [CrossRef]
- Hamar, G.B.; Coberley, C.; Pope, J.E.; Cottrill, A.; Verrall, S.; Larkin, S.; Rula, E.Y. Effect of post-hospital discharge telephonic intervention on hospital readmissions in a privately insured population in Australia. Aust. Health Rev. 2018, 42, 241–247. [Google Scholar] [CrossRef]
- ACSQHC. Avoidable Hospital Readmissions: Report on Australian and International Indicators, Their Use and the Efficacy of Interventions to Reduce Readmissions; Australian Commission on Safety and Quality in Health Care: Sydney, Australia, 2019. [Google Scholar]
- McIlvennan, C.K.; Eapen, Z.J.; Allen, L.A. Hospital readmissions reduction program. Circulation 2015, 131, 1796–1803. [Google Scholar] [CrossRef]
- Ramaswamy, A.; Marchese, M.; Cole, A.P.; Harmouch, S.; Friedlander, D.; Weissman, J.S.; Lipsitz, S.R.; Haider, A.H.; Kibel, A.S.; Schoenfeld, A.J.; et al. Comparison of Hospital Readmission After Total Hip and Total Knee Arthroplasty vs Spinal Surgery After Implementation of the Hospital Readmissions Reduction Program. JAMA Network Open 2019, 2, e194634. [Google Scholar] [CrossRef] [PubMed]
- Tilbury, C.; Haanstra, T.M.; Leichtenberg, C.S.; Verdegaal, S.H.; Ostelo, R.W.; de Vet, H.C.; Nelissen, R.G.; Vliet Vlieland, T.P. Unfulfilled Expectations After Total Hip and Knee Arthroplasty Surgery: There Is a Need for Better Preoperative Patient Information and Education. J. Arthroplast. 2016, 31, 2139–2145. [Google Scholar] [CrossRef] [PubMed]
- Gould, D.; Dowsey, M.; Jo, I.; Choong, P. Patient-related risk factors for unplanned 30-day readmission following total knee arthroplasty: A narrative literature review. ANZ J. Surg. 2020, 22, 22. [Google Scholar] [CrossRef] [PubMed]
- Culliford, D.; Maskell, J.; Judge, A.; Cooper, C.; Prieto-Alhambra, D.; Arden, N.K. Future projections of total hip and knee arthroplasty in the UK: Results from the UK Clinical Practice Research Datalink. Osteoarthr. Cartil. 2015, 23, 594–600. [Google Scholar] [CrossRef] [Green Version]
- Ravi, B.; Croxford, R.; Reichmann, W.M.; Losina, E.; Katz, J.N.; Hawker, G.A. The changing demographics of total joint arthroplasty recipients in the United States and Ontario from 2001 to 2007. Best Pract. Res. Clin. Rheumatol. 2012, 26, 637–647. [Google Scholar] [CrossRef]
- Goudie, E.B.; Robinson, C.; Walmsley, P.; Brenkel, I. Changing trends in total knee replacement. Eur. J. Orthop. Surg. Traumatol. 2017, 27, 539–544. [Google Scholar] [CrossRef] [Green Version]
- Huguet, A.; Hayden, J.A.; Stinson, J.; McGrath, P.J.; Chambers, C.T.; Tougas, M.E.; Wozney, L. Judging the quality of evidence in reviews of prognostic factor research: Adapting the GRADE framework. Syst. Rev. 2013, 2, 71. [Google Scholar] [CrossRef] [Green Version]
- Gould, D.; Dowsey, M.; Spelman, T.; Jo, I.; Kabir, W.; Trieu, J.; Choong, P. Patient-related risk factors for unplanned 30-day readmission following total knee arthroplasty: A protocol for a systematic review and meta-analysis. Syst. Rev. 2019, 8, 215. [Google Scholar] [CrossRef]
- Moher, D.; Liberati, A.; Tetzlaff, J.; Altman, D.G.; Group, P. Preferred reporting items for systematic reviews and meta-analyses: The PRISMA statement. PLoS Med. 2009, 6, e1000097. [Google Scholar] [CrossRef] [Green Version]
- Schardt, C.; Adams, M.B.; Owens, T.; Keitz, S.; Fontelo, P. Utilization of the PICO framework to improve searching PubMed for clinical questions. BMC Med. Inform. Decis. Mak. 2007, 7, 16. [Google Scholar] [CrossRef] [Green Version]
- Pugely, A.J.; Callaghan, J.J.; Martin, C.T.; Cram, P.; Gao, Y. Incidence of and risk factors for 30-day readmission following elective primary total joint arthroplasty: Analysis from the ACS-NSQIP. J. Arthroplast. 2013, 28, 1499–1504. [Google Scholar] [CrossRef]
- Viera, A. Odds ratios and risk ratios: what’s the difference and why does it matter? South. Med. J. 2008, 101, 730–734. [Google Scholar] [CrossRef] [PubMed]
- Moola, S.; MZTufanaru, C.; Aromataris, E.; Sears, K.; Sfetcu, R.; Currie, M.; Lisy, K.; Qureshi, R.; Mattis, P.; Mu, P. Chapter 7: Systematic reviews of etiology and risk. In Joanna Briggs Institute Reviewer’s Manual; The Joanna Briggs Institute: Adelaide, Australia, 2017. [Google Scholar]
- Goplen, C.M.; Verbeek, W.; Kang, S.H.; Jones, C.A.; Voaklander, D.C.; Churchill, T.A.; Beaupre, L.A. Preoperative opioid use is associated with worse patient outcomes after total joint arthroplasty: A systematic review and meta-analysis. BMC Musculoskelet. Disord. 2019, 20, 234. [Google Scholar] [CrossRef] [PubMed]
- Detweiler, B.; Kollmorgen, L.; Umberham, B.; Hedin, R.; Vassar, B. Risk of bias and methodological appraisal practices in systematic reviews published in anaesthetic journals: A meta-epidemiological study. Anaesthesia 2016, 71, 955–968. [Google Scholar] [CrossRef] [PubMed]
- Team, R.C. R: A Language and Environment for Statistical Computing; R Foundation for Statistical Computing: Vienna, Austria, 2013. [Google Scholar]
- Schwarzer, G. meta: An R package for meta-analysis. R News 2007, 7, 40–45. [Google Scholar]
- Wickham, H.; Wickham, M.H. Package tidyverse. In Easily Install and Load the ‘Tidyverse; World Health Organization: Geneva, Switzerland, 2017. [Google Scholar]
- Jorgensen, C.C.; Kehlet, H.; Lundbeck Foundation Centre for Fast-track, H.; Knee Replacement Collaborative, G. Outcomes in smokers and alcohol users after fast-track hip and knee arthroplasty. Acta Anaesthesiol. Scand. 2013, 57, 631–638. [Google Scholar] [CrossRef]
- Hanly, R.J.; Marvi, S.K.; Whitehouse, S.L.; Crawford, R.W. Morbid Obesity in Total Knee Arthroplasty: Joint-Specific Variance in Outcomes for Operative Time, Length of Stay, and Readmission. J. Arthroplast. 2017, 32, 2712–2716. [Google Scholar] [CrossRef] [Green Version]
- Abdulla, I.; Mahdavi, S.; Khong, H.; Gill, R.; Powell, J.; Johnston, K.D.; Sharma, R. Does body mass index affect the rate of adverse outcomes in total hip and knee arthroplasty? A retrospective review of a total joint replacement database. Can. J. Surg. 2020, 63, E142–E149. [Google Scholar] [CrossRef]
- Ross, T.D.; Dvorani, E.; Saskin, R.; Khoshbin, A.; Atrey, A.; Ward, S.E. Temporal Trends and Predictors of Thirty-Day Readmissions and Emergency Department Visits Following Total Knee Arthroplasty in Ontario Between 2003 and 2016. J. Arthroplast. 2020, 35, 364–370. [Google Scholar] [CrossRef]
- Peskun, C.; Mayne, I.; Malempati, H.; Kosashvili, Y.; Gross, A.; Backstein, D. Cardiovascular disease predicts complications following bilateral total knee arthroplasty under a single anesthetic. Knee 2012, 19, 580–584. [Google Scholar] [CrossRef]
- Buitrago, G.; Ortiz, J.R.; Camacho, F. Clinical Outcomes, Health Care Costs and Prognostic Factors for Total Knee Arthroplasty: A Multilevel Analysis of a National Cohort Study Using Administrative Claims Data. J. Knee Surg. 2020, 24, 24. [Google Scholar] [CrossRef] [PubMed]
- Jørgensen, C.C.; Pitter, F.T.; Kehlet, H. Safety aspects of preoperative high-dose glucocorticoid in primary total knee replacement. Br. J. Anaesth. 2017, 119, 267–275. [Google Scholar] [CrossRef] [PubMed] [Green Version]
- Tang, H.; Li, H.; Zhang, S.; Wang, Y.; Qu, X.; Yue, B. Postoperative Complications Causing Readmission in 30 Days after Total Knee Arthroplasty: A Retrospective Nested Case-Control Study of Risk Factors Based on Propensity Score Matching. J. Knee Surg. 2019, 29, 29. [Google Scholar] [CrossRef] [PubMed]
- Tay, K.S.; Cher, E.W.L.; Zhang, K.; Tan, S.B.; Howe, T.S.; Koh, J.S.B. Comorbidities Have a Greater Impact Than Age Alone in the Outcomes of Octogenarian Total Knee Arthroplasty. J. Arthroplast. 2017, 32, 3373–3378. [Google Scholar] [CrossRef]
- Liao, K.M.; Lu, H.Y. Complications after total knee replacement in patients with chronic obstructive pulmonary disease: A nationwide case-control study. Medicine 2016, 95, e4835. [Google Scholar] [CrossRef]
- Kuo, F.C.; Lin, P.C.; Lu, Y.D.; Lee, M.S.; Wang, J.W. Chronic Kidney Disease Is an Independent Risk Factor for Transfusion, Cardiovascular Complication, and Thirty-Day Readmission in Minimally Invasive Total Knee Arthroplasty. J. Arthroplast. 2017, 32, 1630–1634. [Google Scholar] [CrossRef]
- Ali, A.M.; Loeffler, M.D.; Aylin, P.; Bottle, A. Predictors of 30-Day Readmission After Total Knee Arthroplasty: Analysis of 566,323 Procedures in the United Kingdom. J. Arthroplast. 2019, 34, 242–248.e241. [Google Scholar] [CrossRef]
- Miric, A.; Inacio, M.C.S.; Kelly, M.P.; Namba, R.S. Can Total Knee Arthroplasty Be Safely Performed Among Nonagenarians? An Evaluation of Morbidity and Mortality Within a Total Joint Replacement Registry. J. Arthroplast. 2014, 29, 1635–1638. [Google Scholar] [CrossRef]
- Welsh, R.L.; Graham, J.E.; Karmarkar, A.M.; Leland, N.E.; Baillargeon, J.G.; Wild, D.L.; Ottenbacher, K.J. Effects of Postacute Settings on Readmission Rates and Reasons for Readmission Following Total Knee Arthroplasty. J. Am. Med. Dir. Assoc. 2017, 18, 367.e1–367.e10. [Google Scholar] [CrossRef] [Green Version]
- Kim, S.C.; Jin, Y.; Lee, Y.C.; Lii, J.; Franklin, P.D.; Solomon, D.H.; Franklin, J.M.; Katz, J.N.; Desai, R.J. Association of Preoperative Opioid Use With Mortality and Short-term Safety Outcomes After Total Knee Replacement. JAMA Netw. Open 2019, 2, e198061. [Google Scholar] [CrossRef] [Green Version]
- Kurtz, S.M.; Lau, E.C.; Ong, K.L.; Adler, E.M.; Kolisek, F.R.; Manley, M.T. Which Hospital and Clinical Factors Drive 30- and 90-Day Readmission After TKA? J. Arthroplast. 2016, 31, 2099–2107. [Google Scholar] [CrossRef] [PubMed] [Green Version]
- Anthony, C.A.; Peterson, R.A.; Sewell, D.K.; Polgreen, L.A.; Simmering, J.E.; Callaghan, J.J.; Polgreen, P.M. The Seasonal Variability of Surgical Site Infections in Knee and Hip Arthroplasty. J. Arthroplast. 2018, 33, 510–514.e511. [Google Scholar] [CrossRef] [PubMed]
- Urish, K.L.; Qin, Y.; Li, B.Y.; Borza, T.; Sessine, M.; Kirk, P.; Hollenbeck, B.K.; Helm, J.E.; Lavieri, M.S.; Skolarus, T.A.; et al. Predictors and Cost of Readmission in Total Knee Arthroplasty. J. Arthroplast. 2018, 33, 2759–2763. [Google Scholar] [CrossRef] [PubMed] [Green Version]
- Sodhi, N.; Mont, M.A.; Cleveland Clinic Orthopaedic, A. Does Patient Experience After a Total Knee Arthroplasty Predict Readmission? J. Arthroplast. 2019, 34, 2573–2579. [Google Scholar] [CrossRef] [PubMed]
- Singh, J.A.; Kwoh, C.K.; Richardson, D.; Chen, W.; Ibrahim, S.A. Sex and surgical outcomes and mortality after primary total knee arthroplasty: A risk-adjusted analysis. Arthritis Care Res. 2013, 65, 1095–1102. [Google Scholar] [CrossRef] [PubMed] [Green Version]
- Arroyo, N.S.; White, R.S.; Gaber-Baylis, L.K.; La, M.; Fisher, A.D.; Samaru, M. Racial/ethnic and socioeconomic disparities in total knee arthroplasty 30-and 90-day readmissions: A multi-payer and multistate analysis, 2007–2014. Popul. Health Manag. 2019, 22, 175–185. [Google Scholar] [CrossRef]
- Bullock, D.P.; Sporer, S.M.; Shirreffs, T.G., Jr. Comparison of simultaneous bilateral with unilateral total knee arthroplasty in terms of perioperative complications. J. Bone Jt. Surg. Am. Vol. 2003, 85-A, 1981–1986. [Google Scholar] [CrossRef]
- Charette, R.S.; Sloan, M.; DeAngelis, R.D.; Lee, G.C. Higher Rate of Early Revision Following Primary Total Knee Arthroplasty in Patients Under Age 55: A Cautionary Tale. J. Arthroplast. 2019. [Google Scholar] [CrossRef]
- D’Apuzzo, M.; Westrich, G.; Hidaka, C.; Jung Pan, T.; Lyman, S. All-Cause Versus Complication-Specific Readmission Following Total Knee Arthroplasty. J. Bone Jt. Surg. Am. Vol. 2017, 99, 1093–1103. [Google Scholar] [CrossRef]
- Keeney, J.A.; Nam, D.; Johnson, S.R.; Nunley, R.M.; Clohisy, J.C.; Barrack, R.L. Socioeconomically Disadvantaged CMS Beneficiaries Do Not Benefit From the Readmission Reduction Initiatives. J. Arthroplast. 2015, 30, 2082–2085. [Google Scholar] [CrossRef]
- Ramos, N.L.; Karia, R.J.; Hutzler, L.H.; Brandt, A.M.; Slover, J.D.; Bosco, J.A. The effect of discharge disposition on 30-day readmission rates after total joint arthroplasty. J. Arthroplasty 2014, 29, 674–677. [Google Scholar] [CrossRef] [PubMed]
- Ricciardi, B.F.; Oi, K.K.; Daines, S.B.; Lee, Y.Y.; Joseph, A.D.; Westrich, G.H. Patient and Perioperative Variables Affecting 30-Day Readmission for Surgical Complications After Hip and Knee Arthroplasties: A Matched Cohort Study. J. Arthroplast. 2017, 32, 1074–1079. [Google Scholar] [CrossRef] [PubMed]
- Saucedo, J.M.; Marecek, G.S.; Wanke, T.R.; Lee, J.; Stulberg, S.D.; Puri, L. Understanding readmission after primary total hip and knee arthroplasty: who’s at risk? J. Arthroplast. 2014, 29, 256–260. [Google Scholar] [CrossRef] [PubMed]
- Schaeffer, J.F.; Scott, D.J.; Godin, J.A.; Attarian, D.E.; Wellman, S.S.; Mather, R.C., III. The association of ASA class on total knee and total hip arthroplasty readmission rates in an academic hospital. J. Arthroplast. 2015, 30, 723–727. [Google Scholar] [CrossRef]
- Workman, K.K.; Angerett, N.; Lippe, R.; Shin, A.; King, S. Thirty-Day Unplanned Readmission after Total Knee Arthroplasty at a Teaching Community Hospital: Rates, Reasons, and Risk Factors. J. Knee Surg. 2019, 10, 10. [Google Scholar] [CrossRef]
- Siracuse, B.L.; Ippolito, J.A.; Gibson, P.D.; Ohman-Strickland, P.A.; Beebe, K.S. A Preoperative Scale for Determining Surgical Readmission Risk After Total Knee Arthroplasty. J. Bone Jt. Surg. Am. Vol. 2017, 99, e112. [Google Scholar] [CrossRef]
- Weick, J.; Bawa, H.; Dirschl, D.R.; Luu, H.H. Preoperative opioid use is associated with higher readmission and revision rates in total knee and total hip arthroplasty. J. Bone Jt. Surg. Am. Vol. 2018, 100, 1171–1176. [Google Scholar] [CrossRef]
- Kheir, M.M.; Clement, R.C.; Derman, P.B.; Flynn, D.N.; Speck, R.M.; Levin, L.S.; Fleisher, L.A. Are there identifiable risk factors and causes associated with unplanned readmissions following total knee arthroplasty? J. Arthroplast. 2014, 29, 2192–2196. [Google Scholar] [CrossRef]
- Anderson, B.J.; Liu, M.; Cui, X.; Stevens, M.; Arensman, M.A. Adverse Outcomes Associated With Inpatient Administration of Beers List Medications Following Total Knee Replacement. Clin. Ther. 2020, 42, 592–604.e1. [Google Scholar] [CrossRef]
- Mudumbai, S.C.; Chung, P.; Nguyen, N.; Harris, B.; Clark, J.D.; Wagner, T.H.; Giori, N.J.; Stafford, R.S.; Mariano, E.R. Perioperative Opioid Prescribing Patterns and Readmissions After Total Knee Arthroplasty in a National Cohort of Veterans Health Administration Patients. Pain Med. 2019, 21, 595–603. [Google Scholar] [CrossRef]
- Abola, M.V.; Tanenbaum, J.E.; Bomberger, T.T.; Knapik, D.M.; Fitzgerald, S.J.; Wera, G.D. Preoperative Hyponatremia Is Associated with Reoperation and Prolonged Length of Hospital Stay following Total Knee Arthroplasty. J. Knee Surg. 2018, 4, 4. [Google Scholar] [CrossRef] [PubMed]
- Alvi, H.M.; Mednick, R.E.; Krishnan, V.; Kwasny, M.J.; Beal, M.D.; Manning, D.W. The Effect of BMI on 30 Day Outcomes Following Total Joint Arthroplasty. J. Arthroplast. 2015, 30, 1113–1117. [Google Scholar] [CrossRef] [PubMed]
- Antoniak, D.T.; Benes, B.J.; Hartman, C.W.; Vokoun, C.W.; Samson, K.K.; Shiffermiller, J.F. Impact of Chronic Kidney Disease in Older Adults Undergoing Hip or Knee Arthroplasty: A Large Database Study. J. Arthroplast. 2020, 35, 1214–1221.e5. [Google Scholar] [CrossRef] [PubMed]
- Belmont, P.J., Jr.; Goodman, G.P.; Rodriguez, M.; Bader, J.O.; Waterman, B.R.; Schoenfeld, A.J. Predictors of hospital readmission following revision total knee arthroplasty. Knee Surg. Sports Traumatol. Arthrosc. 2016, 24, 3329–3338. [Google Scholar] [CrossRef]
- Bovonratwet, P.; Tyagi, V.; Ottesen, T.D.; Ondeck, N.T.; Rubin, L.E.; Grauer, J.N. Revision Total Knee Arthroplasty in Octogenarians: An Analysis of 957 Cases. J. Arthroplast. 2018, 33, 178–184. [Google Scholar] [CrossRef]
- Bovonratwet, P.; Fu, M.C.; Tyagi, V.; Gu, A.; Sculco, P.K.; Grauer, J.N. Is Discharge Within a Day of Total Knee Arthroplasty Safe in the Octogenarian Population? J. Arthroplast. 2019, 34, 235–241. [Google Scholar] [CrossRef]
- Bovonratwet, P.; Shen, T.S.; Ast, M.P.; Mayman, D.J.; Haas, S.B.; Su, E.P. Reasons and Risk Factors for 30-Day Readmission After Outpatient Total Knee Arthroplasty: A Review of 3015 Cases. J. Arthroplast. 2020, 35, 2451–2457. [Google Scholar] [CrossRef]
- Courtney, P.M.; Boniello, A.J.; Della Valle, C.J.; Lee, G.C. Risk Adjustment Is Necessary in Value-based Outcomes Models for Infected TKA. Clin. Orthop. 2018, 476, 1940–1948. [Google Scholar] [CrossRef]
- Curtis, G.L.; Chughtai, M.; Khlopas, A.; Newman, J.M.; Sultan, A.A.; Sodhi, N.; Barsoum, W.K.; Higuera, C.A.; Mont, M.A. Perioperative Outcomes and Short-Term Complications Following Total Knee Arthroplasty in Chronically, Immunosuppressed Patients. Surg. Technol. Int. 2018, 32, 263–269. [Google Scholar]
- Curtis, G.; Hammad, A.; Anis, H.K.; Sodhi, N.; Ehiorobo, J.O.; Higuera, C.A.; Little, B.E.; Mont, M.A.; Darwiche, H.F. Preoperative Functional Status Predicts Increased Morbidity Following Total Knee Arthroplasty. Surg. Technol. Int. 2019, 34, 1. [Google Scholar]
- George, J.; Piuzzi, N.S.; Ng, M.; Sodhi, N.; Khlopas, A.A.; Mont, M.A. Association Between Body Mass Index and Thirty-Day Complications After Total Knee Arthroplasty. J. Arthroplast. 2018, 33, 865–871. [Google Scholar] [CrossRef] [PubMed]
- Gwam, C.U.; Sultan, A.; Rosas, S.; Sullivan, R.; Seem, M.; Ohanale, C.; Plate, J.F. Dialysis Is Not Associated with Increased Risk of Perioperative Complications in TKA Patients after Adjusting for Pertinent Confounders. J. Knee Surg. 2020, 33, 745–749. [Google Scholar] [CrossRef] [PubMed]
- Hart, A.; Antoniou, J.; Brin, Y.S.; Huk, O.L.; Zukor, D.J.; Bergeron, S.G. Simultaneous Bilateral Versus Unilateral Total Knee Arthroplasty: A Comparison of 30-Day Readmission Rates and Major Complications. J. Arthroplast. 2016, 31, 31–35. [Google Scholar] [CrossRef] [PubMed]
- Jauregui, J.J.; Cherian, J.J.; Pierce, T.P.; Elmallah, R.K.; Mont, M.A. Thirty-Day Readmission Rates Comparing Specific Cruciate Retaining and Posterior Stabilizing Knee Arthroplasties to the National Readmission Rates. J. Autom. Inf. Sci. 2015, 25, 307–311. [Google Scholar] [CrossRef]
- Kester, B.S.; Minhas, S.V.; Vigdorchik, J.M.; Schwarzkopf, R. Total Knee Arthroplasty for Posttraumatic Osteoarthritis: Is it Time for a New Classification? J. Arthroplast. 2016, 31, 1649–1653.e1641. [Google Scholar] [CrossRef]
- Lehtonen, E.J.; Hess, M.C.; McGwin, G., Jr.; Shah, A.; Godoy-Santos, A.L.; Naranje, S. Risk Factors for Early Hospital Readmission Following Total Knee Arthroplasty. Acta Ortop 2018, 26, 309–313. [Google Scholar] [CrossRef]
- Lovecchio, F.; Beal, M.; Kwasny, M.; Manning, D. Do patients with insulin-dependent and noninsulin-dependent diabetes have different risks for complications after arthroplasty? Clin. Orthop. Relat. Res. 2014, 472, 3570–3575. [Google Scholar] [CrossRef] [Green Version]
- Nowak, L.L.; Schemitsch, E.H. Same-day and delayed hospital discharge are associated with worse outcomes following total knee arthroplasty. Bone Jt. J. 2019, 101-B, 70–76. [Google Scholar] [CrossRef]
- Ottesen, T.D.; Zogg, C.K.; Haynes, M.S.; Malpani, R.; Bellamkonda, K.S.; Grauer, J.N. Dialysis Patients Undergoing Total Knee Arthroplasty Have Significantly Increased Odds of Perioperative Adverse Events Independent of Demographic and Comorbidity Factors. J. Arthroplast. 2018, 33, 2827–2834. [Google Scholar] [CrossRef]
- Patel, A.P.; Gronbeck, C.; Chambers, M.; Harrington, M.A.; Halawi, M.J. Gender and Total Joint Arthroplasty: Variable Outcomes by Procedure Type. Arthroplast. Today 2020, 6, 517–520. [Google Scholar] [CrossRef]
- Patterson, J.T.; Tillinghast, K.; Ward, D. Dialysis Dependence Predicts Complications, Intensive Care Unit Care, Length of Stay, and Skilled Nursing Needs in Elective Primary Total Knee and Hip Arthroplasty. J. Arthroplast. 2018, 33, 2263–2267. [Google Scholar] [CrossRef] [PubMed]
- Robinson, J.; Shin, J.I.; Dowdell, J.E.; Moucha, C.S.; Chen, D.D. Impact of Gender on 30-Day Complications After Primary Total Joint Arthroplasty. J. Arthroplast. 2017, 32, 2370–2374. [Google Scholar] [CrossRef] [PubMed]
- Roth, A.; Khlopas, A.; George, J.; Churchill, J.L.; Molloy, R.; Mont, M.A.; Piuzzi, N.S.; Higuera, C.A. The Effect of Body Mass Index on 30-day Complications After Revision Total Hip and Knee Arthroplasty. J. Arthroplast. 2019. [Google Scholar] [CrossRef] [PubMed]
- Rudasill, S.E.; Liu, J.; Kamath, A.F. Revisiting the International Normalized Ratio (INR) Threshold for Complications in Primary Total Knee Arthroplasty: An Analysis of 21,239 Cases. J. Bone Jt. Surg. Am. Vol. 2019, 101, 514–522. [Google Scholar] [CrossRef]
- Runner, R.P.; Bellamy, J.L.; Vu, C.C.L.; Erens, G.A.; Schenker, M.L.; Guild, G.N., 3rd. Modified Frailty Index Is an Effective Risk Assessment Tool in Primary Total Knee Arthroplasty. J. Arthroplast. 2017, 32, S177–S182. [Google Scholar] [CrossRef]
- Sloan, M.; Sheth, N.P.; Nelson, C.L. Obesity and hypoalbuminaemia are independent risk factors for readmission and reoperation following primary total knee arthroplasty. Bone Jt. J. 2020, 102-B, 31–35. [Google Scholar] [CrossRef]
- Sodhi, N.; Anis, H.K.; Coste, M.; Ehiorobo, J.O.; Chee, A.; Freund, B.; Sultan, A.A.; Moskal, J.T.; Scuderi, G.R.; Mont, M.A. A Nationwide Analysis of Preoperative Planning on Operative Times and Postoperative Complications in Total Knee Arthroplasty. J. Knee Surg. 2019, 32, 1040–1045. [Google Scholar] [CrossRef]
- Suleiman, L.I.; Edelstein, A.I.; Thompson, R.M.; Alvi, H.M.; Kwasny, M.J.; Manning, D.W. Perioperative Outcomes Following Unilateral Versus Bilateral Total Knee Arthroplasty. J. Arthroplast. 2015, 30, 1927–1930. [Google Scholar] [CrossRef]
- Sutton, J.C.; Antoniou, J.; Epure, L.M.; Huk, O.L.; Zukor, D.J.; Bergeron, S.G. Hospital Discharge within 2 Days Following Total Hip or Knee Arthroplasty Does Not Increase Major-Complication and Readmission Rates. J. Bone Jt. Surg. Am. Vol. 2016, 98, 1419–1428. [Google Scholar] [CrossRef]
- Webb, M.L.; Golinvaux, N.S.; Ibe, I.K.; Bovonratwet, P.; Ellman, M.S.; Grauer, J.N. Comparison of Perioperative Adverse Event Rates After Total Knee Arthroplasty in Patients With Diabetes: Insulin Dependence Makes a Difference. J. Arthroplast. 2017, 32, 2947–2951. [Google Scholar] [CrossRef]
- Yohe, N.; Funk, A.; Ciminero, M.; Erez, O.; Saleh, A. Complications and Readmissions After Total Knee Replacement in Octogenarians and Nonagenarians. Geriatr 2018, 9, 2151459318804113. [Google Scholar] [CrossRef] [PubMed] [Green Version]
- Zusmanovich, M.; Kester, B.S.; Schwarzkopf, R. Postoperative Complications of Total Joint Arthroplasty in Obese Patients Stratified by BMI. J. Arthroplast. 2018, 33, 856–864. [Google Scholar] [CrossRef] [PubMed]
- Sterne, J.A.C.; Sutton, A.J.; Ioannidis, J.P.A.; Terrin, N.; Jones, D.R.; Lau, J.; Carpenter, J.; Rücker, G.; Harbord, R.M.; Schmid, C.H.; et al. Recommendations for examining and interpreting funnel plot asymmetry in meta-analyses of randomised controlled trials. BMJ 2011, 343, d4002. [Google Scholar] [CrossRef] [PubMed] [Green Version]
- World Health Organization. Obesity: Preventing and Managing the Global Epidemic; World Health Organization: Geneva, Switzerland, 2000. [Google Scholar]
- Brophy, H.F. Publications of the United Nations Statistical Office. Gov. Publ. Rev. 1982, 9, 175–184. [Google Scholar] [CrossRef]
- Shiloach, M.; Frencher, S.K., Jr.; Steeger, J.E.; Rowell, K.S.; Bartzokis, K.; Tomeh, M.G.; Richards, K.E.; Ko, C.Y.; Hall, B.L. Toward robust information: Data quality and inter-rater reliability in the American College of Surgeons National Surgical Quality Improvement Program. J. Am. Coll. Surg. 2010, 210, 6–16. [Google Scholar] [CrossRef]
- Kristensen, S.R.; Bech, M.; Quentin, W. A roadmap for comparing readmission policies with application to Denmark, England, Germany and the United States. Health Policy 2015, 119, 264–273. [Google Scholar] [CrossRef]


| Critical Appraisal | ||||||||||||
|---|---|---|---|---|---|---|---|---|---|---|---|---|
| Study ID | * JBI 1. | JBI 2. | JBI 3. | JBI 4. | JBI 5. | JBI 7. | JBI 8. | JBI 9. | JBI 10. | JBI 11. | Overall Risk of Bias Score (Quartile; Arranged in Descending Order) | Evidence of Selective Reporting |
| Example study | Y | Y | Y | Y | Y | Y | Y | N | U | Y | 3/20 therefore 15% (1st quartile) | No |
| Meta-analysis | |||||||
| Prognostic factor | OR (95% CI) | Overall quality | |||||
| Example prognostic factor 1 | 0.82 (0.71–0.95) | 5 (+++) | |||||
| Narrative Synthesis | |||||||
| Prognostic factor | Univariate | Multivariate | Overall quality | ||||
| + | 0 | - | + | 0 | - | ||
| Example prognostic factor 2 | - | - | - | - | 1 | - | 4 (+++) |
| Example category 2 | |||||||
| Example prognostic factor 3 | - | - | - | 2 | - | - | 5 (+++) |
| Country | Study ID: Author and Year of Publication (Study Period) |
|---|---|
| Australia | Hanly 2017 [32] (Retrospective cohort study; January 2003–December 2010) |
| Canada | Abdulla 2020 [33] (March 2010 to July 2016); Ross 2020 [34] (2003–2016); Peskun 2012 [35] (1997–2007) |
| Colombia | Buitrago 2020 [36] (January 1, 2012 to November 30, 2015) |
| Denmark | Jorgensen 2013 [31] (1 February 2010–1 May 2011); Jorgensen 2017 [37] (2012–2014) |
| Singapore | Tang 2019 [38] (January 2013 to June 2014); Tay 2017 [39] (Jan 2006–Dec 2011) |
| Taiwan | Liao 2016 [40] (January 1, 2004 to December 31, 2009); Kuo 2017 [41] (January 2009 to 2012) |
| UK | Ali 2019 [42] (2006–2015) |
| USA | Miric 2014 [43] (04/01/2001 to 12/31/2011); Welsh 2017 [44] (2009–2011); Kim 2019 [45] (January 1, 2010 to December 31, 2014); Kurtz 2016 [46] (2010–2013); Anthony 2018 [47] (2013 and 2014, inclusive); Urish 2018 [48] (2014); Sodhi and Mont et al. 2019 [49] (1 January 2016 to 30 September 2016); Singh 2013 [50] (2002 fiscal year); Arroyo 2019 [51] (January 2007 to December 2014 for Florida and New York data, January 2007 to December 2011 for California data, January, 2012 to December 2014 for Maryland data); Bullock 2003 [52] (January 1994–June 2000 for bilateral TKA cohort, January 1995–June 2000 for unilateral TKA cohort); Charette 2019 [53] (April 2013–April 2017); D’Apuzzo 2017 [54] (1997–2014); Keeney 2015 [55] (1 January 2006–30 September 2013); Ramos 2014 [56] (2010 and 2011); Ramos 2014 [56] (2010 and 2011); Ricciardi 2017 [57] (January 2010 to December 2014); Saucedo 2014 [58] (2006–2010); Schaeffer 2015 [59] (July 2011–November 2012); Schairer 2014 [6] (2005–2011); Workman 2019 [60] (1 June 2011–1 June 2016); Siracuse 2017 [61] (2006–2011); Weick 2018 [62] (2003–2014); Kheir 2014 [63] (1 July 2009–30 June 2011); Anderson 2020 [64] (2010–2014); Mudumbai 2019 [65] (2011 financial year) |
| USA and various international sites | Abola 2018 [66] (2012–2014); Alvi 2015 [67] (2005–2011); Antoniak 2020 [68] (2006–2016); Belmont 2016 [69] (2011 and 2012); Bovonratwet 2018 [70] (2005–2015); Bovonratwet 2019 [71] (2005–2016); Bovonratwet 2020 [72] (2012–2017); Courtney 2018 [73] (January 1 2012 to December 31 2015); Curtis 2018 [74] (2008–2014); Curtis 2019 [75] (2012–2016); George 2018 [76] (1 January 2011– 31 December 2015); Gwam 2020 [77] (2008–2016); Hart 2016 [78] (2011–2013); Jauregui 2015 [79] (2011); Kester 2016 [80] (January 1 2010–December 31 2013); Lehtonen 2018 [81] (2012–2015); Lovecchio 2014 [82] (2005–2011); Nowak and Schemitsch 2019 [83] (2005–2016); Ottesen 2018 [84] (2005–2015); Patel 2020 [85] (2011–2017); Patterson 2018 [86] (2005–2015); Pugely 2013 [23] (2011 (whole year + 30 days after 31/12/11)); Robinson 2017 [87] (2012–2014; Roth 2019 [88] (unclear); Rudasill 2019 [89] (2010–2016); Runner 2017 [90] (2005–2014); Sloan 2020 [91] (January 2008 to December 2016); Sodhi and Anis et al. 2019 [92] (2011–2016); Suleiman 2015 [93] (2010–2012); Sutton 2016 [94] (1 January 2011–31 December 2012); Webb 2017 [95] (2005–2014); Yohe 2018 [96] (2008–2014); Zusmanovic 2018 [97] (1 January 2008–31 December 2015) |
| Meta-analysis | ||||||||
|---|---|---|---|---|---|---|---|---|
| Prognostic factor | OR (95% CI) | Overall quality | ||||||
| Alcohol abuse | 1.08 (0.96–1.20) | 6 (++++) | ||||||
| BMI < 18.5 vs. normal | 1.15 (0.45–2.98) | 4 (+++) | ||||||
| BMI 25–30 vs. normal | 0.91 (0.80–1.03) | 6 (++++) | ||||||
| BMI 30–35 vs. normal | 0.90 (0.80–1.02) | 6 (++++) | ||||||
| BMI 35–40 vs. normal | 0.84 (0.69–1.02) | 6 (++++) | ||||||
| BMI > 40 vs. normal | 1.05 (0.84–1.31) | 6 (++++) | ||||||
| Obesity | 1.06 (1.02–1.09) | 4 (+++) | ||||||
| Weight loss | 0.95 (0.71–1.27) | 3 (++) | ||||||
| Arrhythmias and AF combined | 1.14 (1.09–1.19) | 4 (+++) | ||||||
| Ischaemic heart disease (IHD) + coronary artery disease (CAD) + cardiac disease | 1.29 (0.79–2.09) | 3 (++) | ||||||
| Peripheral vascular disease | 1.17 (1.10–1.24) | 5 (+++) | ||||||
| Previous myocardial infarction, or coronary artery disease | 1.18 (0.29–4.88) | 3 (++) | ||||||
| Non-insulin-dependent diabetes mellitus (NIDDM) | 1.08 (0.80–1.45) | 4 (+++) | ||||||
| Liver disease | 1.29 (1.20–1.39) | 4 (+++) | ||||||
| Peptic ulcer disease | 0.94 (0.84–1.07) | 4 (+++) | ||||||
| Anaemia | 1.19 (1.15–1.24) | 6 (++++) | ||||||
| Deficiency anaemias | 1.06 (1.01–1.11) | 4 (+++) | ||||||
| Coagulopathy | 1.25 (1.15–1.36) | 4 (+++) | ||||||
| Fluid and electrolyte disorder | 1.05 (1.00–1.12) | 4 (+++) | ||||||
| Chronic pulmonary disease | 1.28 (1.22–1.34) | 3 (++) | ||||||
| Paralysis | 1.13 (0.97–1.31) | 4 (+++) | ||||||
| Psychiatric disorder | 1.43 (1.12–1.70) | 3 (++) | ||||||
| Smoking | 1.25 (0.82–1.91) | 5 (+++) | ||||||
| Rheumatologic disorder | 1.11 (1.04–1.18) | 3 (++) | ||||||
| Narrative Synthesis | ||||||||
| Prognostic factor | Univariate | Multivariate | Overall quality | |||||
| + | 0 | - | + | 0 | - | |||
| Composite comorbidity indices | ||||||||
| Charlson Comorbidity Index (CCI) 1-2 (reference category = 0) | - | - | - | 2 | - | - | 6 (++++) | |
| CCI 1 (reference category = 0) | - | - | - | 2 | 1 | - | 6 (++++) | |
| CCI 2 (reference category = 0) | - | - | - | 1 | - | - | 5 (++++) | |
| CCI ≥2 (reference category = 0) | - | - | - | 1 | 1 | - | 6 (++++) | |
| CCI 3-4 (reference category = 0) | - | - | - | 1 | - | - | 5 (+++) | |
| CCI ≥3 (reference category = 0) | - | - | - | 1 | - | - | 4 (+++) | |
| CCI 5+ (reference category = 0) | - | - | - | 1 | - | - | 5 (+++) | |
| Increasing CCI | - | - | - | - | 1 | - | 3 (++) | |
| Presence of any comorbidity | 1 | - | - | 2 | - | - | 4 (+++) | |
| Increasing American Society of Anaesthesiologists (ASA) classification (reference category = 2) | - | - | - | 1 | - | - | 4 (+++) | |
| Increasing ASA classification (reference category = 1) | - | - | - | - | 1 | - | 2 (+) | |
| ASA classification (other) | - | 1 | - | - | 1 | - | 2 (+) | |
| Increasing Elixhauser Index | - | - | - | 1 | - | - | 5 (+++) | |
| Increasing DRG (Diagnosis-related group) | - | - | - | 1 | - | - | 3 (++) | |
| Cardiovascular | ||||||||
| Hypertension | 2 | 2 | - | 6 | 1 | - | 5 (+++) | |
| Hyperlipidaemia | 1 | 1 | - | - | - | - | 4 (+++) | |
| Cardiac disease | - | - | - | 1 | - | - | 3 (++) | |
| Cardiovascular disease (CVD) | - | 1 | - | - | - | - | 3 (++) | |
| Congestive Cardiac/Heart Failure (CCF/CHF) | 3 | - | - | 5 | 2 | - | 5 (+++) | |
| Valvular disease | 1 | - | - | 2 | 1 | - | 3 (++) | |
| Peripheral vascular disease | 1 | 1 | - | - | 1 | - | 3 (++) | |
| History of percutaneous coronary intervention or cardiac surgery | 1 | - | - | - | - | - | 2 (+) | |
| BMI, obesity, and weight loss | ||||||||
| BMI (continuous) | - | 1 | - | 1 | 1 | - | 4 (+++) | |
| BMI underweight (reference category = overweight (25–30)) | - | - | - | - | 1 | - | 4 (+++) | |
| BMI normal weight (reference category = overweight (25–30)) | - | - | - | - | 1 | - | 4 (+++) | |
| BMI obese (reference category = overweight (25–30)) | - | - | - | - | 1 | - | 4 (+++) | |
| BMI very obese (reference category = overweight (25–30)) | - | - | - | - | 1 | - | 4 (+++) | |
| BMI morbidly obese (reference category = overweight (25–30)) | - | - | - | 1 | - | - | 4 (+++) | |
| BMI > 30 (reference category = normal weight) | - | - | - | 1 | - | - | 2 (+) | |
| Increasing BMI (reference category = <25) | - | 1 | - | - | - | - | 1 (+) | |
| Obesity | 1 | 1 | - | 2 | 1 | - | 2 (+) | |
| Morbid obesity | - | 1 | - | - | - | - | 2 (+) | |
| Weight loss | - | 1 | - | - | 1 | - | 4 (+++) | |
| Endocrine | ||||||||
| Diabetes (general category and Peskun type two diabetes mellitus (T2DM)) | - | 1 | - | 5 | 4 | - | 3 (++) | |
| Diabetes (with complications) | 1 | - | - | 1 | - | - | 5 (+++) | |
| Diabetes (without complications) | 1 | - | - | 1 | - | - | 5 (+++) | |
| Insulin-dependent diabetes mellitus (IDDM) | 1 | - | - | 1 | - | - | 5 (+++) | |
| NIDDM | 1 | - | - | - | 1 | - | 4 (+++) | |
| Hypothyroidism | - | 1 | - | - | 1 | - | 5 (+++) | |
| Gastrointestinal | ||||||||
| Liver disease | 1 | - | - | - | 1 | - | 2 (+) | |
| Haematological | ||||||||
| Anaemia | - | - | - | 1 | 1 | 1 | 4 (+++) | |
| Anaemia (blood loss) | 1 | - | - | - | 1 | - | 4 (+++) | |
| Anaemia (deficiency) | 1 | - | - | - | 2 | - | 3 (++) | |
| Bleeding disorders | 1 | - | - | 1 | - | - | 3 (++) | |
| Coagulopathy | 1 | - | - | - | - | - | 3 (++) | |
| Anticoagulant therapy | - | - | - | - | 1 | - | 2 (+) | |
| Increasing INR | 1 | - | - | 1 | - | - | 4 (+++) | |
| Fluid and electrolyte disorder | 1 | - | - | 1 | - | - | 3 (++) | |
| Elevated serum blood urea nitrogen (BUN) | 1 | - | - | 1 | - | - | 4 (+++) | |
| Hyponatraemia | - | 1 | - | - | 1 | - | 4 (+++) | |
| Low albumin | - | - | - | 1 | - | - | 4 (+++) | |
| Elevated creatinine | 1 | - | - | - | - | - | 3 (++) | |
| Elevated WBC count | 1 | - | - | - | - | - | 3 (++) | |
| Reduced haematocrit | 1 | - | - | - | - | - | 3 (++) | |
| Low platelets | 1 | - | - | - | - | - | 3 (++) | |
| Respiratory | ||||||||
| Chronic obstructive pulmonary disease (COPD) and chronic airways disease (combined) | - | - | - | 4 | - | - | 3 (++) | |
| Pulmonary disease | 1 | - | - | 1 | 1 | - | 4 (+++) | |
| Smoking | 1 | 2 | - | 1 | - | - | 3 (++) | |
| Pulmonary circulation disorder | - | - | - | 1 | 1 | - | 2 (+) | |
| Asthma | - | 1 | - | - | - | - | 1 (+) | |
| Dyspnoea | 1 | - | - | - | 1 | - | 3 (++) | |
| Previous pneumonia | - | - | - | - | 1 | - | 3 (++) | |
| Obstructive sleep apnoea | - | 1 | - | - | - | - | 1 (+) | |
| Cardiopulmonary disease | 1 | - | - | - | - | - | 0 (+) | |
| Psychiatric | ||||||||
| Depression | 1 | 2 | - | 3 | 1 | - | 5 (+++) | |
| ‘Other’ mental health condition (other than depression) | - | - | - | 1 | - | - | 3 (++) | |
| Bipolar disorder | - | 1 | - | - | - | - | 1 (+) | |
| Post-traumatic stress disorder (PTSD) | - | 1 | - | - | - | - | 1 (+) | |
| Anxiety disorder | - | 2 | - | - | - | - | 2 (+) | |
| Alcohol abuse | 1 | 2 | - | - | - | - | 3 (++) | |
| Drug abuse (including general substance abuse designation, and drug/alcohol abuse (combined category in Kurtz)) | 1 | 1 | - | 2 | - | - | 4 (+++) | |
| Psychoses | 1 | - | - | - | - | - | 2 (+) | |
| Neoplastic | ||||||||
| History of cancer | 1 | - | - | 2 | 1 | - | 4 (+++) | |
| Disseminated cancer | 1 | - | - | 1 | 2 | - | 3 (++) | |
| Lymphoma | - | - | - | 2 | - | - | 4 (+++) | |
| Neurological | ||||||||
| Previous stroke | - | 1 | - | 1 | - | 1 | 4 (+++) | |
| Dementia | - | - | - | 1 | - | - | 4 (+++) | |
| Other neurological disorder | 1 | - | - | 2 | 1 | - | 3 (++) | |
| In-hospital complications | ||||||||
| Deep vein thrombosis | - | - | - | 1 | - | - | 5 (+++) | |
| Pulmonary embolism | - | - | - | 1 | - | - | 5 (+++) | |
| Any complication | 1 | - | - | 1 | - | - | 6 (++++) | |
| Any medical complication | 1 | - | - | 1 | - | - | 4 (+++) | |
| Any surgical complication | 1 | - | - | 1 | - | - | 4 (+++) | |
| Urinary tract infection | - | - | - | 1 | - | - | 5 (+++) | |
| Surgical site infection | - | - | - | 1 | - | - | 5 (+++) | |
| Sepsis | 1 | - | - | - | 1 | - | 4 (+++) | |
| Cardiac (including cardiac arrest and myocardial infarction) | - | - | - | 1 | - | - | 4 (+++) | |
| Pneumonia | - | - | - | 1 | - | - | 5 (+++) | |
| Acute renal failure | - | - | - | 1 | - | - | 5 (+++) | |
| Cerebrovascular accident (CVA) or transient ischaemic attach (TIA) | 1 | - | - | - | - | - | 3 (++) | |
| Renal | ||||||||
| Chronic kidney disease (CKD) | 1 | - | - | 2 | 1 | - | 5 (+++) | |
| Dialysis dependence | - | - | - | 1 | - | - | 4 (++) | |
| Renal failure–acute, preoperative | - | - | - | - | 1 | - | 4 (++) | |
| Renal failure/disease–chronicity unspecified | 1 | - | - | 5 | - | - | 6 (++++) | |
| Rheumatological and autoimmune | ||||||||
| Rheumatoid arthritis/collagen vascular diseases | 1 | - | - | - | - | - | 3 (++) | |
| Steroid or other immunosuppressant use for chronic condition | - | - | - | 1 | - | - | 3 (++) | |
| Other | ||||||||
| Preoperative opioid use | - | - | - | 2 | 1 | - | 3 (++) | |
| Post-discharge opioid use | - | - | - | 1 | - | - | 1 (+) | |
| Preoperative medication use (general) | - | - | - | 1 | - | - | 3 (++) | |
| Preoperative medication use (analgesics) | - | - | - | 1 | - | 1 (+) | ||
| Preoperative medication use (anticonvulsants) | - | - | - | 1 | - | - | 2 (+) | |
| Preoperative medication use (Serotonin–norepinephrine reuptake inhibitor (SNRIs)) | - | - | - | - | 1 | - | 2 (+) | |
| Preoperative medication use (Tricyclic antidepressants (TCAs)) | - | - | - | - | 1 | - | 2 (+) | |
| Preoperative medication use (sedatives) | - | - | - | - | 1 | - | 2 (+) | |
| Wound class | 1 | - | - | - | 2 | - | 4 (+++) | |
| Meta-analysis | |||||||
| Prognostic factor | OR (95% CI) | Overall quality | |||||
| Hispanic race | 0.92 (0.68–1.25) | 5 (+++) | |||||
| Narrative Synthesis | |||||||
| Prognostic factor | Univariate | Multivariate | Overall quality | ||||
| + | 0 | - | + | 0 | - | ||
| Age (continuous variable) | |||||||
| Age | 3 | 1 | - | 4 | 3 | - | 5 (+++) |
| Sex | |||||||
| Female sex | - | 1 | - | - | 1 | 4 | 5 (+++) |
| Male sex | 2 | 2 | - | 8 | - | - | 6 (++++) |
| Race | |||||||
| Black (reference = white or non-Black) | 1 | 1 | - | 4 | 3 | - | 4 (+++) |
| Hispanic (reference = white or non-Hispanic) | - | 1 | - | - | - | - | 1 (+) |
| Asian (reference = white) | - | 2 | - | - | 1 | 2 | 4 (+++) |
| Native Hawaiian (reference = white) | - | 1 | - | - | - | - | 3 (++) |
| American Indian (reference = white) | - | 2 | - | - | 1 | - | 4 (+++) |
| White | - | 1 | 1 | - | 1 | - | 2 (+) |
| Indian (reference = Chinese) | - | - | - | - | 1 | - | 2 (+) |
| Malay (reference = Chinese) | - | - | - | - | 1 | - | 2 (+) |
| Biracial (Workman) or mixed race (Ali) | 1 | - | - | 1 | - | - | 5 (+++) |
| Minority ethnicity | - | - | - | 1 | - | - | 2 (+) |
| Other (Tang = Chinese; otherwise = white) | - | 1 | - | 1 | 4 | 2 | 3 (++) |
| Missing | - | 1 | - | 1 | - | 3 | 3 (++) |
| Race (combined analysis – i.e., racial difference exists between readmitted and non-readmitted cohorts) | 2 | - | - | 1 | - | - | 4 (+++) |
| Socioeconomic | |||||||
| Decreasing incoming | - | - | - | 3 | 1 | - | 5 (+++) |
| Low socioeconomic status | 1 | - | - | 1 | - | - | 4 (+++) |
| Insurance status | |||||||
| Medicare (reference category = private insurance or non-Medicare) | - | - | - | 4 | - | - | 4 (+++) |
| Medicaid (reference category = private insurance) | - | - | - | 3 | - | - | 3 (++) |
| Self-pay, no charge, workers’ compensation, or other (reference category = private insurance) | - | - | - | - | 2 | 3 | 2 (+) |
| Disability entitlement | - | - | - | 1 | - | - | 3 (++) |
| Functional status, living situation, and frailty | |||||||
| Dependent functional status | - | - | - | 1 | - | - | 4 (+++) |
| Use of walking aids | 1 | - | - | - | 1 | - | 4 (+++) |
| Living alone | - | 1 | - | - | 2 | - | 5 (+++) |
| Living in an institution or nursing home | - | 1 | - | 1 | - | - | 3 (++) |
| Homeless | - | - | - | 1 | - | - | 2 (+) |
| Frailty (Modified Frailty Index) | - | - | - | 1 | - | - | 5 (+++) |
| Meta-analysis | ||||||||
| Prognostic factor | OR (95% CI) | Overall quality | ||||||
| Elective vs non-elective | 0.82 (0.71–0.95) | 5 (+++) | ||||||
| Narrative Synthesis | ||||||||
| Prognostic factor | Univariate | Multivariate | Overall quality | |||||
| + | 0 | - | + | 0 | - | |||
| Operative variables | ||||||||
| Elective or non-elective procedure | - | - | - | - | 1 | - | 4 (+++) | |
| Emergency procedure | - | - | - | - | 1 | - | 4 (+++) | |
| Traumatic indication for TKA | - | - | - | 1 | 1 | - | 4 (+++) | |
| Bilateral procedure | - | 1 | - | 2 | 2 | - | 3 (++) | |
| Revision surgery (vs primary) | 1 | 1 | - | 1 | - | - | 3 (++) | |
| Healthcare utilisation | ||||||||
| Increasing number of previous admissions | - | - | - | 2 | - | - | 5 (+++) | |
| Number of prior knee procedures | - | - | - | - | - | 1 | 4 (+++) | |
| GP visit between surgery and readmission | 1 | - | - | - | - | 1 | 3 (++) | |
| Radiation therapy within 90 days prior to procedure | - | - | - | - | - | - | N/A | |
| Chemotherapy within 30 days prior to procedure | - | 1 | - | - | - | - | 2 (+) | |
| Prior operation | - | - | - | - | 1 | - | 1 (+) | |
| >30 outpatient visits in the 365 days prior to procedure | - | - | - | 1 | - | - | 1 (+) | |
| Patient-reported outcome measures | - | - | - | 1 | - | - | 1 (+) | |
| Patient location | - | - | - | - | 1 | 1 | 2 (+) | |
Publisher’s Note: MDPI stays neutral with regard to jurisdictional claims in published maps and institutional affiliations. |
© 2021 by the authors. Licensee MDPI, Basel, Switzerland. This article is an open access article distributed under the terms and conditions of the Creative Commons Attribution (CC BY) license (http://creativecommons.org/licenses/by/4.0/).
Share and Cite
Gould, D.; Dowsey, M.M.; Spelman, T.; Jo, O.; Kabir, W.; Trieu, J.; Bailey, J.; Bunzli, S.; Choong, P. Patient-Related Risk Factors for Unplanned 30-Day Hospital Readmission Following Primary and Revision Total Knee Arthroplasty: A Systematic Review and Meta-Analysis. J. Clin. Med. 2021, 10, 134. https://doi.org/10.3390/jcm10010134
Gould D, Dowsey MM, Spelman T, Jo O, Kabir W, Trieu J, Bailey J, Bunzli S, Choong P. Patient-Related Risk Factors for Unplanned 30-Day Hospital Readmission Following Primary and Revision Total Knee Arthroplasty: A Systematic Review and Meta-Analysis. Journal of Clinical Medicine. 2021; 10(1):134. https://doi.org/10.3390/jcm10010134
Chicago/Turabian StyleGould, Daniel, Michelle M Dowsey, Tim Spelman, Olivia Jo, Wassif Kabir, Jason Trieu, James Bailey, Samantha Bunzli, and Peter Choong. 2021. "Patient-Related Risk Factors for Unplanned 30-Day Hospital Readmission Following Primary and Revision Total Knee Arthroplasty: A Systematic Review and Meta-Analysis" Journal of Clinical Medicine 10, no. 1: 134. https://doi.org/10.3390/jcm10010134