Speech Perception Changes in the Acoustically Aided, Nonimplanted Ear after Cochlear Implantation: A Multicenter Study

 , ,
, ,  , , , , , , , , add
Show full author list
, , , , , , , , add
Show full author list
Abstract
:1. Introduction
2. Experimental Section
2.1. Inclusion Criteria
2.2. Subjects
2.3. Speech Perception Tests Used at Each Site
2.4. Pre- vs. Post-Implantation Comparisons
3. Results
4. Discussion
Author Contributions
Funding
Conflicts of Interest
Appendix A

| Site | Location | N | Test | Description | Scoring | Notes |
|---|---|---|---|---|---|---|
| NYU Langone Medical Center | New York, New York | 53 | Consonant-Nucleus-Consonant (CNC) word test [42] | 20 lists of 50 monosyllabic words with equal phonemic distribution | word level | Male talker |
| World Hearing Center Institute of Physiology and Pathology of Hearing in Poland | Warsaw, Poland | 21 | Pruszewicz et al. 1994 word test [43,44,45] | 10 lists of 20 monosyllabic nouns; phonetically, semantically, and structurally balanced | word level | |
| Lyon University Hospital | France | 12 | Lafon’s Cochlear Lists [46] | 20 lists of 17 words | phonemic level | male talker |
| Oorgroup | Antwerp, France | 14 | NVA: Nederlandse Vereniging voor Audiologie [47] | Consonant-Vowel-Consonant (CVC) of words and non-words | phonemic level | presented at 70 dB SPL |
| Université Laval | Quebec, Canada | 2 | Benfante Test [48] | 50 word list | word level | presented at 60 dB HL |
| 12 | Test Audiologique Multimedia (TAM) [49] | 20 sentences; 114–125 key words | word level | presented at 70 dB A SPL; male, female, and child talkers | ||
| University of Melbourne | Australia | 5 | CNC word test [42] | 20 lists of 50 monosyllabic words; equal phonemic distribution | word level | presented at 65 dB SPL; australian English male talker |
| 4 | City University of New York (CUNY) sentence test [50] | 48 lists of 12 sentences (2 lists presented); 102 key words | word level | presented at 65 dB SPL | ||
| University of São Paulo | Brazil | 6 | Lists of Sentences in Portuguese (LSP) test [51] | 8 lists of 10 sentences; phonetically balanced | sentence level | presented at 65 dB SPL; female talker |
| University of Padova | Italy | 3 | Bisyllabic word test [52] | 10 lists of 20 words | word level | presented at 70 dB A SPL; female talker |
References
- FDA. Available online: https://www.accessdata.fda.gov/cdrh_docs/pdf13/P130016a.pdf (accessed on 2 March 2020).
- FDA. Available online: https://www.accessdata.fda.gov/cdrh_docs/pdf/P000025S104A.pdf (accessed on 2 March 2020).
- Mitchell, R.E. How Many Deaf People Are There in the United States? Estimates From the Survey of Income and Program Participation. J. Deaf Stud. Deaf Educ. 2005, 11, 112–119. [Google Scholar] [CrossRef] [PubMed] [Green Version]
- NIDCD. Available online: https://www.nidcd.nih.gov/health/cochlear-implants (accessed on 6 December 2019).
- Armstrong, M.; Pegg, P.; James, C.; Blamey, P. Speech perception in noise with implant and hearing aid. Am. J. Otol. 1997, 18, S140–S141. [Google Scholar] [PubMed]
- Kong, Y.Y.; Stickney, G.S.; Zeng, F.G. Speech and melody recognition in binaurally combined acoustic and electric hearing. J. Acoust. Soc. Am. 2005, 117, 1351–1361. [Google Scholar] [CrossRef] [PubMed] [Green Version]
- Ching, T.Y. The evidence calls for making binaural-bimodal fittings routine. Hear. J. 2005, 58, 32–34. [Google Scholar] [CrossRef]
- Ching, T.Y.; Incerti, P.; Hill, M. Binaural benefits for adults who use hearing aids and cochlear implants in opposite ears. Ear Hear. 2004, 25, 9–21. [Google Scholar] [CrossRef]
- Dooley, G.J.; Blamey, P.J.; Seligman, P.M.; Alcantara, J.I.; Clark, G.M.; Shallop, J.K.; Arndt, P.; Heller, J.W.; Menapace, C.M. Combined electrical and acoustical stimulation using a bimodal prosthesis. Arch. Otolaryngol. Head Neck Surg. 1993, 119, 55–60. [Google Scholar] [CrossRef]
- Hamzavi, J.; Pok, S.M.; Gstoettner, W.; Baumgartner, W.D. Speech perception with a cochlear implant used in conjunction with a hearing aid in the opposite ear. Int. J. Audiol. 2004, 43, 61–65. [Google Scholar] [CrossRef]
- Luntz, M.; Shpak, T.; Weiss, H. Binaural-bimodal hearing: Concomitant use of a unilateral cochlear implant and a contralateral hearing aid. Acta Oto Laryngol. 2005, 125, 863–869. [Google Scholar] [CrossRef]
- Mok, M.; Grayden, D.; Dowell, R.C.; Lawrence, D. Speech perception for adults who use hearing aids in conjunction with cochlear implants in opposite ears. J. Speech Lang. Hear. Res. JSLHR 2006, 49, 338–351. [Google Scholar] [CrossRef]
- Morera, C.; Manrique, M.; Ramos, A.; Garcia-Ibanez, L.; Cavalle, L.; Huarte, A.; Castillo, C.; Estrada, E. Advantages of binaural hearing provided through bimodal stimulation via a cochlear implant and a conventional hearing aid: A 6-month comparative study. Acta Oto Laryngol. 2005, 125, 596–606. [Google Scholar] [CrossRef]
- Waltzman, S.B.; Cohen, N.L.; Shapiro, W.H. Sensory aids in conjunction with cochlear implants. Am. J. Otol. 1992, 13, 308–312. [Google Scholar]
- Dorman, M.F.; Gifford, R.H.; Spahr, A.J.; McKarns, S.A. The benefits of combining acoustic and electric stimulation for the recognition of speech, voice and melodies. Audiol. Neuro Otol. 2008, 13, 105–112. [Google Scholar] [CrossRef] [PubMed] [Green Version]
- Gifford, R.H.; Dorman, M.F.; McKarns, S.A.; Spahr, A.J. Combined electric and contralateral acoustic hearing: Word and sentence recognition with bimodal hearing. J. Speech Lang. Hear. Res. JSLHR 2007, 50, 835–843. [Google Scholar] [CrossRef] [Green Version]
- Zhang, T.; Dorman, M.F.; Spahr, A.J. Information from the voice fundamental frequency (F0) region accounts for the majority of the benefit when acoustic stimulation is added to electric stimulation. Ear Hear. 2010, 31, 63–69. [Google Scholar] [CrossRef] [PubMed] [Green Version]
- Neuman, A.C.; Svirsky, M.A. Effect of hearing aid bandwidth on speech recognition performance of listeners using a cochlear implant and contralateral hearing aid (bimodal hearing). Ear Hear. 2013, 34, 553–561. [Google Scholar] [CrossRef] [PubMed] [Green Version]
- Neuman, A.C.; Zeman, A.; Neukam, J.; Wang, B.; Svirsky, M.A. The Effect of Hearing Aid Bandwidth and Configuration of Hearing Loss on Bimodal Speech Recognition in Cochlear Implant Users. Ear Hear. 2019, 40, 621–635. [Google Scholar] [CrossRef]
- Firszt, J.B.; Reeder, R.M.; Skinner, M.W. Restoring hearing symmetry with two cochlear implants or one cochlear implant and a contralateral hearing aid. J. Rehabil. Res. Dev. 2008. [Google Scholar] [CrossRef]
- Gordon, K.; Henkin, Y.; Kral, A. Asymmetric Hearing During Development: The Aural Preference Syndrome and Treatment Options. Pediatrics 2015, 136, 141–153. [Google Scholar] [CrossRef] [Green Version]
- Thompson, N.J.; Dillon, M.T.; Buss, E.; Rooth, M.A.; King, E.R.; Bucker, A.L.; McCarthy, S.A.; Deres, E.J.; O’Connell, B.P.; Pillsbury, H.C., III. Subjective Benefits of Bimodal Listening in Cochlear Implant Recipients with Asymmetric Hearing Loss. Otolaryngol. Head Neck Surg. 2020. [Google Scholar] [CrossRef]
- Sladen, D.P.; Carlson, M.L.; Dowling, B.P.; Olund, A.P.; DeJong, M.D.; Breneman, A.; Hollander, S.; Beatty, C.W.; Neff, B.A.; Driscoll, C.L. Cochlear implantation in adults with asymmetric hearing loss: Speech recognition in quiet and in noise, and health related quality of life. Otol. Neurotol. 2018, 39, 576–581. [Google Scholar] [CrossRef]
- Firszt, J.B.; Reeder, R.M.; Holden, L.K.; Dwyer, N.Y.; Team, A.H.S. Results in Adult Cochlear Implant Recipients with Varied Asymmetric Hearing: A Prospective Longitudinal Study of Speech Recognition, Localization and Participant Report. Ear Hear. 2018, 39, 845. [Google Scholar] [CrossRef] [PubMed]
- Mertens, G.; De Bodt, M.; Van de Heyning, P. Evaluation of long-term cochlear implant use in subjects with acquired unilateral profound hearing loss: Focus on binaural auditory outcomes. Ear Hear. 2017, 38, 117–125. [Google Scholar] [CrossRef] [PubMed]
- Arndt, S.; Laszig, R.; Aschendorff, A.; Hassepass, F.; Beck, R.; Wesarg, T. Cochlear implant treatment of patients with single-sided deafness or asymmetric hearing loss. HNO 2017, 65, 98–108. [Google Scholar] [CrossRef] [PubMed]
- Van Loon, M.C.; Smits, C.; Smit, C.F.; Hensen, E.F.; Merkus, P. Cochlear implantation in adults with asymmetric hearing loss: Benefits of bimodal stimulation. Otol. Neurotol. 2017, 38, e100–e106. [Google Scholar] [CrossRef] [PubMed]
- Gifford, R.H.; Dorman, M.F.; Shallop, J.K.; Sydlowski, S.A. Evidence for the expansion of adult cochlear implant candidacy. Ear Hear. 2010, 31, 186–194. [Google Scholar] [CrossRef] [PubMed] [Green Version]
- Dorman, M.F.; Cook, S.; Spahr, A.; Zhang, T.; Loiselle, L.; Schramm, D.; Whittingham, J.; Gifford, R. Factors constraining the benefit to speech understanding of combining information from low-frequency hearing and a cochlear implant. Hear. Res. 2015, 322, 107–111. [Google Scholar] [CrossRef] [Green Version]
- Dunn, C.C.; Tyler, R.S.; Witt, S.A. Benefit of wearing a hearing aid on the unimplanted ear in adult users of a cochlear implant. JSLHR 2005, 48, 668–680. [Google Scholar] [CrossRef]
- Illg, A.; Bojanowicz, M.; Lesinski-Schiedat, A.; Lenarz, T.; Buchner, A. Evaluation of the bimodal benefit in a large cohort of cochlear implant subjects using a contralateral hearing aid. Otol. Neurotol. Off. Publ. Am. Otol. Soc. Am. Neurotol. Soc. Eur. Acad. Otol. Neurotol. 2014, 35, e240–e244. [Google Scholar] [CrossRef]
- Kong, Y.Y.; Braida, L.D. Cross-frequency integration for consonant and vowel identification in bimodal hearing. J. Speech Lang. Hear. Res. JSLHR 2011, 54, 959–980. [Google Scholar] [CrossRef] [Green Version]
- Litovsky, R.Y.; Johnstone, P.M.; Godar, S.P. Benefits of bilateral cochlear implants and/or hearing aids in children. Int. J. Audiol. 2006, 45, S78–S91. [Google Scholar] [CrossRef]
- Gordon, K.; Kral, A. Animal and human studies on developmental monaural hearing loss. Hear. Res. 2019, 380, 60–74. [Google Scholar] [CrossRef] [PubMed]
- Kral, A.; Heid, S.; Hubka, P.; Tillein, J. Unilateral hearing during development: Hemispheric specificity in plastic reorganizations. Front. Syst. Neurosci. 2013, 7, 93. [Google Scholar] [CrossRef] [PubMed] [Green Version]
- Silman, S.; Gelfand, S.A.; Silverman, C.A. Late-onset auditory deprivation: Effects of monaural versus binaural hearing aids. J. Acoust. Soc. Am. 1984, 76, 1357–1362. [Google Scholar] [CrossRef] [PubMed]
- Neuman, A.C. Late-onset auditory deprivation: A review of past research and an assessment of future research needs. Ear Hear. 1996, 17, 3S–13S. [Google Scholar] [CrossRef]
- Svirsky, M.A.; Neuman, A.C.; Waltzman, S.B. Bimodal Benefit in Listeners Who Use a Hearing Aid (HA) and a Cochlear Implant (CI) in the Opposite Ears. Assoc. Res. Otolaryngol. Abs. 2011, 167. [Google Scholar]
- Carney, E.; Schlauch, R.S. Critical difference table for word recognition testing derived using computer simulation. J. Speech Lang. Hear. Res. 2007. [Google Scholar] [CrossRef]
- Spahr, A.J.; Dorman, M.F.; Litvak, L.M.; Van Wie, S.; Gifford, R.H.; Loizou, P.C.; Loiselle, L.M.; Oakes, T.; Cook, S. Development and validation of the AzBio sentence lists. Ear Hear. 2012, 33, 112. [Google Scholar] [CrossRef] [Green Version]
- Landsberger, D.M.; Svrakic, M.; Roland, J.T., Jr.; Svirsky, M. The Relationship Between Insertion Angles, Default Frequency Allocations, and Spiral Ganglion Place Pitch in Cochlear Implants. Ear Hear. 2015, 36, e207–e213. [Google Scholar] [CrossRef] [Green Version]
- Peterson, G.E.; Lehiste, I. Revised CNC lists for auditory tests. J. Speech Hear. Disord. 1962, 27, 62–70. [Google Scholar] [CrossRef]
- Pruszewicz, A.; Demenko, G.; Richter, L.; Wika, T. New articulation lists for speech audiometry. Part I. Otolaryngol. Polska Polish Otolaryngol. 1994, 48, 50–55. [Google Scholar]
- Wojnowski, W.; Obrebowski, A.; Pruszewicz, A.; Demenko, G.; Wiskirska-Woźnica, B.; Wika, T.; Komar, D. Dychotomic tests in Polish for speech audiometry part 1: Preparing material for the tests. Otolaryngol. Polska Polish Otolaryngol. 2006, 60, 385–390. [Google Scholar]
- Piłka, E. Speech tests available and used in Poland as part of speech audiometry–historical outline. Nowa Audiofonol. 2015, 4, 67–74. [Google Scholar] [CrossRef]
- Lafon, J.-C. Le Test Phonétique et la Mesure de L’audition; Editions Centrex: Eindhoven, The Netherlands, 1964. [Google Scholar]
- Bosmana, A.J.; Smoorenburg, G.F. Intelligibility of Dutch CVC syllables and sentences for listeners with normal hearing and with three types of hearing impairment. Audiology 1995, 34, 260–284. [Google Scholar] [CrossRef] [PubMed]
- Benfante, H.; Charbonneau, R.; Arseneault, A.; Zinger, A.; Marti, A.; Champoux, N. Audiometrie Vocale; Hôpital Maisonneuv: Montréal, QC, Canada, 1966. [Google Scholar]
- Bergeron, F. Développement d’une batterie de tests multimédias visant à évaluer les habiletés audiovisuelles de perception de la parole. Can. J. Rehabil. 1998, 11, 182–183. [Google Scholar]
- Boothroyd, A.; Hanin, L.; Hnath, T. A Sentence Test of Speech Perception: Reliability, Set Equivalence, and Short Term Learning; CUNY Graduate Center: New York, NY, USA, 1985. [Google Scholar]
- Costa, M.J.; Iorio, M.C.M.; Albernaz, P.L.M. Desenvolvimento de um teste para avaliar a habilidade de reconhecer a fala no silêncio e no ruído. Pró Fono 2000, 12, 9–16. [Google Scholar]
- Cutugno, F.; Prosser, S.; Turrini, M. Audiometria Vocale; GN Resound: Padova, Italy, 2000; Volume IV. [Google Scholar]


| Etiology | |
|---|---|
| Unknown | 52 |
| Genetic | 19 |
| Noise | 14 |
| Otosclerosis | 13 |
| Meniere’s | 4 |
| Meningitis | 4 |
| Progressive | 4 |
| SSNHL | 4 |
| Chronic Otitis Media | 3 |
| Head Trauma | 3 |
| Ototoxicity | 3 |
| Other | 9 |
| Total | 132 |
| Electrode | Processor | |||
|---|---|---|---|---|
| AB | 1j | 19 | Harmony | 12 |
| other | 2 | other | 9 | |
| Med-El | 25 | Opus 2 | 21 | |
| other | 4 | |||
| Cochlear | Contour/Contour Advance | 63 | Freedom | 37 |
| other | 13 | N5 | 23 | |
| other | 16 | |||
| Neurelec | 10 | Saphyr | 10 | |
| TOTAL | 132 | 132 | ||
| AVERAGE | LATEST | |||||||||
|---|---|---|---|---|---|---|---|---|---|---|
| N | Pre-op | Post-op | Difference | p-Value | N | Pre-op | Post-op | Difference | p-Value | |
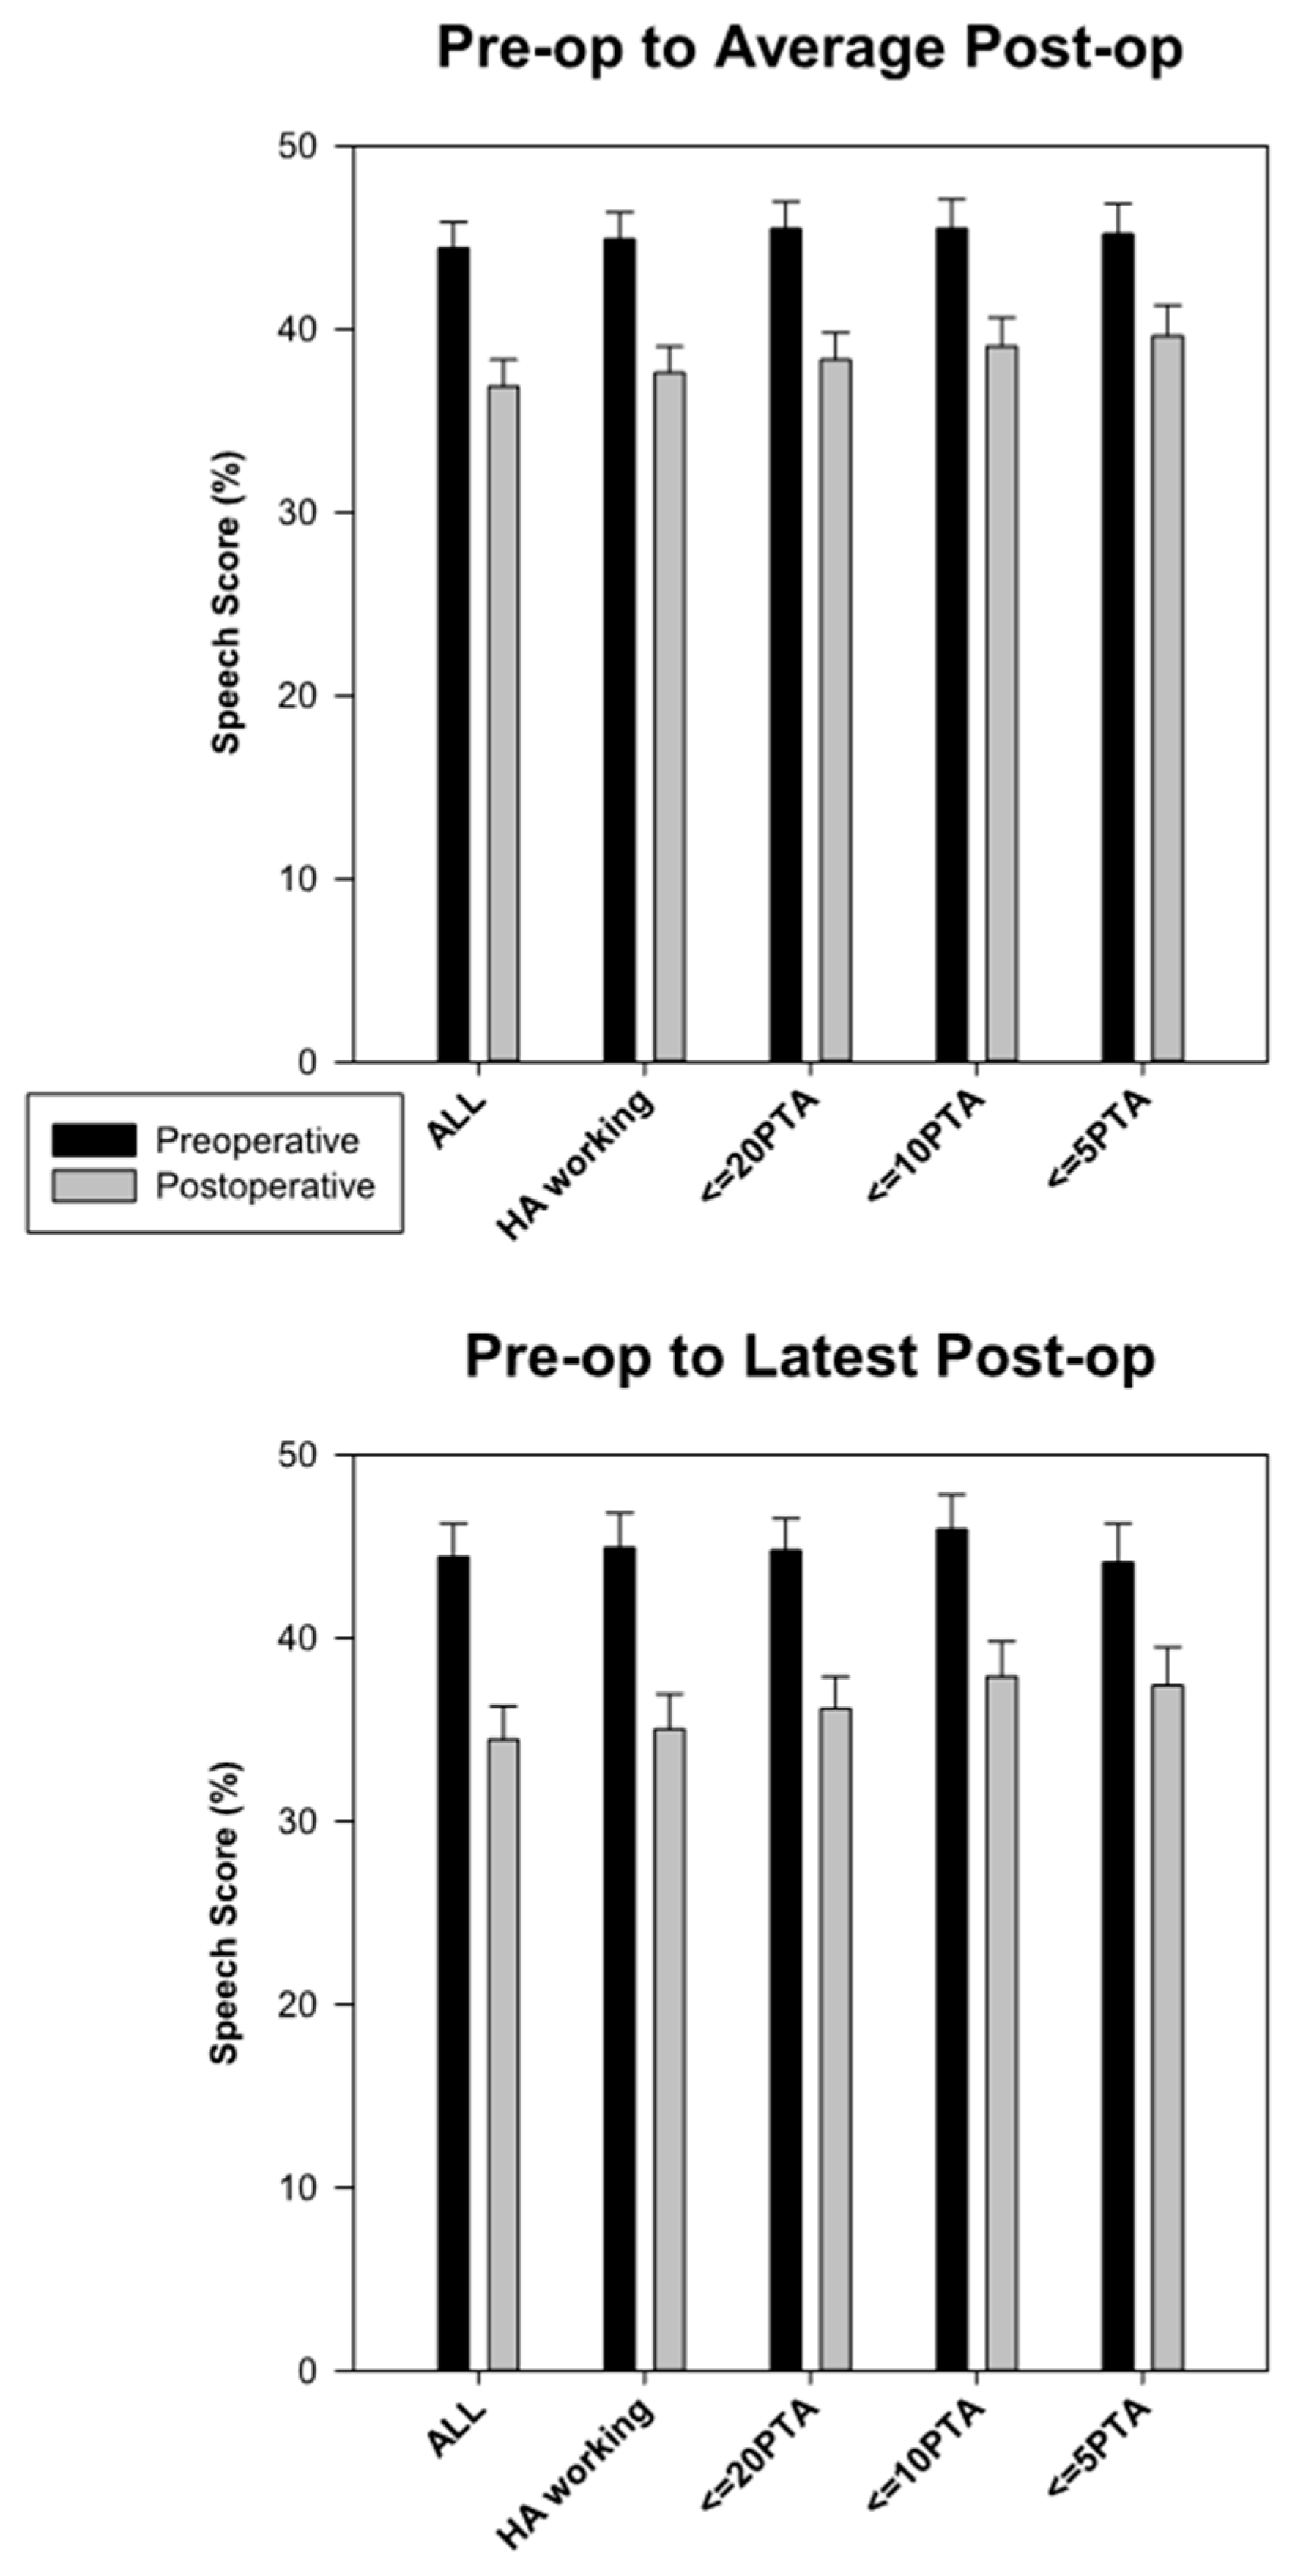
| All subjects | 132 | 44.42 | 36.89 | −7.53 | <0.001 | 132 | 44.42 | 34.46 | −9.96 | <0.001 |
| HA working | 122 | 44.92 | 37.62 | −7.30 | <0.001 | 122 | 44.92 | 35.03 | −9.89 | <0.001 |
| < = 20 PTA | 120 | 45.48 | 38.34 | −7.15 | <0.001 | 118 | 44.77 | 36.14 | −8.63 | <0.001 |
| < = 10 PTA | 107 | 45.51 | 39.08 | −6.44 | <0.001 | 104 | 45.90 | 37.91 | −7.99 | <0.001 |
| < = 5 PTA | 91 | 45.20 | 39.65 | −5.55 | 0.00129 | 85 | 44.13 | 37.41 | −6.72 | 0.00195 |
© 2020 by the authors. Licensee MDPI, Basel, Switzerland. This article is an open access article distributed under the terms and conditions of the Creative Commons Attribution (CC BY) license (http://creativecommons.org/licenses/by/4.0/).
Share and Cite
Svirsky, M.A.; Neuman, A.C.; Neukam, J.D.; Lavender, A.; Miller, M.K.; Aaron, K.A.; Skarzynski, P.H.; Cywka, K.B.; Skarzynski, H.; Truy, E.; et al. Speech Perception Changes in the Acoustically Aided, Nonimplanted Ear after Cochlear Implantation: A Multicenter Study. J. Clin. Med. 2020, 9, 1758. https://doi.org/10.3390/jcm9061758
Svirsky MA, Neuman AC, Neukam JD, Lavender A, Miller MK, Aaron KA, Skarzynski PH, Cywka KB, Skarzynski H, Truy E, et al. Speech Perception Changes in the Acoustically Aided, Nonimplanted Ear after Cochlear Implantation: A Multicenter Study. Journal of Clinical Medicine. 2020; 9(6):1758. https://doi.org/10.3390/jcm9061758
Chicago/Turabian StyleSvirsky, Mario A., Arlene C. Neuman, Jonathan D. Neukam, Annette Lavender, Margaret K. Miller, Ksenia A. Aaron, Piotr H. Skarzynski, Katarzyna B. Cywka, Henryk Skarzynski, Eric Truy, and et al. 2020. "Speech Perception Changes in the Acoustically Aided, Nonimplanted Ear after Cochlear Implantation: A Multicenter Study" Journal of Clinical Medicine 9, no. 6: 1758. https://doi.org/10.3390/jcm9061758