Adverse Drug Reactions in the Emergency Department: Is There a Role for Pharmacogenomic Profiles at Risk?—Results from the ADRED Study

 , , , , ,
Abstract
:1. Introduction
1.1. Study Population
1.2. Data Collection
1.3. Laboratory Methods and Assessment of Metabolic Profiles
1.4. Statistical Analysis
2. Results
3. Discussion
4. Conclusions
Supplementary Materials
Author Contributions
Funding
Conflicts of Interest
References
- Schurig, A.M.; Bohme, M.; Just, K.S.; Scholl, C.; Dormann, H.; Plank-Kiegele, B.; Seufferlein, T.; Graff, I.; Schwab, M.; Stingl, J.C. Adverse Drug Reactions (ADR) and Emergencies. Deutsches Arzteblatt Int. 2018, 115, 251–258. [Google Scholar] [CrossRef] [PubMed] [Green Version]
- Pirmohamed, M.; James, S.; Meakin, S.; Green, C.; Scott, A.K.; Walley, T.J.; Farrar, K.; Park, B.K.; Breckenridge, A.M. Adverse drug reactions as cause of admission to hospital: Prospective analysis of 18 820 patients. BMJ 2004, 329, 15–19. [Google Scholar] [CrossRef] [PubMed] [Green Version]
- Lazarou, J.; Pomeranz, B.H.; Corey, P.N. Incidence of adverse drug reactions in hospitalized patients: A meta-analysis of prospective studies. JAMA 1998, 279, 1200–1205. [Google Scholar] [CrossRef] [PubMed]
- Just, K.S.; Dormann, H.; Schurig, M.; Bohme, M.; Steffens, M.; Plank-Kiegele, B.; Ettrich, K.; Seufferlein, T.; Graff, I.; Igel, S.; et al. The phenotype of adverse drug effects: Do emergency visits due to adverse drug reactions look different in older people?—Results from the ADRED study. Br. J. Clin. Pharmacol. 2020. [Google Scholar] [CrossRef]
- Edwards, I.R.; Aronson, J.K. Adverse drug reactions: Definitions, diagnosis, and management. Lancet 2000, 356, 1255–1259. [Google Scholar] [CrossRef]
- Evans, W.E.; Relling, M.V. Pharmacogenomics: Translating functional genomics into rational therapeutics. Science 1999, 286, 487–491. [Google Scholar] [CrossRef] [Green Version]
- Hamburg, M.A.; Collins, F.S. The path to personalized medicine. N. Engl. J. Med. 2010, 363, 301–304. [Google Scholar] [CrossRef]
- Plumpton, C.O.; Roberts, D.; Pirmohamed, M.; Hughes, D.A. A systematic review of economic evaluations of pharmacogenetic testing for prevention of adverse drug reactions. Pharmacoeconomics 2016, 34, 771–793. [Google Scholar] [CrossRef]
- Phillips, K.A.; Veenstra, D.L.; Oren, E.; Lee, J.K.; Sadee, W. Potential role of pharmacogenomics in reducing adverse drug reactions: A systematic review. JAMA 2001, 286, 2270–2279. [Google Scholar] [CrossRef]
- Stingl, J.; Brockmöller, J.; Viviani, R. Genetic variability of drug-metabolizing enzymes: The dual impact on psychiatric therapy and regulation of brain function. Mol. Psychiatry 2013, 18, 273–287. [Google Scholar] [CrossRef]
- Just, K.S.; Dormann, H.; Böhme, M.; Schurig, M.; Schneider, K.L.; Steffens, M.; Dunow, S.; Plank-Kiegele, B.; Ettrich, K.; Seufferlein, T.; et al. Personalising drug safety—Results from the multi-centre prospective observational study on Adverse Drug Reactions in Emergency Departments (ADRED). Eur. J. Clin. Pharmacol. 2020, 76, 439–448. [Google Scholar] [CrossRef] [PubMed]
- Eichelbaum, M.; Ingelman-Sundberg, M.; Evans, W.E. Pharmacogenomics and individualized drug therapy. Annu. Rev. Med. 2006, 57, 119–137. [Google Scholar] [CrossRef] [PubMed]
- Leckband, S.; Kelsoe, J.; Dunnenberger, H.; George, A.; Tran, E.; Berger, R.; Müller, D.; Whirl-Carrillo, M.; Caudle, K.; Pirmohamed, M. Clinical Pharmacogenetics Implementation Consortium guidelines for HLA-B genotype and carbamazepine dosing. Clin. Pharmacol. Ther. 2013, 94, 324–328. [Google Scholar] [CrossRef] [PubMed] [Green Version]
- Martin, M.; Klein, T.; Dong, B.; Pirmohamed, M.; Haas, D.; Kroetz, D. Clinical pharmacogenetics implementation consortium guidelines for HLA-B genotype and abacavir dosing. Clin. Pharmacol. Ther. 2012, 91, 734–738. [Google Scholar] [CrossRef] [PubMed]
- Elliott, L.S.; Henderson, J.C.; Neradilek, M.B.; Moyer, N.A.; Ashcraft, K.C.; Thirumaran, R.K. Clinical impact of pharmacogenetic profiling with a clinical decision support tool in polypharmacy home health patients: A prospective pilot randomized controlled trial. PLoS ONE 2017, 12, e0170905. [Google Scholar] [CrossRef] [PubMed] [Green Version]
- Johnson, J.A.; Caudle, K.E.; Gong, L.; Whirl-Carrillo, M.; Stein, C.M.; Scott, S.A.; Lee, M.T.; Gage, B.F.; Kimmel, S.E.; Perera, M.A.; et al. Clinical Pharmacogenetics Implementation Consortium (CPIC) Guideline for Pharmacogenetics-Guided Warfarin Dosing: 2017 Update. Clin. Pharmacol. Ther. 2017, 102, 397–404. [Google Scholar] [CrossRef] [Green Version]
- Crews, K.R.; Gaedigk, A.; Dunnenberger, H.M.; Leeder, J.S.; Klein, T.E.; Caudle, K.E.; Haidar, C.E.; Shen, D.D.; Callaghan, J.T.; Sadhasivam, S.; et al. Clinical Pharmacogenetics Implementation Consortium guidelines for cytochrome P450 2D6 genotype and codeine therapy: 2014 update. Clin. Pharmacol. Ther. 2014, 95, 376–382. [Google Scholar] [CrossRef] [Green Version]
- Van der Wouden, C.H.; Bohringer, S.; Cecchin, E.; Cheung, K.C.; Davila-Fajardo, C.L.; Deneer, V.H.M.; Dolzan, V.; Ingelman-Sundberg, M.; Jonsson, S.; Karlsson, M.O.; et al. Generating evidence for precision medicine: Considerations made by the Ubiquitous Pharmacogenomics Consortium when designing and operationalizing the PREPARE study. Pharmacogenet. Genom. 2020. [Google Scholar] [CrossRef]
- Wood, K. The medical dictionary for drug regulatory affairs (MEDDRA) project. Pharmacoepidemiol. Drug Saf. 1994, 3, 7–13. [Google Scholar] [CrossRef]
- WHO. International Classification of Diseases, Version 10. Available online: http://www.who.int/classifications/icd/icd10updates/en/ (accessed on 14 September 2019).
- Matsushita, K.; Mahmoodi, B.K.; Woodward, M.; Emberson, J.R.; Jafar, T.H.; Jee, S.H.; Polkinghorne, K.R.; Shankar, A.; Smith, D.H.; Tonelli, M. Comparison of risk prediction using the CKD-EPI equation and the MDRD study equation for estimated glomerular filtration rate. JAMA 2012, 307, 1941–1951. [Google Scholar] [CrossRef] [Green Version]
- Caudle, K.E.; Sangkuhl, K.; Whirl-Carrillo, M.; Swen, J.J.; Haidar, C.E.; Klein, T.E.; Gammal, R.S.; Relling, M.V.; Scott, S.A.; Hertz, D.L.; et al. Standardizing CYP2D6 Genotype to Phenotype Translation: Consensus Recommendations from the Clinical Pharmacogenetics Implementation Consortium and Dutch Pharmacogenetics Working Group. Clin. Transl. Sci. 2020, 13, 116–124. [Google Scholar] [CrossRef] [PubMed] [Green Version]
- PharmGKB. PGx Gene-specific Information Tables. Available online: https://www.pharmgkb.org/page/pgxGeneRef (accessed on 6 April 2020).
- GraphPad. QuickCalcs—Compare Observed and Expected Frequencies. Available online: https://www.graphpad.com/quickcalcs/chisquared1.cfm (accessed on 6 April 2020).
- Whirl-Carrillo, M.; McDonagh, E.M.; Hebert, J.; Gong, L.; Sangkuhl, K.; Thorn, C.; Altman, R.B.; Klein, T.E. Pharmacogenomics knowledge for personalized medicine. Clin. Pharmacol. Ther. 2012, 92, 414–417. [Google Scholar] [CrossRef] [PubMed]
- FDA. Drug Development and Drug Interactions: Table of Substrates, Inhibitors, and Inducers. Available online: https://www.fda.gov/drugs/drug-interactions-labeling/drug-development-and-drug-interactions-table-substrates-inhibitors-and-inducers (accessed on 3 June 2020).
- Kazui, M.; Nishiya, Y.; Ishizuka, T.; Hagihara, K.; Farid, N.A.; Okazaki, O.; Ikeda, T.; Kurihara, A. Identification of the human cytochrome P450 enzymes involved in the two oxidative steps in the bioactivation of clopidogrel to its pharmacologically active metabolite. Drug Metab. Dispos. 2010, 38, 92–99. [Google Scholar] [CrossRef] [PubMed] [Green Version]
- Sibbing, D.; Koch, W.; Gebhard, D.; Schuster, T.; Braun, S.; Stegherr, J.; Morath, T.; Schomig, A.; von Beckerath, N.; Kastrati, A. Cytochrome 2C19*17 allelic variant, platelet aggregation, bleeding events, and stent thrombosis in clopidogrel-treated patients with coronary stent placement. Circulation 2010, 121, 512–518. [Google Scholar] [CrossRef] [Green Version]
- Campo, G.; Parrinello, G.; Ferraresi, P.; Lunghi, B.; Tebaldi, M.; Miccoli, M.; Marchesini, J.; Bernardi, F.; Ferrari, R.; Valgimigli, M. Prospective evaluation of on-clopidogrel platelet reactivity over time in patients treated with percutaneous coronary intervention relationship with gene polymorphisms and clinical outcome. J. Am. Coll. Cardiol. 2011, 57, 2474–2483. [Google Scholar] [CrossRef] [Green Version]
- Halvorsen, S.; Storey, R.F.; Rocca, B.; Sibbing, D.; Ten Berg, J.; Grove, E.L.; Weiss, T.W.; Collet, J.P.; Andreotti, F.; Gulba, D.C.; et al. Management of antithrombotic therapy after bleeding in patients with coronary artery disease and/or atrial fibrillation: Expert consensus paper of the European Society of Cardiology Working Group on Thrombosis. Eur. Heart J. 2017, 38, 1455–1462. [Google Scholar] [CrossRef] [Green Version]
- Park, D.W.; Park, S.W.; Park, K.H.; Lee, B.K.; Kim, Y.H.; Lee, C.W.; Hong, M.K.; Kim, J.J.; Park, S.J. Frequency of and risk factors for stent thrombosis after drug-eluting stent implantation during long-term follow-up. Am. J. Cardiol. 2006, 98, 352–356. [Google Scholar] [CrossRef]
- Van Werkum, J.W.; Heestermans, A.A.; Zomer, A.C.; Kelder, J.C.; Suttorp, M.J.; Rensing, B.J.; Koolen, J.J.; Brueren, B.R.; Dambrink, J.H.; Hautvast, R.W.; et al. Predictors of coronary stent thrombosis: The Dutch Stent Thrombosis Registry. J. Am. Coll. Cardiol. 2009, 53, 1399–1409. [Google Scholar] [CrossRef]
- Chan, F.K.; Ching, J.Y.; Hung, L.C.; Wong, V.W.; Leung, V.K.; Kung, N.N.; Hui, A.J.; Wu, J.C.; Leung, W.K.; Lee, V.W.; et al. Clopidogrel versus aspirin and esomeprazole to prevent recurrent ulcer bleeding. N. Engl. J. Med. 2005, 352, 238–244. [Google Scholar] [CrossRef] [Green Version]
- Lemesle, G.; Schurtz, G.; Meurice, T.; Tricot, O.; Lemaire, N.; Caudmont, S.; Philias, A.; Ketelers, R.; Lamblin, N.; Bauters, C. Clopidogrel Use as Single Antiplatelet Therapy in Outpatients with Stable Coronary Artery Disease: Prevalence, Correlates and Association with Prognosis (from the CORONOR Study). Cardiology 2016, 134, 11–18. [Google Scholar] [CrossRef]
- Swen, J.J.; Nijenhuis, M.; de Boer, A.; Grandia, L.; Maitland-van der Zee, A.H.; Mulder, H.; Rongen, G.A.; van Schaik, R.H.; Schalekamp, T.; Touw, D.J.; et al. Pharmacogenetics: From bench to byte—An update of guidelines. Clin. Pharmacol. Ther. 2011, 89, 662–673. [Google Scholar] [CrossRef] [PubMed]
- Shah, R.R.; Smith, R.L. Addressing phenoconversion: The Achilles’ heel of personalized medicine. Br. J. Clin. Pharmacol. 2015, 79, 222–240. [Google Scholar] [CrossRef] [PubMed] [Green Version]
- Schwabe, U.; Paffrath, D.; Ludwig, W.; Klauber, J. (Eds.) Arzneiverordnungs-Report 2017; Springer: Berlin/Heidelberg, Germany, 2017; p. 843. [Google Scholar]
- Kirchheiner, J.; Ufer, M.; Walter, E.C.; Kammerer, B.; Kahlich, R.; Meisel, C.; Schwab, M.; Gleiter, C.H.; Rane, A.; Roots, I.; et al. Effects of CYP2C9 polymorphisms on the pharmacokinetics of R- and S-phenprocoumon in healthy volunteers. Pharmacogenetics 2004, 14, 19–26. [Google Scholar] [CrossRef] [PubMed]
- Reitsma, P.H.; van der Heijden, J.F.; Groot, A.P.; Rosendaal, F.R.; Buller, H.R. A C1173T dimorphism in the VKORC1 gene determines coumarin sensitivity and bleeding risk. PLoS Med. 2005, 2, e312. [Google Scholar] [CrossRef] [Green Version]
- Schneider, K.L.; Kunst, M.; Leuchs, A.K.; Bohme, M.; Weckbecker, K.; Kastenmuller, K.; Bleckwenn, M.; Holdenrieder, S.; Coch, C.; Hartmann, G.; et al. Phenprocoumon Dose Requirements, Dose Stability and Time in Therapeutic Range in Elderly Patients with CYP2C9 and VKORC1 Polymorphisms. Front. Pharmacol. 2019, 10, 1620. [Google Scholar] [CrossRef] [Green Version]
- Misasi, S.; Martini, G.; Paoletti, O.; Calza, S.; Scovoli, G.; Marengoni, A.; Testa, S.; Caimi, L.; Marchina, E. VKORC1 and CYP2C9 polymorphisms related to adverse events in case-control cohort of anticoagulated patients. Medicine 2016, 95, e5451. [Google Scholar] [CrossRef] [Green Version]
- Bryk, A.H.; Wypasek, E.; Plens, K.; Awsiuk, M.; Undas, A. Bleeding predictors in patients following venous thromboembolism treated with vitamin K antagonists: Association with increased number of single nucleotide polymorphisms. Vascul. Pharmacol. 2018, 106, 22–27. [Google Scholar] [CrossRef]
- Sridharan, K.; Modi, T.; Bendkhale, S.; Kulkarni, D.; Gogtay, N.J.; Thatte, U.M. Association of Genetic Polymorphisms of CYP2C9 and VKORC1 with Bleeding Following Warfarin: A Case-Control Study. Curr. Clin. Pharmacol. 2016, 11, 62–68. [Google Scholar] [CrossRef]
- Leporini, C.; De Sarro, G.; Russo, E. Adherence to therapy and adverse drug reactions: Is there a link? Expert Opin. Drug Saf. 2014, 13, 41–55. [Google Scholar] [CrossRef]
- Budnitz, D.S.; Lovegrove, M.C.; Shehab, N.; Richards, C.L. Emergency hospitalizations for adverse drug events in older Americans. N. Engl. J. Med. 2011, 365, 2002–2012. [Google Scholar] [CrossRef]
- LLerena, A.; Naranjo, M.E.; Rodrigues-Soares, F.; Penas, L.E.M.; Fariñas, H.; Tarazona-Santos, E. Interethnic variability of CYP2D6 alleles and of predicted and measured metabolic phenotypes across world populations. Expert Opin. Drug Metab. Toxicol. 2014, 10, 1569–1583. [Google Scholar] [CrossRef] [PubMed]
- Dahl, M.L.; Johansson, I.; Bertilsson, L.; Ingelman-Sundberg, M.; Sjöqvist, F. Ultrarapid hydroxylation of debrisoquine in a Swedish population. Analysis of the molecular genetic basis. J. Pharmacol. Exp. Ther. 1995, 274, 516–520. [Google Scholar] [PubMed]
- Sachse, C.; Brockmöller, J.; Bauer, S.; Roots, I. Cytochrome P450 2D6 variants in a Caucasian population: Allele frequencies and phenotypic consequences. Am. J. Hum. Genet. 1997, 60, 284–295. [Google Scholar]
- Bathum, L.; Johansson, I.; Ingelman-Sundberg, M.; Hørder, M.; Brøsen, K. Ultrarapid metabolism of sparteine: Frequency of alleles with duplicated CYP2D6 genes in a Danish population as determined by restriction fragment length polymorphism and long polymerase chain reaction. Pharmacogenetics 1998, 8, 119–123. [Google Scholar] [CrossRef]
- Løvlie, R.; Daly, A.K.; Matre, G.E.; Molven, A.; Steen, V.M. Polymorphisms in CYP2D6 duplication-negative individuals with the ultrarapid metabolizer phenotype: A role for the CYP2D6*35 allele in ultrarapid metabolism? Pharmacogenetics 2001, 11, 45–55. [Google Scholar] [CrossRef]
- Gaedigk, A.; Simon, S.D.; Pearce, R.E.; Bradford, L.D.; Kennedy, M.J.; Leeder, J.S. The CYP2D6 activity score: Translating genotype information into a qualitative measure of phenotype. Clin. Pharmacol. Ther. 2008, 83, 234–242. [Google Scholar] [CrossRef] [PubMed]
- Zanger, U.M.; Raimundo, S.; Eichelbaum, M. Cytochrome P450 2D6: Overview and update on pharmacology, genetics, biochemistry. Naunyn. Schmiedebergs Arch. Pharmacol. 2004, 369, 23–37. [Google Scholar] [CrossRef]
- Zanger, U.M.; Schwab, M. Cytochrome P450 enzymes in drug metabolism: Regulation of gene expression, enzyme activities, and impact of genetic variation. Pharmacol. Ther. 2013, 138, 103–141. [Google Scholar] [CrossRef]
- Meyer, U.A. Pharmacogenetics and adverse drug reactions. Lancet 2000, 356, 1667–1671. [Google Scholar] [CrossRef]


| Missing (n) | Cases, n = 776 | |
|---|---|---|
| Age (Years) | - | 70 (56; 79) |
| Sex (Male) | - | 445 (57.3%) |
| Ethnicity (Caucasian) | 20 (2.6%) | 752 (96.9%) |
| Drugs taken (Number) | - | 8 (5; 11) |
| Drugs Suspected | - | 1 (1; 2) |
| Comorbidities (Number) | - | 6 (4; 10) |
| GFR (mL/min/1.73 m2) | 356 (45.9%) | 66.4 (44.1; 89.2) |
| Hospitalized | - | 746 (96.1%) |
| Length of Stay (Days) | 30 (3.9%) | 7 (4; 10) |
| Triage in the ED | 7 (0.9%) | |
| Red | 104 (13.4%) | |
| Orange | 300 (38.7%) | |
| Yellow | 290 (37.4%) | |
| Green/Blue | 75 (9.7%) | |
| Admission diagnoses (Number) | - | 2 (1; 2) |
| K92 | 134 (17.3%) | |
| N17 | 62 (8.0%) | |
| E87 | 53 (6.8%) | |
| D62 | 57 (7.3%) | |
| R55 | 43 (5.5%) | |
| Symptoms (PT, Number) | - | 3 (2; 5) |
| General Physical Health Deterioration | 178 (22.9%) | |
| Dyspnea | 144 (18.6%) | |
| Dizziness | 123 (15.9%) | |
| Nausea | 111 (14.3%) | |
| Blood Stool | 110 (14.2%) | |
| Seriousness on ED Arrival | - | |
| Non serious harm | 33 (4.3%) | |
| Hospitalization required | 669 (86.2%) | |
| Life-threatening | 74 (9.5%) | |
| Condition at Discharge | 14 (1.8%) | |
| Recovered | 38 (4.9%) | |
| Not Recovered | 65 (8.4%) | |
| Condition Improved | 638 (82.2%) | |
| Persistent Harm | 3 (0.4%) | |
| Death | 18 (2.3%) | |
| CYP2D6 Phenotype | 36 (4.6%) | |
| UM | 25 (3.2%) | |
| NM | 394 (50.8%) | |
| IM | 272 (35.1%) | |
| PM | 49 (6.3%) | |
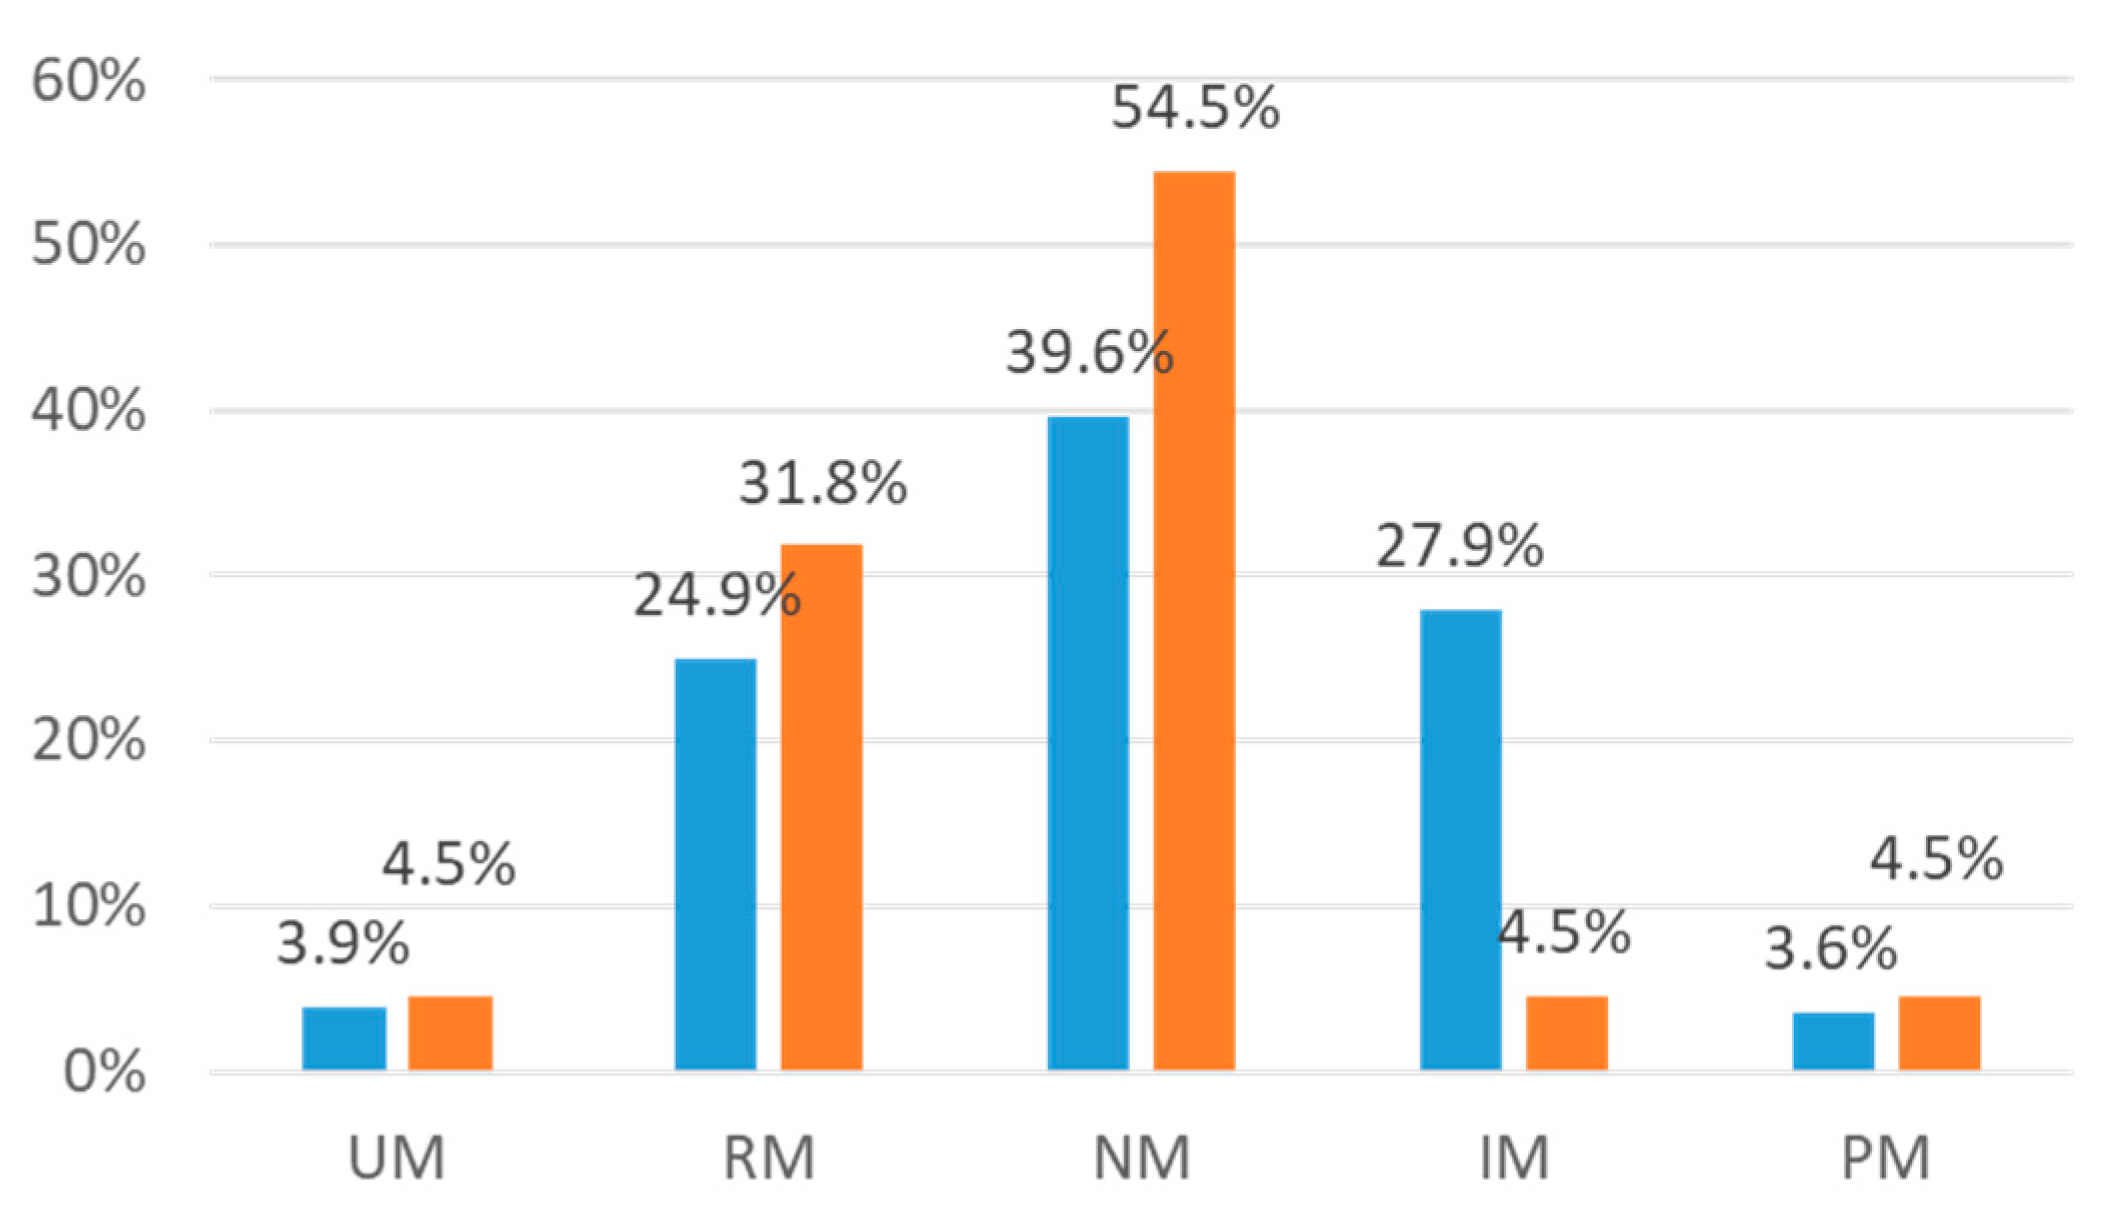
| CYP2C19 Phenotype | 18 (2.3%) | |
| UM | 30 (3.9%) | |
| RM | 192 (24.7%) | |
| NM | 307 (39.6%) | |
| IM | 201 (25.9%) | |
| PM | 28 (3.6%) | |
| CYP2C9 Phenotype | 14 (1.8%) | |
| NM | 496 (63.9%) | |
| IM | 239 (30.8%) | |
| PM | 27 (3.5%) | |
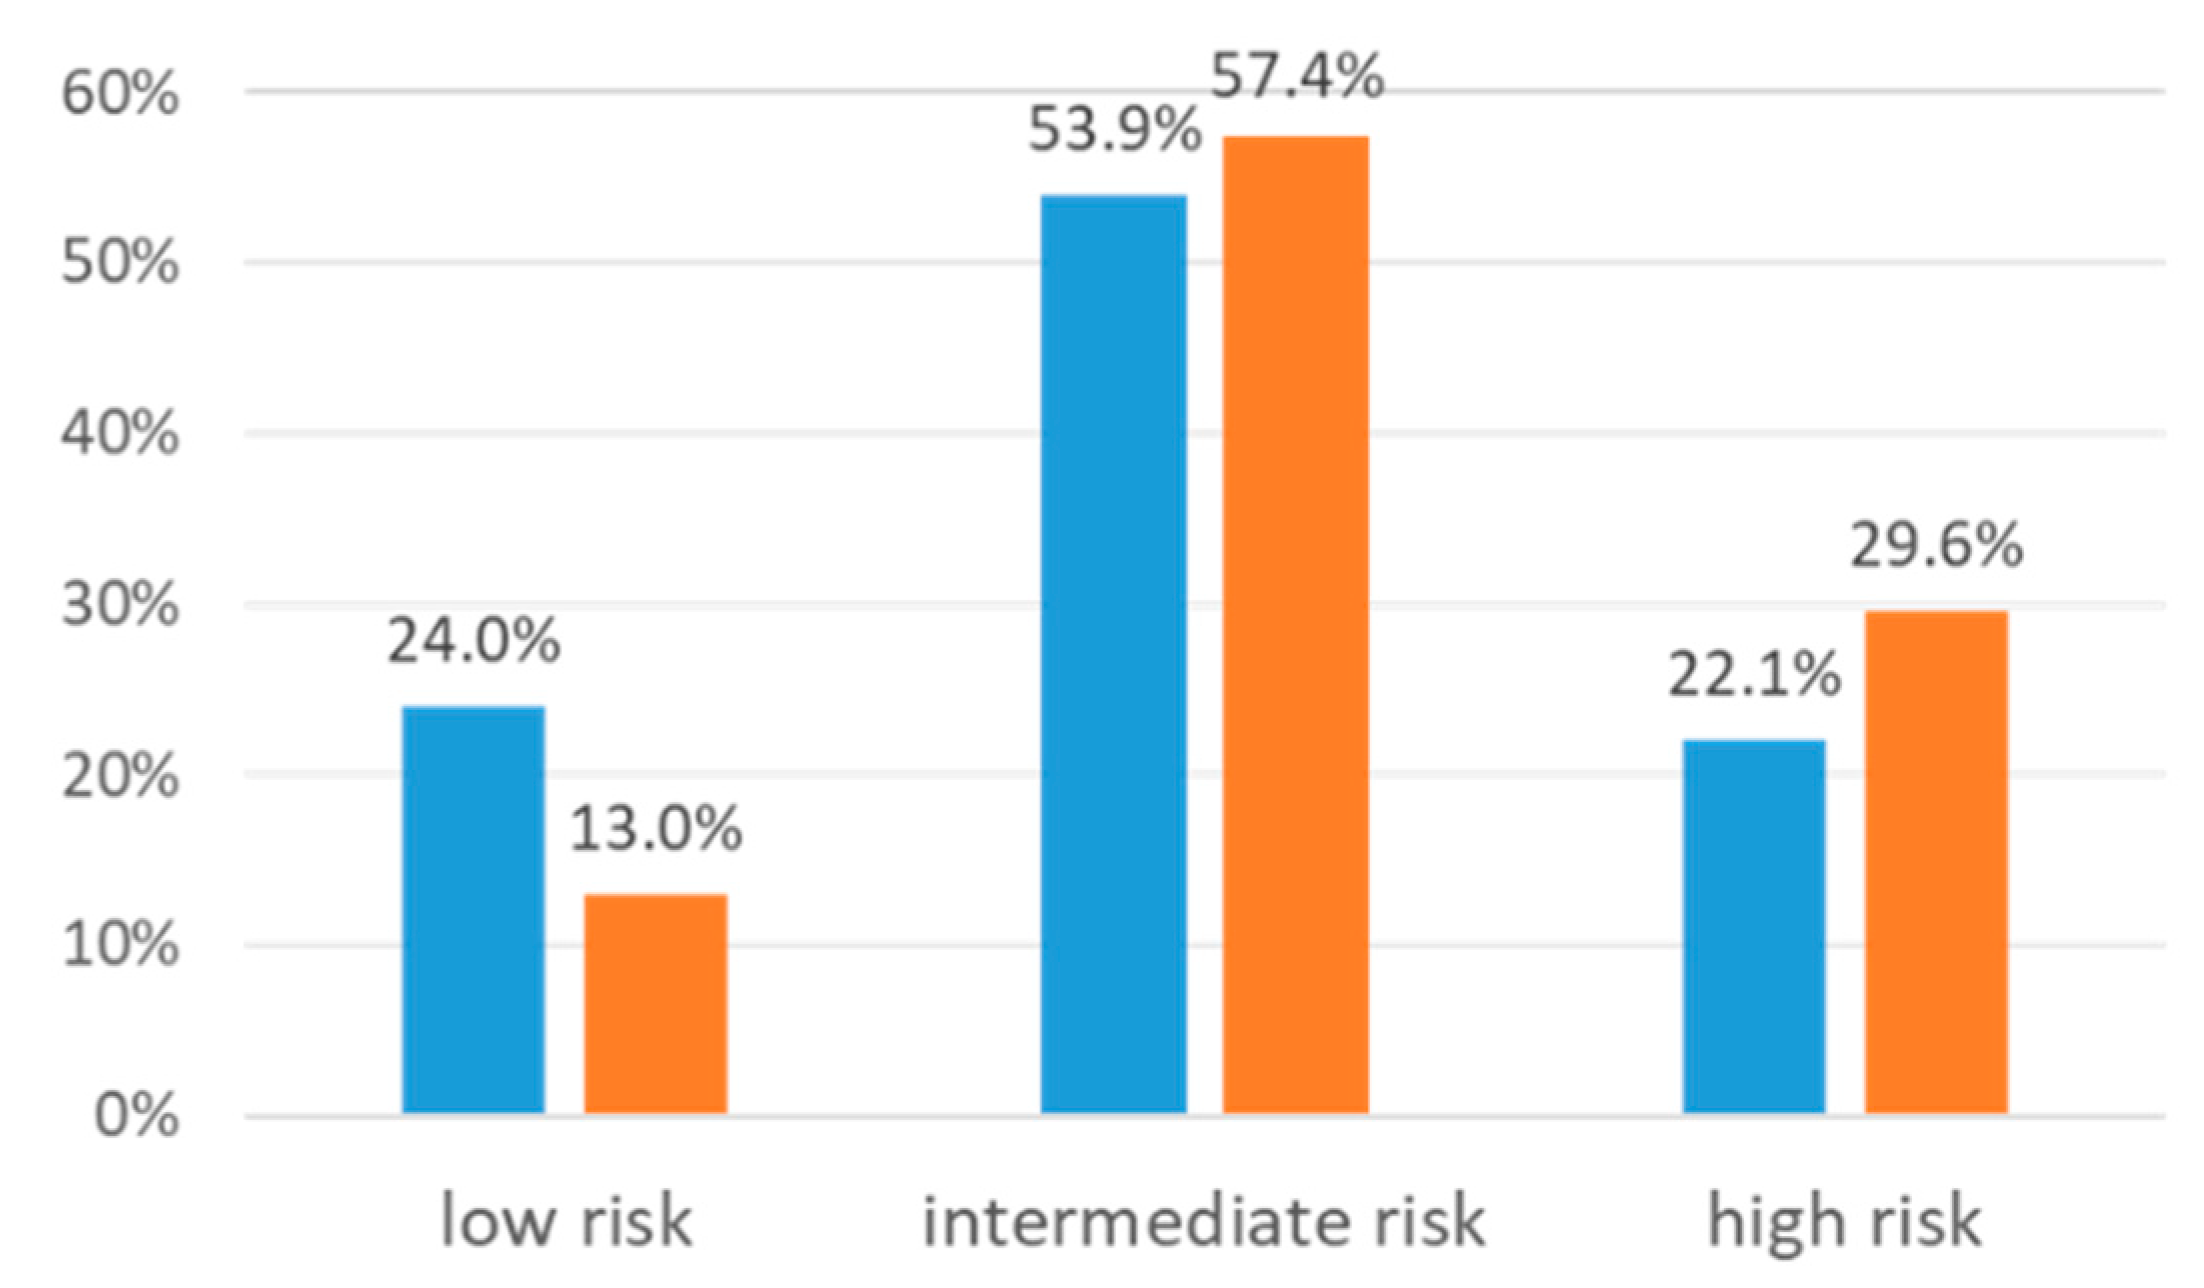
| VKORC1 Phenotype | 51 (6.6%) | |
| NC | 259 (33.4%) | |
| IC | 342 (44.1%) | |
| PC | 124 (16.0%) |
| Drug | Frequency Suspected, n (%) | Admission Diagnosis, n (%) | Symptom, n (%) |
|---|---|---|---|
| Acetylsalicylic Acid | 96 (12.4) | K92, 60 (62.5) | Blood stool, 48 (50.0) |
| Phenprocoumon | 60 (7.7) | K92, 21 (35.0) | Blood stool, 19 (31.7) |
| Prednisolone | 53 (6.8) | K92, 8 (15.1) | Fever, 14 (26.4) |
| Clopidogrel | 45 (5.8) | K92, 27 (60.0) | Blood stool, 23 (51.1) |
| Rivaroxaban | 45 (5.8) | K92, 21 (46.7) | Blood stool, 17 (37.8) |
| Metoprolol | 40 (4.1) | R55, 12 (30.0) | Dizziness, 16 (40.0) |
| Ibuprofen | 38 (4.9) | K92, 10 (26.3) | Nausea, 9 (23.7) |
| Bisoprolol | 32 (4.1) | I48, 9 (28.1) | Bradycardia, 9 (28.1) |
| Torasemide | 30 (3.9) | E87, 12 (40.0) | Dizziness, 10 (33.3) |
| Apixaban | 30 (3.9) | K92, 22 (73.3) | Blood stool, 16 (53.3) |
| Age-Sex Adjusted OR (95% CI) 1 | Multi-Adjusted OR (95% CI) 2 | |
|---|---|---|
| CYP2C19sum (NM, RM, UM) | 4.85 (1.70–13.87) | 4.97 (1.73–14.27) |
| Age (Years) | 1.05 (1.02–1.08) | 1.05 (1.02–1.08) |
| Sex (Male) | 1.05 (0.55–2.00) | 1.13 (0.59–2.16) |
| Comorbidities (Number) | - | 1.05 (0.98–1.12) |
| Drugs taken (Number) | - | 1.06 (0.98–1.15) |
| Age-Sex Adjusted OR (95% CI) 1 | Multi-Adjusted OR (95% CI) 2 | |
|---|---|---|
| Anticoagulant Activitysum (Intermediate/High Risk) | 1.90 (0.83–4.33) | 1.90 (0.83–4.34) |
| Age (Years) | 1.03(1.01–1.05) | 1.03 (1.01–1.05) |
| Sex (Male) | 0.71 (0.39–1.31) | 0.71 (0.39–1.32) |
| Comorbidities (Number) | - | 1.00 (0.92–1.08) |
| Drugs Taken (Number) | - | 1.00 (0.93–1.08) |
© 2020 by the authors. Licensee MDPI, Basel, Switzerland. This article is an open access article distributed under the terms and conditions of the Creative Commons Attribution (CC BY) license (http://creativecommons.org/licenses/by/4.0/).
Share and Cite
Just, K.S.; Dormann, H.; Schurig, M.; Böhme, M.; Fracowiak, J.; Steffens, M.; Scholl, C.; Seufferlein, T.; Gräff, I.; Schwab, M.; et al. Adverse Drug Reactions in the Emergency Department: Is There a Role for Pharmacogenomic Profiles at Risk?—Results from the ADRED Study. J. Clin. Med. 2020, 9, 1801. https://doi.org/10.3390/jcm9061801
Just KS, Dormann H, Schurig M, Böhme M, Fracowiak J, Steffens M, Scholl C, Seufferlein T, Gräff I, Schwab M, et al. Adverse Drug Reactions in the Emergency Department: Is There a Role for Pharmacogenomic Profiles at Risk?—Results from the ADRED Study. Journal of Clinical Medicine. 2020; 9(6):1801. https://doi.org/10.3390/jcm9061801
Chicago/Turabian StyleJust, Katja S., Harald Dormann, Marlen Schurig, Miriam Böhme, Jochen Fracowiak, Michael Steffens, Catharina Scholl, Thomas Seufferlein, Ingo Gräff, Matthias Schwab, and et al. 2020. "Adverse Drug Reactions in the Emergency Department: Is There a Role for Pharmacogenomic Profiles at Risk?—Results from the ADRED Study" Journal of Clinical Medicine 9, no. 6: 1801. https://doi.org/10.3390/jcm9061801